Abstract
Ultrasound localization microscopy can image microvasculature in vivo without sacrificing imaging penetration depth. However, the reliance on super-resolution inference limits the applicability of the technique as subpixel tissue motion can corrupt microvascular reconstruction. Consequently, the majority of previous pre-clinical research on this super-resolution procedure has been restricted to low motion experimental models with ample motion correction and/or data rejection, which precludes the imaging of organ sites with that exhibit a high degree of respiratory and other motion. In this paper, we present a novel anesthesia protocol in rabbits that induces safe controllable periods of apnea to enable the long imaging acquisition times required for ultrasound localization microscopy. We apply this protocol to a VX2 liver tumor model undergoing sorafenib therapy and compare the results to super-resolution images from a conventional high-dose isoflurane anesthesia. We found that the apneic protocol was necessary to correctly identify the poorly vascularized tumor cores, as verified by immunohistochemistry, and to reveal the tumoral microvascular architecture.
Keywords: Super-resolution, contrast agents, microbubbles, microvessels, cancer, liver, animal model, ultrasound localization microscopy, rabbit, VX2
Introduction
Ultrasound localization microscopy (ULM) is an emerging microvascular imaging technique that can non-invasively image capillary-scale microvessels in vivo at clinically relevant penetration depths (Errico et al. 2015). The core principle of ULM involves the identification and tracking of intravascular microbubbles, localized at a sub-diffraction resolution, culminating in microvascular trajectory maps and microbubble velocity estimates (Couture et al. 2018). Notably, this technology retains the original imaging penetration depth while improving the spatial resolution of detected vasculature by approximately ten-fold (Desailly et al. 2015). This is particularly enticing for applications of disease monitoring and therapy evaluation where the main pathophysiological feature(s) of interest are the microvasculature, such as in pathological neo-angiogenesis and anti-angiogenic intervention. However, the reliance on super-resolution inference also introduces a substantial limitation into the technique, as even subpixel-scale tissue motion can corrupt microvascular reconstruction (Harput et al. 2018; Hingot et al. 2017). This is further compounded by the need for long imaging acquisition times to ensure that there is adequate microbubble perfusion through much of the microvasculature (Christensen-Jeffries et al. 2019; Hingot et al. 2019; Lowerison et al. 2020a) – which is a particularly problematic issue for animal models with difficult-to-control breathing patterns. Hingot et al. (2019) found that a total imaging acquisition duration of 230.4 seconds was necessary to reconstruct 90% of rat brain microvasculature via ULM at a pixel resolution of 5 μm. Christensen-Jeffries et al. (2019) generalized ULM imaging conditions and tissue vasculature via a Poisson statistical model, demonstrating that ULM acquisition times typically require hundreds of seconds of data for image reconstruction. Lowerison et al. (2020a) combined ULM, confocal microscopy, and flow simulations to show that ULM saturation times range from 182 to 319 seconds for the chicken embryo chorioallantoic membrane.
Consequently, the majority of previous research on ULM has relied on low motion experimental models and environments with limited movement. Some seminal examples include rat brain imaging by Errico et al. (2015), where motion was mitigated with the use of a stereotaxic frame, and mouse ear imaging by Christensen-Jeffries et al. (2015) where the ear was held flat against a surface. Respiratory gating, and the exclusion of image frames with a large amount of motion, has also been implemented in mouse tumor imaging by Ackermann and Schmitz (2016) and by Lin et al. (2017), in rat kidney imaging by Foiret et al. (2017), and in rabbit kidney imaging by Song et al. (2018). Several in vivo models and target organs also inherently have low amounts of tissue motion, such as the rabbit lymph nodes imaged by Zhu et al. (2019) and the chorioallantoic membrane of avian embryos, used for ULM imaging by Lowerison et al. (2020b) and Huang et al. (2020a). Many of these pre-clinical examples of ULM have also implemented motion correction to improve image reconstruction, such as those introduced by Hingot et al. (2017) and Harput et al. (2018), further highlighting the stringency on acceptable levels of tissue motion. In clinical examples of ULM, patients may use breath hold to reduce respiratory motion, and there is often a requirement to reject several imaging frames – which necessarily reduces the fidelity of the final image reconstruction. For example, in the clinical pilot study by Dencks et al. (2019), the imaged breast tumors exhibited out-of-plane motion which necessitated dividing the dataset into subsequences. Harput et al. (2018) focused on clinical lower limb imaging, which is less susceptible to respiratory and cardiac motion. Huang et al. (2020b) were able to reconstruct ULM images from different human tissues within a short acquisition time (a single breath-hold of less than 10 seconds) by combining a high frame-rate clinical ultrasound scanner with robust motion registration, microbubble signal separation, and Kalman filter tracking and pairing. The requirement for low tissue motion limits the applicability of the ULM technique, which is unfortunate, given that many diseases with a substantial vascular component present in organs that experience a high degree of respiratory and other motion.
Hepatic ULM is one such example, as liver imaging poses a relatively high challenge given that extensive respiratory and tissue motion confounds microbubble tracking efforts and imaging accumulation time is truncated by limited and poorly controlled breath-hold durations. Hepatocellular carcinoma (HCC) is one of the most common malignant tumors globally (Forner et al. 2018), and current clinical first-line treatments for HCC often involve cytotoxic therapies combined with anti-angiogenic agents (Berretta et al. 2016). One such therapy is sorafenib, a broad spectrum small-molecule tyrokinase inhibitor that has demonstrated anti-tumor and anti-angiogenic potential in both pre-clinical and clinical studies (Kissel et al. 2017; Llovet et al. 2008; Wilhelm et al. 2004). Therefore, accurate and reproducible assessment of hepatic microvasculature is critical for the objective evaluation of various liver disorders, and for the direct monitoring of tumor treatment response. In the preclinical research space, hepatically implanted VX2 tumor fragments in the rabbit is one of the few larger laboratory animal models of liver cancer (Aravalli et al. 2009) and due to its low relative cost has served as a translatable model for imaging and intervention of liver cancer (Parvinian et al. 2014). However, the proximity of the rabbit liver to the diaphragm produces substantial breathing motion during conventional ultrasound imaging sessions. A potential solution to achieve ULM for this difficult, high-motion, animal tumor model is to temporarily increase the anesthesia depth during data acquisition. This may be problematic for most injectable anesthetic protocols, such as ketamine/xylazine combinations, given that there is a delayed onset of anesthesia and an inability to completely reverse, which makes dose titration and accurate depth modulation to non-fatally depress respiration elusive (Gargiulo et al. 2012). Inhalable anesthetics, such as isoflurane, can be more easily adjusted for anesthesia depth to induce short apneic events. However, there is evidence that high-dose isoflurane will substantially reduce blood pressure in rabbits (Barter and Epstein 2014; Tearney et al. 2015), which can decrease the perfusion of microbubbles into the microcirculation and could potentially change the acoustic response of microbubbles in microvasculature, thereby making it more difficult to detect microbubbles in the smallest vessels. Therefore, the motivation of this study was to develop an anesthesia protocol to control breathing in a rabbit VX2 liver tumor model, without reducing blood pressure, to produce long apneic events for hepatic ULM imaging. Our long-term goal is to investigate the effectiveness of using ULM for the early prediction of anti-angiogenic therapy response for liver cancer.
The rest of the paper is structured as follows. In the Materials and Methods section, we introduce the animal model and experimental set-up, anesthesia protocols, and super-resolution processing methods used for ULM imaging of the rabbit VX2 tumor model. In the Results section, we demonstrate the effect of the tumor implantation procedure with representative ULM images of VX2 tumors under two anesthesia protocols. The results are then discussed, and a conclusion drawn, in the Discussion section.
Materials and Methods
Animal model
All animal procedures were performed according to a protocol approved by the University of Illinois at Urbana-Champaign (UIUC) Institutional Animal Care and Use Committee (IACUC protocol # 18193). New Zealand white rabbits were acquired from Charles River (Wilmington, MA, USA) and housed in an Association for Assessment and Accreditation of Laboratory Animal Care approved animal facility and provided food and water ad libitum. The eight rabbits used in this study were all males weighing between 2-2.5 kg at the start of the study.
VX2 fragment preparation
Frozen VX2 tumors (a kind gift from Prof. Douglas Mast, University of Cincinnati, Cincinnati, OH, USA) were retrieved from vapor-phase liquid nitrogen storage (MVE XC 47/11, Chart Biomedical Ltd., Ball Ground, GA, USA) and temporarily placed into an insulated shipping container (Polar Tech Industries, Genoa, IL, USA) full of dry ice for transportation. Once ready for implantation, VX2 cryovials were hand thawed and the contents were emptied into a glass petri dish (Corning Inc. Corning, NY, USA) containing sterile 0.9% saline (Phoenix, St. Joseph, MO, USA) to rinse off cryoprotectant. Large tumor fragments were then selected and transferred into a second petri dish containing 50:50 DMEM and F-12 media (Cell Media Facility, UIUC, Urbana, IL, USA) with supplemental glutamine (VWR, Batavia, IL, USA). Using a sterile surgical blade (EXEL International, Redondo Beach CA, USA), small tumor fragments (approximately 1 mm in size) were cut from the large VX2 tumor fragment, with care taken to avoid any necrotic regions. Ten 1 mm VX2 tumor fragments were then loaded into a 1 mL syringe (BD, Franklin Lakes, NJ, USA) along with 0.7 mL of the above media mixture in preparation for implantation.
Ultrasound Guided Implantation of VX2 Tumors into Rabbit Liver
Anesthesia was induced via mask (Molecular Imaging Products Co., Foster City, CA, USA) using 5% isoflurane (Phoenix, St. Joseph, MO, USA) mixed with medical oxygen (Airgas Healthcare, Radnor, PA, USA), with 2% isoflurane (with oxygen) for maintenance. The rabbit was placed onto a heating pad (HM10, K&H Manufacturing Inc., Colorado Springs, CO, USA) and body temperature (Clinical Digital Thermometer, Joytech Healthcare Co. LTD., Hangzhou, Zhejiang, China) and respiratory rate (manual respiration count) were monitored. The abdomen of the rabbit was shaved to provide an acoustic imaging window and was disinfected using 70% isopropyl alcohol (Cumberland Swan, Smyrna, TN, USA). Ultrasound imaging (GE LOGIQ E10, GE, Boston, MA, USA) was performed with an L2–9-D transducer (GE, Boston, MA, USA) to visualize the liver and identify the implantation site. Once a suitable right lateral liver lobe implantation site was located, the isoflurane concentration was increased to 3.5% and the skin surface was once again disinfected using 70% isopropyl alcohol. A 16-gauge coaxial biopsy needle (BARD®, Tempe, AZ, USA) was inserted into the rabbit liver percutaneously under ultrasound guidance. The sharp inner stylet of the biopsy needle was retracted, and the syringe containing VX2 tumor fragments in media was attached to the biopsy cannula. The VX2 fragments were then quickly flushed into the right lateral liver lobe, and a blunt stylet was inserted into the biopsy cannula to ensure that all tumor fragments were expelled (Yi et al. 2019). VX2 fragment placement was confirmed with ultrasound imaging (Fig 1). Following tumor implantation, rabbits were weighed weekly and monitored every 1 to 3 days for signs of excessive tumor burden and severity of tumor-associated disease (e.g.: weight loss, jaundice, lack of appetite).
Figure 1 |. VX2 tumor implantation and monitoring.
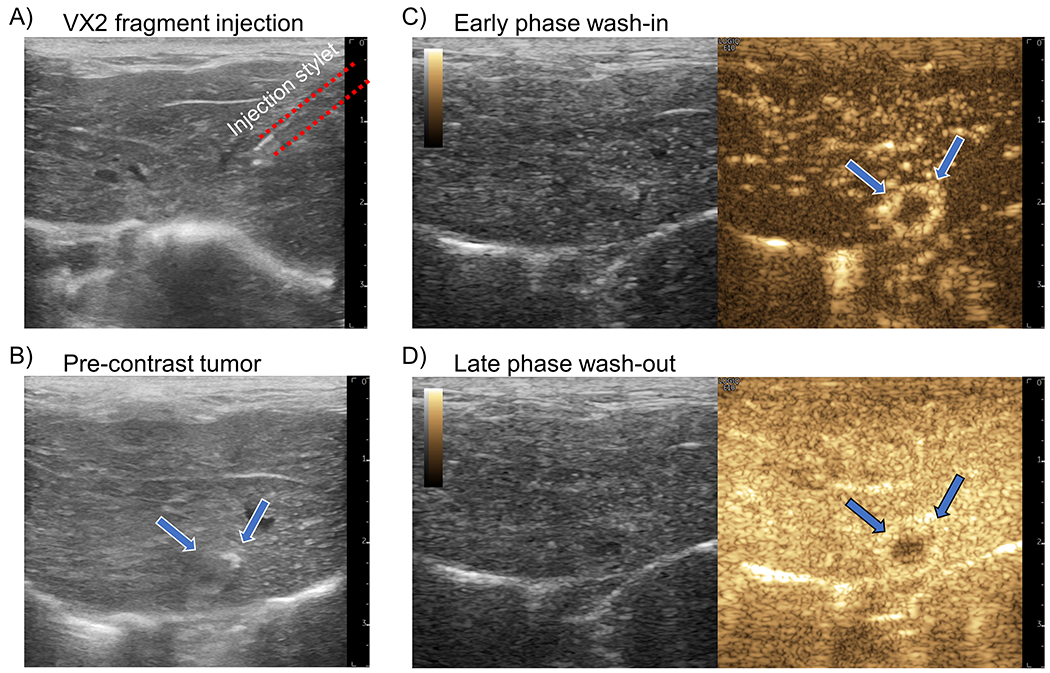
(A) An example B-mode image of the insertion of a 16-gauge coaxial biopsy needle into the liver parenchyma for VX2 tumor fragment injection. (B) After 2 weeks the implanted VX2 tumor (arrows) is difficult to visualize on B-mode imaging due to the similarity in echogenicity between liver and tumor. (C) During the early phase of contrast agent wash-in the VX2 tumor demonstrates a distinct rim enhancement on contrast-specific imaging. (D) The late-phase enhancement, representing portal vein blood flow, shows that the tumor has predominantly arteriole vascular supply.
Tumor monitoring
Starting at 2 weeks post implantation, liver tumor growth was monitored once per week with ultrasound imaging (GE LOGIQ E10 with L2-9-D transducer, imaging frequency of 9 MHz). As before, anesthesia was induced via mask using 5% isoflurane mixed with medical oxygen, with 2% isoflurane (with oxygen) for maintenance. Respiration rate was monitored every ten minutes, and body temperature was monitored every 20 minutes. The abdomen was shaved and ultrasound gel (Aquasonic, Parker Laboratories, Inc., Fairfield, NJ, USA) was applied to the skin to provide acoustic coupling. Ultrasound B-mode and Color flow (CF-mode) imaging were performed to identify the tumor implantation sites. Identifying features included hypo- or hyperechoic spherical masses and peripheral vasculature. In cases where the presence of a tumor mass was ambiguous, contrast-enhanced ultrasound imaging was performed using contrast mode. Briefly, the ear of the rabbit was shaved and a 24G 3/4-inch butterfly winged infusion set (Terumo Surflo, Somerset, NJ, USA) was inserted into the marginal ear vein and secured with tape (Transpore, 3M, Saint Paul, MN, USA). A 0.6 mL bolus of contrast agent (Definity®, Lantheus Medical Imaging, N. Billerica, MA, USA) was injected and the tumor of interest was imaged with contrast mode for the duration of the wash-in/wash-out phase (Fig 1C and Fig 1D). The presence of a tumor was identified based on significant enhancement at the wash-in phase and fast wash-out phase (Yi et al. 2019). Pre-treatment tumor ULM imaging was performed once a tumor diameter of >1 cm was noted.
Anti-angiogenic agent dosing
After the baseline ULM imaging session, rabbits received oral doses of sorafenib, an anti-angiogenic agent. Sorafenib powder, p-Toluenesulfonate salt, was obtained from LC Laboratories (Woburn, MA, USA) and stored in a −20 °C freezer (So Low, Environmental Equipment, Cincinnati, OH, USA). Individual doses of sorafenib (30 mg/kg, as per (Gaba et al. 2013; Kong et al. 2015)) were weighed out for each rabbit and mixed with approximately 1 mL of unsweetened applesauce (Schnucks Markets, Inc. St. Louis, MO, USA) in a 3 mL syringe. Rabbits were syringe fed this applesauce/sorafenib mixture once a day for a total duration of one week.
Custom stereotactic frame to allow hepatic ultrasound imaging without rib shadowing
A custom stereotaxic frame (Fig. 2) was designed to permit precise positioning and inclination (Fig. 2B) of the rabbit during imaging. By inclining the rabbit (Fig. 2C), the liver lobe of interest was able to descend below the costal cartilage and lower false ribs, thereby allowing for hepatic ultrasound imaging windows that avoided shadowing artifacts from the ribcage. The stereotaxic frame was designed to securely fasten a modified Jackson-Rees non-rebreathing circuit and supraglottic laryngeal device (V- gel®) to permit manual mechanical ventilation, as necessary, to allow for anesthetic vital monitoring with the Cardell® Touch, and to give ready access to the central auricular artery and lateral saphenous vein for catherization.
Figure 2 |. Stereotaxic frame design.
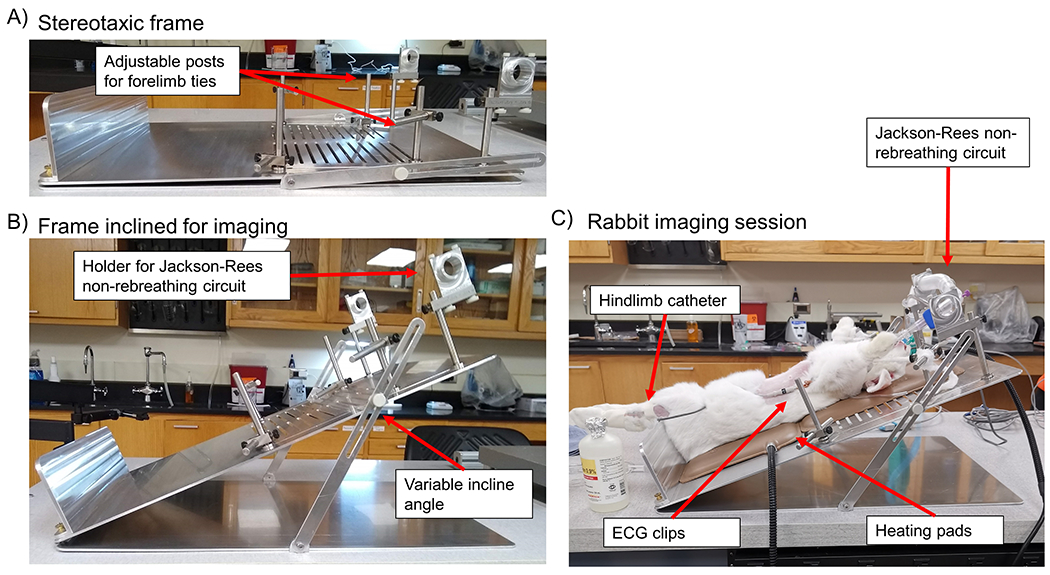
(A) A side view of the custom designed stereotaxic frame. Adjustable forelimb ties (arrow) were designed to accommodate changes in rabbit size over the course of the longitudinal study. (B) A side view of the stereotaxic frame demonstrates that the incline angle is adjustable on a case-by-case basis. A holder (arrow) was attached to the top end of the frame to securely fasten a modified Jackson-Rees non-rebreathing circuit for manual mechanical ventilation during induced apnea. (C) Representative example of a rabbit imaging session, where the hindlimb catheter, ECG clips, heating pads, and modified Jackson-Rees non-rebreathing circuit are denoted with arrows.
ULM imaging experimental set-up
ULM imaging was performed longitudinally with two time points for each rabbit: a baseline scan was performed before sorafenib therapy and an endpoint scan after one week on the anti-angiogenic agent. Anesthesia was induced with an intramuscular (IM) injection of alfaxalone (6 mg/kg, Jurox Pty Ltd. Kansas City, MO, USA) and followed-up 10 minutes later with IM injections of ketamine (15 mg/kg, Hospira, Inc. Lake Forest, IL, USA), and midazolam (1 mg/kg, West-Ward, Eatontown, NJ, USA). The rabbit’s abdomen, hind limbs, and ears were shaved and disinfected with 70% isopropyl alcohol. Once appropriate anesthesia depth was confirmed by lack of pedal reflex (toe pinch) a species-specific supraglottic laryngeal device (V-gel®, DocsInnovent, Hemel Hempstead, Hertfordshire, UK) was inserted into the rabbit’s airway. An IV catheter (24G 3/4-inch, Terumo Surflash, Somerset, NJ, USA) was placed in the lateral saphenous vein for contrast agent and propofol administration. Anesthetic vital monitoring was performed with a Midmark Multiparameter Monitor (Cardell® Touch, Dayton, OH, USA) that allowed for the monitoring of invasive and non-invasive blood pressures, electrocardiogram, body temperature (rectal probe), and capnography. The auricular artery was catheterized (24G 3/4-inch, Terumo Surflash, Somerset, NJ, USA) for invasive blood pressure monitoring (Deltran® II, Utah Medical Products, Inc, Midvale, UT, USA). In order to facilitate liver imaging, the rabbit was placed in dorsal recumbency on the custom designed stereotaxic frame described in the above section (built by the Machine Shop of the Department of Electrical & Computer Engineering, University of Illinois at Urbana-Champaign, Urbana, IL, USA) (Fig. 2), which was inclined to lower the liver below the rib cage. A built-in bottom plate prevented the rabbit from sliding off the frame and forelimbs were tied to built-in adjustable posts to keep them out of the imaging area and to aid in securing the rabbit. Body temperature was maintained with heating pads and a heating lamp (Exo-terra, Mansfield, MA, USA), as necessary.
Apnea was induced with IV administration of propofol (3-5 mg/kg, Hikma, Eatontown, NJ, USA) just prior to imaging (Claure et al. 2009). After 90 seconds of apnea, manual mechanical ventilation with peak inspiratory pressures of 10-12 mmHg was performed using a modified Jackson-Rees non-rebreathing circuit (Smiths Medical ASD, Inc., St. Paul, MN, USA) with attached rebreathing bag and inline manometer (JD Medical, Phoenix, AZ, USA). The goal of mechanical ventilation was to relieve post-apnea hypercapnia. Artificial breathing was maintained until recovery of autonomous respiration. Once imaging was complete, the V-gel® and anesthetic monitoring equipment were removed, and the animal was allowed to recover under a heating lamp. Temperature was monitored every 10 minutes during the recovery period until the animal self-righted and/or exhibited autonomous sternal recumbency. The anesthetic protocol described above was dubbed the AKM-P protocol.
ULM image acquisition
B-mode scanning of rabbit liver was performed by using the GE LOGIQ E10 ultrasound system with a 9 MHz linear array transducer (L2-9-D) to locate the VX2 liver tumor nodule. Then contrast-enhanced ultrasonography of this tumor nodule was performed after administration of a 0.6 mL contrast agent (Definity®) bolus injection via the lateral saphenous vein catheter. The largest cross-sections of active tumor in both the transverse and longitudinal imaging planes were recorded for subsequent ULM acquisition. Contrast-enhanced imaging with the GE LOGIQ E10 was continued until sufficient contrast wash-out was observed. ULM imaging acquisitions were then performed with a Verasonics Vantage 256 (Verasonics Inc., Kirkland, WA, USA) programmable ultrasound system with a GE-9L linear array transducer (GE, Boston, MA, USA) following a fresh 0.6 mL Definity® bolus. The Verasonics ultrafast planewave imaging was performed with 5-angle coherent compounding (−4 degrees to 4 degrees, 2-degree step angle), a center frequency of 8 MHz, and a post-compounding pulse-repetition-frequency (PRF) of 1,000 Hz. A 0.075 mm needle hydrophone (SN 1506, Precision Acoustics Ltd., Dorchester, Dorset, U.K.) was used to measure the mechanical index (MI) of this imaging acquisition in a water tank, yielding a mean value of 0.07 for the typical depth of imaging of the rabbit liver.
Transient periods of apnea were induced using IV injections of propofol (3-5 mg/kg given over a period of 60-90 seconds) with the goal of reducing tissue motion while imaging the liver. The GE-9L transducer was positioned to acquire the desired field of view and held free-hand during the acquisition. Once apnea was confirmed, a 0.6 mL bolus of Definity® was injected IV and ultrafast ultrasound imaging acquisition was started. In-phase quadrature (IQ) datasets were collected via a continuous acquisition that stored data subsets containing 300 post-compounding ultrasound frames for the total duration of apnea (90 seconds).
A subset of rabbit tumors was also imaged during apneic events with the GE LOGIQ E10 ultrasound system and L2-9-D transducer in CF-mode, following the ULM imaging protocol outlined above. For this pilot set of animals the CF-mode packet size was increased to 128 by modifying the system’s internal XML files, and the transmit power for both B-mode and CF-mode were reduced to the lowest setting, 2% and 5% respectively, with a reported MI of 0.09. The frequency of the CF-mode acquisition, which was used for ULM reconstruction, was 5.3 MHz. Imaging IQ data was exported as .bin files using the system’s debug dialog.
Animal endpoint
After the second set of ULM imaging (post-therapy) the rabbits were given a 0.5 mL IV injection of hypoxyprobe (pimonidazole hydrochloride, Chemicon, Temecula, CA, USA) mixed with sterile saline, with a target dosage of 30 mg/kg. Hyproxyprobe was allowed to circulate for at least 30 minutes before euthanizing. After euthanization, the abdominal cavity of the rabbits was opened and a complete hepatic resection was performed following suture ligation (monofilament nonabsorbable suture, Oasis, Mettawa, IL, USA) of the major hepatic blood vessels (portal vein, hepatic artery, inferior vena cava). The whole liver was then moved into a 10% neutral-buffered formalin solution (Fisherbrand, Pittsburgh, PA, USA) for fixation. After 48 hours of fixation, the whole liver was trimmed with a surgical scalpel to reveal the tumor, and the tumor was transferred into a 70% ethanol solution (Decon Labs, Inc., King of Prussia, PA, USA) for storage until histology was performed.
ULM image reconstruction and analysis
All image processing was performed in MATLAB (MathWorks, Natick, MA, USA) using custom code written by the authors. Moving microbubble signals were extracted from each 300 frame ultrasound IQ dataset by applying a spatiotemporal singular value decomposition (SVD)-based clutter filter (Fig. 3) to reject background tissue (Song et al. 2017a). A noise-equalization profile was estimated using the last singular value of an acquisition from an uncoupled transducer and was then applied to the SVD-filtered IQ data (Song et al. 2017b). Then a series of eight 3D Fourier domain bandpass filters were applied to the microbubble signals to split the microbubble data into multiple subsets of sparser concentration for independent localization and tracking (Huang et al. 2020a). A spatiotemporal nonlocal means denoising filter was applied to each microbubble data subset to suppress noise without significant blurring, where the noise level was estimated from the last singular value of the data being filtered (Song et al. 2018). Motion correction was applied to microbubble locations using frame-to-frame phase correlation, where the global tissue motion was estimated from the full image frame (Hingot et al. 2017). The data was spatially interpolated to 10 times the original resolution using 2-D spline interpolation, and a normalized 2-D cross-correlation was then performed between every frame of the interpolated data and representative point-spread function (PSF) generated using a multivariate Gaussian function. The width and height of the PSF was empirically determined from the axial and lateral dimensions of an isolated microbubble in the imaging field of view. A threshold was then applied to reject all pixels with a cross-correlation coefficient of less than 0.6, resulting in isolated microbubble pixel regions for centroid estimation and microbubble localization. Microbubble centroids were paired and tracked using the uTrack algorithm (Jaqaman et al. 2008) in MATLAB, which was also used to generate velocity estimates. Each individual ULM image reconstructed from the 300 frame IQ dataset was combined into a final accumulation image, with global normalized cross-correlation for inter-acquisition registration. Manual segmentation outlining the tumor cross-section was performed with Bezier control points and interpolated by applying Hobby’s algorithm (1986) in MATLAB.
Figure 3 |. Super resolution processing workflow.
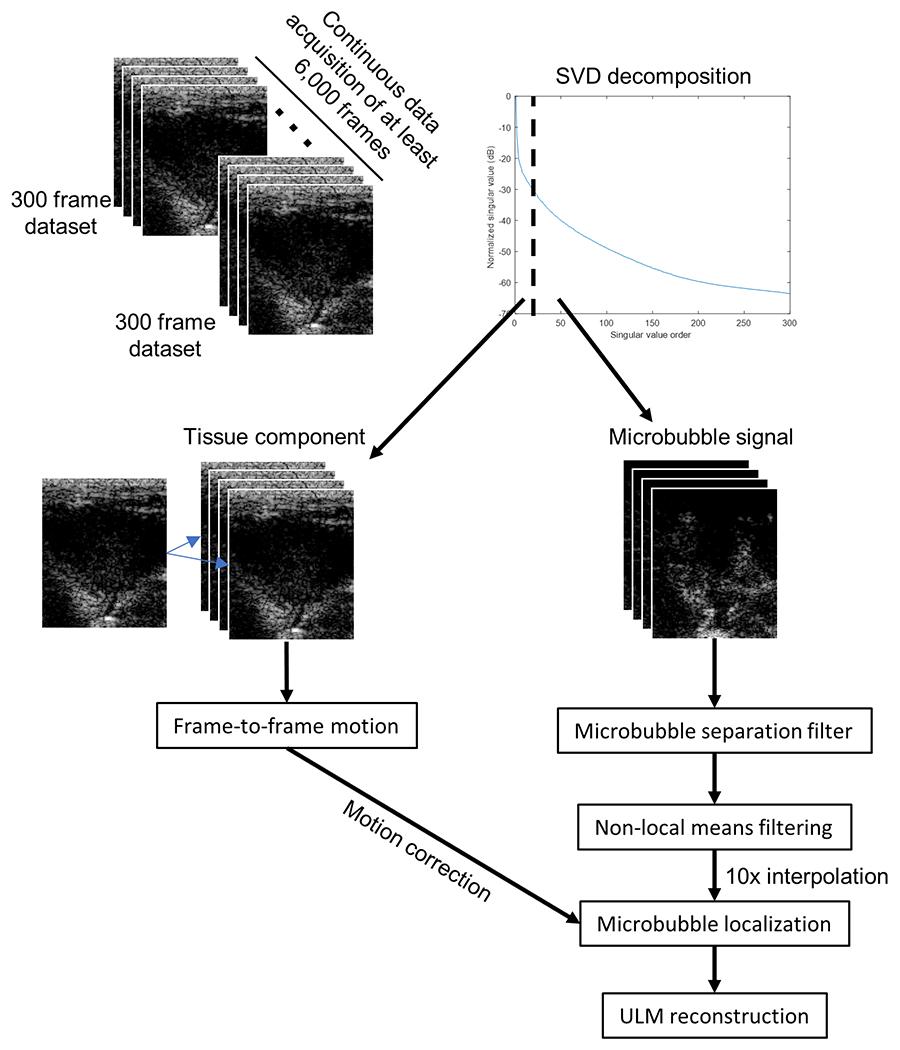
Each 300 frame IQ acquisition had a spatiotemporal SVD-based clutter filter applied to separate the tissue component from the moving microbubble signal. The tissue frames were used to estimate the frame-to-frame motion to correct the microbubble locations. The microbubble signal was processed using a microbubble separation filter and non-local means filtering before a 10x spatial interpolation for microbubble localization and ULM reconstruction.
Histological preparation and immunohistochemistry
All histological preparation, staining, and immunohistochemistry was performed by the University of Illinois at Urbana-Champaign Veterinary Diagnostic Laboratory. Briefly, fixed tumor tissues were dehydrated, paraffin embedded, and sectioned at 4 μm, with three sections cut for each tumor. The first set of sections were stained with hematoxylin and eosin (H&E, Abcam, Cambridge, MA, USA) for anatomical context. The two unstained sections were blocked in 2% bovine serum albumin (VWR, Batavia, IL, USA) and 10% fetal bovine serum (VWR, Batavia, IL, USA) for one hour at room temperature. The second set of sections were incubated with CD31 Monoclonal Antibody (JC/70A, Dako, Via Real Carpinteria, CA, USA) for one hour at room temperature to identify microvascular endothelium. These were then rinsed with PBS (Corning Inc. Corning, NY, USA) and stained with DAB chromogen (3,3′-diaminobenzidine tetrahydrochloride, Pierce Biotechnology Inc., Waltham, MA, USA). The final third set of sections were incubated using a Hypoxyprobe™ plus kit (Hypoxyprobe, Inc., Burlington, MA, USA), which includes an anti-pimonidazole primary antibody (0.6 uL/mL mouse IgG1 monoclonal antibody 4.3.11.3, Hypoxyprobe, Inc., Burlington, MA, USA) for one hour at room temperature, rinsed with PBS, incubated with a secondary reagent (HRP conjugated rabbit anti-FITC, Hypoxyprobe, Inc., Burlington, MA, USA) for one hour, and then stained with DAB chromogen to identify regions of intratumoral hypoxia. All slides were digitized with a NanoZoomer HT slide scanner (Hamamatsu, Hamamatsu City, Japan) at a 20x objective and exported as .ndpi files. Raw image data were extracted from the .ndpi files and saved as .TIF using the ImageJ NDPITools plug-in (Schindelin et al. 2012). Manual segmentation was performed using Hobby’s algorithm (1986) as described above. The tumor’s global microvascular density and intratumoral hypoxia was quantified using the technique by Pham et al. (2007) on DAB staining for CD31 and pimonidazole, respectively, in MATLAB.
Results
VX2 tumor implantation and sorafenib dosing
Implanted tumor fragments took an average of 2-4 weeks to reach the minimum diameter of 1cm required for the first set of ULM imaging. Successful implantation and growth were achieved for 6 out of the 8 rabbits entered into this study. No adverse events were observed during or after implantation, although one rabbit was revealed to have chest wall tumors at euthanasia. Sorafenib therapy was well tolerated.
Hepatic VX2 tumors exhibit characteristic arterial phase rim enhancement
VX2 tumor fragments were injected into the rabbit liver under ultrasound guidance (Fig. 1A). Implanted tumor fragments had similar echogenicity to the surrounding liver tissue, with some hypoechoic foci, making it difficult to identify tumor margins without contrast enhancement (Fig. 1B). Hepatically implanted VX2 tumors demonstrated two distinct distinguishing features on conventional contrast-enhanced ultrasonography (CEUS), rim enhancement during the early arterial enhancement phase and a rapid washout of contrast agent in the portal enhancement phase (Fig. 1C and Fig. 1D). This enhancement pattern is typical of hepatic tumors of a nonhepatocellular origin (Burrowes et al. 2017).
Rabbit response to novel AKM-P anesthesia protocol
Rabbits were non-responsive to toe pinch 2-3 minutes following the IM injections of ketamine and midazolam. The following values are reported as mean ± standard deviation across all rabbits in this study. During pre-apneic anesthesia, heart rate was 288 ± 26 beats per minute, respiratory rate was 32 ± 8 breaths per minute, systolic blood pressure was 77 ± 19 mmHg, and end-tidal CO2 was 36 ± 9 mmHg. Heart rate temporarily dropped to 182 ± 47 beats per minute during the induction of apnea with propofol, but quickly recovered to 271 ± 29 beats per minute during imaging. Systolic blood pressure was 59 ± 31 mmHg during the apneic imaging window. We were able to perform an average of three 90-second duration apneic imaging sessions per rabbit which were spaced approximately 10 minutes apart. It took an average of 4 to 5 full mechanical ventilations, with 10 seconds in between each ventilation, before the animal began to spontaneously breathe. In the post-apnea recovery window, the respiratory rate was 27 ± 14 breaths per minute and end-tidal CO2 was 49.8 ± 6 mmHg.
AKM-P protocol permits long ultrasound liver acquisition times with minimal tissue motion
The challenge that respiratory and tissue motion pose for liver ULM imaging is demonstrated by the motion estimation step of the ULM processing workflow (Fig. 3). By taking the low-order singular values of the IQ data, we were able to extract the microbubble free tissue component to estimate the sub-pixel tissue displacement frame-by-frame for each acquisition. This is demonstrated in Fig. 4, which plots the motion estimates for axial (Fig. 4A) and lateral (Fig. 4B) displacement for a representative example of five imaging acquisitions under high-dose isoflurane (5% isoflurane mixed with medical oxygen for an extended duration) and the AKM-P anesthesia protocol. Cumulative displacements were calculated via the rolling summation of frame-to-frame motion estimates (Fig. 4C and Fig. 4D). The mean and standard deviation for axial and lateral displacement per post-compounded imaging frame was 0.39 ± 0.27 μm and 0.93 ± 0.81 μm, respectively, for the AKM-P acquisitions, and 1.36 ± 1.04 μm and 1.65 ± 1.54 μm, respectively, for high-dose isoflurane. The combination of respiratory, tissue, and cardiac motion under isoflurane anesthesia resulted in enough displacement, both within and between acquisitions (Fig. 5A), to cause ULM reconstruction artifacts (Fig. 5B). This resulted in microvessel trajectory blurring, potential velocity errors, and accumulation misalignment that led to an over-estimation of intratumoral vascularization. Following induction of anesthesia with alfaxalone, ketamine, and midazolam, apneic events can be induced with propofol for up to 90 seconds in duration. This permitted the uninterrupted acquisition of contrast-enhanced ultrasound IQ data from the rabbit liver with minimal respiratory motion (Fig. 5C). The ULM accumulation from this dataset revealed a well vascularized tumor periphery with a poorly vascularized tumor core and few intertumoral vessels (Fig. 5D). This finding is consistent with the immunohistological CD31 staining of the VX2 tumors in this study.
Figure 4 |. Novel AKM-P anesthesia protocol reduced tissue motion.
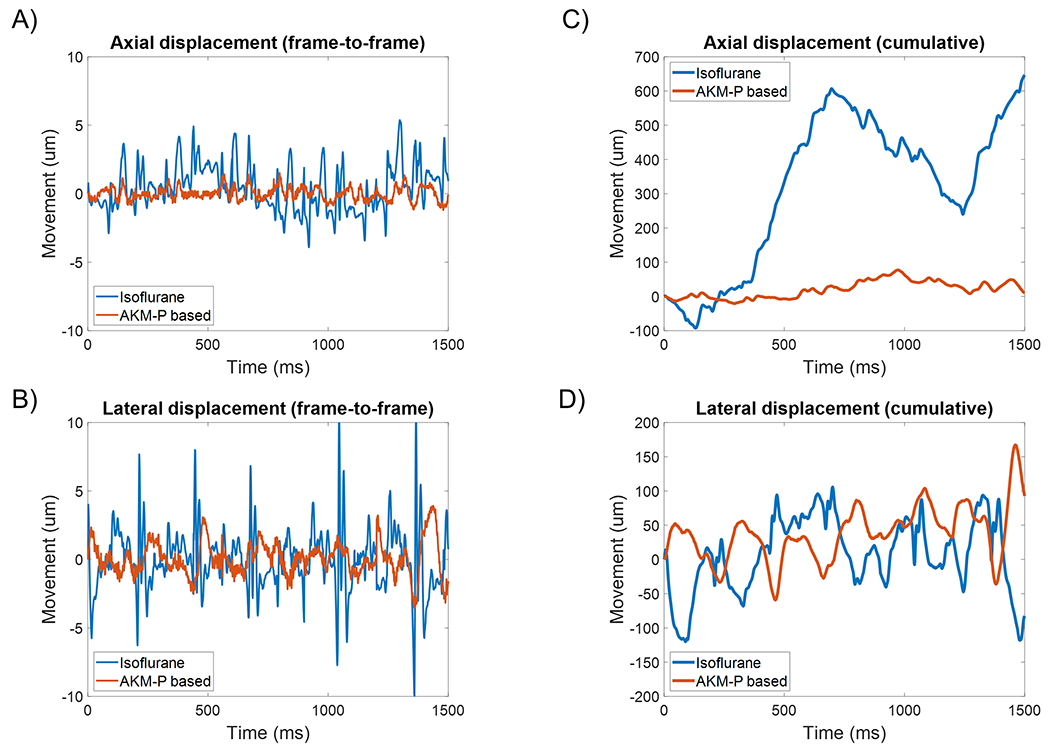
A high dose of isoflurane was able to induce short periods of apnea for ULM acquisition. However, the onset of apnea was unpredictable and sporadic, leading to a high degree of frame-to-frame (A) axial and (B) lateral motion. The AKM-P anesthesia protocol had a comparatively lower amount of both axial and lateral motion in this example dataset. In (C) and (D) the cumulative displacements of the imaging plane are demonstrated.
Figure 5 |. Tissue motion occludes poorly vascularized tumor core in ULM reconstruction.
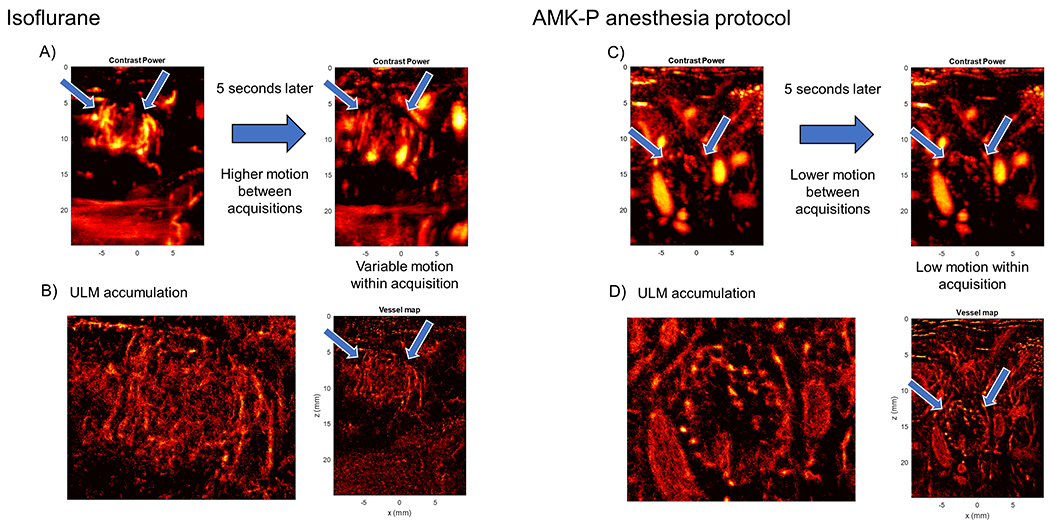
(A) Contrast power images taken during isoflurane anesthesia demonstrate substantial in- and out-of-plane tissue motion during data acquisition. Arrows point to tumor boundary. (B) ULM accumulation image for the above acquisition appear to reveal a well vascularized tumor core with highly chaotic vessel structure. (C) A different rabbit under the AKM-P anesthesia protocol shows less tissue motion between acquisitions, and less motion within an acquisition. Arrows point to tumor boundary. (D) The super-resolution image from the above acquisition dataset reveals a sparsely vascularized tumor core with well vascularized periphery, which is consistent with CEUS images and histology.
Super-resolution ULM imaging reveals tumoral microvascular architecture
Contrast power images of pre-sorafenib therapy VX2 liver tumors exhibited a well vascularized tumor periphery surrounding a relatively poorly vascularized tumor core (Fig. 6A). Super-resolution ULM images of these tumors revealed the microvascular architecture of the sparse infiltrating vessels (Fig. 6A, blue arrow) and the vascular morphology of the peritumoral vasculature. Following sorafenib therapy, these tumors continued to progress in size and the poorly vascularized region became larger (Fig. 6B). Spatially sparse, slow moving microbubble events were also present in the core of the tumor (white arrow), indicating that there are still some rare, but poorly perfused, vessels through the center of the tumor. The presence of these rare intertumoral vessels was also evident on CD31 histological staining of the tumor core (Fig. 8). Comparing the ULM reconstructed vasculature to CD31 staining (Fig. 9) reveals similar observations of a highly vascularized liver/tumor boundary, a relatively avascular tumor core, and the presence of some rare vessels within the boundary of the tumor.
Figure 6 |. VX2 tumors continue to progress under sorafenib therapy and develop necrotic cores.
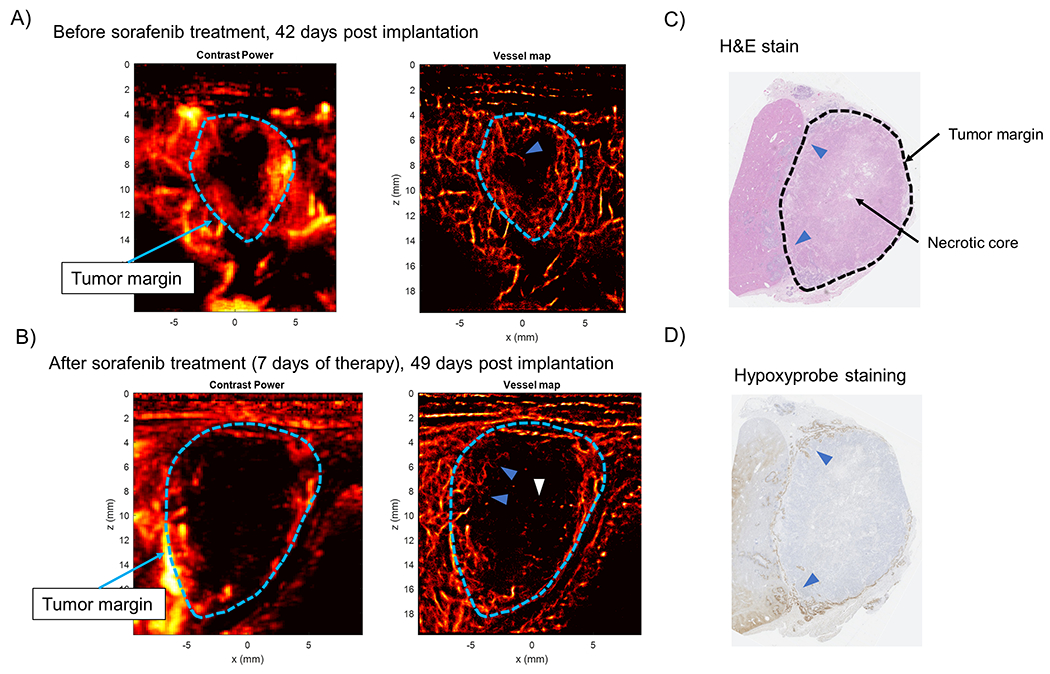
(A) Prior to sorafenib therapy, the VX2 tumors demonstrated a poorly vascularized core with sparse infiltrating vessels (blue arrow). (B) After sorafenib therapy the VX2 tumors continue to progress in size and develop chaotic hair root-like vessel structure in the tumor periphery (blue arrows). Slow moving sparse microbubble events are also apparent in the core of the tumor (white arrow). (C) H&E staining of VX2 tumors reveal that the tumor core was necrotic, with viable tumor in the periphery. (D) Hypoxyprobe staining was only positive in the periphery of the tumor, implying that there was poor perfusion of the tumor core.
Figure 8 |. CD31 immunohistochemistry confirms poorly vascularized tumor core.
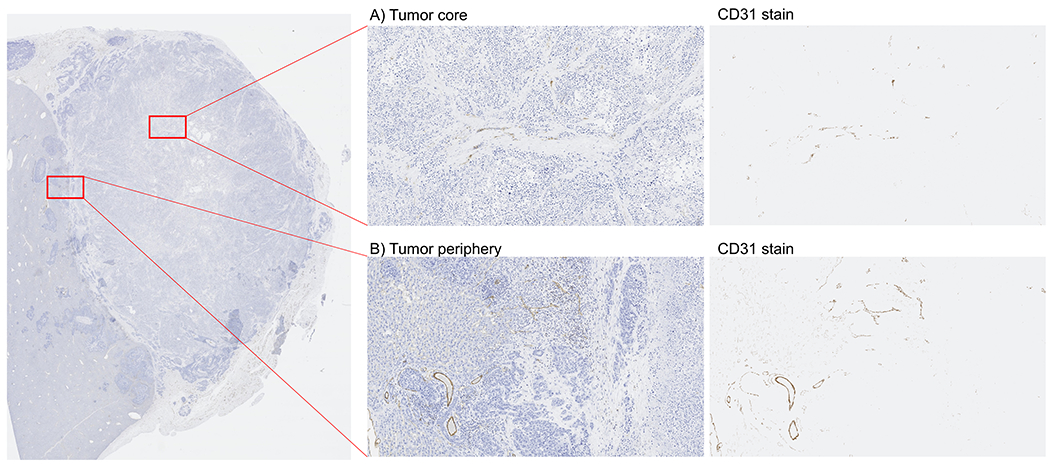
CD31 immunohistochemistry confirmed that the rabbit liver VX2 tumors in this study had (A) poorly vascularized tumor cores that were (B) surrounded by better vascularized tumor peripheries.
Figure 9 |. Side-by-side comparison of ULM and CD31 staining.
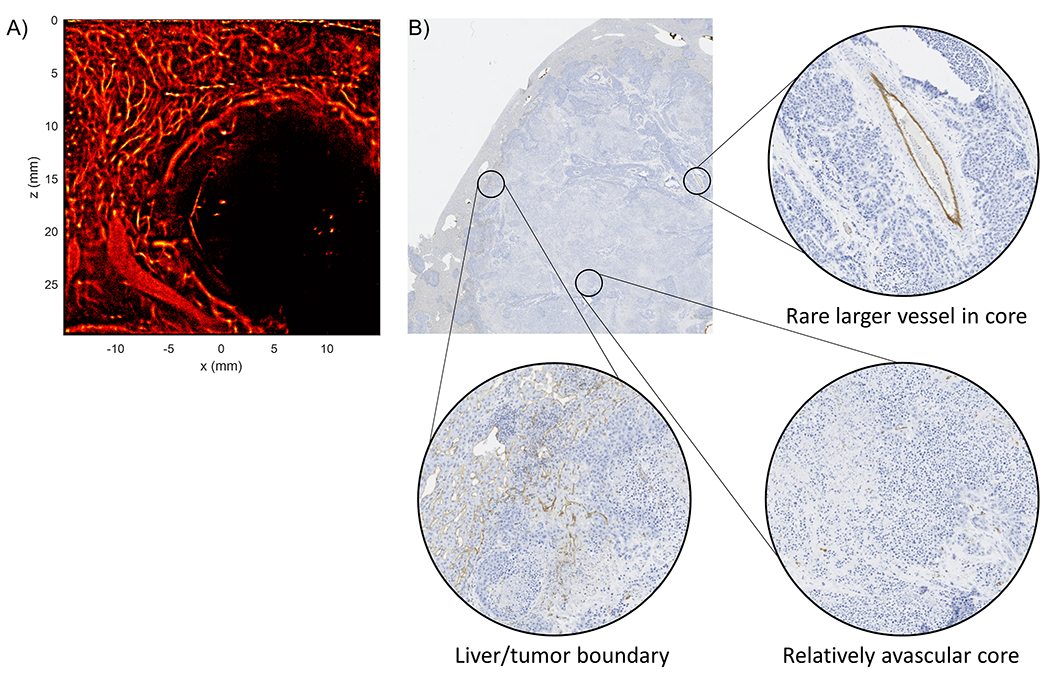
(A) A rabbit VX2 liver ULM image under the AKM-P anesthesia acquisition demonstrated a well reconstructed liver vascular architecture, a highly vascularized tumor periphery, and a poorly vascularized tumor core with a few large vessels. (B) The corresponding CD31 stained histology demonstrated a highly stained liver/tumor boundary with a relatively unstained tumor core. Some larger vessels were also detected within the boundary of the tumor.
This phenotype of a highly vascularized tumor periphery with a relatively avascular tumor core was also evident on the pilot set of ULM images reconstructed with data acquired from the GE LOGIQ E10 system (Fig. 7). In this demonstrative example, a rabbit liver tumor was imaged with both the Verasonics Vantage 256 and the GE LOGIQ E10 ultrasound scanners. B-mode imaging revealed a hyperechoic mass (Fig. 7A), which is potentially indicative of centralized necrosis, and contrast-enhanced power imaging (Fig. 7B) showed a well vascularized tumor rim. ULM processing (Fig. 7C) was able to demonstrate finer vascular detail and resolution in the surrounding vasculature and in the intratumoral microvessels. A direct comparison to the ULM imaging results obtained with the Vantage 256 system is provided (Fig. 7D) to highlight the qualitative similarity between these two images.
Figure 7 |. Pilot ULM imaging with the GE LOGIQ E10 system.
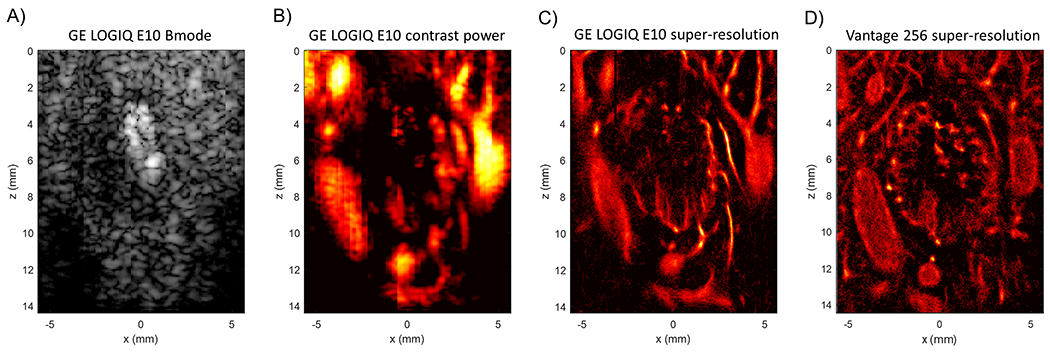
A demonstrative example of one of the rabbit liver tumors that was imaged using both the GE LOGIQ E10 system and the Vantage 256. (A) The B-mode image shows a hyperechoic mass, possibly indicating the necrotic core of this tumor. (B) An example contrast power image of the same tumor. (C) A super-resolution ULM generated using the data gathered with the GE system. Note that there is finer detail in the surrounding vasculature and in intratumoral microvessels. (D) The same tumor imaged with the Vantage 256 system for comparison.
Histology and immunohistochemistry of VX2 tumors
Hematoxylin and eosin staining of the VX2 tumors showed that the tumor cores were necrotic (Fig. 6C), with large eosinophilic regions surrounding areas that were absent of tissue. Most of the viable tumor tissue, the more basophilic regions, was located in the periphery. This finding of a high percentage of necrosis in hepatic VX2 liver tumors is consistent with literature (Gaba et al. 2016). Interestingly, hypoxyprobe staining was only positive within this tumor periphery layer (Fig. 6D). We speculate that this implies that there was poor perfusion into the core of the tumor, possibly due to a high interstitial pressure. CD31 immunohistochemistry confirmed the results that were seen in the ULM images, namely that the tumor core is poorly vascularized (Fig. 8A) and is surrounded by a better-vascularized tumor periphery (Fig. 8B).
Discussion
This pilot study aimed to develop a novel AKM-P anesthesia protocol for pre-clinical in vivo microvascular imaging of VX2 liver tumors in rabbits with super-resolution ULM. The protocol induced anesthesia via IM injections of alfaxalone, ketamine, and midazolam, and induced safe controlled periods of apnea with an IV injection of propofol. This protocol was able to consistently generate periods of apnea for a duration of 90 seconds, which was sufficient time to gather at least 6,000 post-compounding frames (20 seconds of acquisition including data transfer, 30,000 pre-compounded planewave acquisitions) of ultrasound data with minimal tissue motion per apneic event. We demonstrated the reconstruction of microvascular networks in hepatic VX2 tumors, and the surrounding liver parenchyma, in rabbits and qualitatively analyzed the results using ULM. We also compared this with the ULM reconstruction results from a subset of rabbits under isoflurane anesthesia; subtle intratumoral vascular features from sorafenib therapy were apparent in VX2 tumors reconstructed during the apneic period that were occluded from the high amount of tissue motion during isoflurane anesthesia (Fig. 5). Specifically, the apneic ULM images of these tumors revealed a sparse infiltrating microvasculature with chaotic, root hair-like vessel structure in the tumor periphery (Fig. 6). The root hair-like structure is a radiological feature correlated to some types of malignant lesions in contrast-enhanced ultrasound imaging (Xiao et al. 2016). Whether or not these features are also informative in super-resolution ULM imaging has yet to be determined and is outside the scope of this study. In addition, the AKM-P anesthesia demonstrated better hepatic parenchymal flow in comparison to the competing high-dose isoflurane, which had poor hepatic perfusion in our experience likely due to reduced blood pressure. We also demonstrated ULM image reconstruction on a pilot set of data acquired with a clinical ultrasound scanner, the GE LOGIQ E10 (Fig. 7). The ULM images reconstructed using the Verasonics system showed slightly better detail than the results obtained with the GE LOGIQ E10, which can be attributed to the lower transmit frequency of CF-mode (5.3 MHz) versus plane-wave compounding (8 MHz). Furthermore, CF-mode acquisition likely uses fewer imaging lines to maintain a high PRF which is apparent as lateral banding in the image demonstrated in Fig. 7A), resulting in fewer microbubble localization events in the final reconstructed ULM image.
The sparse intratumoral vasculature apparent on ULM images was confirmed with CD31 immunostaining of the microvessels on histology sections (Fig. 8) and is consistent with the finding that hepatic VX2 tumors exhibit a large percentage of intratumoral necrosis (Fig. 6) (Gaba et al. 2016). The intrinsic necrosis of the rabbit VX2 liver tumor model presents an important limitation to this study, as it prohibits the development of interesting intratumoral vasculature features that could be analyzed with ULM imaging. This degree of intratumoral necrosis is also not common in clinical HCC, which limits the translatability of the findings in the rabbit VX2 liver tumor model. Our ultimate goal is to investigate the effectiveness of using ULM for the early prediction of anti-angiogenic therapy response(s) for liver cancer; however, the intrinsic intratumoral necrosis and poorly vascularized tumor core may limit our ability to quantify anti-angiogenic treatment effects in this liver tumor model.
Generally, the liver represents an extremely difficult organ site for ULM imaging, as there are abundant sources of respiratory and tissue motion leading to poorly registered imaging acquisitions with out-of-plane motion. Furthermore, in rabbits, a large proportion of the liver is protected by the ribcage, which can hinder ultrasound scanning. In the clinical setting, patients can voluntarily breath-hold, which serves two purposes for ULM liver imaging: it minimizes respiratory motion and it moves the liver below the ribcage for easier access to the ultrasound transducer. The apneic anesthesia protocol fulfilled the first requirement, but for rabbit liver VX2 ULM imaging it was also necessary to incline the animal to allow the liver lobe of interest to descend below the costal cartilage to offer a hepatic ultrasound imaging window that avoided shadowing artifacts from the ribcage. This was accomplished with a custom-designed stereotaxic frame that also secured the critical modified Jackson-Rees non-rebreathing circuit (Fig 2).
A limitation of the proposed AKM-P anesthesia protocol for rabbit ULM liver imaging is the increased technical complexity over more conventional anesthetics, such as isoflurane. In order to safely induce the apneic events necessary to acquire low-motion ultrasound data, an investigator must have specialized equipment and expertise including placement and monitoring of the appropriate positioning of a supraglottic laryngeal device into the rabbit’s airway and placement of an intravenous catheter. Additionally, specialized anesthetic monitoring equipment is required to monitor rabbit vitals during apneic events. Overall, this protocol requires substantial animal anesthesia experience and knowledge to properly gauge animal safety, redosing thresholds to maintain anesthesia and to interpret and understand the anesthetic monitoring. Finally, the proposed AMK-P protocol requires the use of controlled substances which requires strict safe handling protocols and is more expensive than the isoflurane approach.
Even with the anesthesia protocol proposed in this study, ULM liver imaging remains a substantial challenge. Cardiac motion is still present, introducing translations and deformations of the liver parenchyma, and the liver itself is susceptible to out-of-plane motion as the lobes shift within the abdominal cavity. The frame-to-frame phase correlation for motion correction and global normalized cross-correlation for inter-acquisition registration used in this study helped to mitigate some of this tissue displacement. However, out-of-plane motion cannot be corrected for with ultrasound data that is acquired with a 1D array, as this data is two-dimensional. Future studies will require 3D ultrasound imaging, using a matrix array or row-column array, to enable fully three-dimensional microbubble tracking and pairing. This additional dimension of data will permit more robust motion correction and will alleviate some of the concerns with imaging plane selection in longitudinal studies.
Supplementary Material
Funding:
The study was partially supported by the National Cancer Institute of the National Institutes of Health under Award Number R00CA214523, the General Electric (GE) Healthcare GE LOGIQ E10 Ultrasound Research Award, and by the Seed Grant from the Cancer Center at Illinois. The content is solely the responsibility of the authors and does not necessarily represent the official views of the National Institutes of Health.
Footnotes
Competing Interests: The authors declare no competing interests.
Publisher's Disclaimer: This is a PDF file of an unedited manuscript that has been accepted for publication. As a service to our customers we are providing this early version of the manuscript. The manuscript will undergo copyediting, typesetting, and review of the resulting proof before it is published in its final form. Please note that during the production process errors may be discovered which could affect the content, and all legal disclaimers that apply to the journal pertain.
Data Availability:
The data that support the findings of this study are available from the corresponding authors on request.
References
- Ackermann D, Schmitz G. Detection and Tracking of Multiple Microbubbles in Ultrasound B-Mode Images. IEEE Trans Ultrason Ferroelectr Freq Control 2016;63:72–82. [DOI] [PubMed] [Google Scholar]
- Aravalli RN, Golzarian J, Cressman ENK. Animal models of cancer in interventional radiology. European Radiology 2009;19:1049–1053. [DOI] [PubMed] [Google Scholar]
- Barter LS, Epstein SE. Comparison of Doppler, oscillometric, auricular and carotid arterial blood pressure measurements in isoflurane anesthetized New Zealand white rabbits. Vet Anaesth Analg 2014;41:393–397. [DOI] [PubMed] [Google Scholar]
- Berretta M, Rinaldi L, Di Benedetto F, Lleshi A, De Re V, Facchini G, De Paoli P, Di Francia R. Angiogenesis Inhibitors for the Treatment of Hepatocellular Carcinoma. Front Pharmacol 2016. [cited 2020 Aug 17];7. Available from: https://www.ncbi.nlm.nih.gov/pmc/articles/PMC5101236/ [DOI] [PMC free article] [PubMed] [Google Scholar]
- Burrowes DP, Medellin A, Harris AC, Milot L, Wilson SR. Contrast-enhanced US Approach to the Diagnosis of Focal Liver Masses. RadioGraphics Radiological Society of North America, 2017;37:1388–1400. [DOI] [PubMed] [Google Scholar]
- Christensen-Jeffries K, Brown J, Harput S, Zhang G, Zhu J, Tang M-X, Dunsby C, Eckersley RJ. Poisson Statistical Model of Ultrasound Super-Resolution Imaging Acquisition Time. IEEE Trans Ultrason Ferroelectr Freq Control 2019;66:1246–1254. [DOI] [PMC free article] [PubMed] [Google Scholar]
- Christensen-Jeffries K, Browning RJ, Tang M-X, Dunsby C, Eckersley RJ. In vivo acoustic super-resolution and super-resolved velocity mapping using microbubbles. IEEE Trans Med Imaging 2015;34:433–440. [DOI] [PubMed] [Google Scholar]
- Claure N, Suguihara C, Peng J, Hehre D, D’Ugard C, Bancalari E. Targeted minute ventilation and tidal volume in an animal model of acute changes in lung mechanics and episodes of hypoxemia. Neonatology 2009;95:132–140. [DOI] [PubMed] [Google Scholar]
- Couture O, Hingot V, Heiles B, Muleki-Seya P, Tanter M. Ultrasound Localization Microscopy and Super-Resolution: A State of the Art. IEEE Trans Ultrason Ferroelectr Freq Control 2018;65:1304–1320. [DOI] [PubMed] [Google Scholar]
- Dencks S, Piepenbrock M, Opacic T, Krauspe B, Stickeler E, Kiessling F, Schmitz G. Clinical Pilot Application of Super-Resolution US Imaging in Breast Cancer. IEEE Trans Ultrason Ferroelectr Freq Control 2019;66:517–526. [DOI] [PubMed] [Google Scholar]
- Desailly Y, Pierre J, Couture O, Tanter M. Resolution limits of ultrafast ultrasound localization microscopy. Phys Med Biol 2015;60:8723–8740. [DOI] [PubMed] [Google Scholar]
- Errico C, Pierre J, Pezet S, Desailly Y, Lenkei Z, Couture O, Tanter M. Ultrafast ultrasound localization microscopy for deep super-resolution vascular imaging. Nature Nature Publishing Group, 2015;527:499–502. [DOI] [PubMed] [Google Scholar]
- Foiret J, Zhang H, Ilovitsh T, Mahakian L, Tam S, Ferrara KW. Ultrasound localization microscopy to image and assess microvasculature in a rat kidney. Scientific Reports Nature Publishing Group, 2017;7:13662. [DOI] [PMC free article] [PubMed] [Google Scholar]
- Forner A, Reig M, Bruix J. Hepatocellular carcinoma. Lancet 2018;391:1301–1314. [DOI] [PubMed] [Google Scholar]
- Gaba RC, Emmadi R, Parvinian A, Casadaban LC. Correlation of Doxorubicin Delivery and Tumor Necrosis after Drug-eluting Bead Transarterial Chemoembolization of Rabbit VX2 Liver Tumors. Radiology Radiological Society of North America, 2016;280:752–761. [DOI] [PubMed] [Google Scholar]
- Gaba RC, Yap FY, Martinez EM, Li Y, Guzman G, Parvinian A, van Breemen RB, Kumar N. Transarterial Sorafenib Chemoembolization: Preliminary Study of Technical Feasibility in a Rabbit Model. J Vase Interv Radiol 2013;24:744–750. [DOI] [PMC free article] [PubMed] [Google Scholar]
- Gargiulo S, Greco A, Gramanzini M, Esposito S, Affuso A, Brunetti A, Vesce G. Mice anesthesia, analgesia, and care, Part I: anesthetic considerations in preclinical research. ILAR journal 2012;53:E55–69. [DOI] [PubMed] [Google Scholar]
- Harput S, Christensen-Jeffries K, Brown J, Li Y, Williams KJ, Davies AH, Eckersley RJ, Dunsby C, Tang M-X. Two-Stage Motion Correction for Super-Resolution Ultrasound Imaging in Human Lower Limb. IEEE Transactions on Ultrasonics, Ferroelectrics, and Frequency Control 2018;65:803–814. [DOI] [PubMed] [Google Scholar]
- Hingot V, Errico C, Heiles B, Rahal L, Tanter M, Couture O. Microvascular flow dictates the compromise between spatial resolution and acquisition time in Ultrasound Localization Microscopy. Scientific Reports Nature Publishing Group, 2019;9:2456. [DOI] [PMC free article] [PubMed] [Google Scholar]
- Hingot V, Errico C, Tanter M, Couture O. Subwavelength motion-correction for ultrafast ultrasound localization microscopy. Ultrasonics 2017;77:17–21. [DOI] [PubMed] [Google Scholar]
- Hobby JD. Smooth, easy to compute interpolating splines. Discrete Comput Geom 1986;1:123–140. [Google Scholar]
- Huang C, Lowerison MR, Trzasko JD, Manduca A, Bresler Y, Tang S, Gong P, Lok U-W, Song P, Chen S. Short Acquisition Time Super-Resolution Ultrasound Microvessel Imaging via Microbubble Separation. Scientific Reports Nature Publishing Group, 2020a; 10:6007. [DOI] [PMC free article] [PubMed] [Google Scholar]
- Huang C, Zhang W, Gong P, Lok U-W, Tang S, Yin T, Zhang X, Zhu L, Sang M, Song P, Zheng R, Chen S. Super-Resolution Ultrasound Localization Microscopy Based on a High Frame-rate Clinical Ultrasound Scanner: An In-human Feasibility Study. arXiv:200913477 [physics] 2020b. [cited 2020 Oct 7]; Available from: http://arxiv.org/abs/2009.13477 [DOI] [PMC free article] [PubMed] [Google Scholar]
- Jaqaman K, Loerke D, Mettlen M, Kuwata H, Grinstein S, Schmid SL, Danuser G. Robust single-particle tracking in live-cell time-lapse sequences. Nature Methods Nature Publishing Group, 2008;5:695–702. [DOI] [PMC free article] [PubMed] [Google Scholar]
- Kissel M, Berndt S, Fiebig L, Kling S, Ji Q, Gu Q, Lang T, Hafner F-T, Teufel M, Zopf D. Antitumor effects of regorafenib and sorafenib in preclinical models of hepatocellular carcinoma. Oncotarget 2017;8:107096–107108. [DOI] [PMC free article] [PubMed] [Google Scholar]
- Kong W-T, Yuan H-X, Cai H, Wang W-P, Tang Y, Zhang X-L. Early treatment response to sorafenib for rabbit VX2 orthotic liver tumors: evaluation by quantitative contrast-enhanced ultrasound. Tumour Biol 2015;36:2593–2599. [DOI] [PubMed] [Google Scholar]
- Lin F, Shelton SE, Espindola D, Rojas JD, Pinton G, Dayton PA. 3-D Ultrasound Localization Microscopy for Identifying Microvascular Morphology Features of Tumor Angiogenesis at a Resolution Beyond the Diffraction Limit of Conventional Ultrasound. Theranostics 2017;7:196–204. [DOI] [PMC free article] [PubMed] [Google Scholar]
- Llovet JM, Ricci S, Mazzaferro V, Hilgard P, Gane E, Blanc J-F, de Oliveira AC, Santoro A, Raoul J-L, Forner A, Schwartz M, Porta C, Zeuzem S, Bolondi L, Greten TF, Galle PR, Seitz J-F, Borbath I, Häussinger D, Giannaris T, Shan M, Moscovici M, Voliotis D, Bruix J. Sorafenib in Advanced Hepatocellular Carcinoma. New England Journal of Medicine Massachusetts Medical Society, 2008;359:378–390. [DOI] [PubMed] [Google Scholar]
- Lowerison MR, Huang C, Kim Y, Lucien F, Chen S, Song P. In Vivo Confocal Imaging of Fluorescently Labeled Microbubbles: Implications for Ultrasound Localization Microscopy. IEEE Transactions on Ultrasonics, Ferroelectrics, and Frequency Control 2020a;67:1811–1819. [DOI] [PMC free article] [PubMed] [Google Scholar]
- Lowerison MR, Huang C, Lucien F, Chen S, Song P. Ultrasound localization microscopy of renal tumor xenografts in chicken embryo is correlated to hypoxia. Scientific Reports Nature Publishing Group, 2020b; 10:2478. [DOI] [PMC free article] [PubMed] [Google Scholar]
- Parvinian A, Casadaban LC, Gaba RC. Development, growth, propagation, and angiographic utilization of the rabbit VX2 model of liver cancer: a pictorial primer and “how to” guide. Diagn Interv Radiol 2014;20:335–340. [DOI] [PMC free article] [PubMed] [Google Scholar]
- Pham N-A, Morrison A, Schwock J, Aviel-Ronen S, Iakovlev V, Tsao M-S, Ho J, Hedley DW. Quantitative image analysis of immunohistochemical stains using a CMYK color model. Diagn Pathol 2007;2:8. [DOI] [PMC free article] [PubMed] [Google Scholar]
- Schindelin J, Arganda-Carreras I, Frise E, Kaynig V, Longair M, Pietzsch T, Preibisch S, Rueden C, Saalfeld S, Schmid B, Tinevez J-Y, White DJ, Hartenstein V, Eliceiri K, Tomancak P, Cardona A. Fiji: an open-source platform for biological-image analysis. Nature Methods Nature Publishing Group, 2012;9:676–682. [DOI] [PMC free article] [PubMed] [Google Scholar]
- Song P, Manduca A, Trzasko JD, Chen S. Ultrasound Small Vessel Imaging With Block-Wise Adaptive Local Clutter Filtering. IEEE Trans Med Imaging 2017a;36:251–262. [DOI] [PubMed] [Google Scholar]
- Song P, Manduca A, Trzasko JD, Chen S. Noise Equalization for Ultrafast Plane Wave Microvessel Imaging. IEEE Trans Ultrason Ferroelectr Freq Control 2017b;64:1776–1781. [DOI] [PMC free article] [PubMed] [Google Scholar]
- Song P, Trzasko JD, Manduca A, Huang R, Kadirvel R, Kallmes DF, Chen S. Improved Super-Resolution Ultrasound Microvessel Imaging With Spatiotemporal Nonlocal Means Filtering and Bipartite Graph-Based Microbubble Tracking. IEEE Trans Ultrason Ferroelectr Freq Control 2018;65:149–167. [DOI] [PMC free article] [PubMed] [Google Scholar]
- Tearney CC, Barter LS, Pypendop BH. Cardiovascular effects of equipotent doses of isoflurane alone and isoflurane plus fentanyl in New Zealand White rabbits (Oryctolagus cuniculus). Am J Vet Res 2015;76:591–598. [DOI] [PubMed] [Google Scholar]
- Wilhelm SM, Carter C, Tang L, Wilkie D, McNabola A, Rong H, Chen C, Zhang X, Vincent P, McHugh M, Cao Y, Shujath J, Gawlak S, Eveleigh D, Rowley B, Liu L, Adnane L, Lynch M, Auclair D, Taylor I, Gedrich R, Voznesensky A, Riedl B, Post LE, Bollag G, Trail PA. BAY 43-9006 exhibits broad spectrum oral antitumor activity and targets the RAF/MEK/ERK pathway and receptor tyrosine kinases involved in tumor progression and angiogenesis. Cancer Res 2004;64:7099–7109. [DOI] [PubMed] [Google Scholar]
- Xiao X, Chen X, Guan X, Wu H, Qin W, Luo B. Superb microvascular imaging in diagnosis of breast lesions: a comparative study with contrast-enhanced ultrasonographic microvascular imaging. BJR The British Institute of Radiology, 2016;89:20160546. [DOI] [PMC free article] [PubMed] [Google Scholar]
- Yi H-M, Cai B-H, Ai X, Li K-Y, Zhang W. Establishment of Rabbit Liver VX2 Tumor Model Using Percutaneous Puncture Inoculation of Tumor Fragment Guided and Evaluated by Ultrasonography. Curr Med Sci 2019;39:820–824. [DOI] [PubMed] [Google Scholar]
- Zhu J, Rowland EM, Harput S, Riemer K, Leow CH, Clark B, Cox K, Lim A, Christensen-Jeffries K, Zhang G, Brown J, Dunsby C, Eckersley RJ, Weinberg PD, Tang M-X. 3D Super-Resolution US Imaging of Rabbit Lymph Node Vasculature in Vivo by Using Microbubbles. Radiology 2019;291:642–650. [DOI] [PubMed] [Google Scholar]
Associated Data
This section collects any data citations, data availability statements, or supplementary materials included in this article.
Supplementary Materials
Data Availability Statement
The data that support the findings of this study are available from the corresponding authors on request.


