Abstract
Insulin has been shown to elicit changes of Na,K-ATPase activity in various tissues. Na,K-ATPase in the nonpigmented ciliary epithelium (NPE) plays a role in aqueous humor secretion and changes of Na,K-ATPase activity impact the driving force. Because we detect a change of NPE Na,K-ATPase activity in response to insulin, studies were carried out to examine the response mechanism. Ouabain-sensitive rubidium (Rb) uptake by cultured NPE cells, measured as a functional index of Na,K-ATPase-mediated inward potassium transport, was found to increase in cells exposed for 5 min to insulin. The maximally effective concentration was 100 nM. An intrinsic increase of Na,K-ATPase activity evident as a >2-fold increase in the rate of ouabain-sensitive ATP hydrolysis in homogenates obtained from cells exposed to 100 nM insulin for 5 min was also observed. Insulin-treated cells exhibited Akt, Src family kinase (SFK), ERK1/2, and p38 activation, all of which were prevented by a pI3 kinase inhibitor LY294002. The Rb uptake and Na,K-ATPase activity response to insulin both were abolished by PP2, an SFK inhibitor which also prevented p38 and ERK1/2 but not Akt activation. The Akt inhibitor MK-2206 did not change the Na,K-ATPase response to insulin. The findings suggest insulin activates pI3K-dependent Akt and SFK signaling pathways that are separate. ERK1/2 and p38 activation is secondary to and dependent on SFK activation. The increase of Na,K-ATPase activity is dependent on activation of the SFK pathway. The findings are consistent with previous studies that indicate a link between Na,K-ATPase activity and SFK signaling.
Insulin is an important hormone produced, stored and secreted by the pancreatic β cells. In addition to well-known effects on metabolism and glucose transport, insulin influences numerous other cellular functions. Most cells respond to insulin and activation of insulin receptors is known to cause a variety of functional responses. The effect of insulin on cell signaling pathways is widespread. Cells commonly respond to insulin by PI3 kinase, Akt and ERK1/2 activation (Al-Khalili et al., 2004; Comellas et al., 2010; Serhan and Kreydiyyeh, 2011). It has been known for some time that Na,K-ATPase is responsive to insulin (Sweeney and Klip, 1998). In a variety of tissues Na,K-ATPase activity is stimulated by insulin, resulting in increased active transport of potassium ions inward to the cytoplasm. In skeletal muscle insulin stimulates Na,K-ATPase via a signaling response that involves the ERK1/2 pathway (Al-Khalili et al., 2004). In the lung, insulin stimulates Na,K-ATPase and increases alveolar fluid reabsorption by a mechanism that involves Akt signaling and translocation of Na,K-ATPase to the plasma membrane of alveolar epithelial cells (Comellas etal., 2010). Akt signaling also plays a role in insulin-dependent trafficking of Na,K-ATPase by renal tubule epithelial cells (Tirupattur et al., 1993). In many tissues insulin acts at the level of transcription to regulate Na, K-ATPase gene expression and stimulate synthesis of Na,K-ATPase proteins (Russo and Sweadner, 1993).
In the eye, aqueous humor (AH) formation is made possible by the coordinated operation of solute transport mechanisms in the nonpigmented epithelium (NPE) and pigmented epithelium (PE) of the ciliary body. Na,K-ATPase expression is considerably more abundant in the NPE layer that contacts the AH in the interior aqueous compartment (posterior chamber) of the eye (Ghosh et al., 1990). Because AH secretion is dependent on ion gradients established by Na,K-ATPase, we are interested in the cellular signaling mechanisms that modulate Na,K-ATPase activity in NPE cells. It is of interest that α- and β-subunits of the insulin receptor have been localized in the ciliary epithelium (Naeser, 1997). Moreover, a substantial concentration of insulin (54pg/ml) is detectable in aqueous humor (Coulter et al., 1980, 1983). For this reason, we examined the effect of insulin on porcine NPE and report that it causes a marked increase in Na,K-ATPase activity. We were particularly interested in the signaling mechanism involved in the insulin response. In a recent study on nitric oxide-dependent regulation of Na,K-ATPase activity in the NPE, changes in Na,K-ATPase activity were found to be dependent on activation of Src Family Tyrosine Kinases (SFKs) (Shahidullah et al., 2014). Here we provide evidence of a role for SFK activation in the short term Na,K-ATPase response to insulin.
Methods
Cells and reagents
Porcine eyes were obtained from the University of Arizona Meat Science Laboratory or from West Valley Processing Meat Processors (Buckeye, AZ) or Hatfield Quality Meats (Philadelphia, PA). The use of porcine tissue was approved by the University of Arizona Institutional Animal Care and Use Committee and conformed to the ARVO Resolution for the Use of Animals in Ophthalmic and Vision Research. Porcine NPE was established in primary culture as described earlier (Shahidullah et al., 2007) and grown in HEPES-buffered DMEM containing 10% fetal bovine serum. Prior to use, the cell monolayers were serum-starved for at least 3 h and then the medium was replaced with Krebs solution that contained (in mM) 119 NaCl, 4.7 KCl, 1.2 KH2PO4, 25 NaHCO3, 2.5 CaCl2, 1 MgCl2, and 5.5 glucose, equilibrated with 5% CO2 and adjusted to pH 7.4. Experiments were carried out in Krebs solution at 37°C in a humidified incubator, saturated with 95% air and 5% CO2. For experiments involving rubidium (Rb) uptake, the same Krebs solution was modified in which 4.7 mM KCl was replaced with 4.7 mM RbCl and 1.2 mM KH2PO4 with 1.2 mM NaH2PO4.
HEPES-buffered DMEM, fetal bovine serum, newborn calf serum and gentamycin were purchased from Invitrogen (Carlsbad, CA). LY294002, MK-2206, dimethyl sulfoxide (DMSO), ouabain, insulin, and all other chemicals to prepare the Krebs’ solution were purchased from Sigma (St. Louis). Alamethicin and 4-amino-3-(4-chlorophenyl)-1-(t-butyl)-1H-pyrazolo[3,4-d]pyrimidine, 4-amino-5-(4-chlorophenyl)-7-(t-butyl)pyrazolo[3,4-d]pyrimidine (PP2) were purchased from Tocris Biosciences (Minneapolis, MN). Mouse monoclonal anti-Na,K-ATPase α1 antibody was purchased from Sigma (St. Louis). Mouse monoclonal anti-p38 MAPK antibody was purchased from Thermo Scientific (Rochester, NY). Rabbit polyclonal anti phospho-Src-family (Tyr416) antibody, rabbit polyclonal anti-p44/42 MAPK antibody (tERK1/2), mouse monoclonal anti phospho-p44/42 MAPK (Thr-−02/Tyr−204) antibody (phosphor ERK1/2), rabbit polyclonal anti phospho p38 MAPK (Thr l80/Tyr l82) antibody and rabbit polyclonal anti β-actin antibody were obtained from Cell Signaling Technology (Danvers, MA). Mouse monoclonal anti Akt was obtained from Genway Biotech Inc. (San Diego, CA). Rabbit polyclonal anti phospho-Akt (Ser 473) antibody and mouse monoclonal anti β-actin antibody was purchased from Santa Cruz Biotechnology Inc. (Santa Cruz. CA). Goat anti-mouse IRDye 800 conjugated and goat anti-rabbit IRDye 680-conjugated secondary antibodies were purchased from Licor Biosciences (Lincoln, NE).
Measurement of Rb uptake
NPE cells were seeded to 24 well plates at a density of 2.5 × 10⁴ cells/sq.cm and grown to confluent monolayers. The monolayers were serum-starved for 3 h in DMEM and then equilibrated in 1 ml Krebs’ solution for 1 h at 37°C. The Krebs solution was changed and the cells were subjected to specified pretreatment maneuvers before commencement of a 5 min Rb uptake period. Previously, we determined that Rb uptake is linear for 30 min. The pretreatment maneuvers included exposure of the cells to inhibitors. Inhibitor concentrations and incubation times were selected on the basis of our previous studies using these compounds. Cells in normal Krebs solution were preincubated for 40 min with PP2, 30 min with LY294002 or 20 min with MK-2206 and then for an additional 5 min in RbCl-containing Krebs solution ± 100 nM insulin in the continued presence of the inhibitor. Half of the wells in each of the treatment groups also received 500 μM ouabain during the 5 min Rb uptake period. Following the 5 min Rb uptake period, cells were washed three times by submersing the plate in ice-cold isotonic MgCl2 (100 mM) solution containing BaCl2 (2mM). After the last wash, MgCl2 solution was removed by aspiration and the cells in each well were digested in 200 μl of 30% freshly prepared HNO3 by overnight incubation at room temperature. At the end of the incubation period, 1.8 ml of double distilled water was added to each well and the entire content was transferred to a separate tube, then centrifuged at 3000 rpm (1507g) for 10 min. Rb concentration in the supernatant was measured using an atomic absorption spectrophotometer (AAnalyst 100, PerkinElmer, Waltham, MA) at wavelength of 780 nm and a slit width of 0.7 nm. The ouabain-sensitive potassium (Rb) uptake rate was calculated as the difference between uptake in the presence and absence of ouabain and is presented as μM Rb/mg protein/5 min. Six wells of control cells grown on the same plate were used for protein assay and these cells were lysed with 200 μl of double distilled water instead of HNO3. Protein was measured by the bicinchoninic acid (BCA) assay (Smith et al., 1985) (Pierce Biotechnology, Rockford, IL), using bovine serum albumin as a standard.
Na,K-ATPase activity assay
Following incubation in Krebs solution and exposure to insulin as specified elsewhere, the Krebs solution was removed and replaced with 300 μl of ice cold 2 × -strength ATPase assay buffer that contained (in mM): L-Histidine 80; NaCl 200; KCl 10; MgCl2 6.0; EGTA 2.0 (pH 7.4) and Halt Protease Inhibitor Cocktail without EDTA (1:100) (Thermo Scientific, Pierce Biotechnology, Rockford, IL; Cat # 87786). The cell material was then scraped from the dish and placed in a 2.0 ml Eppendorf tube, frozen in liquid nitrogen and stored at −80°C until the Na,K-ATPase assay. The Eppendorf tubes containing treated and control cells were then homogenized for 1 min (4 strokes of 15 sec at 5 sec intervals) using Misonix S3000 sonicator at a 6 W power setting (Misonix, NY). The homogenate was subjected to centrifugation at 13,000g for 30 min at 4°C to remove cell nuclei and larger mitochondria. Protein in the supernatant was measured by bicinchoninic acid (BCA) assay (Smith et al., 1985) (Pierce Biotechnology, Rockford, IL), using bovine serum albumin as a standard. The supernatant was used to measure Na,K-ATPase activity.
Na,K-ATPase activity was measured according to our published method (Shahidullah et al., 2013). Samples obtained from treated or control cells (100 μl) were placed in duplicate tubes and an additional 100 μl of 2× assay buffer was added to each tube. To improve access of ions and ATP to membrane vesicles, alamethicin solution in ethanol (5 μl) was added to give a final approximate concentration of 0.1 mg of alamethicin per mg protein (Xie et al., 1989). Half the tubes received ouabain, a selective Na,K-ATPase inhibitor (final concentration 500 μM) and the remaining tubes received an equivalent volume (5 μl) of distilled water. An additional 150 μl of distilled water was added to each tube. The tubes were pre-incubated at 37°C for 5 min then ATP stock solution (40 μl) was added to each tube (final ATP concentration 2mM) bringing the total assay mixture volume to 400 μl and the concentration of the 2 × -strength Na,K-ATPase buffer to single-strength. The ATP hydrolysis reaction was allowed to proceed for 30 min at 37°C in dim light. Then, the reaction was stopped by adding 150 μl of 15% ice-cold trichloroacetic acid (TCA) and placing the tubes on ice for 20 min.
ATP hydrolysis was determined from the amount of inorganic phosphate released in each reaction tube. To detect inorganic phosphate, each tube was placed in a centrifuge at 3000 rpm (1507g) for 15 min at 4°C, then 400 μl of the supernatant was removed and mixed with 400 μl of 4.0% FeSO4 solution in 1.25% ammonium molybdate solution (1.25 g of ammonium molybdate anhydrous or 7.88 gm of ammonium molybdate tetrahydrate in 100 ml of 2.5N sulfuric acid). Standard solutions containing NaH2PO4 equivalent to 0, 10, 62.5, 125, 250, and 500 nmol of PO4 3−, were treated similarly. After 5 min at room temperature the tubes with the samples (not the standards) were placed in a centrifuge at 3000 rpm (1507g) for 5 min to pellet any additional precipitates. A 250 μl aliquot of each standard or sample was then transferred to each well of a 96-well plate and the absorbance was measured at 750 nm in a Perkin Elmer plate reader (Victor V3, Perkin Elmer, CT). Na,K-ATPase activity is calculated as the difference between ATP hydrolysis in the presence and in the absence of ouabain. Values are presented as nmoles ATP hydrolyzed per milligram protein per 30 min. Because Na,K-ATPase activity as well as ERK1/2 phosphorylation was variable between batches of cells, data from different batches of cells were not pooled.
Western blot analysis
Cells in Krebs’ solution were exposed to insulin as specified elsewhere then the incubation medium was removed and the cells were lysed in 200 μl RIPA buffer containing (in mM) 50 HEPES, 150 NaCl, 1.0 EDTA, 10 sodium pyrophosphate, 2.0 sodium orthovanadate, 10 sodium fluoride, 10% glycerol, 1.0% Triton X-100, 1.0% sodium deoxycholate, Millipore phosphatase cocktail set I and II (1:100) (Billerica, MA; Cat # 524624, and 524625) and Thermo Scientific Halt Protease Inhibitor Cocktail (1:100) (Rockford, IL; Cat # 87786). Cells lysate from each dish was collected in a pre-marked Eppendorf tube and homogenized for 1 min (four strokes of 15 sec at 5 sec intervals) using Misonix S3000 sonicator at a 6 W power setting (Misonix, NY). The homogenate was centrifuged at 13,000g for 30 min, the supernatant collected and protein concentration was measured with a bicinchoninic acid (BCA) protein assay kit (Pierce, Rockford, IL). The supernatant was mixed with Laemmli buffer and the proteins were separated by electrophoresis on a 7.5% SDS–polyacrylamide minigel. Proteins were then transferred by electrophoresis to nitrocellulose membrane which was blocked overnight with a blocking buffer (East Coast Bio, ME). The nitrocellulose membranes were incubated overnight at 4°C with the following primary antibodies: Mouse monoclonal anti-Na,K-ATPase α1 (1;450), rabbit polyclonal anti-p44/42 MAP kinase (1:1000), mouse monoclonal anti phospho-p44/42 MAPK (Thr-202/Tyr-204) (1:2000), mouse monoclonal anti-p38 MAPK (1:1000), rabbit polyclonal anti-phospho p38 (1:1000), mouse monoclonal anti-Akt, rabbit polyclonal anti-phospho Akt, rabbit polyclonal anti-phospho Tyr-416 Src family kinase (1:1000), rabbit polyclonal anti-β-actin (1:3000) and mouse monoclonal anti-β-actin (1:10,000). All antibodies were diluted in the blocking buffer. After three washes in 30 mM Tris, 150 mM NaCl, 0.5% (v/v) Tween 20 (TTBS) at pH 7.4, each nitrocellulose membrane was incubated for 2 h with an appropriate secondary antibody conjugated with IRDye 800 goat anti-mouse or IRDye 680 goat anti-rabbit secondary antibody (1:20,000) (Licor Biosciences). Protein bands were visualized and band density quantified by infrared laser scan detection (LI-COR Odyssey). By using secondary antibodies at two different infrared wavelengths, two proteins were quantified simultaneously (e.g., Atk and phospho-Akt) permitting calculation of a band density ratio.
Statistical analysis
Results are expressed as the mean ± SEM of data from a specified number of independent experiments. Statistical comparisons were made by one-way analysis of variance followed by the Bonferroni post hoc multiple comparison test. To validate the homogeneity of variance assumption, we performed Levene’s test on data sets for Na,K-ATPase assay and Rb uptake study. One-way analysis was performed using Graph Pad Prism (version 5) and Levene’s test was performed using MNITAB (version 16). A probability (P) value of <0.05 was considered significant.
Results
Cultured porcine NPE cells were incubated for 5 min with insulin in the concentration range 10–500 nM. At concentrations of 100 nM or above, insulin caused a significant increase in ouabain-sensitive Rb uptake measured using atomic absorption spectrophotometry (Fig. 1, upper part). The peak response was observed at 100 nM. Because Rb ions are transported in a manner similar to potassium ions, ouabain-sensitive Rb uptake is an index of Na,K-ATPase-mediated active Na-K transport activity. In parallel experiments, cells were incubated with 100 nM insulin for 5 min, 30 min or 3 h, then harvested and frozen in liquid nitrogen before being thawed and homogenized at a later date for determination of Na,K-ATPase activity measured by analysis of ouabain-sensitive ATP hydrolysis. A >2-fold increase in Na,K-ATPase activity was observed in homogenates prepared from cells that had been exposed to insulin for 5 min (Fig. 1, lower part). Longer duration insulin treatment (30 min or 3 h) failed to cause a detectable increase in Na,K-ATPase activity.
Fig. 1.
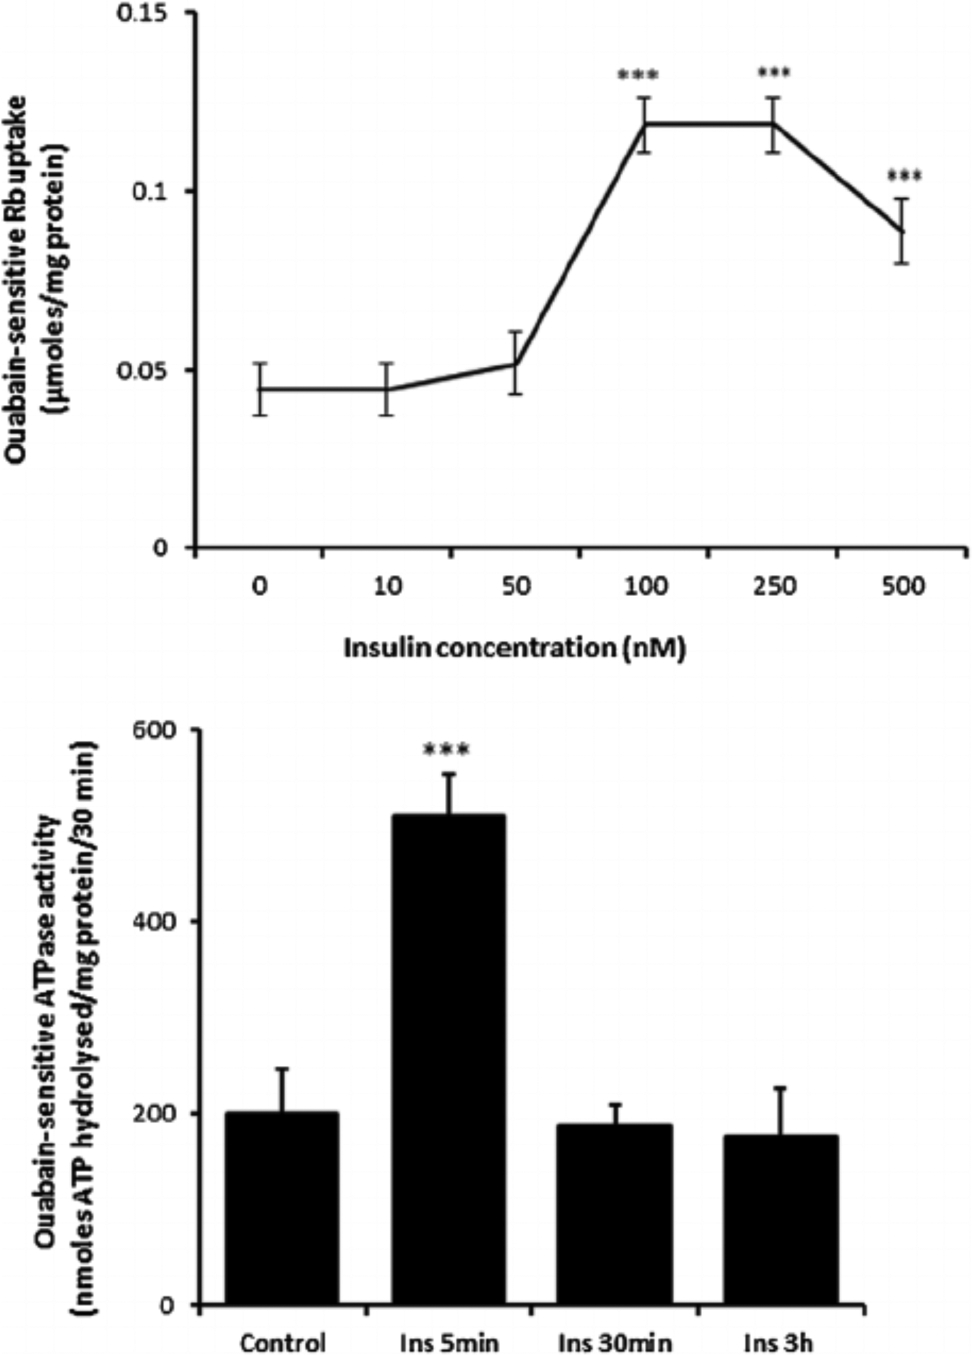
The influence of insulin on ouabain-sensitive Rb uptake and Na,K-ATPase activity. Upper part: Ouabain-sensitive Rb uptake measured in cells exposed for 5 min to insulin (10–500 nM) or vehicle (control) in Rb-containing Krebs solution. Half of the cells in each group also received ouabain (500 μM) and ouabain-sensitive Rb uptake was calculated as the difference between uptake in the presence and absence of ouabain. Lower part: Na,K-ATPase activity (ouabain-sensitive ATP hydrolysis rate) measured in homogenates prepared from cells previously exposed for 5 min, 30 min, or 3h to 100 nM insulin or vehicle (control) in Krebs solution. ATP hydrolysis in the treated and control groups was measured under identical conditions. The values are the mean ± SEM of results from four to six independent experiments. ***(p < 0001) indicates a significant difference from control.
Studies were carried out to examine the signaling pathways activated by insulin. Cells exposed to 100 nM insulin displayed SFK activation as judged by an increase in pY416 Western blot band density that peaked at 1–2 min and returned to baseline within 5 min (Fig. 2, upper part). Transient phosphorylation (activation) of p38 MAPK also was observed to peak at 2 min and then reversed toward baseline (Fig. 2, lower part). Insulin treatment caused a slower but more pronounced increase in band density for phospho-ERK1/2 and phospho-Akt, but band density for both remained elevated at 5 min (Fig. 3). SFK activation did not occur when cells were exposed to insulin in the presence of the SFK inhibitor PP2 and similarly, p38 activation was prevented by the MAPK inhibitor SB202190 (Fig. 4). Insulin-dependent ERK1/2 and Akt phosphorylation was prevented respectively by U0126 and MK-2206 which are recognized as inhibitors for the ERK1/2 and MAPK pathways (Fig. 5).
Fig. 2.
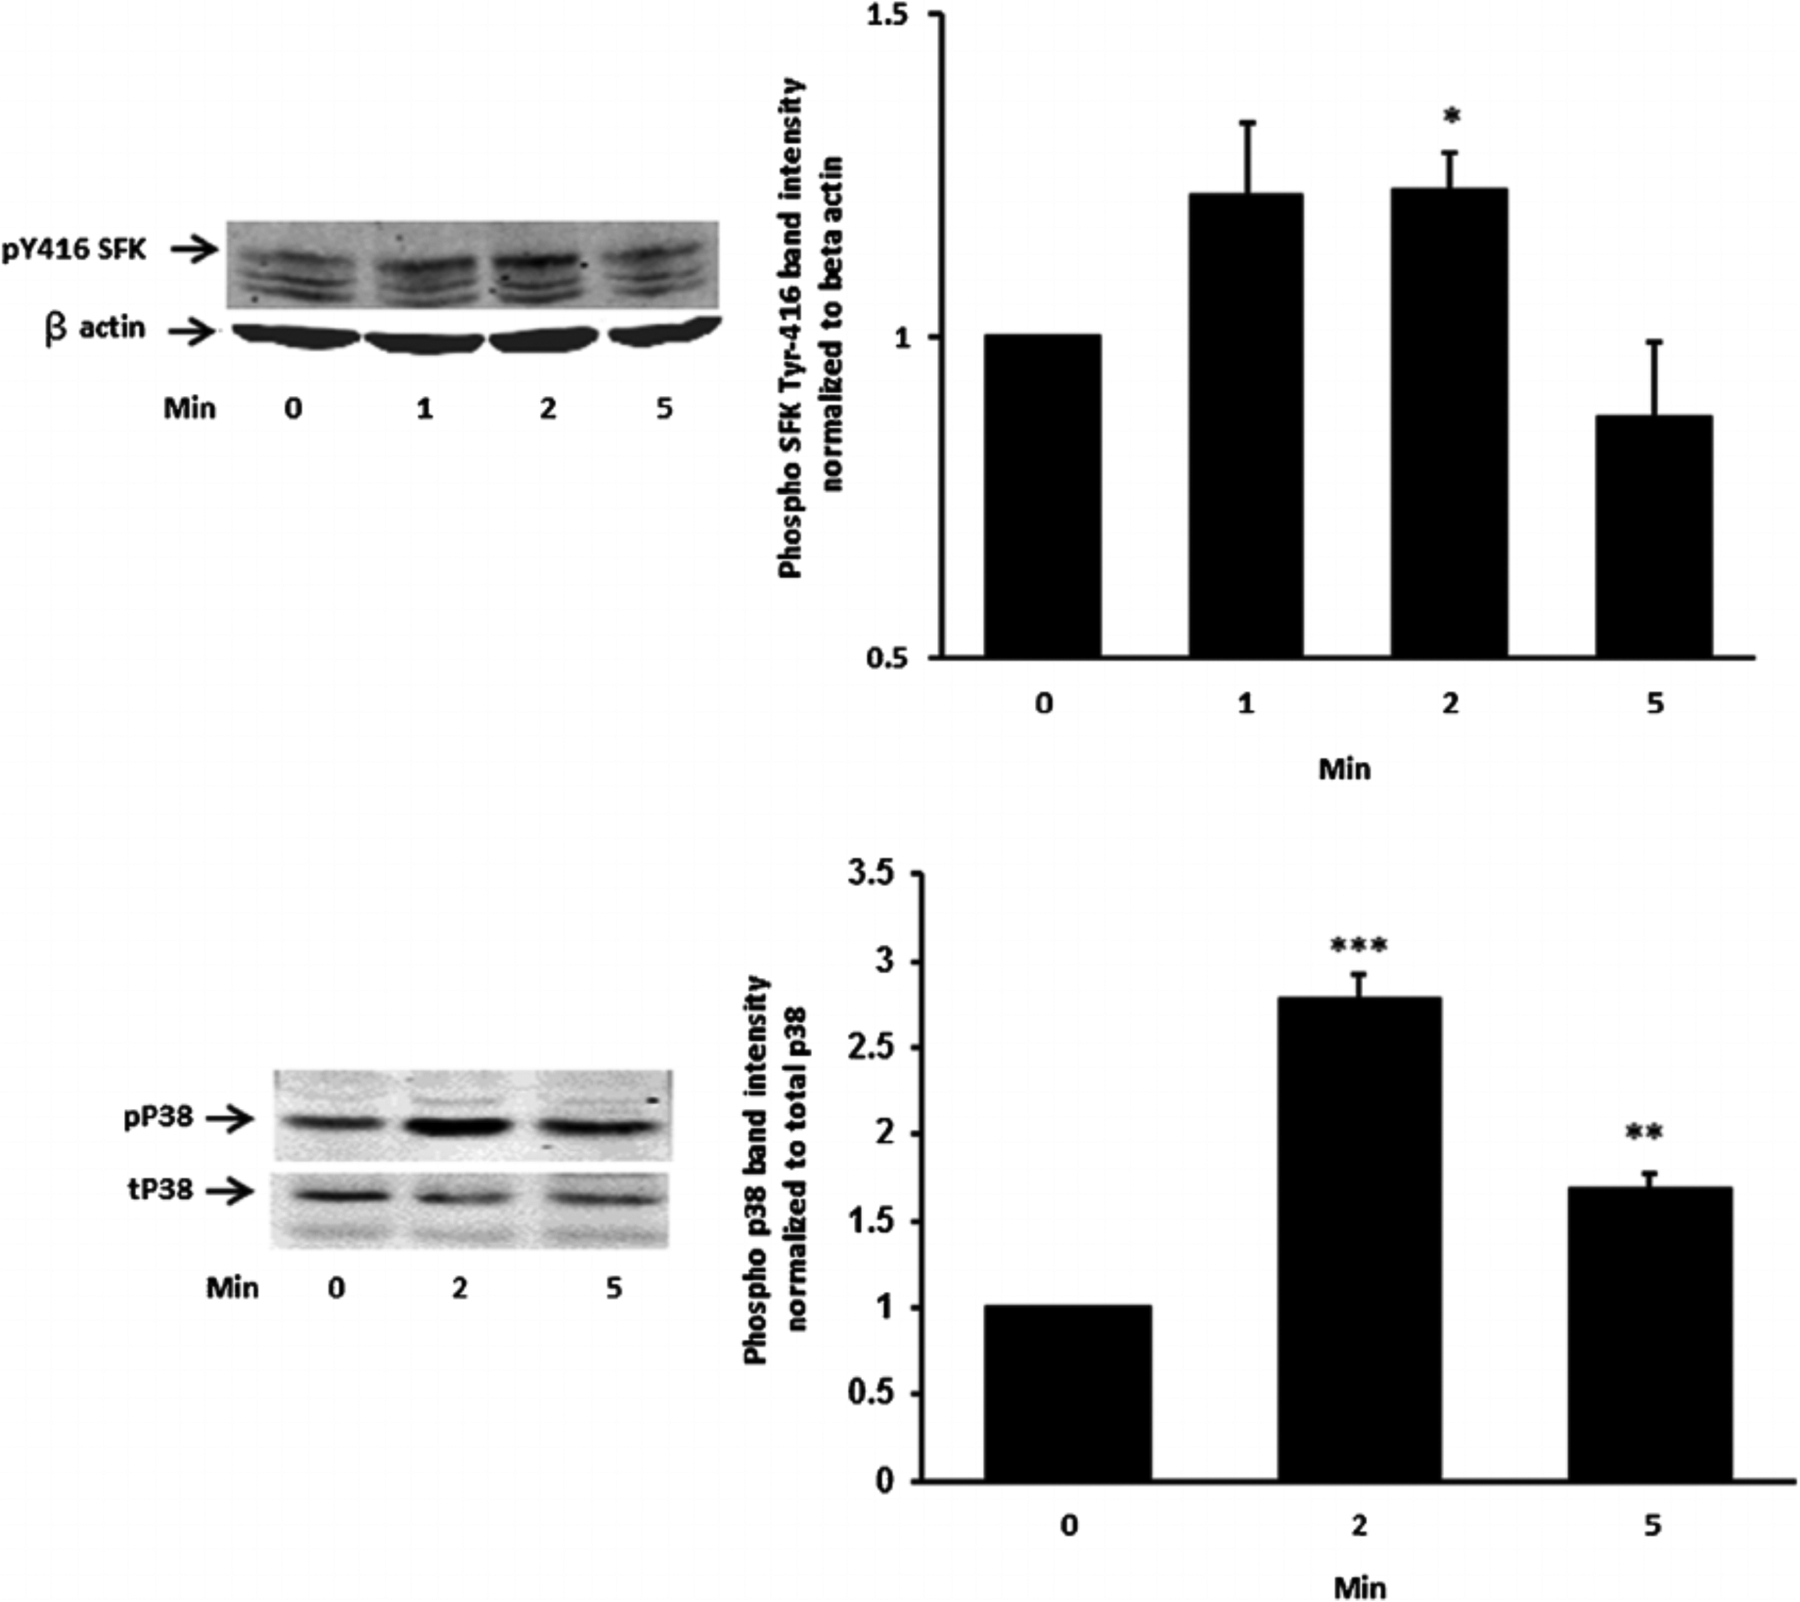
The time course of the insulin effect on Src family kinase (SFK) and p38 MAPK phosphorylation. Cells were exposed to 100 nM insulin for 0 (control), 2 or 5 min, homogenized and subjected to Western blot analysis for pSFK 416 and β actin (upper part) and phosphor p38 MAPK and total p38 (lower part). Increased band density signifies SFK or p38 activation. Each part shows a representative Western blot on the left and on the right the mean ±SEM of band density from three independent experiments. *(P < .05),**(P < 0.01) and ***(P < 0.001) indicate significant differences from control.
Fig. 3.
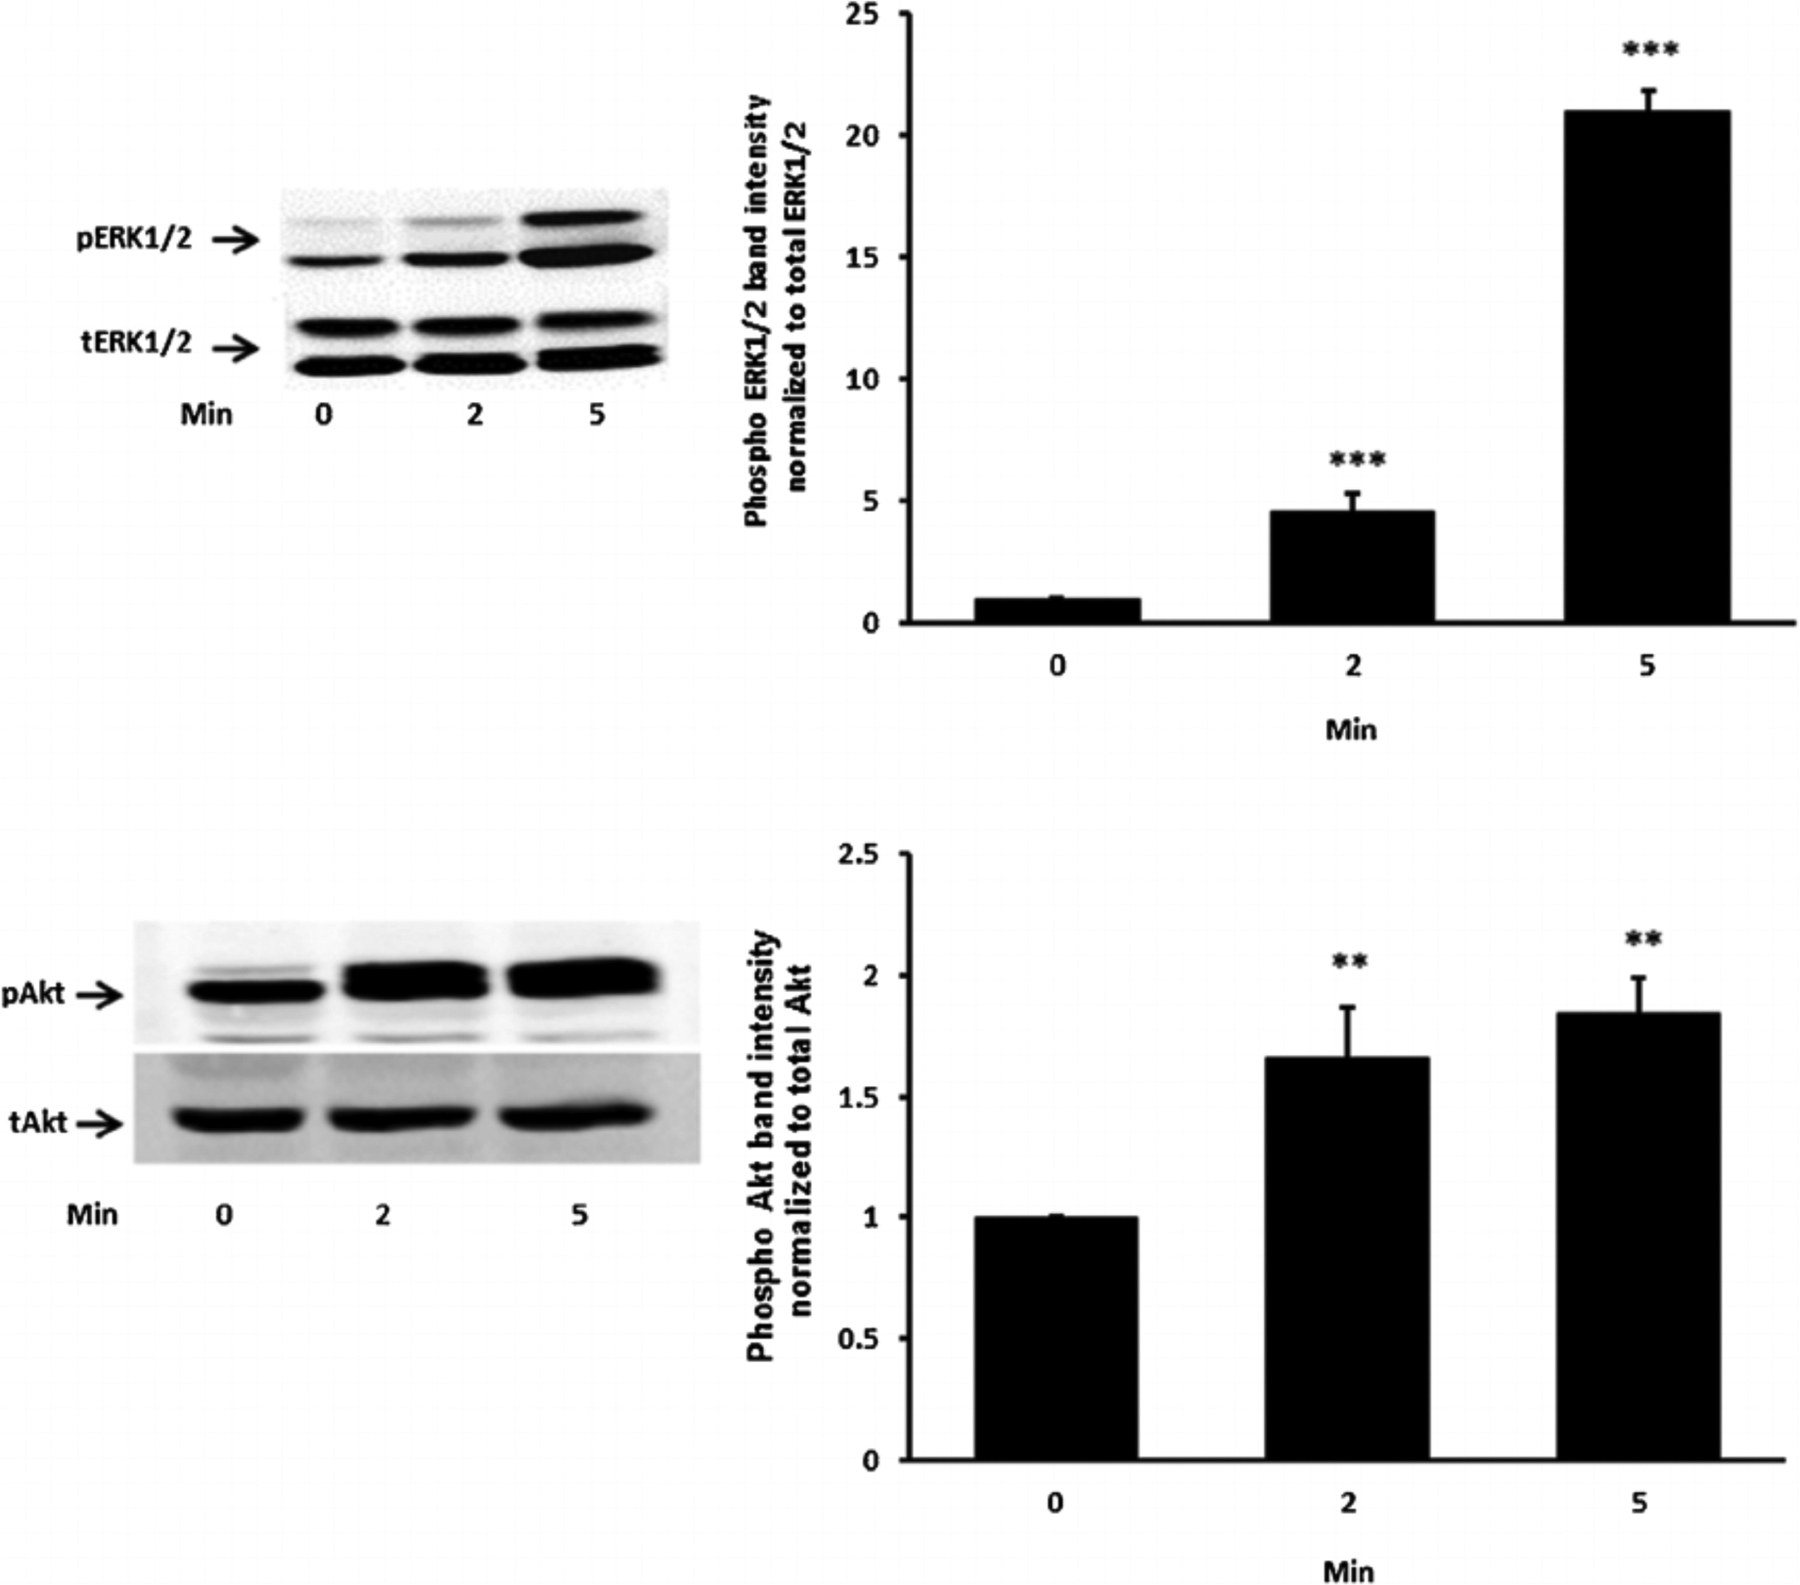
The time course of the insulin effect on ERK1/2 and Akt phosphorylation. Cells were exposed to 100 nM insulin up to 5 min, homogenized and subjected to Western blot analysis for PERK1/2 and total ERK1/2 (upper part) and pAkt and total Akt (lower part). Increased band density signifies ERK1/2 or Akt activation. Each part shows a representative Western blot on the left and on the right the mean ± SEM of phospho vs total band density ratios calculated from three independent experiments. **(P < 0.01) and ***(P < 0.001) indicate significant differences from control.
Fig. 4.
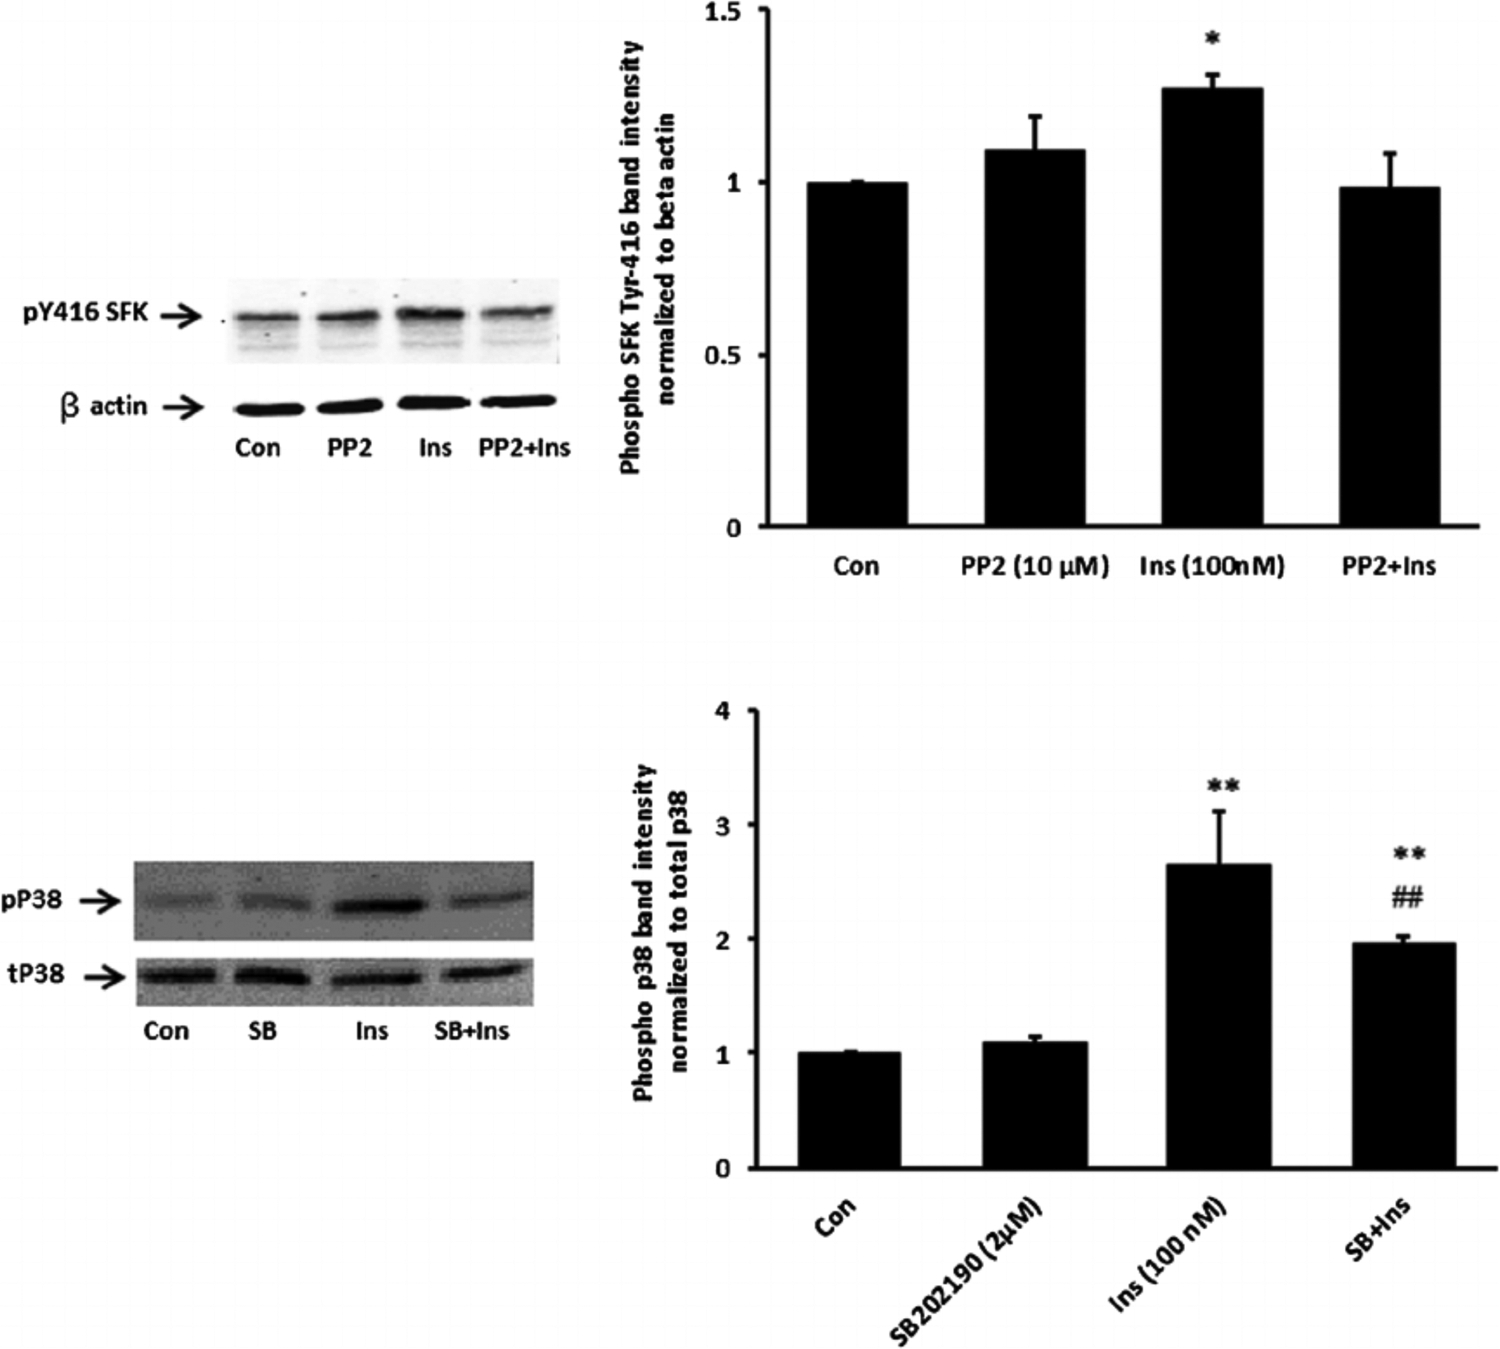
Inhibition of SFK and p38 activation responses to insulin. Cells were pretreated with an SFK inhibitor PP2(10 μM) for 40 min or a p38 inhibitor SB202190 (2 μM) for 20 min and then were exposed to insulin (100 nM) for 2 min before Western blot analysis for pSFK 416 and β actin (upper part) and phospho p38 MAPK and total p38 (lower part). Some cells received insulin alone and control cells received neither insulin nor inhibitor. Each part shows a representative Western blot on the left and on the right the mean ± SEM of band density from three independent experiments. *(P < 0.05), **(P < 0.01), and ***(p < 0.001) indicate significant differences from control. - (P < 0.01) indicates a significant difference from insulin treatment.
Fig. 5.
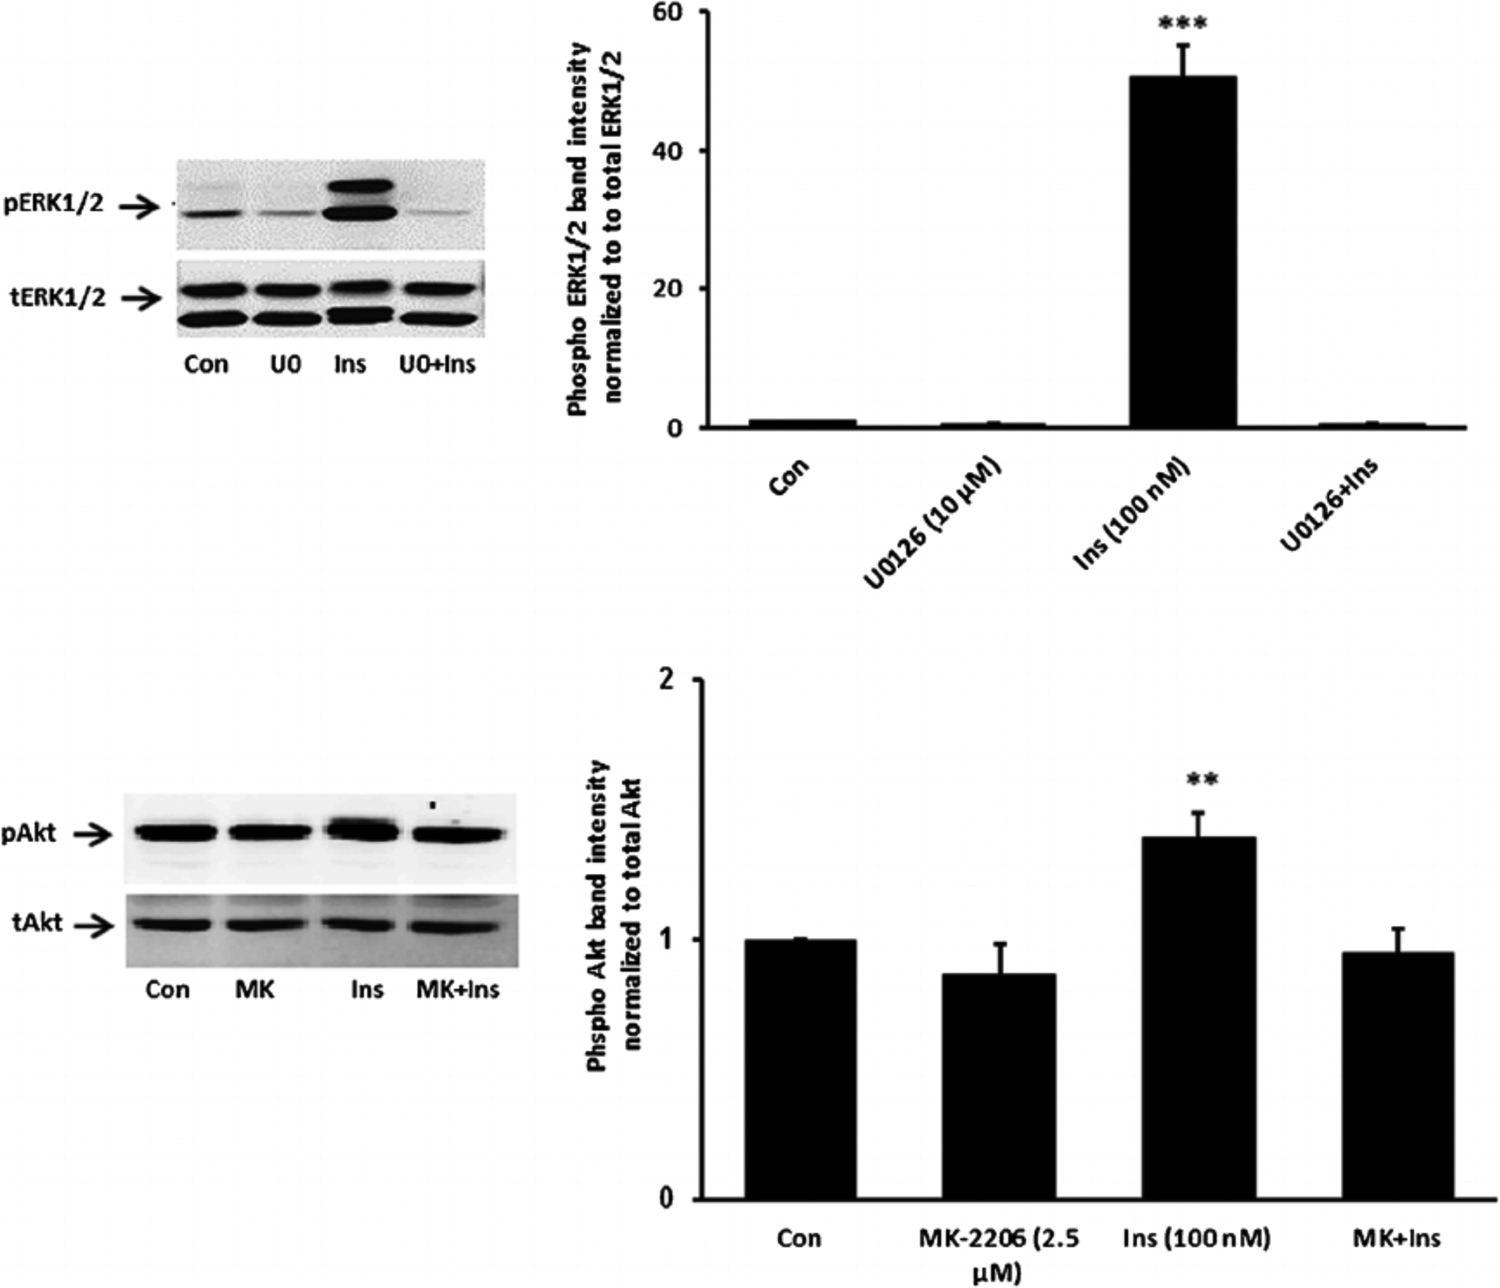
Inhibition of ERK1/2 and Akt activation responses to insulin. Cells were pretreated with an ERK inhibitor U0126 (10 μM) or an Akt inhibitor MK-2206 (2.5 μM) for 20 min and then were exposed to insulin (100 nM) for 5 min before Western blot analysis for pERK1/2 and total ERK1/2 (upper part) and pAkt and total Akt (lower part). Some cells received insulin alone and control cells received neither insulin nor inhibitor. Each part shows a representative Western blot on the left and on the right the mean ± SEM of band density from three independent experiments. **(P < 0.01) and *** (P < 0.001) indicate significant differences from control.
When cells were exposed to insulin in the presence of PP2 neither ERK1/2 phosphorylation nor p38 MAPK phosphorylation occurred (Fig. 6). The pattern of responses suggests that ERK1/2 and p38 MAPK activation in insulin treated cells is SFK-dependent. In contrast PP2 did not suppress insulin-induced Akt phosphorylation (Fig. 6, lower part). Activation of PI3 kinase (PI3K) is widely recognized as an early step in the signaling response to Insulin. Consistent with such a mechanism, SFK and Akt phosphorylation both failed to occur when cells were exposed to insulin in the presence of a selective PI3K inhibitor, LY294002 (Fig. 7). Taken together, the evidence is consistent with a mechanism in which insulin activates two independent signaling pathways, both of which are initiated by PI3 kinase. One pathway activates SFK and subsequent ERK1/2 and p38 MAPK phosphorylation. Another pathway activates Akt. Studies were conducted to determine which pathways are associated with the Na,K-ATPase response to insulin.
Fig. 6.
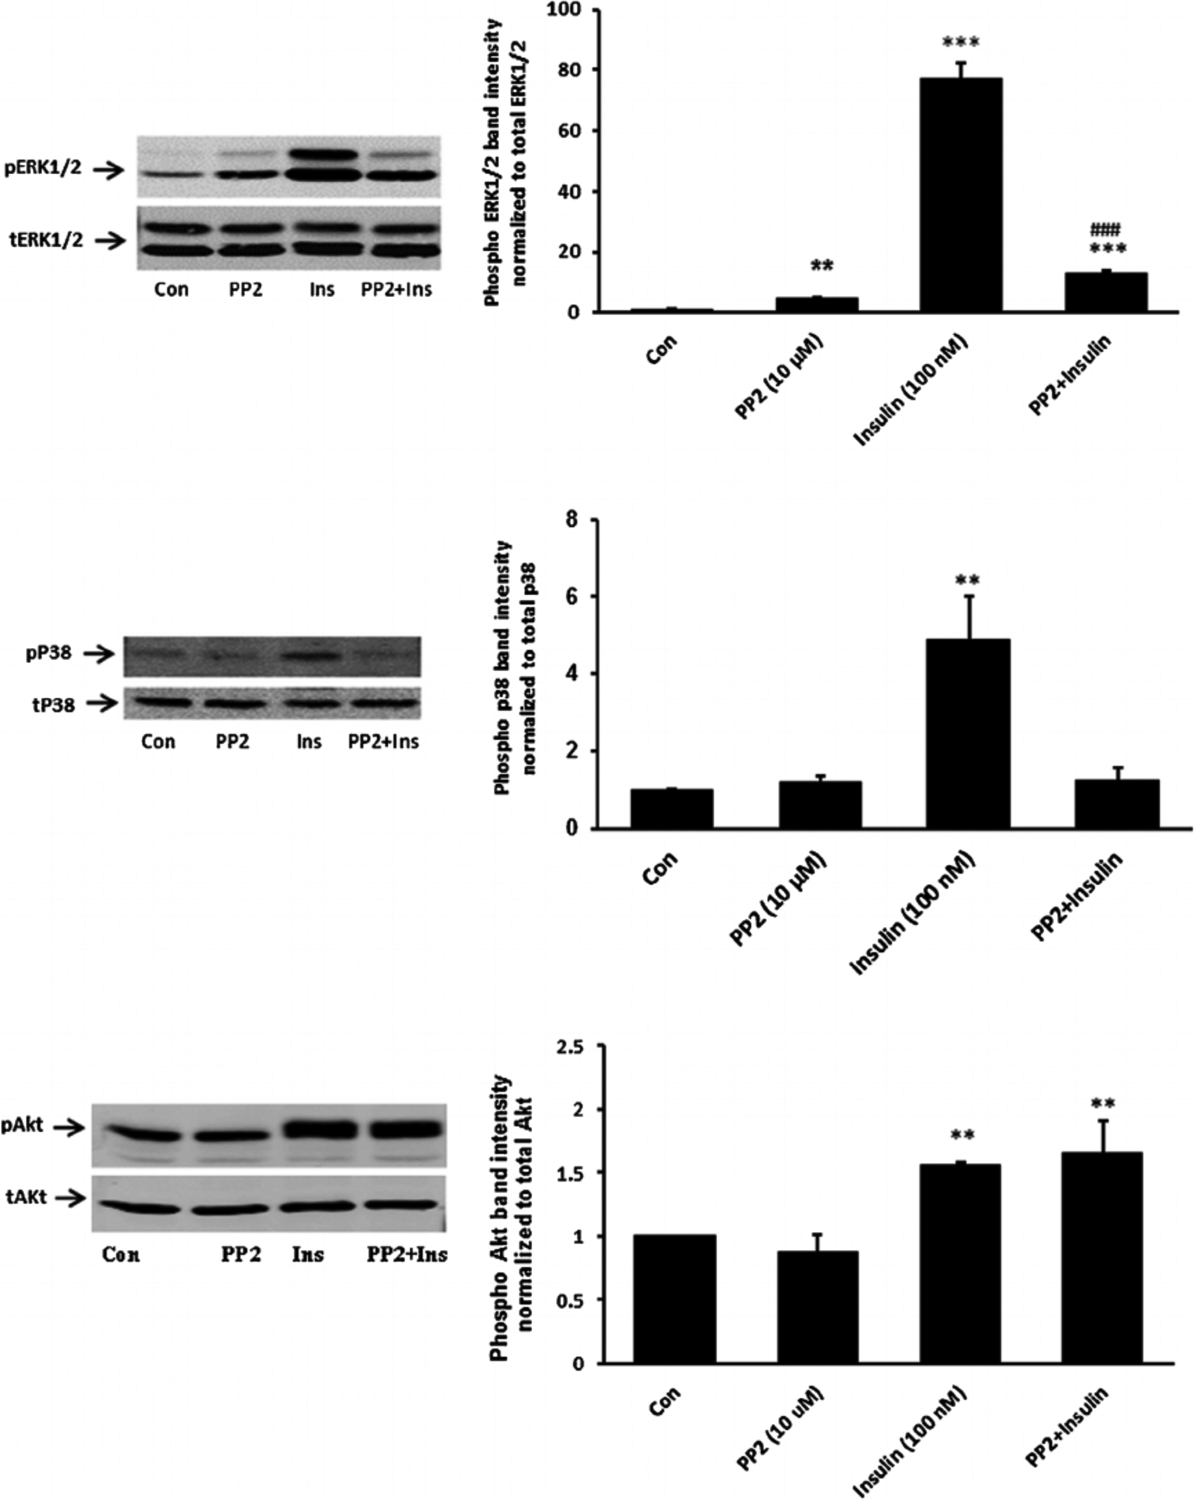
The influence of the SFK inhibitor PP2 on p38, ERK1/2 and Akt activation responses to insulin. Cells were pretreated with PP2 (10 μM) for 40 min and then were exposed to insulin (100 nM) for either 2 min before Western blot analysis for phospho p38 (middle part) or received insulin for 5 min before western blot analysis for pERK1/2 (upper part) and pAkt (lower part). Some cells received insulin alone and control cells received neither insulin nor inhibitor. Each part shows a representative Western blot on the left and on the right the mean ± SEM of band density from three independent experiments. **(P < 0.01) and *** (P < 0.001) indicate significant differences from control. −#(P < 0.001) indicates a significant difference from insulin treatment.
Fig. 7.
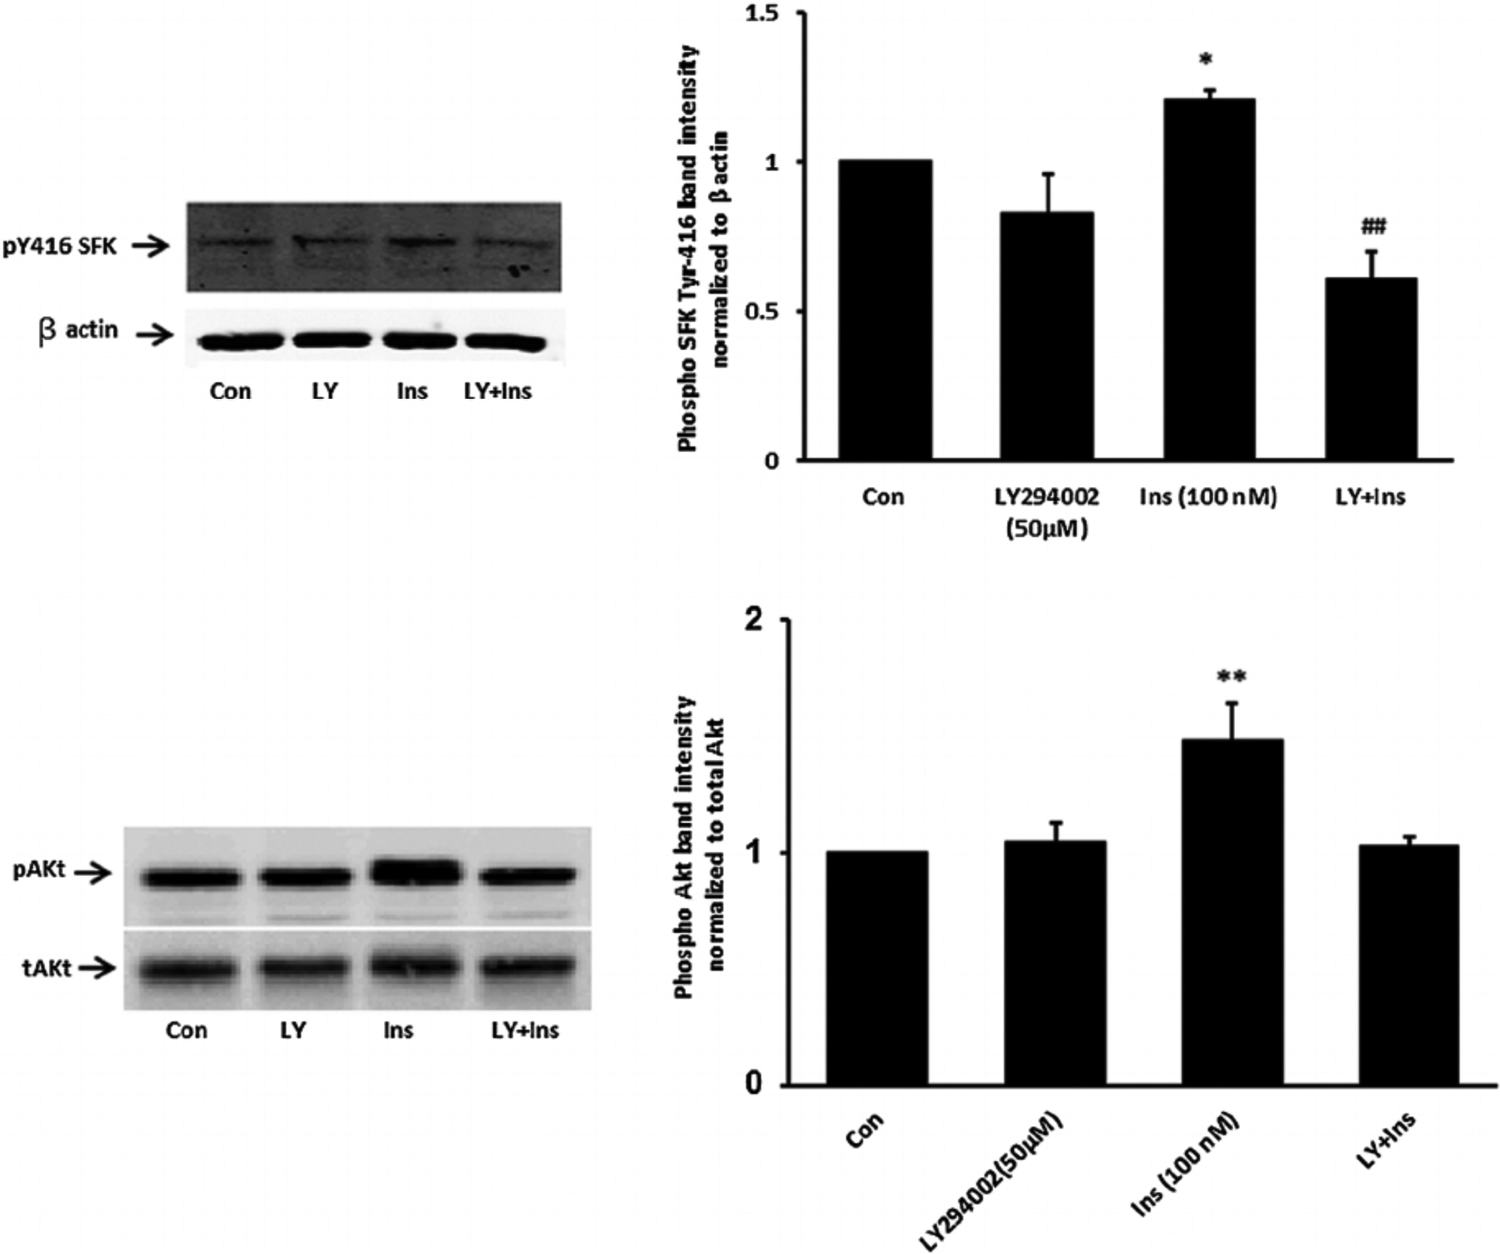
The influence of the phosphatidylinositol 3-kinase (PI3K) inhibitor LY294002 on SFK and Akt activation responses to insulin. Cells were pretreated with LY294002 (50 μM) for 30 min and then were exposed to insulin (100 nM) for either 2 min before Western blot analysis for pSFK and β actin (upper part) or received insulin for 5 min before western blot analysis for pAkt (lower part) and pAkt (lower part). Some cells received insulin alone and control cells received neither insulin nor inhibitor. Each part shows a representative Western blot on the left and on the right the mean ± SEM of band density from three independent experiments. (P < 0.05) and **(P < 0.01) indicate significant differences from control. −(P < .01) indicates a significant difference from insulin treatment.
When cells were exposed to insulin in the presence of either the PI3K inhibitor, LY294002, or the SFK inhibitor PP2, the Na,K-ATPase response failed to occur. LY294002 and PP2 both abolished the insulin-induced stimulation of ouabain-sensitive Rb uptake as well as the increase in ouabain-sensitive ATP hydrolysis activity measured in cell homogenates (Fig. 8, upper and middle part, respectively). The Akt inhibitor MK-2206 failed to alter the insulin-induced stimulation of ouabain-sensitive Rb uptake or the increase in ouabain-sensitive ATP hydrolysis activity measured in cell homogenates the Na,K-ATPase response (Fig. 8, lower part). The Na,K-ATPase response to insulin persisted in the presence of the ERK1/2 inhibitor U0126 but with a reduced magnitude. In the presence of U0126, insulin increased ouabain-sensitive ATP hydrolysis activity by ~80% compared to an increase of 170% in the absence of U0126 (Fig. 9, upper part, left). However, the combination of SFK inhibitor PP2 and ERK1/2 inhibitor U0126, completely prevented an insulin-induced increase of Na,K-ATPase activity (Fig. 9) as did PP2 alone (Fig. 8). The p38 MAPK inhibitor SB-202190 failed to produce any influence on insulin-induced increase in Na,K-ATPase activity (Fig. 9, lower part). A schematic diagram of the mechanistic pathway for insulin in stimulating Na, K-ATPase activity has been shown (Fig. 10).
Fig. 8.
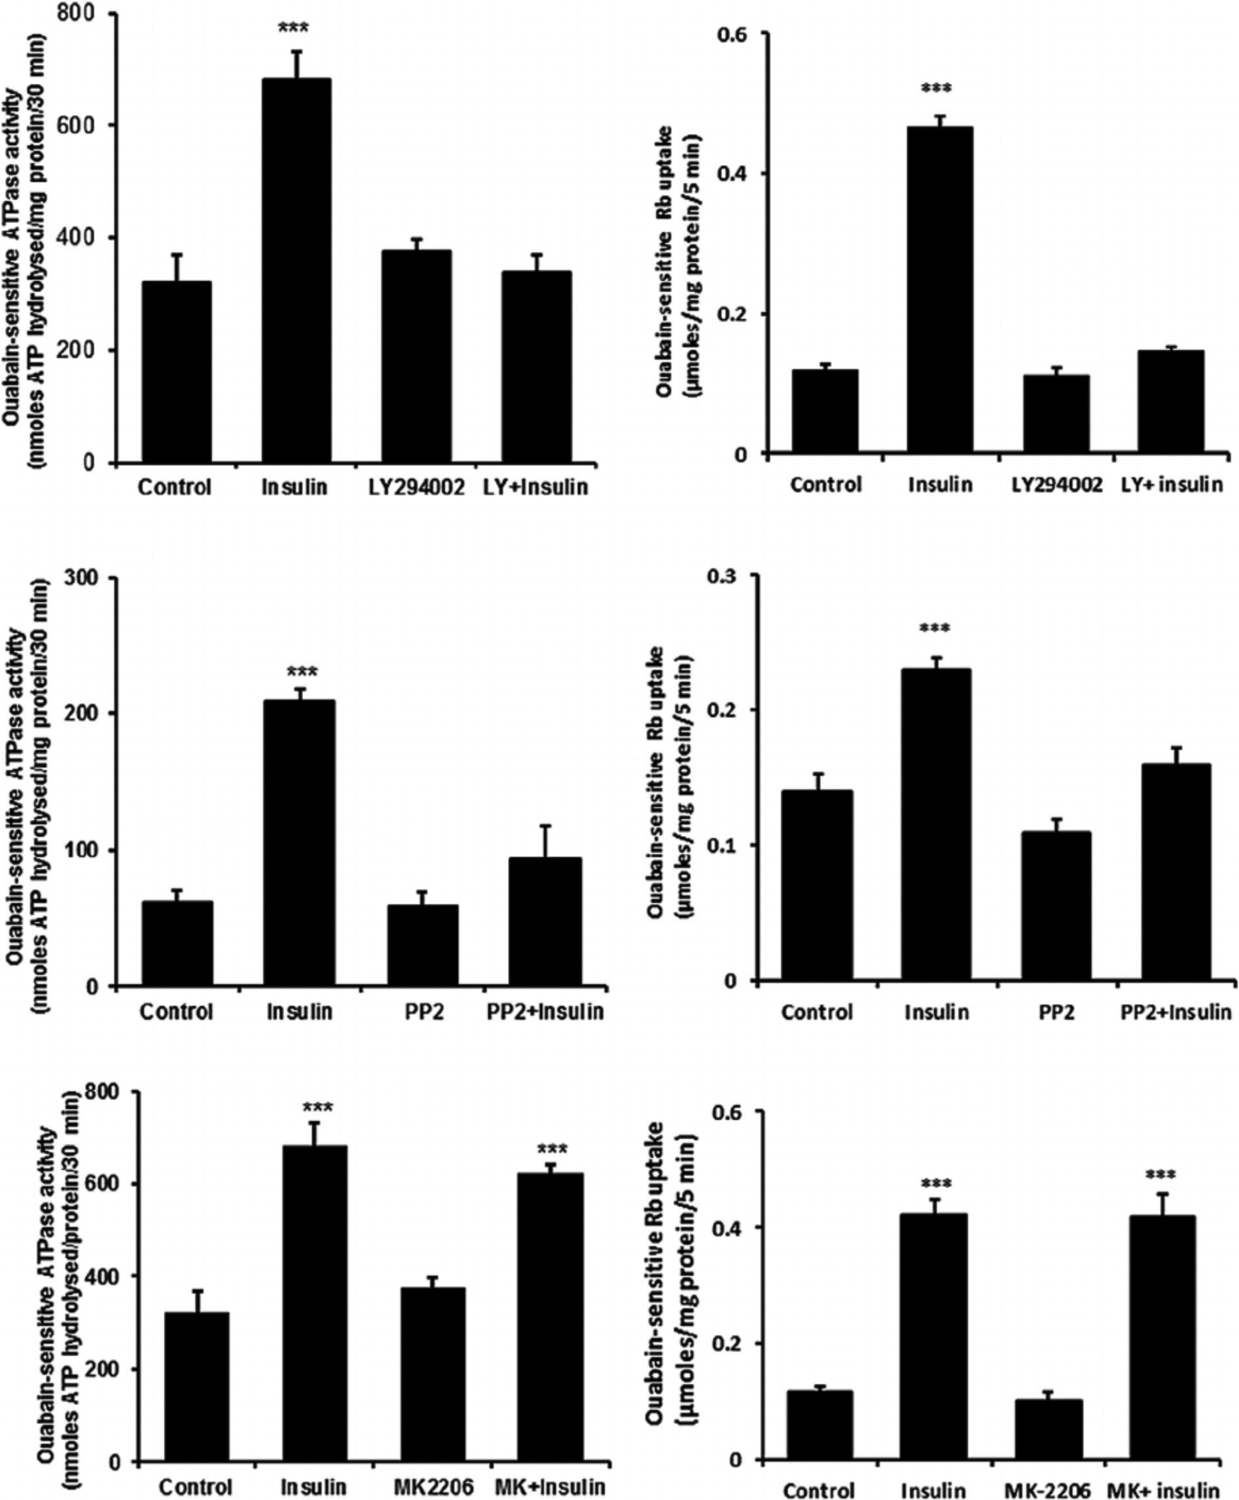
The effect of LY294002, PP2 and MK-2206 on the Na,K-ATPase activity and ouabain-sensitive Rb uptake responses to insulin. Cells were exposed to PP2 (10 μM) for a total of 40 min, LY294002 (50 μM) for 30 min or MK-2206 (2.5 μM) for 20 min. Right side parts show ouabain-sensitive Rb uptake measured during the final 5 min when 100 nM insulin or vehicle (control) was added in Rb-containing Krebs solution. Half of the cells in each group also received ouabain (500 μM) and ouabain-sensitive Rb uptake was calculated as the difference between uptake in the presence and absence of ouabain. Left side parts show Na,K-ATPase activity (ouabain-sensitive ATP hydrolysis rate) measured in homogenates prepared from cells similarly exposed to the inhibitors and then to 100 nM insulin for 5 min. ATP hydrolysis in the treated and control groups was measured under identical conditions. Values shown are the mean ± SEM of results from five to six independent experiments. ***(p < 0001) indicates a significant difference from control. Levene’s test shows no heteroscedasticity in either set of data with P-values of 0.836 for Na,K-ATPase activity and 0.856 for the Rb uptake data sets, respectively.
Fig. 9.
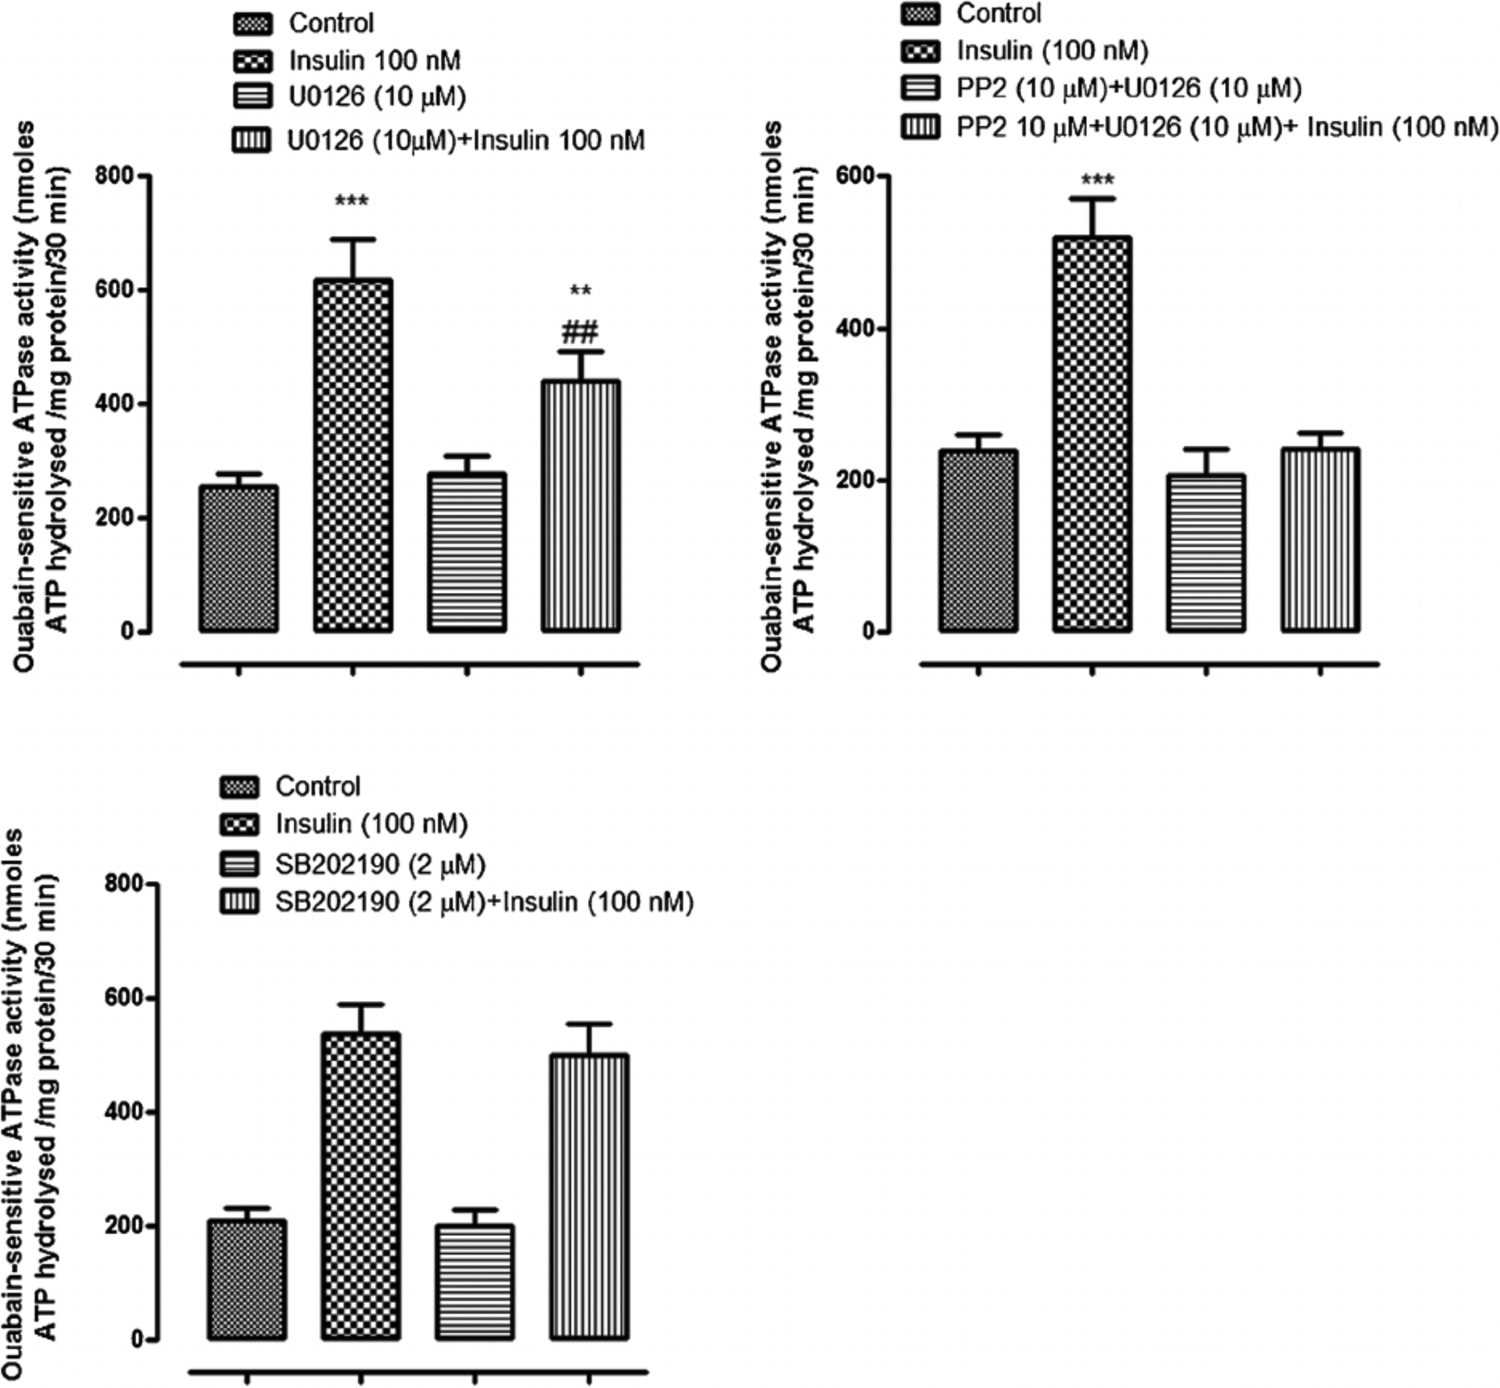
The influence of ERK1/2 inhibitor U0126, SFK inhibitor PP2 and p38 inhibitor SB202I90, on the insulin-induced increase in Na,K-ATPase activity. Na,K-ATPase activity (ouabain-sensitive ATP hydrolysis rate) was measured in homogenates prepared from cells pretreated with U0126 (10 μM) (upper left part) or SB202190 (2 μM) (lower part) for 20 min or with PP2 (upper right part) for 40 min then exposed to 100 nM insulin for 5 min in the continued presence of the respective inhibitor. Some cells were exposed to insulin alone and control cells received neither insulin nor inhibitor. Values shown are the mean ± SEM of results from four independent experiments. **(P < 0.01) and ***(p < 0.001) indicate significant differences from control. -(P < 0.01) indicates a significant difference from insulin treatment.
Fig. 10.
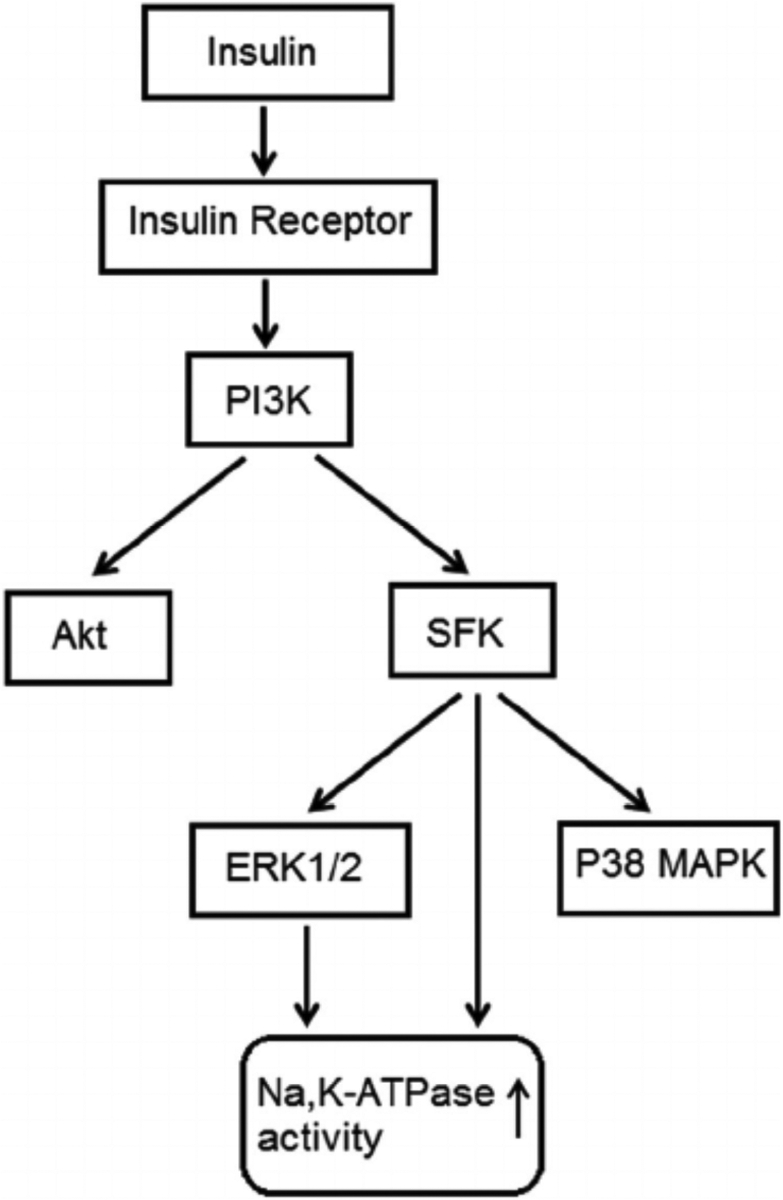
Simplified diagram showing SFK activation and other signaling pathways activated by insulin.
Discussion
Although insulin signaling in ocular tissues has not been a focus of great attention, several investigators have reported insulin receptors on tissues that contact the aqueous humor. Insulin receptors are expressed by lens epithelium, corneal endothelium and ciliary epithelium (Naeser, 1997). Here we show that exposure to insulin stimulates Na,K-ATPase-mediated active transport by the nonpigmented ciliary epithelium (NPE) as judged by an increase of ouabain-sensitive Rb uptake. The rate of active transport was more than doubled in cells exposed to insulin for 5 min. Importantly, the response aligned with an intrinsic increase of Na,K-ATPase activity. When measured under control conditions in which sodium, potassium and ATP concentrations are set by the buffer and no insulin is present, the rate of ouabain-sensitive ATP hydrolysis was elevated more than twofold in membrane preparations obtained from cells previously exposed to insulin for 5 min. Taken together, the findings suggest insulin activates short term regulation of Na,K-ATPase activity.
Previous studies indicate that Na,K-ATPase activity in the NPE is subject to short term regulation by Src family tyrosine kinases (SFKs) (Mandal et al., 2011; Shahidullah et al., 2012, 2013, 2014) and we sought to determine whether this contributes to the insulin response. Not surprisingly, insulin was found to activate multiplesignaling pathways including SFK, Akt, ERK1/2 and p38 MAP kinase. SFK stimulation maximally after 2 min of insulin exposure and diminished to baseline by 5 was observed to be transient. Judged by Western blot analysis, SFK activation occurred min. p38 activation also was transient and was maximal after 2 min of insulin treatment. Akt and ERK1/2 activation was less rapid and remained elevated after 5 min of insulin treatment. SFK activation could be prevented by exposing cells to insulin in the presence of PP2 which is a recognized SFK inhibitor. Consistent with expectations, p38 activation was suppressed by the inhibitor SB202190, Akt activation was suppressed by MK2206, and ERK1/2 was suppressed by U0126. Interestingly, PP2 prevented p38 and ERK1/2 activation but not Akt activation. The findings are consistent with a response in which p38 and ERK1/2, but not Akt activation, occur downstream of SFK activation in insulin-treated cells (Fig. 10) This fits with our previous report of SFK-dependent ERK1/2 and p38 MAPK activation in NPE cells exposed to nitric oxide donors (Shahidullah et al., 2014). In many instances, PI3 kinase activation is an early step in the insulin signaling response (Serhan and Kreydiyyeh, 2011) and this was the case here. The PI3 kinase inhibitor LY294002 suppressed SFK activation as well as Akt activation.
To examine the signaling pathway associated with the observed increase in Na,K-ATPase activity, cells were exposed to insulin in the presence of PP2, MK2206 or LY294002. Consistent with a role for SFK activation in the Na,K-ATPase response to insulin, the insulin-dependent increase in both ouabain-sensitive Rb uptake and Na,K-ATPase activity was abolished by the SFK inhibitor PP2. In keeping with SFK activation downstream of PI3 kinase, the Na,K-ATPase response was also prevented when LY294002 was used to prevent PI3 kinase activation. Blockade of ERK1/2 activation partially diminished, but did not prevent the Na,K-ATPase activity increase (Fig. 9) and the response appeared insensitive to Akt blockade (Fig. 8).
Taken together, the findings are consistent with a complex signaling response to insulin and a critical role for SFK activation in the short term stimulation of Na,K-ATPase activity that occurs. In other cells and tissues, short term changes of Na,K-ATPase activity have been associated directly or indirectly with Akt, p38 and ERK1/2 signaling (Al-Khalili et al., 2004; Khundmiri et al., 2004; Shahidullah et al., 2014). Here, even though there was evidence of ERK1/2, Akt and p38 activation in insulin-treated NPE cells, the findings suggest Na, K-ATPase stimulation is linked principally to SFK activation. There was evidence for a partial contribution of ERK1/2 activation to the Na,K-ATPase activity response but the impact of the ERK1/2 inhibitor U0126 was small compared to the impact of SFK inhibition by PP2. Figure 10 shows a simplified mechanism for the signaling response.
The observed responses to insulin offer some mechanistic insight into the influence of activation on ERK1/2 and subsequent effects on Na,K-ATPase. The fact that U0126 significantly reduced the magnitude of the insulin-induced increase of Na,K-ATPase activity strongly suggests ERK1/2 activation can independently modulate Na,K-ATPase activity. We propose that although ERK1/2 phosphorylation is dependent on SFK phosphorylation, ERK1/2 phosphorylation (activation) can independently lead to an increase in Na,K-ATPase activity. There is a question as to which member or members of the SFK family was involved in the activation of Na,K-ATPase activity in insulin-treated cells since the western blot studies indicated more than one SFK. The phospho-SFK Western blots show three bands at apparent molecular weights consistent with Src or Fyn (~60 kDa), Lck (~56 kDa), or Lyn (~53 kDa). Earlier studies suggest that activation of different SFK family members can have different effects on Na,K-ATPase activity (Mandal et al., 2011). Thus the observed increase in Na,K-ATPase activity could only be explained as a net response to two or more SFKs acting simultaneously. It would be difficult to tease apart the contribution of individual SFKs because selective inhibitors for individual SFK members are not available.
Stimulation of Na,K-ATPase activity by insulin is well documented in other tissues but much of the focus has been on long term responses that involve increased synthesis of Na,K-ATPase protein (Shahidullah et al., 20I4). The rapid timing of the response makes this unlikely to explain the Na,K-ATPase response to insulin in NPE cells. Moreover, no detectable increase in Western blot band density for Na,K-ATPase alpha subunit protein was observed in cells exposed to insulin for 5 min (data not shown). Stimulation of Na,K-ATPase-mediated active transport by insulin also has been attributed to trafficking of Na,K-ATPase protein to the plasma membrane and as the indirect consequence of altered sodium or potassium ion entry or exit (Omatsu-Kanbe and Kitasato, 1990; Al-Khalili et al., 2003; Khundmiri et al., 2004; Lecuona et al., 2006; Comellas et al.,2010). Such a mechanism does not appear consistent with the intrinsic change of ouabain-sensitive ATP hydrolysis Na,K-ATPase activity measured in homogenized samples prepared from insulin treated NPE cells. More recently it has been suggested that insulin signaling may reverse the binding of Translationally Controlled Tumor Protein (TCTP) to the Na,K-ATPase alpha subunit and so cause Na,K-ATPase activity to increase (Koevary et al., 2004). In insulin-treated NPE cells, the evidence presented here suggests SFK activation plays a major role in the Na,K-ATPase response. A role for SFK activation in short term regulation of Na,K-ATPase activity has been documented previously in other tissues. For example, an SFK-dependent increase of Na,K-ATPase activity has been shown previously to occur in lens epithelium when the lens is subjected to hyposmotic swelling or exposed to ATP and other purinergic agonists (Tamiya et al., 2007; Shahidullah et al., 2012). There also are instances in which SFK activation is associated with Na,K-ATPase activity inhibition (Shahidullah et al., 2013, 2014). It has been suggested that different members of the Src kinase family may elicit different Na,K-ATPase activity responses. When intact lenses are exposed to endothelin-1, SFK-dependent Na,K-ATPase activity occurs in the lens epithelium (Mandal et al., 2011). It is noteworthy that nitric oxide was found to cause an SFK-dependent decrease of Na,K-ATPase activity in NPE (Shahidullah et al., 2014).
The source of insulin in aqueous humor is unclear and its molecular weight (~5800 Da) means it is unlikely to move freely across the blood aqueous barrier. Insulin is detectable in cerebrospinal fluid and local synthesis by CNS tissues has been suggested (Plata-Salamán, 1991). More recent studies, however, suggested that insulin might cross the blood-brain-barrier via a saturable transporter (Banks et al., 1997; Banks et al., 2012). Most cells respond to insulin and the NPE is subjected to a lower concentration than many other tissues. In rabbits the insulin concentration in aqueous humor is 3% that in blood plasma (Coulter et al., 1983). Insulin has been shown to influence Na,K-ATPase activity and cellular function in a variety of tissues (Sweeney and Klip, 1998; Al-Khalili et al., 2004; Serhan and Kreydiyyeh, 2011) including an increase of alveolar fluid reabsorption (Comellas et al., 2010). In ciliary epithelium, it was reported that insulin reduced aqueous humor secretion in patients with type 1 diabetes compared with healthy control subjects (Lane et al., 2001, 2010). Furthermore, α- and β-subunits of the insulin receptor have been localized in the ciliary epithelium (Naeser, 1997). Given the importance of Na,K-ATPase in the secretion of aqueous humor, the significance of the present study lies in understanding the signaling mechanisms that regulate Na,K-ATPase activity and the influence of a major metabolic hormone like insulin. It is interesting to note that elevated IOP has been associated with diabetes (Becker et al., 1966; Jain and Luthra, 1967; Jain et al., 1969; Klein et al., 1994; Tielsch et al., 1995; Dielemans et al., 1996; Leske et al., 1996; Pasquale et al., 2006; Lane et al., 2010) and that there is higher prevalence of glaucoma among individuals with diabetes mellitus (Cristiansson, 1965; Becker, 1967; Madsen, 1971). The Blue Mountain Eye Study revealed a significant and consistent association between diabetes and open angle glaucoma (Mitchell et al., 1997). Further studies are necessary to understand the possible influence of insulin on aqueous secretion by the NPE. Mechanistically, however, the insulin response reveals interesting aspects of short term Na, K-ATPase activity regulation. Insulin was found to activate independent SFK and Akt signaling pathways in porcine NPE and both are initiated by PI3K activation (Fig. 10). Akt activation has no discernable effect on Na,K-ATPase activity but the Na, K-ATPase response to insulin in NPE cells is clear cut and reinforces the link between Na,K-ATPase activity and SFK signaling.
Acknowledgments
The authors are grateful to the University of Arizona Meat Science laboratory, West Valley Processing Meat Processors (Buckeye, AZ) and Hatfield Quality Meat, Pennsylvania, for the supply of porcine eyes. The authors are thankful to Dr Chiu-Hsieh Hsu, Associate Professor, Department of Epidemiology and Biostatistics, University of Arizona, for assistance with statistical analysis of data. The corresponding author and the co-authors have no conflict of interest to declare. This research was supported by a grant from the National Institute of Health (Grant EY006915).
Contract grant sponsor:
National Institute of Health;
Contract grant number:
EY006915.
Literature Cited
- Al-Khalili L, Kotova O, Tsuchida H, Ehren I, Feraille E, Krook A, Chibalin AV. 2004. ERK1/2 mediates insulin stimulation of Na(+),K(+)-ATPase by phosphorylation of the alpha-subunit in human skeletal muscle cells. J Biol Chem 279:25211–25218. [DOI] [PubMed] [Google Scholar]
- Al-Khalili L, Krook A, Chibalin AV. 2003. Phosphorylation of the Na+,K+–ATPase in skeletal muscle: Potential mechanism for changes in pump cell-surface abundance and activity. Ann N Y Acad Sci 986:449–452. [DOI] [PubMed] [Google Scholar]
- Banks WA, Jaspan JB, Huang W, Kastin AJ. 1997. Transport of insulin across the blood-brain barrier: Saturability at euglycemic doses of insulin. Peptides 18:1423–1429. [DOI] [PubMed] [Google Scholar]
- Banks WA, Owen JB, Erickson MA. 2012. Insulin in the brain: There and back again. Pharmacol Ther 136:82–93. [DOI] [PMC free article] [PubMed] [Google Scholar]
- Becker B 1967. Diabetetes and glaucoma. In: Kimura ST, Caygill WM, editors. Vascular complications of diabetes mellitus. St. Louis: CV Mosby. pp 43–61. [Google Scholar]
- Becker B, Bresnick G, Chevrette L, Kolker AE, Oaks MC, Cibis A. 1966. Intraocular pressure and its response to topical corticosteroids in diabetes. Arch Ophthalmol 76:477–483. [DOI] [PubMed] [Google Scholar]
- Comellas AP, Kelly AM, Trejo HE, Briva A, Lee J, Sznajder JI, Dada LA. 2010. Insulin regulates alveolar epithelial function by inducing Na+/K+–ATPase translocation to the plasma me mbrane in a process mediated by the action of Akt. J Cell Sci 123:1343–1351. [DOI] [PMC free article] [PubMed] [Google Scholar]
- Coulter JB III, Engelke JA, Eaton DK. 1980. Insulin concentration in aqueous humor after paracentesis and feeding of rabbits. Invest Ophthalmol Vis Sci 19:1524–1526. [PubMed] [Google Scholar]
- Coulter JB III, Engelke JA, Eaton DK. 1983. Insulin concentration in aqueous humor of rabbits: Effects of alloxan-diabetes and insulin treatment. Exp Eye Res 37:153–157. [DOI] [PubMed] [Google Scholar]
- Cristiansson J 1965. Glaucoma simplex in diabetes mellitus. Acta Ophthalmologica 43:224–234. [DOI] [PubMed] [Google Scholar]
- Dielemans I, de Jong PTVM, Stolk R, Vingerling JR, Grobbee DE, Hofman A. 1996. Primary open-angle glaucoma, intraocular pressure, and diabetes mellitus in the general elderly population: The rotterdam study. Ophthalmology 103:1271–1275. [DOI] [PubMed] [Google Scholar]
- Ghosh S, Freitag AC, Martin-Vasallo P, Coca-Prados M. 1990. Cellular distribution and differential gene expression of the three alpha subunit isoforms of the Na,K-ATPase in the ocular ciliary epithelium. J Biol Chem 265:2935–2940. [PubMed] [Google Scholar]
- Jain IS, Gill MM, Rastogi GK. 1969. Intraocular pressure in young diabetics and its relationship with diabetic retinopathy. J All India Ophthalmol Soc 17:91–94. [PubMed] [Google Scholar]
- Jain IS, Luthra CL. 1967. Diabetic retinopathy. Its relationship with intraocular pressure. Arch Ophthalmol 78:198–200. [DOI] [PubMed] [Google Scholar]
- Khundmiri SJ, Bertorello AM, Delamere NA, Lederer ED. 2004. Clathrin-mediated endocytosis of Na+,K+–ATPase in response to parathyroid hormone requires ERK-dependent phosphorylation of Ser-11 within the alpha1-subunit. J Biol Chem 279:17418–17427. [DOI] [PubMed] [Google Scholar]
- Klein BE, Klein R, Jensen SC. 1994. Open-angle glaucoma and older-onset diabetes. The beaver dam eye study. Ophthalmology 101:1173–1177. [DOI] [PubMed] [Google Scholar]
- Koevary SB, Lam V, Patsiopoulos G. 2004. Pharmacokinetics of insulin uptake by ocular tissues and the role of cerebrospinal fluid in optic nerve insulin accumulation following topical insulin application. Optometry 75:183–188. [DOI] [PubMed] [Google Scholar]
- Lane J, Larson L, Fan S, Stoner J, Margalit E, Toris C. 2010. Intraocular pressure and aqueous humor flow during a euglycemic-hyperinsulinemic clamp in patients with type 1 diabetes and microvascular complications. BMC Ophthalmol 10:19. [DOI] [PMC free article] [PubMed] [Google Scholar]
- Lane JT, Toris CB, Nakhle SN, Chacko DM, Wang Y-L, Yablonski ME. 2001. Acute effects of insulin on aqueous humor flow in patients with type 1 diabetes. Am J Ophthalmol 132:321–327. [DOI] [PubMed] [Google Scholar]
- Lecuona E, Dada LA, Sun H, Butti ML, Zhou G, Chew T-L, Sznajder JI. 2006. Na,K-ATPase alpha1-subunit dephosphorylation by protein phosphatase 2A is necessary for its recruitment to the plasma membrane. FASEB J 20:2618–2620. [DOI] [PubMed] [Google Scholar]
- Leske MC, Warheit-Roberts L, Wu SY. 1996. Open-angle glaucoma and ocular hypertension: The long island glaucoma case-control study. Ophthalmic Epidemiol 3:85–96. [DOI] [PubMed] [Google Scholar]
- Madsen PH. 1971. Ocular findings in 123 patients with proliferative diabetic retinopathy. II. Intraocular pressure. Doc Ophthalmol 29:345–349. [DOI] [PubMed] [Google Scholar]
- Mandal A, Shahidullah M, Beimgraben C, Delamere NA. 2011. The effect of endothelin-1 on Src-family tyrosine kinases and Na,K-ATPase activity in porcine lens epithelium. J Cell Physiol 226:2555–2561. [DOI] [PMC free article] [PubMed] [Google Scholar]
- Mitchell P, Smith W, Chey T, Healey PR. 1997. Open-angle glaucoma and diabetes: The blue mountains eye study, Australia. Ophthalmology 104:712–718. [DOI] [PubMed] [Google Scholar]
- Naeser P 1997. Insulin receptors in human ocular tissues. Immunohistochemical demonstration in normal and diabetic eyes. Ups J Med Sci 102:35–40. [DOI] [PubMed] [Google Scholar]
- Omatsu-Kanbe M, Kitasato H. 1990. Insulin stimulates the translocation of Na+/K(+)-dependent ATPase molecules from intracellular stores to the plasma membrane in frog skeletal muscle. Biochem J 272:727–733. [DOI] [PMC free article] [PubMed] [Google Scholar]
- Pasquale LR, Kang JH, Manson JE, Willett WC, Rosner BA, Hankinson SE. 2006. Prospective study of type 2 diabetes mellitus and risk of primary open-angle glaucoma in women. Ophthalmology 113:1081–1086. [DOI] [PubMed] [Google Scholar]
- Plata-Salamán CR. 1991. Insulin in the cerebrospinal fluid. Neurosci Biobehav Rev 15:243–258. [DOI] [PubMed] [Google Scholar]
- Russo JJ, Sweadner KJ. 1993. Na(+)-K(+)-ATPase subunit isoform pattern modification by mitogenic insulin concentration in 3T3-L1 preadipocytes. Am J Physiol 264: C311–C316. [DOI] [PubMed] [Google Scholar]
- Serhan MF, Kreydiyyeh SI. 2011. Insulin targets the Na(+)/K(+) ATPase in enterocytes via PI3K, PKC, and MAPKS. J Recept Signal Transduct Res 31:299–306. [DOI] [PubMed] [Google Scholar]
- Shahidullah M, Mandal A, Delamere NA. 2012. TRPV4 in porcine lens epithelium regulates hemichannel-mediated ATP release and Na-K-ATPase activity. Am J Physiol Cell Physiol 302:C1751–C1761. [DOI] [PMC free article] [PubMed] [Google Scholar]
- Shahidullah M, Mandal A, Wei G, Delamere NA. 2014. Nitric oxide regulation of Na,K-ATPase activity in ocular ciliary epithelium involves src family kinase. J Cell Physiol 229:343–352. [DOI] [PMC free article] [PubMed] [Google Scholar]
- Shahidullah M, Tamiya S, Delamere NA. 2007. Primary culture of porcine nonpigmented ciliary epithelium. Curr Eye Res 32:511–522. [DOI] [PMC free article] [PubMed] [Google Scholar]
- Shahidullah M, Wei G, Delamere NA. 2013. DIDS inhibits Na,K-ATPase activity in porcine nonpigmented ciliary epithelium by a Src family kinase-dependent mechanism. Am J Physiol Cell Physiol 305:C492–C501. [DOI] [PMC free article] [PubMed] [Google Scholar]
- Smith PK, Krohn RI, Hermanson GT, Mallia AK, Gartner FH, Provenzano MD, Fujimoto EK, Goeke NM, Olson BJ, Klenk DC. 1985. Measurement of protein using bicinchoninic acid. Anal Biochem 150:76–85. [DOI] [PubMed] [Google Scholar]
- Sweeney G, Klip A. 1998. Regulation ofthe Na+/K+–ATPase by insulin: Why and how? Mol Cell Biochem 182:121–133. [PubMed] [Google Scholar]
- Tamiya S, Okafor MC, Delamere NA. 2007. Purinergic agonists stimulate lens Na-K-ATPase-mediated transport via a Src tyrosine kinase-dependent pathway. Am J Physiol Cell Physiol 293:C790–C796. [DOI] [PubMed] [Google Scholar]
- Tielsch JM, Katz J, Quigley HA, Javitt JC, Sommer A. 1995. Diabetes, intraocular pressure, and primary open-angle glaucoma in the baltimore eye survey. Ophthalmology 102:48–53. [DOI] [PubMed] [Google Scholar]
- Tirupattur PR, Ram JL, Standley PR, Sowers JR. 1993. Regulation of Na+,K(+)-ATPase gene expression by insulin in vascular smooth muscle cells. Am J Hypertens 6:626–629. [DOI] [PubMed] [Google Scholar]
- Xie ZJ,Wang YH, Ganjeizadeh M, McGee R Jr., Askari A. 1989. Determination of total (Na++K+)-ATPase activity of isolated or cultured cells. Anal Biochem 183:215–219. [DOI] [PubMed] [Google Scholar]


