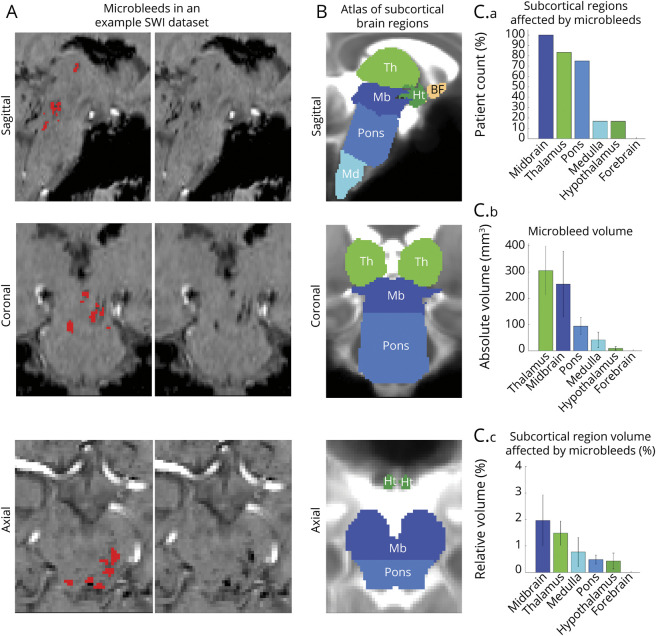
Figure 2. Evaluation of Microbleeds in Subcortical Arousal Regions.
(A) An example susceptibility-weighted imaging (SWI) dataset in stereotactic Montreal Neurologic Institute (MNI) space is shown along with manually delineated microbleeds (red), identified as SWI hypointensities within a microbleed search-mask. (B) Overlaid on a T2-weighted image in stereotactic space, we show the traumatic microbleed search-mask including regions involved in arousal, such as the brainstem (midbrain [Mb], dark blue; pons, light blue; and medulla [Md], cyan), thalamus (Th) (light green), hypothalamus (Ht) (dark green), and basal forebrain (BF) (copper). (C.a) Count of patients with deep arousal regions affected by microbleeds (range 0%–100%, corresponding to 0–12 patients). (C.b) Volume of microbleeds within each deep arousal region. (C.c) Volume of microbleeds (within each deep arousal region) relative to the volume of each region. Note the higher incidence and volume of microbleeds in the midbrain, thalamus, and pons compared to the medulla and hypothalamus (no occurrence in the BF), and the relatively small fraction of deep region volume affected by microbleeds.

