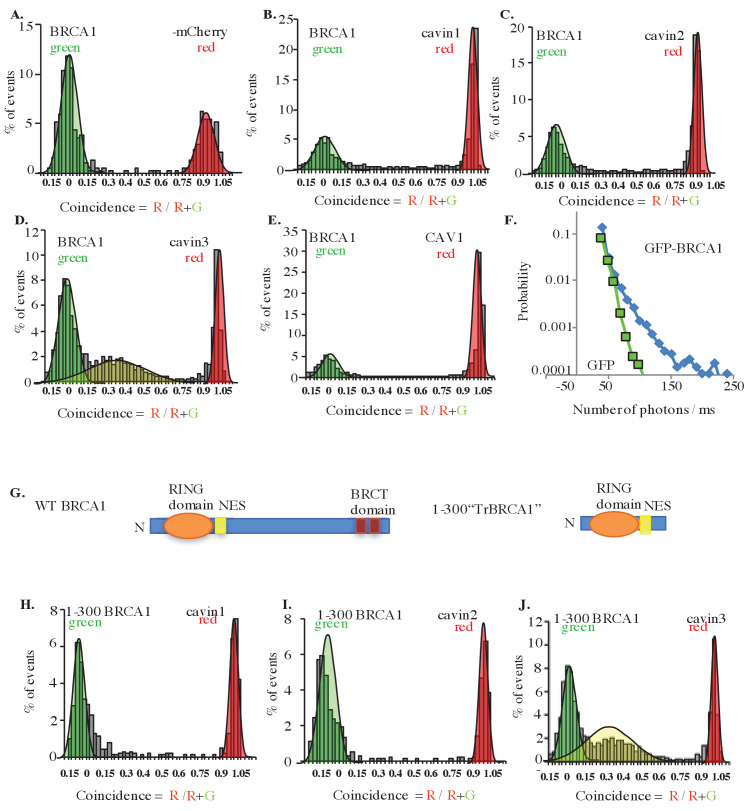
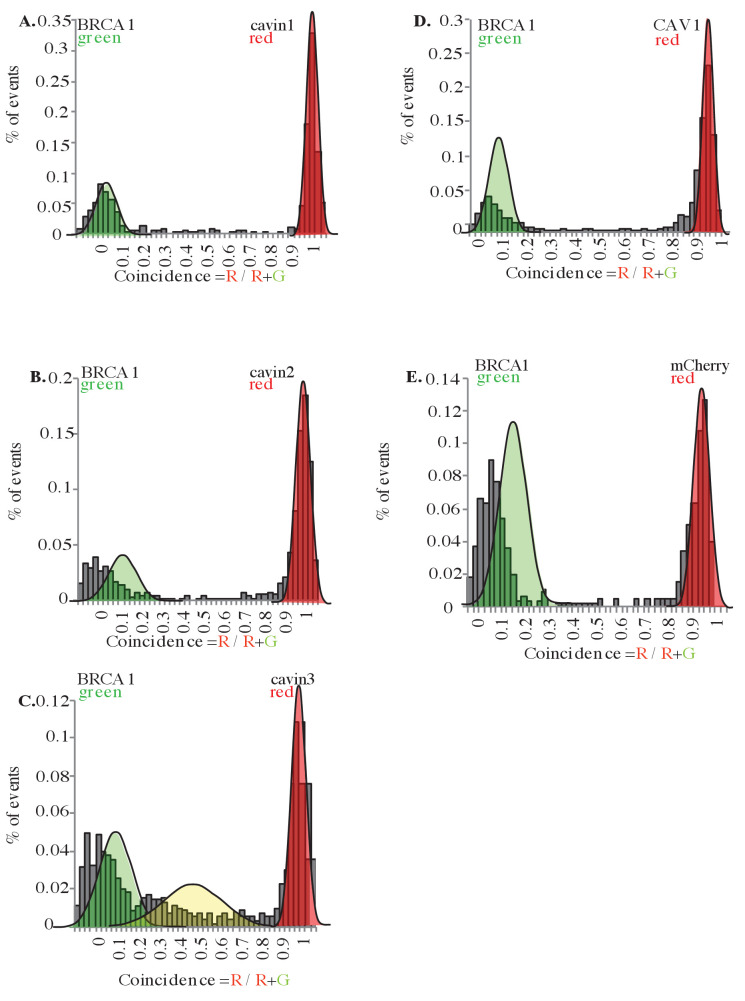
Figure 2. Single-molecule analysis of BRCA1 with cavin3-mCherry in MCF7 cells.
(A) Two-color single molecule fluorescence coincidence of BRCA1-GFP with (A) mCherry control, (B) mCherry-cavin1, (C) mCherry-cavin2, (D) mCherry-cavin3, and (E) mCherry-CAV1 coexpressed in MCF7 cells. The green curve represents BRCA1-GFP-only events, the red curve represents mCherry-only events, and the yellow curve represents BRCA1-GFP + Cherry events. (F) Distribution of burst brightness measured for BRCA1-GFP (blue) and GFP control (green). (G) Schematic representation of domain organization of full-length wildtype (WT) BRCA1 and the truncated (Tr) 1–300 BRCA1 constructs. NES: nuclear export signal; BRCT domain: BRCA1 C terminus domain; N: N terminus. (H–J). Two-color single-molecule fluorescence coincidence of 1–300 BRCA1 with (H) cavin1, (I) cavin2, and (J) cavin3 expressed in Leishmania cell-free lysates. More than 1000 events were collected in all cases.


