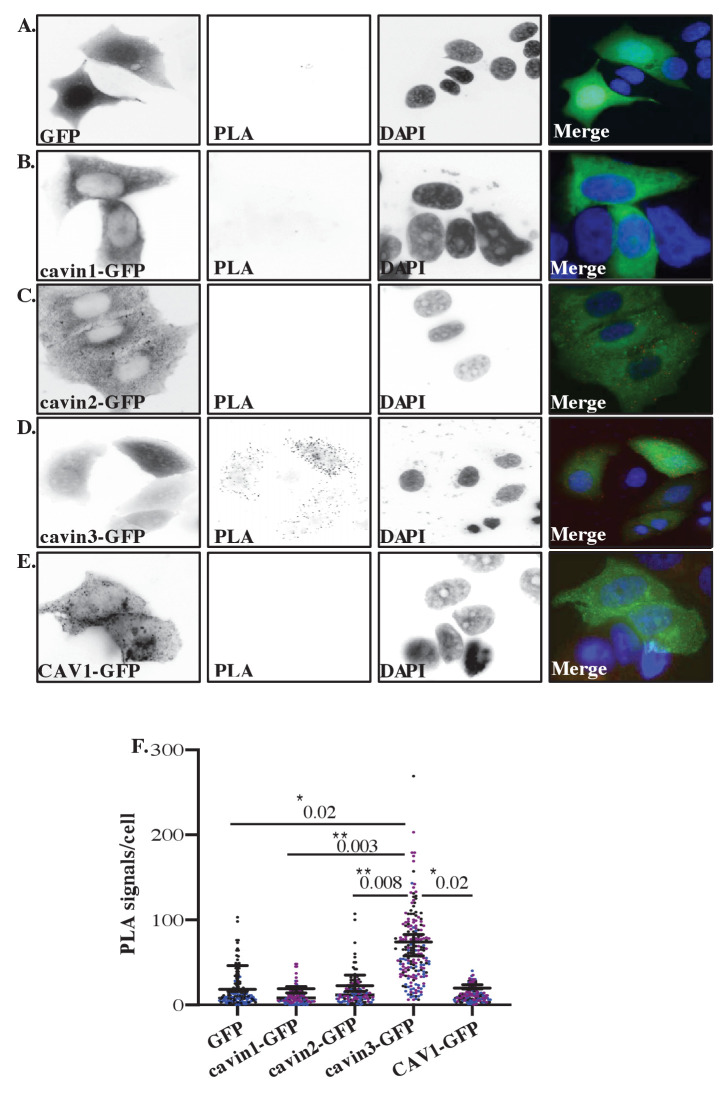
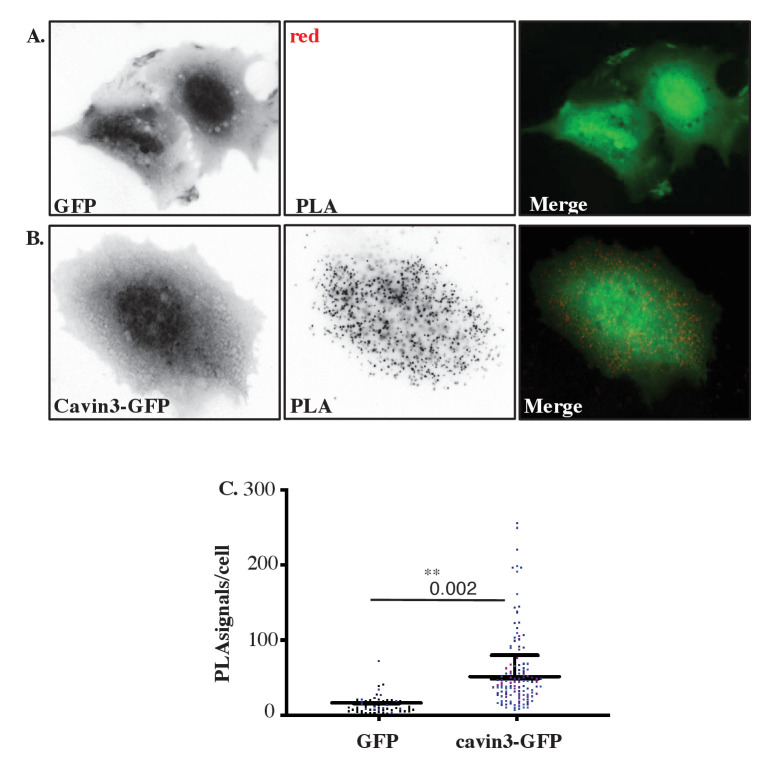
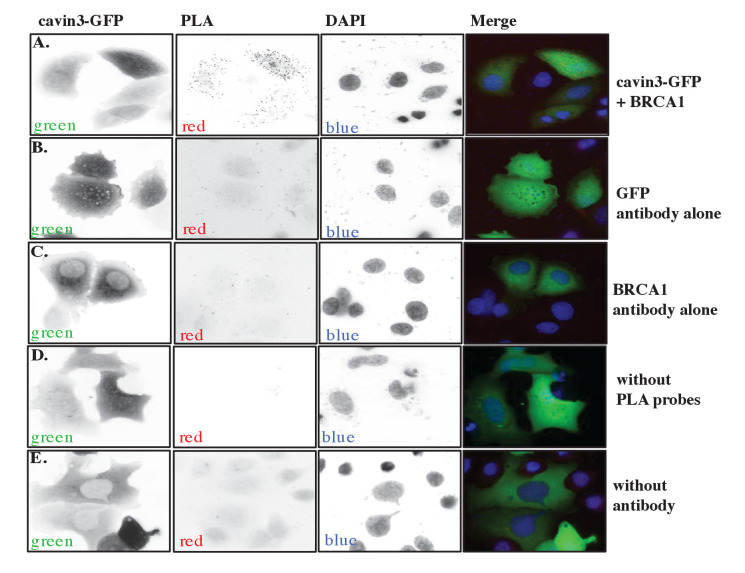
Figure 3. Proximity ligation assay (PLA) analysis of cavin3 and BRCA1 interaction in MCF7 cells.
(A–E) Immunofluorescence microscopy in combination with PLA for protein-protein interactions (red dots) within single cells of stably expressing (A) MCF7-GFP, (B) MCF7-cavin1-GFP, (C) MCF7-cavin2-GFP, (D) MCF7-cavin3-GFP, and (E) MCF7-CAV1-GFP using monoclonal GFP and polyclonal BRCA1 antibodies. DNA was counterstained with DAPI (blue). Scale bars represent 10 μm. (F). Number of red dots/PLA signals in 40–50 cells for each MCF7-GFP-expressing cell line was quantified from three independent experiments using a nested ANOVA. Each biological replicate is color-coded, and the mean ± SEM is presented as a black bar. **p<0.05, **p<0.01.


