

Abstract
Background
The prognostic nutritional index (PNI) has been reported to significantly correlate with poor survival and postoperative complications in patients with various diseases, but its relationship with mortality in COVID-19 patients has not been addressed.
Method
A multicenter retrospective study involving patients with severe COVID-19 was conducted to investigate whether malnutrition and other clinical characteristics could be used to stratify the patients based on risk.
Results
A total of 395 patients were included in our study, with 236 patients in the training cohort, 59 patients in the internal validation cohort, and 100 patients in the external validation cohort. During hospitalization, 63/236 (26.69%) and 14/59 (23.73%) patients died in the training and validation cohorts, respectively. PNI had the strongest relationships with the neutrophil-lymphocyte ratio (NLR) and lactate dehydrogenase (LDH) level but was less strongly correlated with the CURB65, APACHE II, and SOFA scores. The baseline PNI score, platelet (PLT) count, LDH level, and PaO2/FiO2 (P/F) ratio were independent predictors of mortality in COVID-19 patients. A nomogram incorporating these four predictors showed good calibration and discrimination in the derivation and validation cohorts. A PNI score less than 33.405 was associated with a higher risk of mortality in severe COVID-19 patients in the Cox regression analysis.
Conclusion
These findings have implications for predicting the risk of mortality in COVID-19 patients at the time of admission and provide the first direct evidence that a lower PNI is related to a worse prognosis in severe COVID-19 patients.
1. Introduction
By the end of 19th June 2021, more than 177,833,450 confirmed coronavirus disease 2019 (COVID-19) cases had been documented worldwide, with more than 3,851,736 deaths [1]. Unlike patients with other common infectious diseases, patients with COVID-19 have a wide range of clinical manifestations, including complex and mixed pulmonary conditions and multiorgan failure that can lead to death. However, not all patients develop a poor clinical outcome. Given the large number of COVID-19 cases, we need to pay more attention to those who are likely to progress to death.
Recent evidence has shown that malnutrition is a critical prognostic factor in many diseases, including autoimmune diseases [2], cardiovascular diseases [3], lung diseases [4, 5], and malignancies [6]. Chronic inflammatory diseases are associated with the increased production of catabolic cytokines, muscle catabolism, appetite suppression, and lower albumin levels [7]. High degrees of malnutrition correlate with high levels of inflammation [8]. Malnutrition is a modifiable risk factor [9].
The prognostic nutritional index (PNI) is calculated based on the serum albumin concentration and lymphocyte count in the peripheral blood. Previously, the PNI was reported to correlate significantly with poor survival and postoperative complications in patients with various malignant digestive system tumors [10, 11]. A previous study indicated that a lower PNI in patients with a decreased left atrial ejection fraction tended to be associated with a higher risk of mortality in a retrospective study [12]. Once they have been infected with severe acute respiratory syndrome coronavirus 2 (SARS-CoV-2), patients, particularly elderly patients, often develop cardiovascular dysfunction due to the widespread expression of angiotensin-converting enzyme 2 (ACE2) in the heart and blood vessels [13]. Therefore, the prognostic value of the PNI in patients with COVID-19 is worth further investigation. However, to date, the relevant studies have mainly focused on crude analyses rather than establishing a systematic, quantified model; hence, the application value of the present PNI is extremely limited [14, 15].
As current evidence regarding the prognostic impact of malnutrition on severe COVID-19 is limited and the relationship between malnutrition and mortality in COVID-19 patients has not been addressed, we aimed to identify the prevalence, clinical associations, and prognostic consequences of malnutrition in a retrospective cohort of patients with severe COVID-19 and establish a novel prognostic nomogram for the early prediction and modification of the disease outcome.
2. Materials and Methods
2.1. Data Source
The medical records and compiled data used in this retrospective study were collected from COVID-19 patients in Renmin Hospital of Wuhan University and Jin Yin Tan Hospital in Wuhan City. All patients had a clear clinical outcome of either hospital discharge or death. Data were reviewed by a trained team of physicians [16]. The study was approved by the Ethics Committee of Renmin Hospital of Wuhan University.
2.2. Laboratory Confirmation
Laboratory confirmation of SARS-CoV-2 infection was obtained with patients' throat swab specimens and was conducted in Renmin Hospital of Wuhan University and Jin Yin Tan Hospital. The severity of COVID-19 was defined at the time of admission, according to American Thoracic Society guidelines for community-acquired pneumonia (CAP) [17]. All laboratory tests were performed according to the clinical care needs of the patients. The laboratory assessments consisted of a complete blood count, liver function assessment, and arterial blood gas measurements. To minimize sampling bias, the data on admission were obtained, by communicating effectively with medical workers and double-checking.
The neutrophil-lymphocyte ratio (NLR) was defined by dividing the neutrophil count by the lymphocyte count. The prognostic nutritional index (PNI) score was calculated using the formula ten × serum albumin (g/dL) + 0.005 × total lymphocyte count (mm3) [18]. A score greater than 38 is considered normal; scores of 35 to 38 and less than 35 reflect moderate and severe malnutrition, respectively.
2.3. Statistical Analysis
Continuous variables are expressed as the medians with interquartile ranges (IQRs) as well as mean with standard deviation, while categorical variables are presented as frequencies and percentages (%). To determine differences between the two groups, chi-squared tests were performed for categorical variables, and Wilcoxon rank-sum and one-way ANOVA tests were performed for continuous variables [19].
A novel prognostic nomogram was constructed based on the results of multivariate analysis obtained with the rms package in R; the nomogram was developed based on 80% of the internal data and validated with the remaining 20% of internal data and another 100 external cases. The discrimination performance of the nomogram was quantified using the concordance index (C-index) and calibration curve analysis. The C-index value ranges from 0.5 to 1.0, with 0.5 indicating random chance and 1.0 demonstrating perfect discrimination.
To evaluate the discriminatory ability of the prognostic nomogram, receiver operating characteristic (ROC) curves were generated, and differences among the areas under the curve (AUCs) were compared. Correlations were assessed with Kendall's tau-b analysis, and survival probability was evaluated by Cox analysis.
All analyses were conducted using R (version 3.6.3) and SPSS (version 25). P values less than 0.05 were considered statistically significant in each statistical analysis.
3. Results
3.1. Clinical Characteristics of Patients with COVID-19
A total of 323 patients with severe COVID-19 were identified according to the inclusion criteria, of whom 28 patients were excluded for having (1) incomplete medical records (n = 17) or (2) hospital stays less than 24 h (n = 11). Finally, 295 patients were included in our study, with 236 patients in the training cohort and 59 patients in the validation cohort (Figure 1). The clinical characteristics of the patients included in the training and validation cohorts are presented in Table 1. Among them, 116 (49.15%) and 37 (62.71%) patients were male, with a median age of 61 years and 60 years in the training and validation cohorts, respectively. There were no significant differences in clinical characteristics or disease severity scores (using the Acute Physiology and Chronic Health Evaluation II (APACHE II), sequential organ failure assessment (SOFA), and CURB65 scores) between the two cohorts (Table 1). During hospitalization, 63/236 (26.69%) and 14/59 (23.73%) patients died in the training and validation cohorts, respectively. In addition, 218 (73.90%) patients recovered and had been discharged at the time of analysis.
Figure 1.
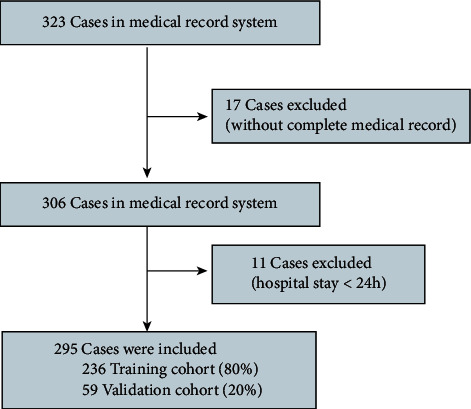
Flowchart of patient recruitment in the internal cohort.
Table 1.
Clinical characteristics of patients with COVID-19 in the training and validation cohorts.
| Training cohort (N = 236) | Validation cohort (N = 59) | P value | |
|---|---|---|---|
| Gender (N, %) | 0.062 | ||
| Male | 116 (49.15%) | 37 (62.71%) | |
| Female | 120 (50.85%) | 22 (37.29%) | |
| Age (years) | 61 (48,71) | 60 (47.69) | 0.550 |
| History (N, %) | |||
| Hypertension | 70 (29.67%) | 15 (25.42%) | 0.520 |
| DM | 36 (15.25%) | 8 (13.56%) | 0.744 |
| Symptoms (N, %) | |||
| Fatigue | 104 (44.07%) | 27 (45.76%) | 0.815 |
| Headache | 15 (6.36%) | 3 (5.08%) | 0.952 |
| Cough | 152 (64.41%) | 42 (71.19%) | 0.326 |
| Dyspnea | 67 (28.39%) | 19 (32.20%) | 0.564 |
| Diarrhea | 27 (11.44%) | 6 (10.17%) | 0.774 |
| Signs | |||
| Temperature | 36.70 (36.50, 37.00) | 36.60 (36.40, 37.00) | 0.548 |
| HR (bpm) | 86 (80, 98) | 88 (81, 98) | 0.336 |
| RR (/min) | 20 (19, 24) | 20 (20, 25) | 0.552 |
| Laboratory indices | |||
| WBC counts (109/L) | 6.29 (4.46, 9.37) | 5.37 (3.96, 8.02) | 0.105 |
| NEU counts (109/L) | 6.51 (3.56, 50.3) | 5.14 (3.12, 29.41) | 0.244 |
| LYM counts (109/L) | 1.21 (0.72, 5.33) | 1.16 (0.72, 2.77) | 0.886 |
| MON counts (109/L) | 0.53 (0.37, 2.33) | 0.53 (0.33, 1.15) | 0.764 |
| NLR | 4.62 (2.32, 10.02) | 3.78 (1.79, 9.11) | 0.406 |
| HGB (g/L) | 125.00 (115.00, 137.00) | 130.00 (119.00, 143.00) | 0.088 |
| PLT (109/L) | 199.50 (141.80, 262.30) | 205.00 (156.00, 252.00) | 0.529 |
| ALB (g/L) | 35.10 (32.00, 39.40) | 37.00 (32.30, 40.00) | 0.308 |
| PNI | 36.19 (33.23, 39.78) | 37.00 (32.30, 40.00) | 0.916 |
| ALT (U/L) | 26.50 (17.30, 43.00) | 27.00 (16.50, 41.50) | 0.689 |
| AST (U/L) | 31.00 (22.00, 46.00) | 30.00 (21.00, 38.50) | 0.460 |
| GLU (mmol/L) | 5.90 (5.02, 7.79) | 5.56 (4.77, 6.79) | 0.059 |
| LDH (U/L) | 296.50 (211.00, 432.50) | 273.00 (220.00, 420.00) | 0.825 |
| P/F ratio (mmHg) | 168.85 (100.42, 289.75) | 231.42 (131.11, 342.00) | 0.120 |
| CURB65 | 1.0 (0, 1.0) | 1.0 (0, 1.0) | 0.931 |
| APACHE II | 6.0 (3.0, 10.0) | 6.0 (3.0, 10.0) | 0.600 |
| SOFA | 2.0 (1.0, 4.0) | 1.0 (0, 3.0) | 0.143 |
| Death (N, %) | 63 (26.69%) | 14 (23.73%) | 0.643 |
Abbreviations: DM; diabetes mellitus; WBC: white blood cells; NEU: neutrophils; LYM: lymphocytes; MON: monocytes; NLR: neutrophil-lymphocyte ratio; HGB: hemoglobin; PLT: platelet; ALB: albumin; PNI: prognostic nutritional index; ALT: alanine transaminase; AST: aspartate aminotransferase; LDH: lactic dehydrogenase; P/F ratio: PaO2/FiO2 ratio; CURB65: confusion, uremia, respiratory rate, blood pressure; APACHE II: Acute Physiology and Chronic Health Evaluation II; SOFA: sequential organ failure assessment.
3.2. Comparison between Surviving and Nonsurviving Patients in the Training Cohort
Surviving and nonsurviving patients with COVID-19 had significant differences in many clinical characteristics and laboratory indicators on admission. Patients in the nonsurviving group were significantly older (74 years, IQR 63-81) than surviving patients (55 years, IOR 44-66). Although many studies have indicated that male patients with COVID-19 had a higher risk of mortality, in the current study, 37 of the 63 (58.73%) patients in the nonsurviving group were male, which was not different from the proportion in the surviving group (79/173, 45.66%, P > 0.05). Patients with hypertension were more likely to die, and those with dyspnea before admission tend to have a poor outcome (P < 0.001), with a history of hypertension in 41/63 (65.08%) of nonsurviving patients and 63/171 (36.84%) of surviving patients and dyspnea in 31/63 (49.21%) of nonsurviving patients and 36/171 (21.05%) of surviving patients. No differences were observed in headache, cough, and diarrhea.
In addition, the white blood cell count (109/L) was 8.49 (IQR 5.61-11.98) in nonsurviving patients, which was dramatically higher than that in surviving patients (5.65 (IQR 4.28-8.10)). Meanwhile, the lymphocyte count (109/L) was 0.60 (IQR 0.41-1.13) in nonsurviving patients, which was dramatically lower than that in surviving patients (1.53 (IQR 0.90-11.2)). The monocyte count (109/L) was 0.42 (IQR 0.28-0.65) in nonsurviving patients, which was dramatically lower than that in surviving patients (0.57 (IQR 0.39-4.8)) (Table 2, P < 0.001). As an indicator of the response to an infection, the neutrophil/lymphocyte ratio (NLR) was also higher in nonsurviving patients (12.51, IQR 7.22-18.83) than in surviving patients (3.41, IQR 1.89-7.16). The blood platelet count represents coagulation function and was dramatically reduced in nonsurviving patients (155.00 (IQR 114.50-208.50) vs. 35.90 (IRQ 157.00-287.00)) (P < 0.001). Moreover, the serum levels of AST and GLU were also higher in patients with poor outcomes than in the other group (41.00 (IRQ 24.00-63.00) vs. 30.00 (IRQ 22.00-42.00), P < 0.001; 7.00 (IRQ 5.80-10.30) vs. 5.60 (IRQ 4.96-7.13), P < 0.001). COVID-19 damages respiratory function, and the PaO2/FiO2 (P/F) ratio in nonsurviving patients was markedly lower than that in surviving patients (104.44 (IQR 75.56-150.0) vs. 257.58 (IQR 168.85-314.75)). The PNI score in nonsurviving patients on admission was 33.41 (IQR 31.46-36.63), which was significantly lower than that in surviving patients (37.21 (IQR 34.07-40.56)) (Table 2).
Table 2.
Clinical characteristics of surviving and nonsurviving patients in the training cohort.
| Surviving patients (N = 173) | Nonsurviving patients (N = 63) | P value | |
|---|---|---|---|
| Gender (N, %) | 0.076 | ||
| Male | 79 (45.66%) | 37 (58.73%) | |
| Female | 94 (54.34%) | 26 (41.27%) | |
| Age (years) | 55 (44, 66) | 74 (63, 81) | <0.001 |
| History (N, %) | |||
| Hypertension | 40 (23.12%) | 30 (47.62%) | <0.001 |
| DM | 25 (14.45%) | 11 (17.46%) | 0.569 |
| Symptoms (N, %) | |||
| Fatigue | 63 (36.42%) | 41 (65.08%) | <0.001 |
| Headache | 13 (7.51%) | 2 (3.17%) | 0.227 |
| Cough | 115 (66.47%) | 37 (58.73%) | 0.272 |
| Dyspnea | 36 (20.81%) | 31 (49.21%) | <0.001 |
| Diarrhea | 20 (11.56%) | 7 (11.11%) | 0.925 |
| Signs | |||
| T | 36.70 (36.50, 37.00) | 36.70 (36.40, 36.90) | 0.543 |
| HR | 86 (80, 98) | 86 (77,102) | 0.898 |
| RR | 20 (19, 22) | 20 (19, 28) | 0.052 |
| Laboratory indices | |||
| WBC counts (109/L) | 5.65 (4.28, 8.10) | 8.49 (5.61, 11.98) | <0.001 |
| NEU counts (109/L) | 5.51 (3.02, 61.85) | 7.89 (4.62, 13.16) | 0.259 |
| LYM counts (109/L) | 1.53 (0.9, 11.2) | 0.60 (0.41, 1.13) | <0.001 |
| MON counts (109/L) | 0.57 (0.39, 4.8) | 0.42 (0.28, 0.65) | <0.001 |
| NLR | 3.41 (1.89, 7.16) | 12.51 (7.22, 18.83) | <0.001 |
| HGB (g/L) | 125.00 (116.50, 136.00) | 122.00 (111.00, 137.50) | 0.560 |
| PLT (109/L) | 214.00 (157.00, 287.00) | 155.00 (114.50, 208.50) | <0.001 |
| ALB | 35.90 (32.60, 39.90) | 33.40 (31.40, 36.60) | 0.004 |
| PNI | 37.21 (34.07, 40.56) | 33.41 (31.46, 36.63) | <0.001 |
| ALT (U/L) | 27.00 (16.50, 43.00) | 25.00 (20.00, 45.00) | 0.708 |
| AST (U/L) | 30.00 (22.00, 42.00) | 41.00 (24.00, 63.00) | 0.001 |
| GLU (mmol/L) | 5.60 (4.96, 7.13) | 7.00 (5.78, 10.30) | <0.001 |
| LDH (U/L) | 263.00 (195.00, 355.00) | 493.00 (362.50, 611.50) | <0.001 |
| P/F ratio | 257.58 (168.85, 314.75) | 104.44 (75.56, 150.00) | <0.001 |
Abbreviations: DM: diabetes mellitus; WBC: white blood cells; NEU: neutrophils; LYM: lymphocytes; MON: monocytes; NLR: neutrophil/lymphocyte ratio; HGB: hemoglobin; PLT: platelet; ALB: albumin; PNI: prognostic nutritional index; ALT: alanine transaminase; AST: aspartate aminotransferase; LDH: lactic dehydrogenase; P/F ratio: PaO2/FiO2 ratio; CURB65: confusion, uremia, respiratory rate, blood pressure; APACHE II: Acute Physiology and Chronic Health Evaluation II; SOFA: sequential organ failure assessment.
3.3. Logistic Regression Analysis and Nomogram Establishment
Multivariate logistic regression analysis showed that the PLT count (odds ratio (OR) and 95% confidence interval (CI), 0.984 (0.974, 0.993); P = 0.001), baseline PNI score (OR and 95% CI, 0.853 (0.740, 0.983); P = 0.028), lactate dehydrogenase (LDH) level (OR with 95% CI, 1.005 (1.001, 1.009); P = 0.012), and P/F ratio (OR with 95% CI, 0.988 (0.981, 0.995); P = 0.001) were independent predictors of mortality in COVID-19 patients (Table 3).
Table 3.
Univariate and multivariate logistic analysis of potential prognostic factors.
| Factors | Univariate analysis | Multivariate analysis | ||
|---|---|---|---|---|
| OR (95% CI) | P value | OR (95% CI) | P value | |
| Age | 1.089 (1.060, 1.119) | <0.001 | 0.105 | |
| Hypertension | 3.023 (1.646, 5.551) | <0.001 | 0.165 | |
| Fatigue | 3.254 (1.780, 5.950) | <0.001 | 0.666 | |
| Dyspnea | 3.687 (1.992, 6.822) | <0.001 | 0.373 | |
| WBC count | 1.197 (1.101, 1.301) | <0.001 | 0.696 | |
| NLR | 1.155 (1.101, 1.212) | <0.001 | 0.805 | |
| PLT count | 0.991 (0.987, 0.995) | <0.001 | 0.984 (0.974, 0.993) | 0.001 |
| PNI | 0.839 (0.774, 0.911) | <0.001 | 0.853 (0.740, 0.983) | 0.028 |
| LDH | 1.009 (1.006, 1.011) | <0.001 | 1.005 (1.001, 1.009) | 0.012 |
| P/F ratio | 0.986 (0.981, 0.992) | <0.001 | 0.988 (0.981, 0.995) | 0.001 |
A nomogram incorporating these four predictors was then constructed (Figure 2(a)) and showed good reliability (C-index: 0.959). The calibration curve for the nomogram (Figure 2(b)) showed good calibration in the training cohort. Then, the favorable calibration of the nomogram was confirmed in the validation cohort (Figure 3(a)). The AUCs of the nomogram in the training and validation cohorts were 0.894 (95% CI, 0.832-0.956; Figure 2(c)) and 0.921 (95% CI, 0.834-1.000; Figure 3(c)), respectively, which revealed good discrimination. Furthermore, our nomogram also performed well in an external validation cohort (Figure 3(b)), with an AUC of 0.795 (95% CI, 0.681-0.908, Figure 3(d)).
Figure 2.

Development and performance of the nomogram in the training cohort. (a) A nomogram for predicting the prognosis of patients with severe COVID-19; (b) calibration curve of the nomogram in the training cohort, which depicts the calibration of the nomogram in terms of the agreement between the predicted risk of death and observed outcomes. The 45° dotted line represents an ideal prediction, and the solid line represents the bias-corrected predictive performance of the nomogram. The closer the solid line fits the ideal line, the better the predictive accuracy of the nomogram; (c) ROC curve of the nomogram in the training cohort.
Figure 3.

Performance of the nomogram in the validation cohorts. Calibration curve of the nomogram in the internal (a) and external (b) validation cohorts. The 45° dotted line represents an ideal prediction, and the solid line represents the bias-corrected predictive performance of the nomogram. The closer the solid line fits the ideal line, the better the predictive accuracy of the nomogram; ROC curves of the nomogram in the internal (c) and external (d) validation cohorts, respectively.
3.4. Correlation between the PNI Score and Other Biomarkers of Disease Severity
The AUC for the PNI score was 0.711 (95% CI, 0.628-0.793), with a cutoff value of 33.405 (Figure 4(a)). We then divided the enrolled data into two groups based on the cutoff value of the PNI score. Cox analysis showed a significant reduction in the survival probability in the patients with a PNI score less than 33.405 on admission (Figure 4(b)). Furthermore, the correlation between the PNI score and disease severity was evaluated with Kendall's tau-b analysis. The results showed that the PNI score had the strongest negative relationships with the NLR and LDH level (R = −0.458, P < 0.001 and R = −0.414, P < 0.001) but was less strongly correlated with the CURB65 (R = −0.303, P < 0.001), APACHE II (R = −0.313, P < 0.001), and SOFA (R = −0.256, P < 0.001) scores (Figure 4(c)).
Figure 4.
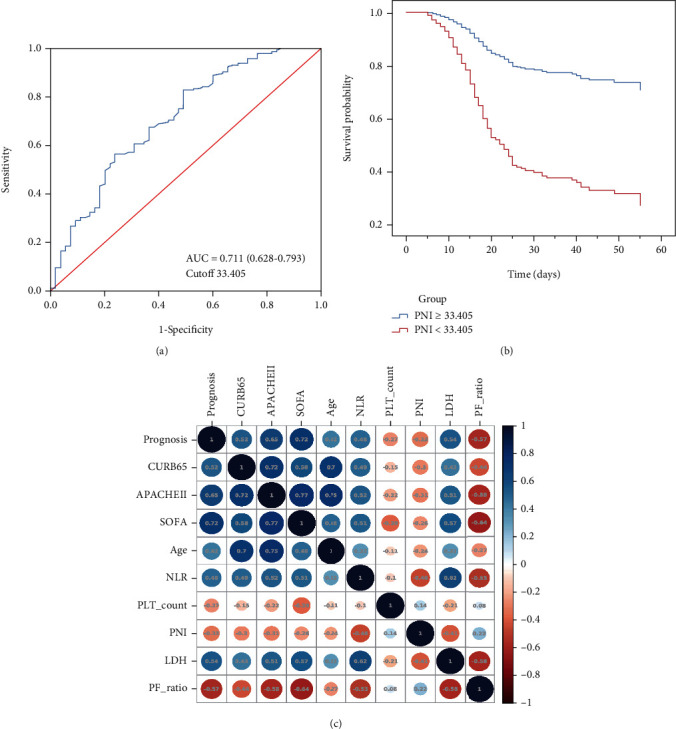
The significance of the PNI score for the prediction of mortality in patients with severe COVID-19. (a) ROC curve of PNI; (b) Cox analysis of COVID-19 patients based on the cutoff value of the PNI score; (c) correlation between the PNI score and other indicators of disease severity.
4. Discussion
In this study, we retrospectively assessed the clinical characteristics of severe COVID-19 patients from multiple hospitals and identified the baseline risk factors for mortality. Our results indicated that the PLT count, PNI score, P/F ratio, and LDH level on admission were independent predictors of mortality. The nomogram based on these risk factors showed good calibration and discrimination in the training and validation cohorts.
With the rapid increase in newly confirmed and severe cases, the management of patients with severe cases has become a challenging issue during the COVID-19 outbreak. The timely identification of patients at a high risk of developing acute respiratory distress syndrome (ARDS), multiorgan failure, and death might help clinicians develop individual treatment plans and rationally allocate medical resources.
In our cohorts, the mortality of patients with severe COVID-19 was 26.70%, which was higher than that in some large-scale reports [20] and slightly lower than that in Washington state in February [21]. This might be because we enrolled patients with COVID-19 during the early phase of the pandemic in Wuhan City, China. In addition, we found that nonsurviving patients were more likely to be older and have underlying hypertension than surviving patients, which is in agreement with recent reports, which have suggested that age and hypertension may be risk factors for progression to severe COVID-19 [22, 23].
In our study, the patients with severe COVID-19 who died had lower baseline platelet counts, PNI scores, and P/F ratios and higher LDH levels, and these variables were independent risk factors for mortality. Previous studies showed that thrombocytopenia in COVID-19 patients was not a significant predictor of disease progression or adverse outcomes [24, 25]. Studies in consecutive patients with COVID-19 have reported that only approximately 5% of patients present with a platelet count less than 100 × 109 cells/L. Mild thrombocytopenia (a platelet count < 150 × 109 cells/L) is identified in 70-95% of patients with severe COVID-19 [20]. The P/F ratio, which directly reflects lung oxygenation, represents the severity of ARDS in COVID-19 patients. In our study, the P/F ratio in nonsurviving patients was twofold lower than that in surviving patients, which was similar to the findings in Arentz et al.'s study [21]. Furthermore, in our previous study, the area under the curve (AUC = 0.878) implied that a serum LDH level greater than 344.5 U/L was strongly predictive of severe COVID-19, with high specificity (96.9%) and sensitivity (68.8%), further confirming that the LDH level is a strong predictive factor that can be used for the early detection of lung injury and severe COVID-19 cases [26].
Interestingly, we found that the prognostic nutritional index (PNI), which was initially used to assess patients' immune and nutritional statuses during the perioperative period and is calculated based on the serum albumin concentration and lymphocyte count in the peripheral blood, was also associated with mortality in patients with severe COVID-19. Previously, PNI was reported to be significantly correlated with poor survival and postoperative complications in patients with various malignant digestive system tumors [10, 11]. However, no studies have explored the association between the immunonutritional status and prognosis in COVID-19 patients.
Albumin is a widely used indicator of nutrition and has been shown to be associated with a poor outcome in critically ill patients. Growing evidence has shown that COVID-19 is associated with a strong cytokine storm [27] and, consequently, the consumption of albumin. Hypoalbuminemia is a typical clinical manifestation of various critical illnesses [28–31]. In our study, we found that the PNI score was significantly lower in nonsurviving patients and was most strongly negatively related to the NLR. The NLR is a reliable marker of systemic inflammation. A higher NLR has been widely reported to be a predictive indicator of poor survival in patients with many different diseases [32, 33]. The PNI score involves a combination of the albumin level and lymphocyte count in the peripheral blood, whereas the NLR can only reflect the inflammation status. In recent studies, the PNI was superior to the NLR as a prognostic marker in many cancer patients [34–36].
Furthermore, we also showed that the PNI score was negatively correlated with the LDH level. The LDH level was found to be positively associated with the C-reactive protein (CRP) level and negatively associated with the lymphocyte count [26]. Therefore, the PNI has been confirmed to be a marker of the immunonutritional status of critically ill patients. The PNI was less strongly correlated with the CURB65, APACHE II, and SOFA scores in our study. The PNI score is a new biomarker of critical illness.
A combination of nutrition and inflammation can better predict the disease progression than an individual predictor. However, studies on the PNI score in COVID-19 patients are extremely limited. We evaluated the clinical characteristics and prognostic importance of the PNI score in severe COVID-19 patients, providing the first direct evidence that a lower PNI score is related to a worse prognosis. Furthermore, our nomogram, which includes the PNI score, had a higher AUC than the PNI score alone for predicting disease prognosis, which provides a new method of evaluating disease outcomes with good predictive accuracy.
However, there are still some limitations of our study. Our study was a retrospective study. The characteristics of the enrolled patients were imbalanced, and approximately 26.70% of the patients died. Second, the sample size was limited, and adjuvant treatments during hospitalization were thought to be similar but were not analyzed. A larger global cohort study of patients with COVID-19 would help further validate the nomogram model and identify the risk factors for severe COVID-19 and mortality.
5. Conclusion
In conclusion, our results provide the first direct evidence that a lower PNI score is related to a worse prognosis in patients with severe COVID-19. We also found that a lower PLT count, PNI, and P/F ratio and a higher LDH level on admission are independent predictors of mortality in patients with severe COVID-19, and the nomogram based on these four risk factors showed good predictive accuracy in the training and validation cohorts.
Acknowledgments
We are grateful to all the patients, doctors, and nurses who participated in the study. We also would like to thank Dr. Peiyun Zhou from Shanghai Medical College of Fudan University for his help in practical questions and insightful discussions. His help was invaluable. This study was financially supported by Shanghai Pujiang Program (2020PJD011).
Abbreviations
- PNI:
Prognostic nutritional index
- COVID-19:
Coronavirus disease 2019
- SARS-CoV-2:
Severe acute respiratory syndrome coronavirus 2
- CAP:
Community-acquired pneumonia
- NLR:
Neutrophil-lymphocyte ratio
- IQR:
Interquartile range
- C-index:
Concordance index
- ROCs:
Receiver operating characteristics
- AUC:
Areas under the curve
- APACHE II:
Acute Physiology and Chronic Health Evaluation II
- SOFA:
Sequential organ failure assessment
- WBC:
White blood cell
- AST:
Aspartate aminotransferase
- LDH:
Lactic dehydrogenase
- P/F:
PaO2/FiO2
- PLT:
Lower platelet
- OR:
Odds ratio
- ARDS:
Acute respiratory distress syndrome
- CI:
Confidence interval
- CRP:
C-reactive protein.
Contributor Information
Min Min, Email: min.min@zs-hospital.sh.cn.
Sucheng Mu, Email: 18111210085@fudan.edu.cn.
Yi Han, Email: han.yi@zs-hospital.sh.cn.
Data Availability
You could find these data in our results.
Ethical Approval
The study was approved by the Ethics Committee of Renmin Hospital of Wuhan University. And the judgement's reference number was WDRY2020-K048.
Conflicts of Interest
All authors declared that they had no conflict of interest.
Authors' Contributions
W. W. analyzed data and drafted the manuscript; X. W. organized, analyzed, and interpreted the data; the order of the authorship was based on their contributions to this study. Y. H. acquired data, designed the study, and took responsibility for data integrity and the accuracy of data analysis; S. M. helped revise the manuscript. M.M. organized data and helped with data analysis. Y. H., S. M., and M. M. are cocorresponding authors. C. J., T. M., and G. G. helped with data collections and performed the literature search. Wei Wei and Xingyue Wu are co-first authors.
References
- 1.Organization, WH. Coronavirus disease (COVID-19) outbreak 2020. 2020. https://www.who.int.
- 2.Dupont R., Longué M., Galinier A., et al. Impact of micronutrient deficiency & malnutrition in systemic sclerosis: cohort study and literature review. Autoimmunity Reviews. 2018;17(11):1081–1089. doi: 10.1016/j.autrev.2018.05.010. [DOI] [PubMed] [Google Scholar]
- 3.Raposeiras Roubín S., Abu Assi E., Cespón Fernandez M., et al. Prevalence and prognostic significance of malnutrition in patients with acute coronary syndrome. Journal of the American College of Cardiology. 2020;76(7):828–840. doi: 10.1016/j.jacc.2020.06.058. [DOI] [PubMed] [Google Scholar]
- 4.Lelijveld N., Kerac M., Seal A., et al. Long-term effects of severe acute malnutrition on lung function in Malawian children: a cohort study. European Respiratory Journal. 2017;49(4):p. 1601301. doi: 10.1183/13993003.01301-2016. [DOI] [PMC free article] [PubMed] [Google Scholar]
- 5.Torrisi S. E., Ley B., Kreuter M., et al. Reply to: Malnutrition in idiopathic pulmonary fibrosis: the great forgotten comorbidity. European Respiratory Journal. 2019;53(5):p. 1900615. doi: 10.1183/13993003.00615-2019. [DOI] [PubMed] [Google Scholar]
- 6.Capitanio U., Montorsi F. Does preoperative nutritional status affect survival in renal cell carcinoma? The debate continues. European Urology. 2011;59(6):929–930. doi: 10.1016/j.eururo.2011.03.014. [DOI] [PubMed] [Google Scholar]
- 7.Merker M., Felder M., Gueissaz L., et al. Association of baseline inflammation with effectiveness of nutritional support among patients with disease-related malnutrition: a secondary analysis of a randomized clinical trial. JAMA Network Open. 2020;3(3, article e200663) doi: 10.1001/jamanetworkopen.2020.0663. [DOI] [PMC free article] [PubMed] [Google Scholar]
- 8.Sueta D., Hokimoto S., Sakamoto K., et al. Validation of the high mortality rate of malnutrition-inflammation-atherosclerosis syndrome. International Journal of Cardiology. 2017;230:97–102. doi: 10.1016/j.ijcard.2016.12.072. [DOI] [PubMed] [Google Scholar]
- 9.Freeman A. M., Morris P. B., Barnard N., et al. Trending cardiovascular nutrition controversies. Journal of the American College of Cardiology. 2017;69(9):1172–1187. doi: 10.1016/j.jacc.2016.10.086. [DOI] [PubMed] [Google Scholar]
- 10.Pinato D. J., North B. V., Sharma R. A novel, externally validated inflammation-based prognostic algorithm in hepatocellular carcinoma: the prognostic nutritional index (PNI) British Journal of Cancer. 2012;106(8):1439–1445. doi: 10.1038/bjc.2012.92. [DOI] [PMC free article] [PubMed] [Google Scholar]
- 11.Wang C., He W., Yuan Y., et al. Comparison of the prognostic value of inflammation-based scores in early recurrent hepatocellular carcinoma after hepatectomy. Liver International. 2020;40(1):229–239. doi: 10.1111/liv.14281. [DOI] [PubMed] [Google Scholar]
- 12.Cheng Y. L., Sung S. H., Cheng H. M., et al. Prognostic nutritional index and the risk of mortality in patients with acute heart failure. Journal of the American Heart Association. 2017;6(6) doi: 10.1161/jaha.116.004876. [DOI] [PMC free article] [PubMed] [Google Scholar]
- 13.Driggin E., Madhavan M. V., Bikdeli B., et al. Cardiovascular considerations for patients, health care workers, and health systems during the COVID-19 pandemic. Journal of the American College of Cardiology. 2020;75(18):2352–2371. doi: 10.1016/j.jacc.2020.03.031. [DOI] [PMC free article] [PubMed] [Google Scholar]
- 14.Çınar T., Hayıroğlu M., Çiçek V., et al. Is prognostic nutritional index a predictive marker for estimating all-cause in-hospital mortality in COVID-19 patients with cardiovascular risk factors? Heart & lung : the journal of critical care. 2021;50(2):307–312. doi: 10.1016/j.hrtlng.2021.01.006. [DOI] [PMC free article] [PubMed] [Google Scholar]
- 15.Hu X., Deng H., Wang Y., Chen L., Gu X., Wang X. Predictive value of the prognostic nutritional index for the severity of coronavirus disease 2019. Nutrition. 2021;84:p. 111123. doi: 10.1016/j.nut.2020.111123. [DOI] [PMC free article] [PubMed] [Google Scholar]
- 16.Mu S., Wei W., Jin C., et al. Risk factors for COVID-19 patients with cardiac injury: pulmonary ventilation dysfunction and oxygen inhalation insufficiency are not the direct causes. Aging. 2020;12(23):23464–23477. doi: 10.18632/aging.104148. [DOI] [PMC free article] [PubMed] [Google Scholar]
- 17.Metlay J. P., Waterer G. W., Long A. C., et al. Diagnosis and treatment of adults with community-acquired pneumonia. An official clinical practice guideline of the American Thoracic Society and Infectious Diseases Society of America. American Journal of Respiratory and Critical Care Medicine. 2019;200(7):e45–e67. doi: 10.1164/rccm.201908-1581ST. [DOI] [PMC free article] [PubMed] [Google Scholar]
- 18.Buzby G. P., Mullen J. L., Matthews D. C., Hobbs C. L., Rosato E. F. Prognostic nutritional index in gastrointestinal surgery. American Journal of Surgery. 1980;139(1):160–167. doi: 10.1016/0002-9610(80)90246-9. [DOI] [PubMed] [Google Scholar]
- 19.Baker R. L., Jamison B. L., Wiles T. A., et al. CD4 T cells reactive to hybrid insulin peptides are indicators of disease activity in the NOD mouse. Diabetes. 2018;67(9):1836–1846. doi: 10.2337/db18-0200. [DOI] [PMC free article] [PubMed] [Google Scholar]
- 20.Guan W. J., Ni Z. Y., Hu Y., et al. Clinical characteristics of coronavirus disease 2019 in China. The New England Journal of Medicine. 2020;382(18):1708–1720. doi: 10.1056/NEJMoa2002032. [DOI] [PMC free article] [PubMed] [Google Scholar]
- 21.Arentz M., Yim E., Klaff L., et al. Characteristics and outcomes of 21 critically ill patients with COVID-19 in Washington State. JAMA. 2020;323(16):1612–1614. doi: 10.1001/jama.2020.4326. [DOI] [PMC free article] [PubMed] [Google Scholar]
- 22.Wu C., Chen X., Cai Y., et al. Risk factors associated with acute respiratory distress syndrome and death in patients with coronavirus disease 2019 pneumonia in Wuhan, China. JAMA Internal Medicine. 2020;180(7):934–943. doi: 10.1001/jamainternmed.2020.0994. [DOI] [PMC free article] [PubMed] [Google Scholar]
- 23.Zhou F., Yu T., du R., et al. Clinical course and risk factors for mortality of adult inpatients with COVID-19 in Wuhan, China: a retrospective cohort study. Lancet. 2020;395(10229):1054–1062. doi: 10.1016/S0140-6736(20)30566-3. [DOI] [PMC free article] [PubMed] [Google Scholar]
- 24.Huang C., Wang Y., Li X., et al. Clinical features of patients infected with 2019 novel coronavirus in Wuhan, China. Lancet. 2020;395(10223):497–506. doi: 10.1016/S0140-6736(20)30183-5. [DOI] [PMC free article] [PubMed] [Google Scholar]
- 25.Thachil J., Tang N., Gando S., et al. ISTH interim guidance on recognition and management of coagulopathy in COVID-19. Journal of Thrombosis and Haemostasis. 2020;18(5):1023–1026. doi: 10.1111/jth.14810. [DOI] [PMC free article] [PubMed] [Google Scholar]
- 26.Han Y., Zhang H., Mu S., et al. Lactate dehydrogenase, an independent risk factor of severe COVID-19 patients: a retrospective and observational study. Aging. 2020;12(12):11245–11258. doi: 10.18632/aging.103372. [DOI] [PMC free article] [PubMed] [Google Scholar]
- 27.Moore J. B., June C. H. Cytokine release syndrome in severe COVID-19. Science. 2020;368(6490):473–474. doi: 10.1126/science.abb8925. [DOI] [PubMed] [Google Scholar]
- 28.Chen G., Wu D., Guo W., et al. Clinical and immunological features of severe and moderate coronavirus disease 2019. The Journal of Clinical Investigation. 2020;130(5):2620–2629. doi: 10.1172/JCI137244. [DOI] [PMC free article] [PubMed] [Google Scholar]
- 29.Liu A. Y., Nabel C. S., Finkelman B. S., et al. Idiopathic multicentric Castleman's disease: a systematic literature review. Lancet Haematol. 2016;3(4):e163–e175. doi: 10.1016/S2352-3026(16)00006-5. [DOI] [PubMed] [Google Scholar]
- 30.Nowak-Węgrzyn A., Katz Y., Mehr S. S., Koletzko S. Non-IgE-mediated gastrointestinal food allergy. The Journal of Allergy and Clinical Immunology. 2015;135(5):1114–1124. doi: 10.1016/j.jaci.2015.03.025. [DOI] [PubMed] [Google Scholar]
- 31.Violi F., Ceccarelli G., Cangemi R., et al. Hypoalbuminemia, coagulopathy, and vascular disease in COVID-19. Circulation Research. 2020;127(3):400–401. doi: 10.1161/CIRCRESAHA.120.317173. [DOI] [PubMed] [Google Scholar]
- 32.Cataudella E., Giraffa C. M., di Marca S., et al. Neutrophil-to-lymphocyte ratio: an emerging marker predicting prognosis in elderly adults with community-acquired pneumonia. Journal of the American Geriatrics Society. 2017;65(8):1796–1801. doi: 10.1111/jgs.14894. [DOI] [PubMed] [Google Scholar]
- 33.Haram A., Boland M. R., Kelly M. E., Bolger J. C., Waldron R. M., Kerin M. J. The prognostic value of neutrophil-to-lymphocyte ratio in colorectal cancer: a systematic review. Journal of Surgical Oncology. 2017;115(4):470–479. doi: 10.1002/jso.24523. [DOI] [PubMed] [Google Scholar]
- 34.Oba T., Maeno K., Ono M., Ito T., Kanai T., Ito K. I. Prognostic nutritional index is superior to neutrophil-to-lymphocyte ratio as a prognostic marker in metastatic breast cancer patients treated with Eribulin. Anticancer Research. 2021;41(1):445–452. doi: 10.21873/anticanres.14794. [DOI] [PubMed] [Google Scholar]
- 35.Wang J., Liu Y., Mi X., Shao M., Liu L. The prognostic value of prognostic nutritional index (PNI) and neutrophil to lymphocyte ratio (NLR) for advanced non-small cell lung cancer treated with platinum-based chemotherapeutics. Ann Palliat Med. 2020;9(3):967–978. doi: 10.21037/apm.2020.04.31. [DOI] [PubMed] [Google Scholar]
- 36.Mirili C., Yılmaz A., Demirkan S., Bilici M., Basol Tekin S. Clinical significance of prognostic nutritional index (PNI) in malignant melanoma. International Journal of Clinical Oncology. 2019;24(10):1301–1310. doi: 10.1007/s10147-019-01461-7. [DOI] [PubMed] [Google Scholar]
Associated Data
This section collects any data citations, data availability statements, or supplementary materials included in this article.
Data Availability Statement
You could find these data in our results.