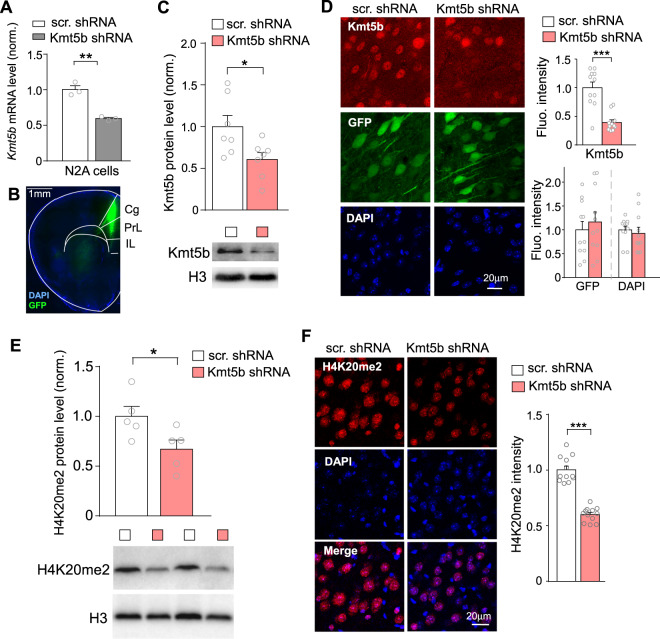
Fig. 1. KMT5B knockdown in PFC.
A Bar graph of Kmt5b mRNA level in N2A cells transfected with Kmt5b shRNA or a scrambled control shRNA (scr.). **p < 0.01, t-test. B Immunofluorescent image showing the location of Kmt5b shRNA AAV (GFP-tagged) expression in the PFC of a virus-injected mouse. C Quantitation of Kmt5b protein levels (normalized to total H3 levels) in the nuclear fraction of PFC dissected from mice injected with Kmt5b shRNA or scr. shRNA AAV. *p < 0.05, t-test. Insets: representative immunoblots. D Bar graphs of fluorescence intensity of Kmt5b, GFP, and DAPI signal in the PFC of mice injected with Kmt5b shRNA or scr. shRNA AAV. Inset: representative confocal images. ***p < 0.001, t-test. E Quantitation of H4K20me2 levels (normalized to total H3 levels) in the nuclear fraction of PFC dissected from mice injected with Kmt5b shRNA or scr. shRNA AAV. *p < 0.05, t-test. Insets: representative immunoblots. F Bar graph of fluorescence intensity of H4K20me2 signal in the PFC of mice injected with Kmt5b shRNA or scr. shRNA AAV. Inset: representative confocal images. ***p < 0.001, t-test.

