

Abstract
Studies from around the world have found that the preferred place of death is at home. Although desired, the ability to die at home requires personal, social, and structural factors to be in place. In the United States, between 2003 and 2017, there were decreased hospital and nursing facility deaths and increased home and hospice facility deaths. This study aims to determine whether a change in the place of death in those greater than 65 years of age in Hawai‘i is similar to the overall United States data and if these changes in place of death are similar across islands/counties in the state of Hawai‘i. Data from the Centers for Disease Control and Prevention database were analyzed for natural deaths between 2003 and 2018 in Hawai‘i. Between 2003 and 2018, there were 120 115 natural deaths in Hawai‘i, with a decrease in the overall percentage of deaths in hospitals from 53% in 2003 to 33% in 2018. During the same period, home deaths increased from 23% to 33%, and nursing facility deaths increased from 14% to 16%. This study found that the change in the place of death in those greater than 65 years in Hawai‘i is similar to the overall United States data as a whole, but not within individual Hawai‘i counties.
Keywords: place of death, natural death, home death
Introduction
Studies worldwide have found that the preferred place of death for the general population and critically ill patients is at home.1–6 Patients desire to die at home; however, the ability to die at home requires personal, social, and structural factors to be in place.7 Personal factors include patient knowledge of the death process, impact and management of end of life symptoms on quality of life, and the maintenance of personal dignity during the dying process.7 Social factors include the presence of caregivers who can assist and cope with the physical and emotional process of death.7 Structural factors include reliable medical and social support systems to support both the patient and caregivers and convenient proximity to a hospital for unexpected or uncontrollable symptoms.7 In 2019, a letter to the New England Journal of Medicine analyzed data from the Centers for Disease Control and Prevention for the reported location of natural deaths in the United States between 2003 and 2017.8 These authors found that there was a decrease in hospital (39.7% to 29.8%) and nursing facility (23.6% to 20.8%) deaths, and an increase in the number of deaths at home (23.8% to 30.7%) and hospice facilities (0.2% to 8.3%).8 The trends found in the national place of death data support an improving congruence between patient preference1–6 and health care system utilization.8 However, the authors found differences in trends between sex, age at the time of death, cause of death, and between racial and ethnic groups.8
The Centers for Medicare and Medicaid Services covers the time a clinician spends to perform advanced care planning as part of a Medicare Annual Wellness Visit or under Medicare Part B and tracks the advanced care planning quality metric.9 The advanced care planning quality metric requires physicians to explain and discuss advanced directives and complete such forms annually with all Medicare patients.10 In 2016, the Hawai‘i Medical Service Association, the Blue Cross Blue Shield of Hawai‘i, launched a population-based primary care payment model focusing on quality bonuses and a shared savings incentive.11 Providers that meet or exceed the required percentage of a patient population that completed a monitored quality metric receive a financial incentive from the insurer. This payment model's results were published in 2019, and the advanced care planning quality metric had the highest quality measure improvement under this novel program (40.9% versus 75.7% in the new model group versus 37.0% to 67.2% in the old model group).11 This increase in advanced care planning quality may be due to increased pressure from the federal and state health insurance industries for quality metric and financial incentive reasons and support patient autonomy. This study aims to determine whether a change in the place of death in those greater than 65 years in Hawai‘i is similar to the overall United States data and if these changes in place of death are similar across islands/counties in the state of Hawai‘i.
Methods
Data from the Centers for Disease Control and Prevention database for “Underlying Causes of Death, 1998–2018” was summarized and reviewed for natural deaths between 2003 and 2018.12 Deaths from external causes and outside the state of Hawai‘i were excluded. All data queries included the following criteria: 65–85 years and older, year of death (between 2003 and 2018), and the county in which death occurred. Home deaths included death certificates stating the patient died within the decedent's home. Hospital deaths include medical facility categories of inpatient, outpatient or emergency room, dead on arrival, or unknown. Hospice and nursing home/long-term care home deaths were also queried for this study. All state-level data with less than 10 deaths in any category is suppressed by the Centers for Disease Control and Prevention for patient privacy.12 Collected data were summarized and reviewed at the state of Hawai‘i and county level using Microsoft Excel, version 16.16.6 (Microsoft Corporation, Redmond, WA).
Results
Between 2003 and 2018, there were 120 115 natural deaths in Hawai‘i. There was a decrease in the overall percentage of deaths in hospitals from 53% in 2003 to 33% in 2018, as seen in Figure 1. During the same period, home deaths increased from 23% to 33%, and nursing facility deaths increased from 14% to 16%. The percentage of home deaths increased across all counties in Hawai‘i, with Maui County having the most substantial percent increase in the number of home deaths from 24% in 2003 to 42%in 2018, as seen in Figure 2. The percentage of hospital deaths decreased across all counties in Hawai‘i, with the most substantial decrease occurring in Maui County, from 51% of deaths in 2003 to 28% of deaths in 2018, as seen in Figure 3. The percentage of nursing home deaths increased in Kaua‘i County, from 6% in 2003 to 19% in 2018, while the most substantial decrease in the percent of nursing home deaths occurred in Maui County, from 20% in 2003 to 11% in 2018, as seen in Figure 4.
Figure 1.
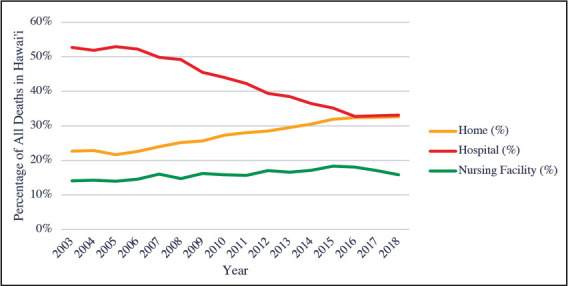
Total Natural Deaths in Hawai‘i Between 1993 and 2018 by Location of Death
Figure 2.
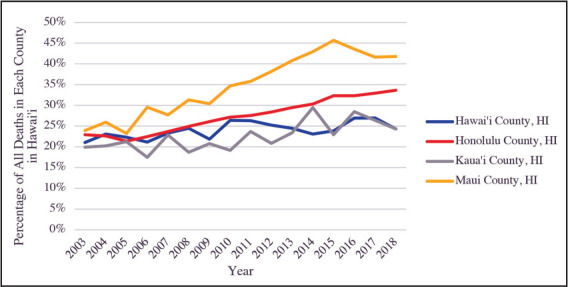
Total Natural Deaths in Hawai‘i Between 1993 and 2018 by Location of Death, At Home, by County
Figure 3.
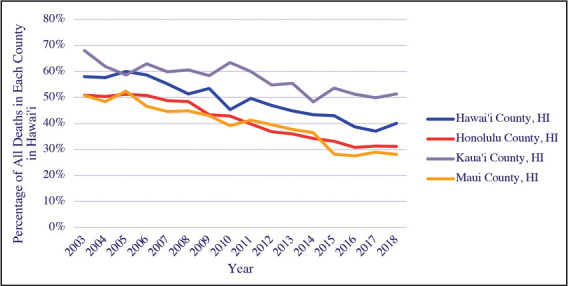
Total Natural Deaths in Hawai‘i Between 1993 and 2018 by Location of Death, In Hospital, by County
Figure 4.
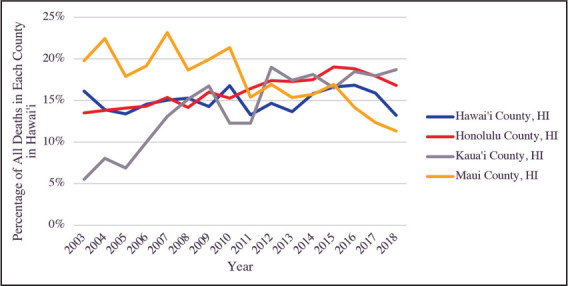
Total Natural Deaths in Hawai‘i Between 1993 and 2018 by Location of Death, In Nursing Facilities, by County
Discussion
The place of death data between 2003 and 2018 in Hawai‘i follows a similar trend to the United States between 2003 and 2017, with decreased hospital deaths, increased home deaths, and a relatively stable nursing home death percentage.8 Numerous studies have shown that the preferred place of death for the general population and critically ill patient is at home, and the United States and Hawai‘i health care systems appear to be supporting patient autonomy regarding this decision.1–6 A 1999 study found ethnic differences related to the preferred place of death in Hawai‘i, with 76% versus 43% of white and Chinese, respectively, wishing to die at home.13 Another study focusing on elder Japanese Americans in Hawai‘i found that dying at home was preferred, but dying at a hospital or retirement home were other good alternatives.14 In contrast, a 2020 study of Marshallese in Hawai‘i found that the preferred place of death was in an institution.15 Although the United States and Hawai‘i population, as a whole, may favor home as a place of death,1–6 specific ethnicity preferences and generational preferences exist, which are important to take into consideration.15 There is also likely a difference between counties related to the availability of structural factors, such as hospice agency services, that allow individuals to die at home successfully, an area of needed study. New population-based primary care payment models, such as the Hawai‘i Medical Service Association plan,11 help promote patient autonomy regarding the place of death, though not necessarily the reason for their implementation. The reimbursement of clinicians for completion of advanced care planning by the Centers for Medicare and Medicaid Services is also likely contributing to patient autonomy regarding the preferred place of death and the change in overall death locations in the United States and Hawai‘i.10
Of note, the county of Kaua‘i had an increase in the percentage of deaths occurring at nursing homes than the state of Hawai‘i and United States trends, as seen in Figure 4. The 13% increase in the number of deaths occurring at nursing homes between 2003 and 2018 in Kaua‘i County is surprising as the county has the smallest amount of skilled nursing facility/intermediate care beds in the state (333 beds versus 2588 in Honolulu County, 787 beds in Hawai‘i County, and 459 beds in Maui County).13 Kaua‘i County also has the smallest number of medicine/surgical beds in the state (68 beds versus 1327 in Honolulu County, 199 beds in Hawai‘i County, and 157 beds in Maui County) and the highest ratio of skilled nursing/intermediate care facility beds in the state (4.9 versus 4.0 in Hawai‘i County, 2.9 in Maui County, and 2.0 in Honolulu County).13 Further research is needed to determine why Kaua‘i County has more nursing home deaths than other counties in Hawai‘i and the United States.
Limitations
Kalawao County data, hospice death data, gender death data, ethnicity death data, and “other” location of death data by county was suppressed by the Centers for Disease Control and Prevention due to patient privacy.
Conclusion
This study found that the change in the place of death in those greater than 65 years in Hawai‘i is similar to the overall United States data as a whole, but not within individual Hawai‘i counties. This trend in Hawai‘i is despite the ethnic and generational differences related to the preferred place of death for people living in Hawai‘i.13–15 It appears that the financial incentive provided by the Centers for Medicare and Medicaid, as well as new payment models introduced in Hawai‘i, may be contributing to the improved patient autonomy and ability to die at home successfully. It is unclear why Kaua‘i County varies from other Hawai‘i counties and the United States regarding the percentage of nursing home deaths, an area of needed study. Despite the work already being done to improve patients’ ability to die at home, only 33% of Hawai‘i residents were able to die at home compared to 39.7% of patients in the United States. Additional resources are needed to meet the personal, social, and structural factors needed to allow Hawai‘i patients to have the autonomy to die at home, and further insight into ethnic and generational preferences related to the preferred place of death in Hawai‘i is needed.
Conflict of Interest
I certify that I have no financial affiliation/interest (eg, employment, stock holdings, consultantships, honoraria) in the subject matter, materials, or products mentioned in this manuscript. I have no conflict of interest to report, nor any interests represented with any products discussed or implied.
References
- 1.De Roo ML, Miccinesi G, Onwuteaka-Philipsen BD, et al. Stemmer SM, editor. Actual and preferred place of death of home-dwelling patients in four European countries: making sense of quality indicators. PLoS ONE. 2014;9((4)):e93762. doi: 10.1371/journal.pone.0093762. [DOI] [PMC free article] [PubMed] [Google Scholar]
- 2.Chen CH, Lin Y-C, Liu L-N, Tang ST. Determinants of preference for home death among terminally ill patients with cancer in Taiwan: a cross-sectional survey study. J Nurs Res. 2014;22((1)):37–44. doi: 10.1097/jnr.0000000000000016. [DOI] [PubMed] [Google Scholar]
- 3.Fukui S, Yoshiuchi K, Fujita J, Sawai M, Watanabe M. Japanese people's preference for place of end-of-life care and death: a population-based nationwide survey. J Pain Symptom Manage. 2011;42((6)):882–892. doi: 10.1016/j.jpainsymman.2011.02.024. [DOI] [PubMed] [Google Scholar]
- 4.Higginson IJ, Sen-Gupta GJA. Place of care in advanced cancer: a qualitative systematic literature review of patient preferences. J Palliat Med. 2005;3((3)):287–300. doi: 10.1089/jpm.2000.3.287. [DOI] [PubMed] [Google Scholar]
- 5.Townsend J, Frank AO, Fermont D, et al. Terminal cancer care and patients’ preference for place of death: a prospective study. BMJ. 1990;301((6749)):415–417. doi: 10.1136/bmj.301.6749.415. [DOI] [PMC free article] [PubMed] [Google Scholar]
- 6.Gott M, Seymour J, Bellamy G, Clark D, Ahmedzai S. Older people's views about home as a place of care at the end of life. Palliat Med. 2004;18((5)):460–467. doi: 10.1191/0269216304pm889oa. [DOI] [PubMed] [Google Scholar]
- 7.Barclay S, Arthur A. Place of death — how much does it matter? Br J Gen Pract. 2008;58((549)):229–231. doi: 10.3399/bjgp08X279724. [DOI] [PMC free article] [PubMed] [Google Scholar]
- 8.Cross SH, Warraich HJ. Changes in the place of death in the United States. N Engl J Med. 2019;381((24)):2369–2370. doi: 10.1056/NEJMc1911892. [DOI] [PubMed] [Google Scholar]
- 9.Centers for Medicare and Medicaid Services Advance Care Planning. Medicare Learn Netw. Published online August 2019:6. Available from: https://www.cms.gov/outreach-and-education/medicare-learning-network-mln/mlnproducts/downloads/advancecareplanning.pdf. Accessed April 1, 2021. [Google Scholar]
- 10.Advance Care Planning. HMSA Provider Resource Center. Published January 7, 2019. Available from: https://hmsa.com/portal/provider/zav_pel.aa.ADV.600.htm. Accessed December 17, 2020. [Google Scholar]
- 11.Navathe AS, Emanuel EJ, Bond A, et al. Association between the implementation of a population-based primary care payment system and achievement on quality measures in Hawaii. JAMA. 2019;322((1)):57. doi: 10.1001/jama.2019.8113. [DOI] [PMC free article] [PubMed] [Google Scholar]
- 12.United States Department of Health and Human Services, Centers for Disease Control and Prevention (CDC), National Center for Health Statistics, Centers for Disease Control and Prevention Underlying Cause of Death 1999-2018 on CDC WONDER Online Database. Published 2020. Available from: https://wonder.cdc.gov/ucd-icd10.html. Accessed July 20, 2020. [Google Scholar]
- 13.Braun KL, Onaka AT, Horiuchi BY. Advance directive completion rates and end-of-life preferences in Hawaii. J Am Geriatr Soc. 2001;49((12)):1708–1713. doi: 10.1046/j.1532-5415.2001.49284.x. [DOI] [PubMed] [Google Scholar]
- 14.Hattori K, Ishida DN. Ethnographic study of a good death among elderly Japanese Americans: Good death. Nurs Health Sci. 2012;14((4)):488–494. doi: 10.1111/j.1442-2018.2012.00725.x. [DOI] [PubMed] [Google Scholar]
- 15.Okamoto L, Riklon S, Masaki K, Bell C, Tamai A, Maskarinec GG. Evolving palliative care practices among Marshall Islanders in Hawai‘i: Generational Comparisons. Hawai‘i J Health Soc Welf. 2020;79((6)):7. [PMC free article] [PubMed] [Google Scholar]
- 16.State of Hawaii, Department of Health, State Health Planning & Development Agency 2018 Health Care Utilization Reports and Survey Instructions. Published 2020. Available from: https://health.hawaii.gov/shpda/agency-resources-and-publications/health-care-utilization-reportsand-survey-instructions/2018-data/. Accessed July 20, 2020. [Google Scholar]