Abstract
Cardiac arrhythmias are an important cause of sudden cardiac death—a devastating manifestation of many underlying causes, such as heart failure and ischemic heart disease leading to ventricular tachyarrhythmias and ventricular fibrillation, and atrial fibrillation causing cerebral embolism. Cardiac electrical propagation is a main factor in the initiation and maintenance of cardiac arrhythmias. In the heart, gap junctions are the basic unit at the cellular level that host intercellular low-resistance channels for the diffusion of ions and small regulatory molecules. The dual voltage clamp technique enabled the direct measurement of electrical conductance between cells and recording of single gap junction channel openings. The rapid turnover of gap junction channels at the intercalated disk implicates a highly dynamic process of trafficking and internalization of gap junction connexons. Recently, non-canonical roles of gap junction proteins have been discovered in mitochondria function, cytoskeletal organization, trafficking, and cardiac rescue. At the tissue level, we explain the concepts of linear propagation and safety factor based on the model of linear cellular structure. Working myocardium is adequately represented as a discontinuous cellular network characterized by cellular anisotropy and connective tissue heterogeneity. Electrical propagation in discontinuous cellular networks reflects an interplay of three main factors: cell-to-cell electrical coupling, flow of electrical charge through the ion channels, and the microscopic tissue structure. This review provides a state-of-the-art update of the cardiac gap junction channels and their role in cardiac electrical impulse propagation and highlights a combined approach of genetics, cell biology, and physics in modern cardiac electrophysiology.
I. INTRODUCTION
Cardiac arrhythmias are an important cause of morbidity and mortality. About 350 000 individuals suffer from sudden cardiac death each year in the United States1 with multifold underlying causes, such as coronary heart disease, non-ischemic heart failure, and genetic disease. A major part of the acute events is due to dysfunction of the electrical activity of the heart leading to ventricular fibrillation. Furthermore, atrial fibrillation developing during aging is a disease with significant impact on cardiac morbidity.2
Normal cardiac electrical activity is initiated by a biological clock initiating an electrical impulse in the sino-atrial node and subsequently spreading over the atria, to the atrio-ventricular node, to the ventricular Purkinje system, and eventually exciting both ventricles.3
Understanding and investigating cardiac electrical activity may implicate a number of different approaches involving knowledge of the molecular composition and function of the myriad of molecular components involved, their interrelationships, and the biophysical laws governing propagation and generation of the electrical impulse. Thus, modern cardiac electrophysiology represents a fascinating field at the interface of physics, cell biology, and genetics. This review discusses the role of connexin proteins in cell-to-cell coupling in Sec. II and subsequently summarizes the work on the involvement of cell-to-cell coupling in electrical propagation in Secs. III and IV.
II. CONNEXINS: CANONICAL AND NON-CANONICAL ROLES
A. Cardiac connexins forming gap junction channels
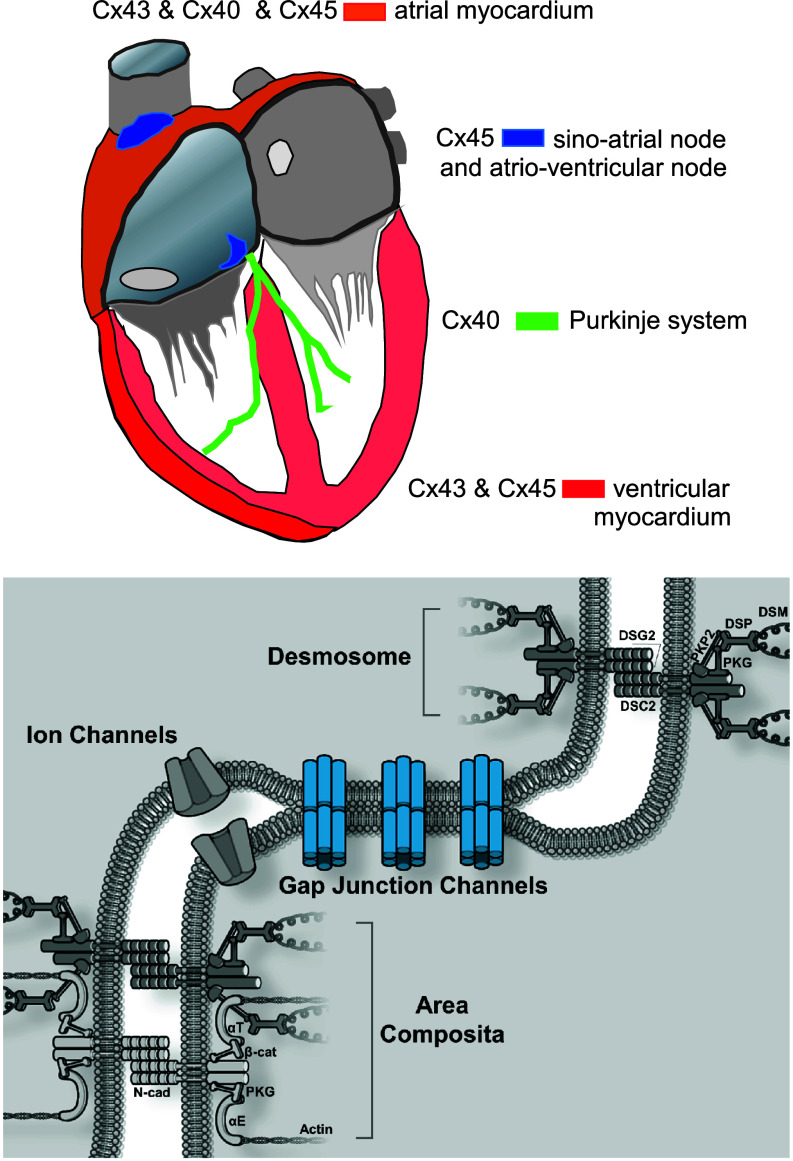
The existence of electrical low-resistance pathways between cardiac cells has been described early on by Silvio Weidmann.4,5 Later on it was reported that gap junction channels are formed by connexin proteins whereby each neighboring cell traffics a hemichannel (connexon) to the cell interface, the intercalated disk. A major step forward was made with the introduction of whole cell dual voltage clamp, a method that can directly provide values for electrical conductance between two cells, the current/voltage relationship of gap junction channels, and single channels conductances.6,7 In turn, the connexons dock to each other with their extracellular domains (juxtaposed) to form a full gap junction channel between the connexon delivering cells. Such channels are functional in many organ systems, such as heart, skin, the central nervous system, liver, and the vascular endothelium, and are formed by different connexins, with prominent roles for connexin43 (Cx43), connexin40 (Cx40), and connexin45 (Cx45) in the heart. Moreover, an additional connexin (Cx30.2) has recently been identified in the sino-atrial and atrio-ventricular nodes.8 The specific contribution of Cx43, Cx40, and Cx45 in the heart has been well described.9 Cx43 dominates in both ventricles, Cx40 in the ventricular Purkinje system. In the atria, both Cx40 and Cx43 are found to coexist. Cx45 seems to play an important role in the sino-atrial and atrio-ventricular nodes and is found in small amounts in the atria and ventricles (Fig. 1). Gap junction channels are both biophysically and chemically complex. A comprehensive overview covering all biophysical aspects of connexins has been published by Harris.10 The information obtained from expression of channels consisting of pure homomeric connexons and homomeric gap junction channels, formed by a specific connexins, are often taken to estimate the effect of electrical cell-to-cell coupling on propagation velocity. These measurements revealed average single channel conductance of 175 pS for Cx40, 100 pS for Cx43, and 30 pS for Cx43 for homomeric–homotypic channels.10
FIG. 1.
Upper panel: Sketch illustrating the distribution of cardiac connexins Cx43, Cx40, and Cx45. Cx43 is the dominating connexin in the working myocardium of the ventricles, which in addition host small amounts of Cx45. Both left and right atria co-express Cx40, Cx43, and Cx45. The cells of the Purkinje system express Cx40. Cx45 dominates in both the sino-atrial and the atrio-ventricular nodes. Lower panel: Schematic presentation of the cardiac cell junction (ICD, intercalated disk). It includes four main components: gap junction channels, ion channels, desmosomes, and adherens junctions. Adherens junctions and desmosomes are situated at the sites perpendicular to the long axis of the cell, whereas gap junctions are preferentially located at sites parallel to the long axis. In mammalian hearts, adherens junctions and desmosomes can form combined junctions, termed area composita. N-cad: N-cadherin; PKG: plakoglobin (γ-catenin); PKP2: plakophilin-2; αE: αE-catenin; αT: αT-catenin; β-cat: β-catenin; DSC2: desmocollin-2; DSG2: desmoglein-2; DSP: desmoplakin; DSM: desmin (intermediate filament).
Since the myocardium represents a syncytial structure formed by millions of individual cells, several functional aspects of connexins are crucial for coordinated excitation and contraction: Are individual gap junction channels formed by a mixture of connexins, and what is the difference between mixed (heterotypic/heteromeric) channels if compared to pure homotypic/homomeric channels? How do gap junction channels react to changes in membrane potential? How and in what time frame do gap junction channels traffic to the cell border (intercalated disk), and how are gap junction channels internalized? How do gap junction channels react to the ionic environment and to metabolism, especially in disease?
B. Mixed gap junction channels in the heart
Most experimental work on heteromeric connexons and heterotypic gap junction channels has been carried out in heterologous cell systems in which expression of specific connexin proteins is achieved by transfection. It seems well established by several studies that Cx43 and Cx45 can form heteromeric channels at the level of the atrial and ventricular myocardium. Channels formed by heteromeric Cx43/Cx45 connexons show on average a reduced spectrum of single channel openings and a reduced diffusion of certain substances, suggesting a role of Cx45 as a modulator of cell-to-cell coupling.11
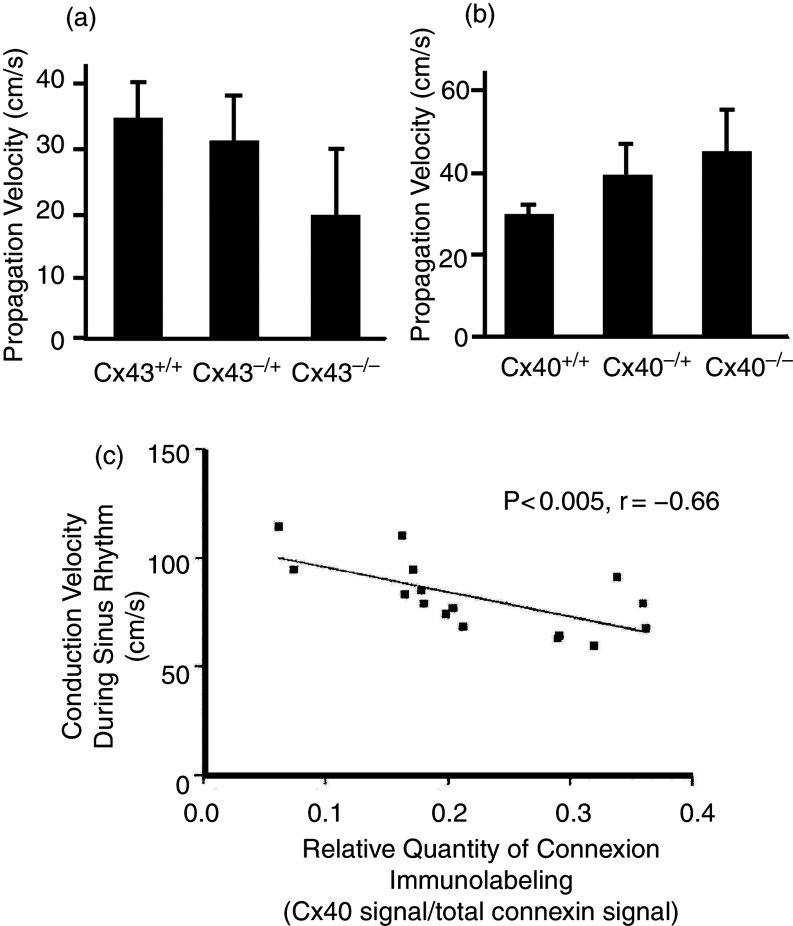
The question of whether Cx40 and Cx43 can form mixed gap junction channels is more complex. Since immunofluorescence signals from atrial tissue and ventricular tissue reveal the co-existence of Cx43 and Cx40 (atria) and Cx43 and Cx45 (ventricle) at the intercalated disk, the question of whether these connexins form independent gap junction channels arranged as parallel conducting elements or bind together to form heterotypic channels seems important, because such mixed channels may exhibit specific functional properties that are different from the “average of its parts.” On one hand it has been argued that incompatibility of docking of Cx40 hemichannels with Cx43 hemichannels could explain why cells of the Purkinje system would only connect at specific so-called Purkinje fiber-muscle junctions (where there is Cx43 expression at the terminal segments in the Purkinje system12), whereas there would be full electrical insulation in all remaining tissue segments where Purkinje fibers would be in close contact with working myocardium. On the other hand, Cx40 and Cx43 are co-expressed in the atrial myocardium, and the meaning of this co-expression has never been fully explained. Rackauskas et al. found no evidence of docking of Cx40 hemichannels to Cx43 in pairs of HeLa cells carrying specific fluorescent makers, whereas earlier studies suggested limited low-level coupling.13–15 Even if Cx40 and Cx43 connexons do not assemble to mixed gap junction channels, a complex interaction between Cx40 and Cx43 expression at intercalated disk in atrial tissue has been reported, most likely at the level of connexon trafficking. Thus, genetic ablation of Cx43 in rat neonatal atrial myocytes was associated with a decrease in Cx40 expression at the ICD, whereas genetic ablation of Cx40 was paralleled by an increase in Cx43 expression.16,17 In human atrial tissue, propagation velocity depended on the balance of local Cx40 and Cx43 expression. A locally increased proportion of Cx40 expression decreased and an increased proportion of Cx43 increased propagation velocity.18 Similar observations were made in engineered strands of neonatal rat atrial myocytes (Fig. 2).16
FIG. 2.
Changes of propagation velocity in engineered strands of cultured neonatal rat atrial myocytes and in human atrial tissue. Left: Genetic ablation of Cx43 in patterned cultures of neonatal mice atrial myocytes leads to a decrease in propagation velocity. Right: Genetic ablation of Cx40 in patterned cultures of neonatal mice atrial myocytes leads to an increase in propagation velocity. Reproduced with permission from P. Beauchamp et al., Circ. Res. 99, 11 (2006). Copyright 2006 Wolters Kluwer Health, Inc.16 Lower panel: Propagation velocity in excised human atrial tissue depends on the relative contribution of the Cx40 fluorescence signal to signals of total atrial connexins (sum of Cx43 and Cx40). Note that an increase in the relative contribution of Cx40 in human atria leads to a decrease in electrical propagation velocity, in line with the results from the mice cultures shown in the upper panel. Reproduced with permission from P. Kanagaratnam et al., J. Am. Coll. Cardiol. 39, 1 (2002). Copyright 2002 Elsevier.18
Interaction between Cx43 and Cx40 was also observed in experiments involving co-expression of mutant Cx40 connexin with wild type Cx43 showing that impaired trafficking of mutant Cx40 also decreased trafficking of the normal Cx43 connexin.19 Overall, these clinical findings and experiments indicate complex, not fully elucidated relationships of co-expressed cardiac connexins.
C. Effect of dynamic gap junction channel closure on propagation
Gap junction channels switch from an open state to several semi-closed and closed states upon sensing a transjunctional voltage. Since they consist of connexons that are juxtaposed, each hemichannel part will react to transjunctional voltages of opposite polarity, leading to classical bell-shaped relationships between steady-state junctional conductance, gsteady-state, and trans-junctional voltage.10 During cardiac propagation, voltage gradients and local current flow between excited upstream and non-excited downstream cells are predicted to affect intercellular conductance. This effect will depend on the volage gradient itself and on the dynamics of closure of gap junction channels.20 In a theoretical study, using a simple model of an open and a single closed state of gap junction channels,21 Henriquez et al. showed that the dynamic behavior of gap junction channels exerted a non-significant influence on propagation or on action potential shape in a normal state. However, in a state of advanced cell-to-cell uncoupling, the transient decrease in junctional conductance in the immediate wake of the downstream action potential might prevent backflow of local electrotonic current under pathological conditions.22
D. Trafficking and internalization of gap junction channels
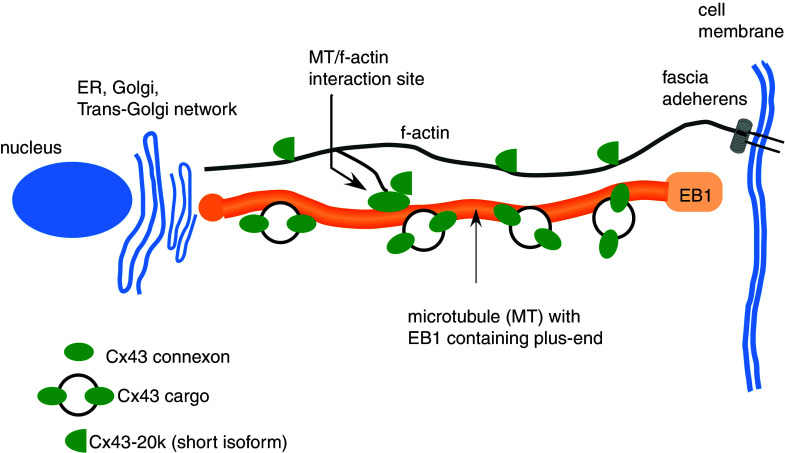
Connexons consisting of Cx43 use EB1-tipped microtubules (the EB1-MT) to travel to the intercalated disk where they bind to fascia adherens junctions to unload cargo23 (Fig. 3). Additional binding has been shown between EB1-MT and desmoplakin, a protein forming part of the anchoring complex of desmosomal junctions.24 This process depends on the presence of β-catenin and p150.23 During the past years, many of the complex aspects of this trafficking process have been elucidated. The EB1-MT interact with f-actin at so-called rest-stop sites.25 These are likely to form intracellular storage sites of Cx43 and represent a relatively large fraction of total cellular Cx43. Such deposits may explain why Cx43 at the intercalated disk increases about twofold within 1 h following acute stretch, i.e., in a time period too short to be explained by de novo synthesis.26 In contrast to “resting” Cx43 at sites of interaction of MT with f-actin, Cx43 connexons may travel at speeds of 1 μm/s toward the upload site at the intercalated disk.27
FIG. 3.
Simplified scheme of Cx43 trafficking apparatus showing interaction sites of EB1-tipped microtubules with f-actin functioning as so-called “rest stops,” and Cx43-20k short isoforms involved in f-actin polymerization and MT/f-actin interaction.
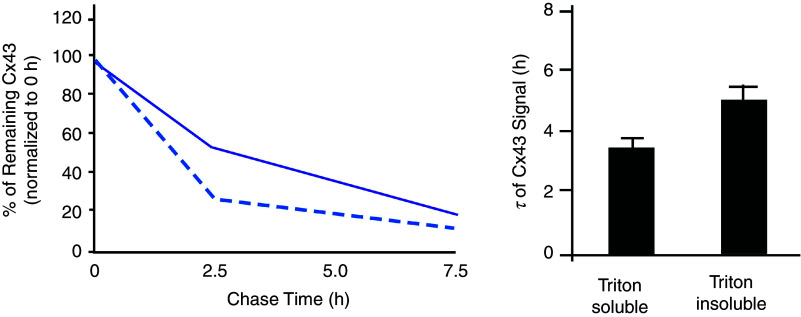
A stable expression of gap junction channels at the intercalated disk reflects a dynamic equilibrium between synthesis and forward trafficking of connexons on one hand and internalization of gap junction channels on the other. The average turnover time of connexons and gap junction channels amounts to approximately 2–4 h28 (Fig. 4). Turnover of gap junction channels is pictured as a continuous process whereby connexons are assembled at the periphery of a gap junction plaque, gap junction channels subsequently moving from the periphery of gap junction plaques and being internalized in the center of the intercalated disk.29 Internalization is a highly regulated process initiated by 14-3-3 dependent phosphorylation at Cx43-Ser373. Subsequently, Cx43 is phosphorylated at Ser368. Cx43-Ser368 has been identified at intracellular sites just below the intercalated disks by high resolution confocal microscopy.30 Thus, protein 14-3-3-dependent S373 phosphorylation indicates upstream initiation of a multistage cascade of phosphorylation eventually leading to lysosomal degradation. The process of internalization is accelerated in pathological states such as hypoxia.30
FIG. 4.
Cellular turnover of connexin 43 in mice heart. Left panel: Pulse-chase assay reveals different half-lives of Cx43 signals in the triton-soluble (cytoplasmic, interrupted line) and triton-insoluble (membrane-bound, solid line) fractions of Cx43. Right panel: Half-lives of Cx43 in mice ventricular myocytes are about 3.5 h and 5 h for triton-soluble (cytoplasmic) and triton-insoluble (membrane-bound) fractions of Cx43 indicating very rapid turnover. Reproduced with permission from S. Xiao et al., J. Clin. Invest. 130, 9 (2020). Copyright 2020 American Society for Clinical Investigation.28
E. Changes in intracellular ions and metabolism modulate gap junctional conductance
Historically, studies on the influence of intracellular ions and metabolites on cell-to-cell coupling were carried out before the genetic sequence of GJA1 gene and the amino-acid sequence of Connexin43 were identified. The first indication that Ca2+ closes gap junctions came from the observation that mechanical injury of heart muscle or Purkinje fibers isolated the injured site from the surrounding surviving muscle. This implicated so-called “healing over,” a process that was shown to be dependent on Ca2+ and which implicated closure of gap junctions.4,31 Later, it was shown directly that intracellular injection of Ca2+ reversibly abolished cell-to-cell communication.32 Similarly, it was reported that lowering pH decreased communication between myocardial cells.33 White et al.34 showed that changes in pH and intracellular Ca2+ are interdependent and that both Ca2+ and low pH are required to uncouple cardiac myocytes. Similar results were shown for the diffusion of the dye Lucifer yellow across cardiac gap junctions.35 In contrast to Ca2+, [Mg2+]i was reported to exert a biphasic effect on cell-to-cell conductance with an increase in gj at low levels of cytosolic Mg2+ and a decrease in gj at levels beyond the physiological range.36
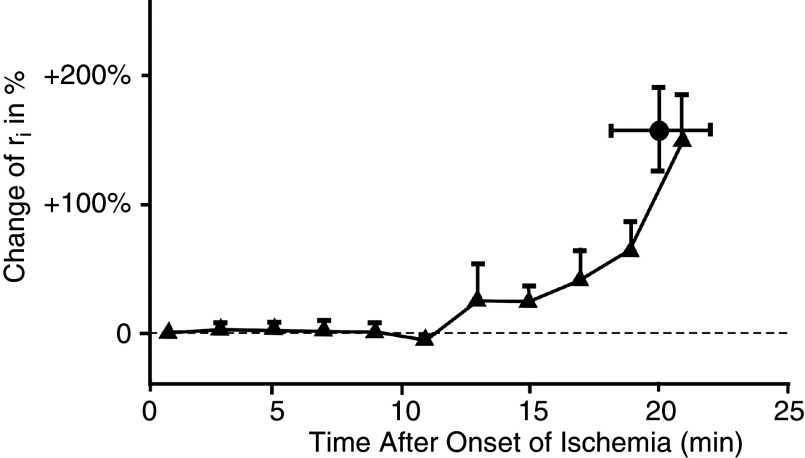
Separation of damaged from healthy myocardium by closure of gap junctions is considered an important regulatory process in myocardial disease, such as myocardial infarction, because it separates injured from healthy myocardium and avoids spread of cellular damage by intercellular diffusion. Anoxia, defined as complete withdrawal of oxygen, and ischemia, defined as arrest of coronary flow, lead to cell-to-cell uncoupling after an initial period of 10 to 15 min37,38 (Fig. 5). Cellular uncoupling in the pathological settings is accompanied by characteristic changes in the electrocardiogram and by malignant ventricular arrhythmias.39
FIG. 5.
Time course of internal longitudinal resistance, ri, in arterially perfused rabbit papillary muscle after induction of acute myocardial ischemia. In linear cable theory, ri corresponds to the intracellular cytoplasmic resistance and the cell-to-cell coupling resistance. The change of ri corresponds to the uncoupling of cells by closure of gap junction channels. Of note, cell-to-cell uncoupling in myocardial ischemia starts only after a peracute phase about 10 –15 min. Reproduced with permission from A. G. Kléber et al., Cir. Res. 61, 2 (1987). Copyright 1987 Wolters Kluwer Health, Inc.37
F. Ephaptic transmission of the electrical impulse: An alternative possibility for electrical impulse transfer
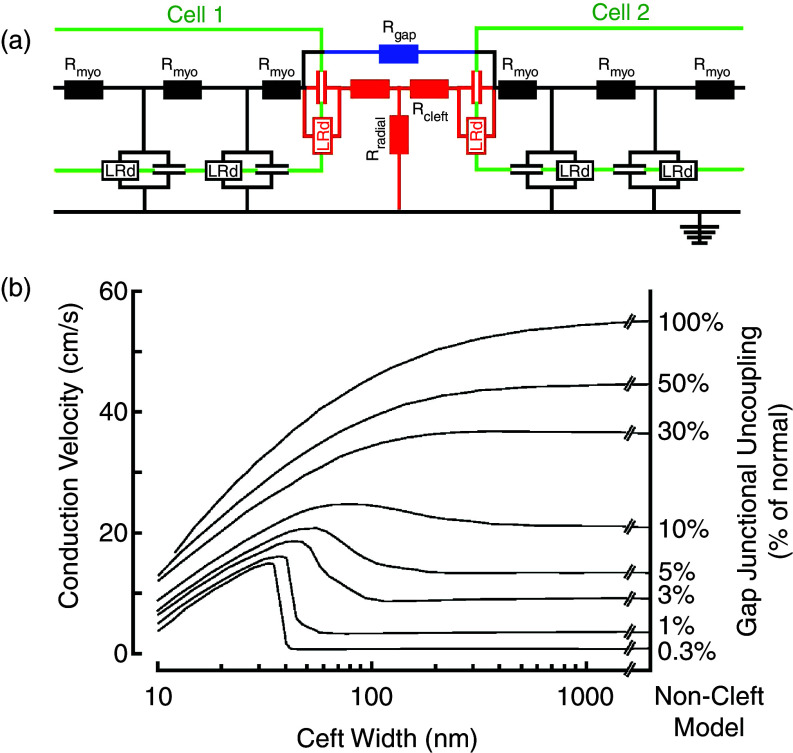
Low resistance coupling by gap junction channels enables the flow of electrical current between adjacent cells and propagation of the electrical impulse. An alternative theory for cardiac cell-to-cell impulse transfer was published in 1960 by N. Sperelakis40 and became the source of controversies and challenges (see discussion in S. Weidmann41). This theory met a revival during the past decade when it became obvious that a substantial fraction of cardiac Na+ channels is located at the intercalated disk, in the area surrounding the gap junction plaque, the so-called perinexus.42 The theory, called ephaptic transmission, is based on the so-called cleft model of a cardiac cell junction (Fig. 6). The excitable elements in the cell junction, corresponding to Na+ channels, face a high intercellular cleft resistance (Rcleft), and a radial resistance (Rradial) connecting the intercellular cleft to the “normal” extracellular space. In the model, the high cleft resistance is determined by the cleft width, to which ephaptic transmission is inversely related. Inward sodium current flowing through the Na+ channels in the cleft is predicted to create an electrical field across the cleft, consisting of a negative cleft potential with respect to the extracellular space. Na+ depeletion in the cleft results in a flow of positive charge from the extracellular space into the cleft. This creates a small increase in the cleft potential and acts to depolarize the membrane potential of the intercalated disk portion of the downstream cell. The postulated evidence for ephaptic transmission is derived from different kinds of experimental and theoretical work. Experiments observing propagation in cardiac ventricular tissue with conditional Cx43 ablation found that propagation velocity was maintained at approximately 50%, despite an approximately 90% reduction of Cx43 immunofluorescence signal.43,44 This prompted speculation about an electrical transfer mechanism alternative to direct current flow across gap junctions. Further work established a relationship between propagation velocity and edema created in the perinexal area, a major determinant of ephaptic transmission.45 Theoretical works using a model of ephaptic transmission46,47 suggested that two major factors affect field transmission of the electrical impulse at the intercalated disk.
FIG. 6.
Ephaptic impulse transmission. Panel (a): Electrical equivalent circuit of two cells (green) and the cell-to-cell junction in between. Each cell contains two excitable membrane elements (black, Luo-Rudy system of ion channels in parallel with membrane capacitance), connected by cytoplasmic resistors. The cell junction is modeled by (1) resistors representing gap junction channels formed by connexins (blue), (2) an excitable element representing ion channels located in the intercalated disk cell membrane (red), (3) a pair of cleft resistors, and (4) a radial resistor connecting the cleft to the extracellular space. This space is set to zero reference potential. Panel (b): Dependence of propagation velocity in a strand composed of cells modeled in panel (a). Propagation velocity is plotted against cleft width for a bundle of curves representing a decreasing degree (from top to bottom) of resistive coupling by gap junction channels. A biphasic behavior of propagation is observed for reduced resistive coupling < 30%. For very low degrees of coupling, propagation is preserved if cleft width is < 40 nm. Reproduced with permission from J. P. Kucera et al., Circ. Res. 91, 12 (2002). Copyright 2002 Wolters Kluwer Health, Inc.46
First, Na+ channel expression at the intercalated disk needs to be approximately 80% of total channel expression.46 Recent studies have shown that Nav1.5 channels associated with the β1 subunit represent the major fraction of Na+ channels at the ICD, a smaller fraction being associated with the (mechanical) composite junctions.48 A further distinct pool of Na+ channels is located in the surface membrane (registered with Z-lines).49,50 To what extent the surface pool of Na+ channels interferes with ephaptic transmission (as suggested by the theoretical studies) is currently unknown.
Second, while the build-up of an electrical field could depolarize the membrane potential of the downstream cell, the depletion of Na+ in the cleft would be expected to lower the electrochemical gradient of Na+ and decrease the inward current, thereby weakening the field effect (self-attenuation).46 A recent study using Nav1.5 channels expressed in HEK cells exposed to a restricted extracellular space suggested, in line with earlier studies, that ephaptic transmission could favor cell-to-cell impulse transfer in the presence of low coupling by gap junction channels.51 A third point that might affect ephaptic transmission is the bidomain nature of real cardiac tissue and the high value of extracellular resistance. Measurements of wavefront amplitude in whole canine hearts have shown that the amplitude of the extracellular wavefront is about 50% of transmembrane action potential amplitude.52 This is in line with measurements of extracellular resistance in papillary muscles in vitro showing that extracellular resistance and intracellular lumped resistance (cytoplasmic and intercellular resistance in series) are of about equal value.53 It might be of interest to consider this high value of extracellular resistance in future theoretical models of ephaptic impulse transmission, because it might reduce the “field effect.” In contrast to studies that specifically addressed cardiac ephaptic impulse transmission, experiments using cell pairs to define cell-to-cell action potential transfer speak against ephaptic transmission.54,55 In adult pairs of cardiac myocytes, block of impulse transfer was observed despite a small residual electrical conductance across gap junctions.54 Taking all the studies together, one should consider ephaptic transmission in the case of low electrical coupling an interesting yet not fully proven concept, and several contradicting observations wait for reconciliation.
G. Non-canonical roles of connexin proteins
1. Connexon hemichannels
An alternative role of connexin proteins was suggested by the work of Heusch,56 who showed that connexin43 was necessary for protection of the working myocardium by preconditioning. While the authors were not able to define a specific role for Cx43 at the molecular level, they speculated that Cx43 hemichannels affect mitochondrial function. Cx43 gap junction channels are formed from 2 Cx43 hemichannels, which are delivered to the perinexus area of gap junction by EB-1 dependent trafficking23 and subsequently form a full gap junction channel with a connexon of the connecting cell neighbor.57 Cx43 hemichannels are closed in normal conditions but may open during myocardial ischemia. In their open state they represent a substantial leak between the extracellular and intracellular spaces and may lead to entry of Ca2+ and Na+ and loss of ATP, ultimately leading to cell injury and cell death.58 In recent work it was shown that large conductance channels could be activated by SR Ca2+ release and modulated Ca2+ homeostasis in a microdomain at the ICD. The fact that these channels were absent in cells with genetic Cx43 ablation or blocked by GAP19 identified these channels as Cx43 hemichannels, distinct from TRP channels or pannexins. These channels were more active in heart failure and likely contribute to arrhythmogenesis in this pathological setting.59
2. The short Cx43 isoforms
Recently, a special role has been attributed to the so-called short isoforms of Cx43. In contrast to full length Cx43, these isoforms do not form hemichannels. Western blots of connexin43 reveal several bands of molecular weight lower than the main band at 43kD, if it is tracked by antibodies binding to its C-terminal (Fig. 7). These short isoforms are the result of regulated internal translation of GJA1 mRNA using the internal AUG sequences (coding for the amino acid methionine) as internal start codons.60 The short Cx43–20k isoform has been shown to exert major effects on cytoskeletal function. First, Cx43–20k acts as a mitochondrial chaperone facilitating mitochondrial upload to microtubules and maintenance at the cell periphery. During myocardial stress, such as myocardial ischemia and reperfusion, Cx43–20k protein is upregulated and exerts a protective effect, thereby reducing myocardial damage and infarct size.61,62 Second, Cx43–20k protein stabilizes filamentous actin and forms complexes with both actin and tubulin. In turn, f-actin regulates microtubule organization.63 Mutation of the internal translation of Cx43-20k produces mice that are highly arrhythmic and die suddenly at 2–4 weeks of age, showing that Cx43-20k acts as an auxiliary trafficking subunit of full length Cx43.28 Overall, Cx43-20k is considered an auxiliary trafficking subunit, because decreased internal translation of Cx43-20k prevents trafficking of full length Cx43 to the intercalated disk.28
FIG. 7.
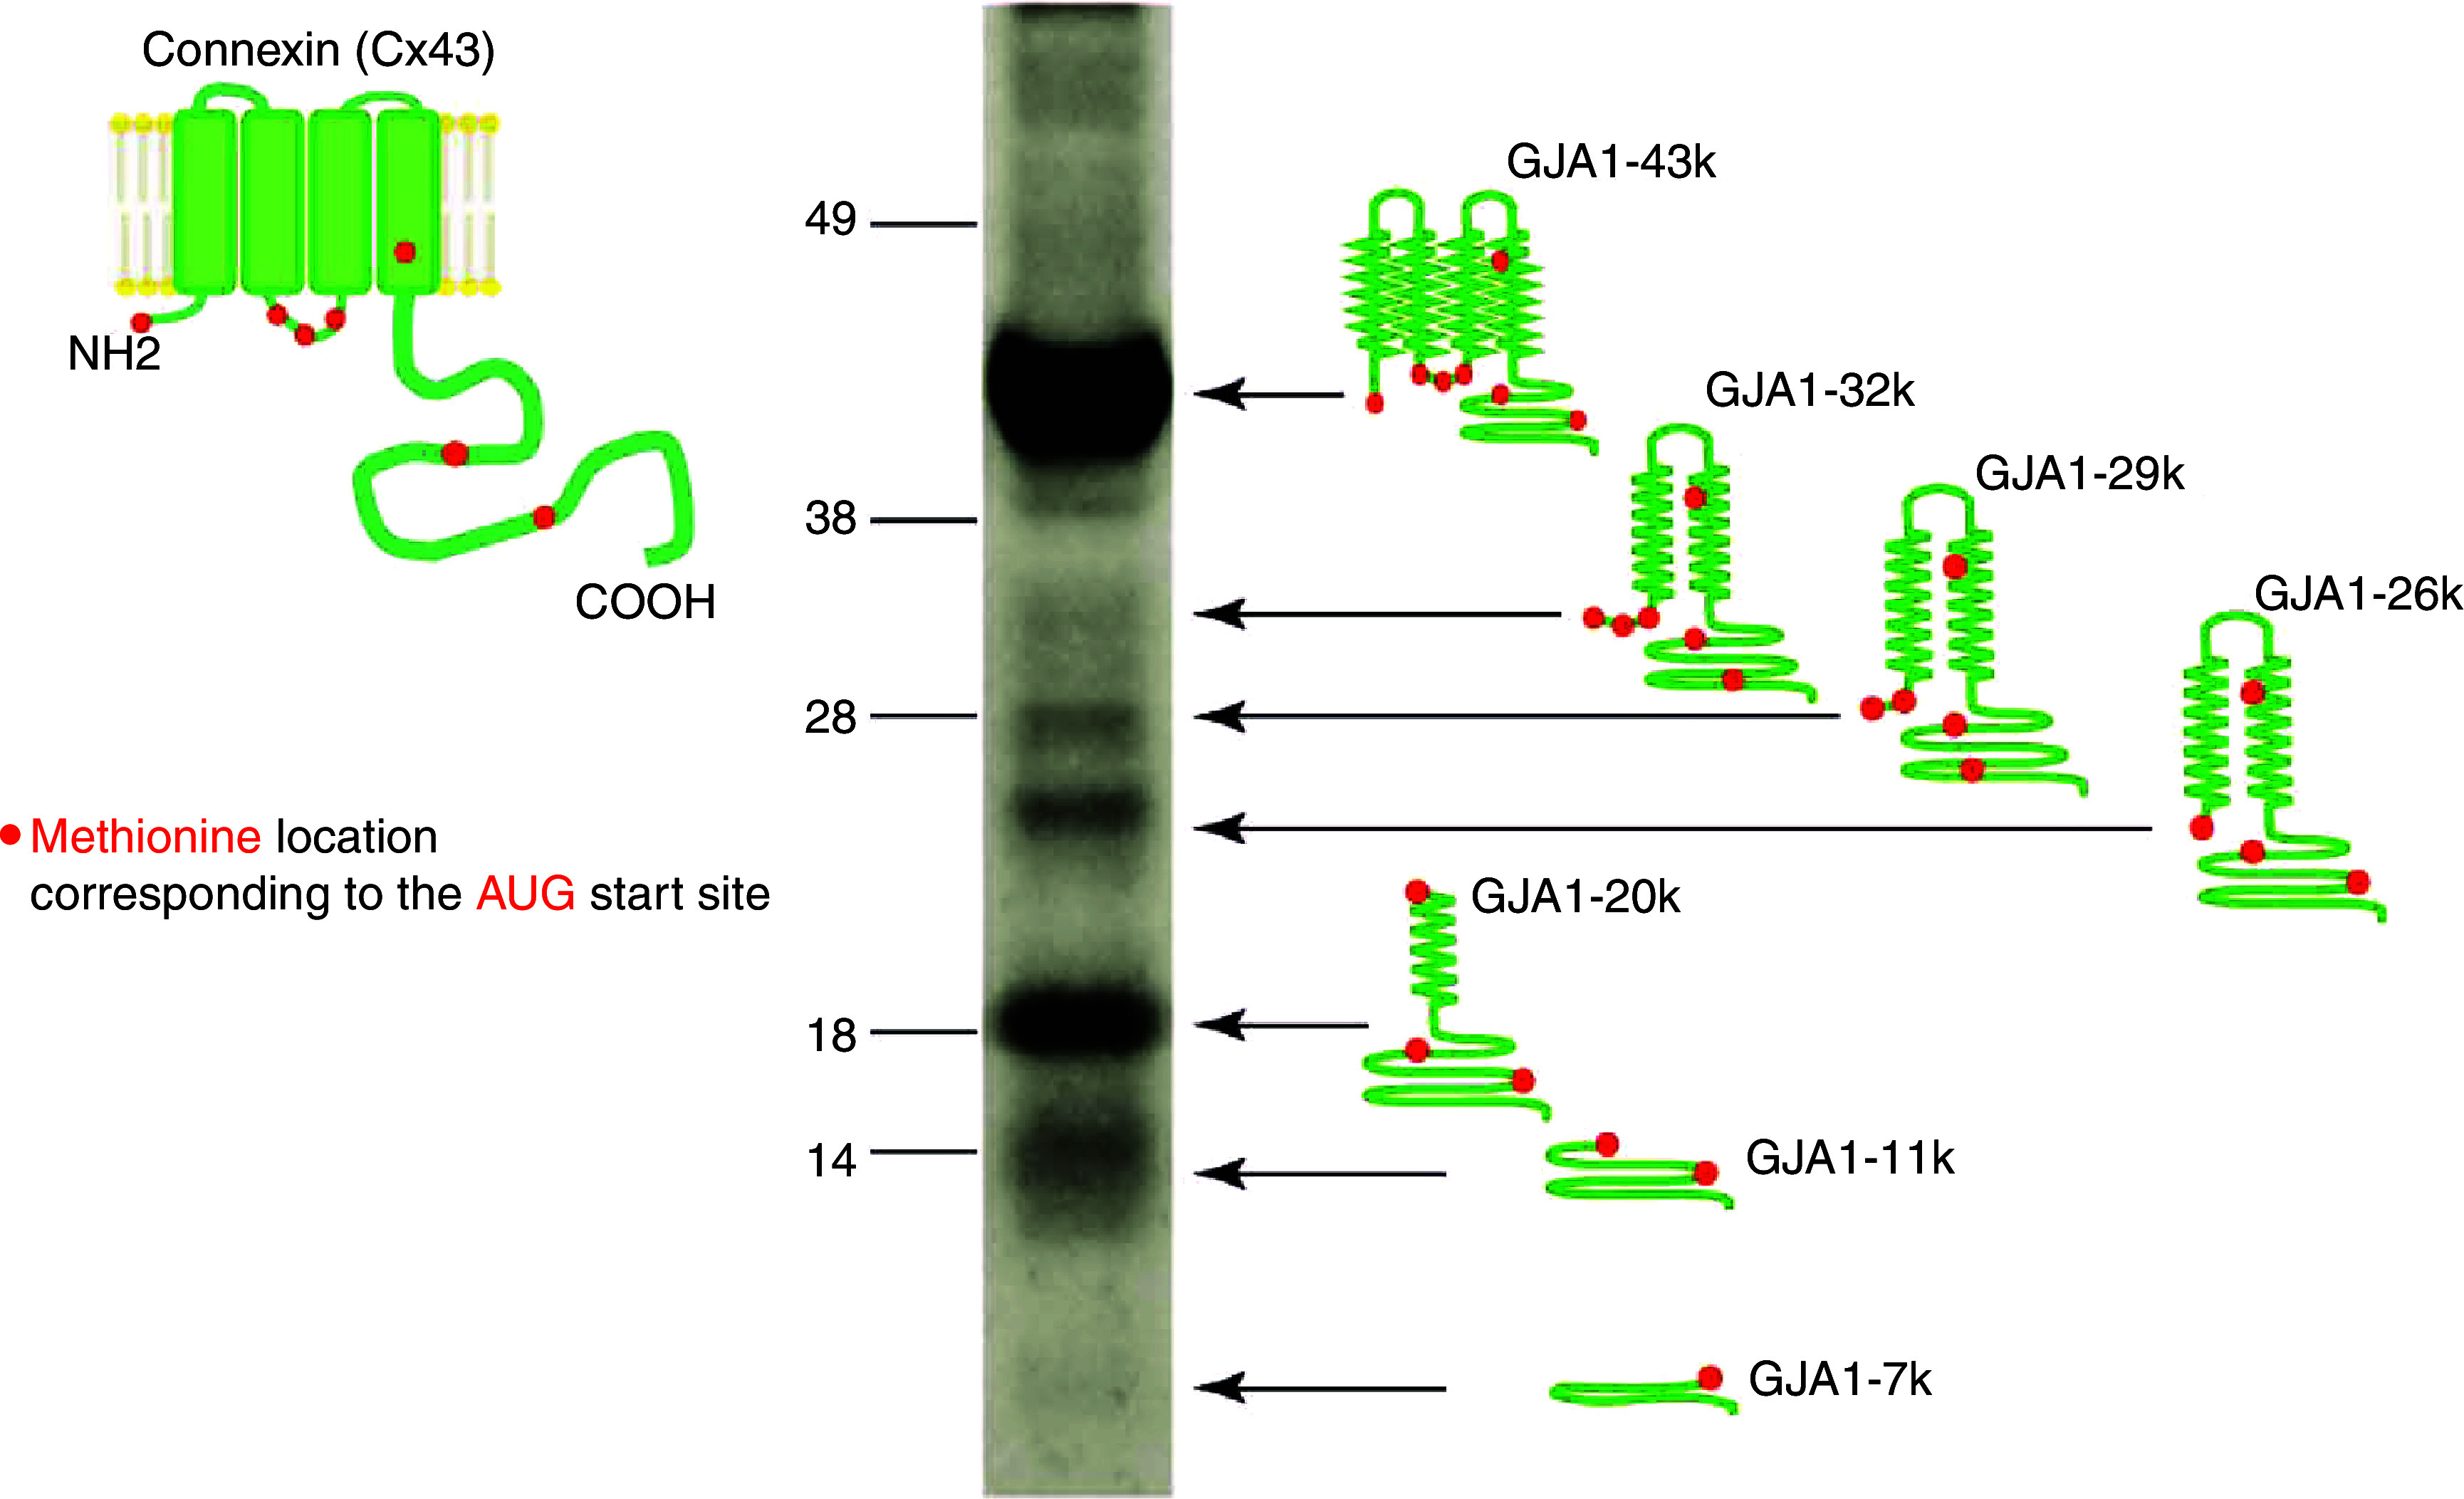
Multiple C-terminal isoforms of connexin 43 occur in human heart. Left: Schematic presentation of the full connexin43 molecule with N-terminal, 4 transmembrane domains and C-terminal (green) and locations of the amino acid methionine (red dots). Methionines are coded by AUG sequences within in the RNA, which act as start codons for internal translation. As a consequence, whole-cell Western blots show the main band at 43kD corresponding to full length Cx43 and the multiple isoforms of different length sketched on the right side, GJA-32k, GJA-29k, GJA-26k, GJA-20k, GJA-11k, and GJA-7k. These isoforms are regulated independently of the full-length Cx43 and exert specific biological effects. Reproduced with permission from I. Epifantseva et al., BioChim. Biophy. Acta, Biomembr. 1860, 1 (2018). Copyright 2018 Elsevier.90
III. CARDIAC ELECTRICAL PROPAGATION: THE ROLE OF CELL-TO-CELL COUPLING IN LINEAR STRUCTURES
Sections III and IV of this review article will focus on the biophysical laws governing cardiac propagation and the involvement of cell-to-cell coupling by gap junction channels in this process. Importantly, it will be shown that such a discussion is not possible without the consideration of the complex interaction between cell-to-cell coupling, flow of electrical charge through a variety of ion channels, and microscopic tissue structure.
A. Linear continuous and discontinuous propagation
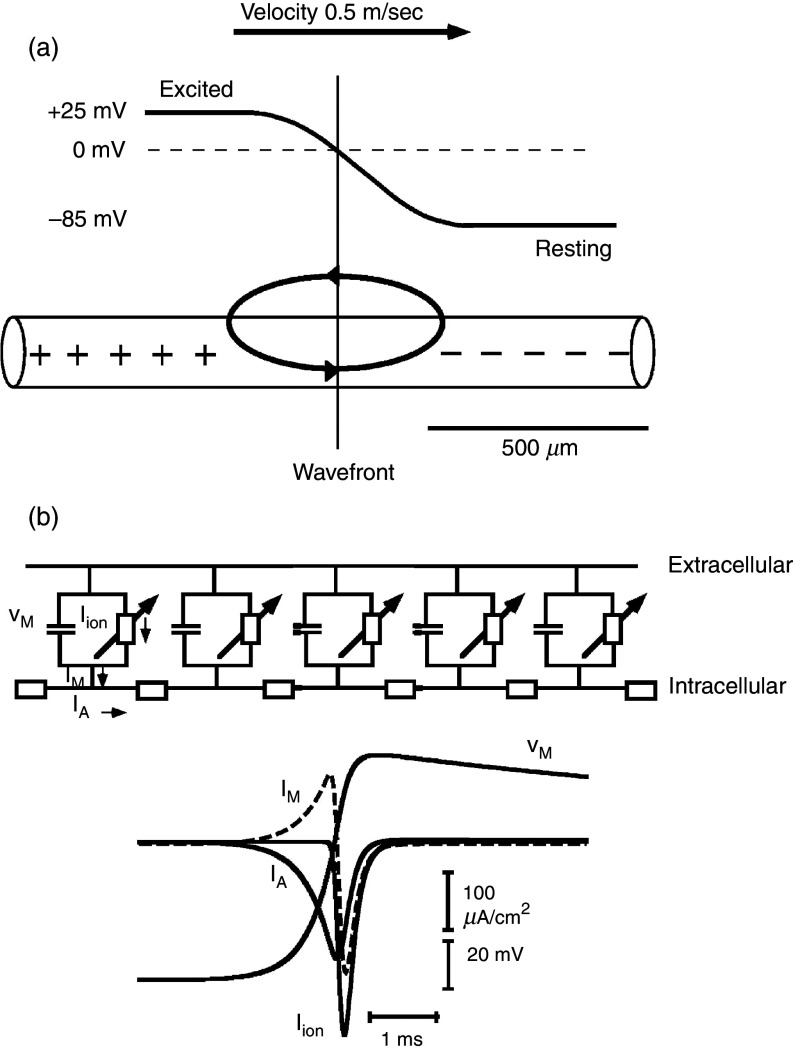
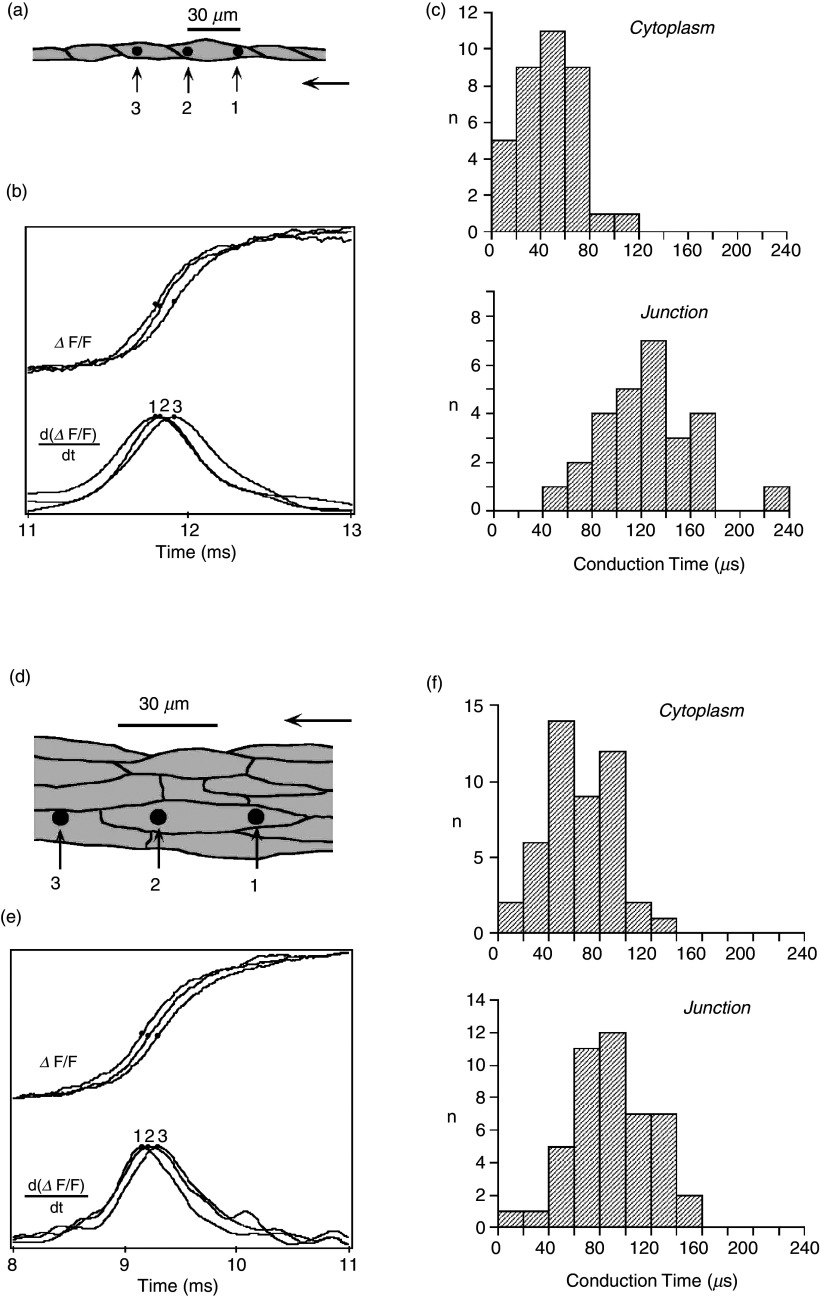
The so-called linear cable is the simplest way to represent a cardiac tissue strand (Fig. 8). Papillary muscles of young animals can be represented as linear cables and have been used for the definition of the so-called passive cable properties with a method developed in seminal work by Silvio Weidmann.64 These methods are useful for the definition of the gross intracellular and extracellular electrical resistivities and the determination of the time course of electrical uncoupling during myocardial ischemia and hypoxia.37,38,53 At the cellular level, theoretical work and experiments using engineered neonatal rat ventricular myocytes (NRVMs) have shown that cell borders in normal myocardial produce small resistive obstacles leading to microscopical discontinuities in intracellular impulse spread and to small gradients on action potential upstrokes.65,66 Experimentally, the role of cell borders in microscopical electrical propagation has been defined in linear chains of single NRVMs. High resolution mapping revealed that the conduction delay across a normal cell boundary is twofold the time needed for the impulse to travel within the cytoplasm (Fig. 9). Importantly, the longitudinally shaped myocytes are not registered side to side. Consequently, there is exchange of lateral electrical current between apposed cells. This lateral averaging leads to cancelation, or “local averaging” of differences in conduction times in 2-dimensional anisotropic networks.67
FIG. 8.
Linear excitable cable [panel (a)] and ion current flow [panel (b)] in one excitable element. Panel (a): Cylindrical excitable cable showing propagating wavefront with an upstream excited segment and downstream resting segment. The excited segment has a positive membrane potential (voltage difference between the inside of the cellular compartment and the outside reference). The downstream non-excited portion has a negative membrane potential. A loop of so-called “local current” or electrotonic current is set up and acts to excite the downstream segment and to propagate the electrical impulse. Of note, the electrical resistivity of the inside medium is not re-partitioned into cytoplasmic and cell-to-cell resistance in this model. Panel (b): An electrical equivalent circuit of a continuous model is depicted on the top with five excitable elements residing in the cell membrane. The intracellular space is represented by a single resistor. The exchange of electrical charge is shown on the lower part. Axial current, IA, initially flows from upstream sites into the membrane. During this phase, membrane current, IM, shifts the membrane potential, VM, to more positive values, toward the threshold of Na+ inward current. The subsequent peak and rapid change of IM reflects the activation of Na+ channels, illustrated by Iion. Flow of ionic current, Iion, charges the membrane capacitance, thereby producing the action potential. It also changes the sign of flow of the axial current, which now represents charge furnished by channel excitation and flowing into the downstream sink.
FIG. 9.
Electrical propagation at the cellular level. Panels (a)–(c): Propagation in a chain of a single cells [neonatal rat ventricular myocytes, panel (a) with dark dots showing locations of three light-sensitive diodes (6 μm in width)]. Two diodes are projected on the cytoplasm of a single cell; the third diode is placed in the adjacent cell, separated from the other diodes by a single cell junction. Panel (b) shows the change in fluorescence of a voltage-sensitive dye representing the action potential upstrokes. Panel (c): Cytoplasmic and cell-to-cell conduction times illustrating that a single cell-to-cell junction introduces a propagation delay of about 60 μs. Panels (d)–(f): Propagation in an anisotropic cellular network [panel (d)] with dark dots showing locations of light-sensitive diodes (6 μm in width). Panel (e): Fluorescence changes illustrating action potential upstrokes from the three diodes. Panel (f): In contrast to panel (c), there are no detectable propagation delays introduced by cell-to-cell junctions. Comparison of panels (c) and (f) indicates that lateral apposition of cells cancels delays produced by single cell-to-cell junctions (so-called “lateral averaging”). Reproduced with permission from V. G. Fast et al., Cir. Res. 73, 5 (1993). Copyright 1993 Wolters Kluwer Health, Inc.67
B. The role of gap junction channel distribution and cell size
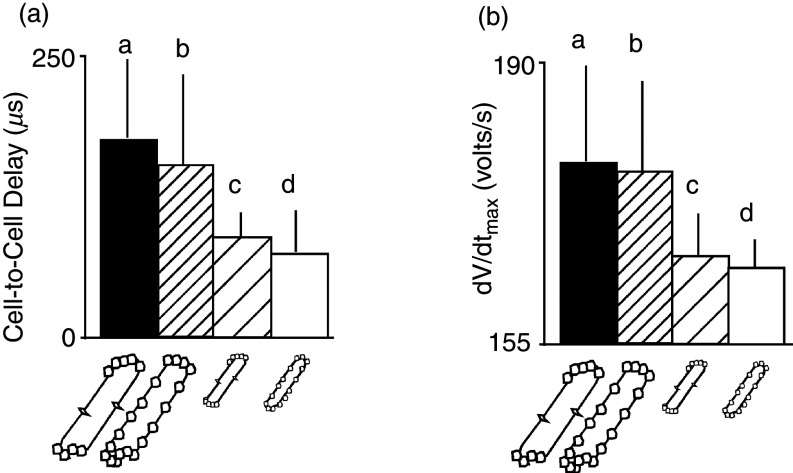
While the healthy myocardium of all species forms an anisotropic network, differences among species exist in cell size and the pattern of sites of electrical cell-to-cell coupling. Especially, intercalated disks and gap junctional plaques in neonatal tissue and tissue post-partum are arranged as more or less regularly spaced patches around the cell periphery, whereas sites of mechanical and functional cell-to-cell coupling in adult tissue are primarily concentrated at cell ends. In a morphometric study that addressed cell-to-cell coupling in canine myocardium in 3D, about two thirds of cell connections was attributed to longitudinal sites and one third to lateral sites.68 The functional consequences of cell size and the patterns of cell-to-cell coupling were addressed in a theoretical study by Spach et al.69 Interestingly, cell size is a major determinant of anisotropic propagation and propagation velocity, while the coupling pattern plays a significant but minor role (Fig. 10).
FIG. 10.
Simulated effects of gap junction distribution and cell size on cell-to-cell propagation delay and maximal upstroke velocity (dV/dtmax) of the transmembrane action potential. Panels (a) and (b) show four different cell types, two real cell types, and two fictive cell types. Cell type a corresponds to real dog ventricular myocyte of relatively large size with gap junctions predominantly at cell ends. Cell type b corresponds to a fictive myocyte of the size of a dog cell, but with gap junctions distributed regularly around the cell perimeter, typical for a rat neonatal ventricular myocyte. Cell type c corresponds to a fictive myocyte that has the small size of a rat ventricular myocyte, with gap junctions located predominantly at cell end (dog pattern). Cell type d represents a real rat neonatal ventricular myocyte with a relatively small size and gap junctions spaced regularly around the cell perimeter. Comparison of all four cell types illustrates that cell-to-cell propagation delays [panel (a)] and the maximal upstroke velocity of the transmembrane action potential [panel (b)] predominantly depend on cell size, whereas the gap junction distribution patterns play a minor role. Reproduced with permission from M. S. Spach et al., Circ. Res. 86, 3 (2000). Copyright 2000 Wolters Kluwer Health, Inc.69
C. The concept of safety factor of propagation
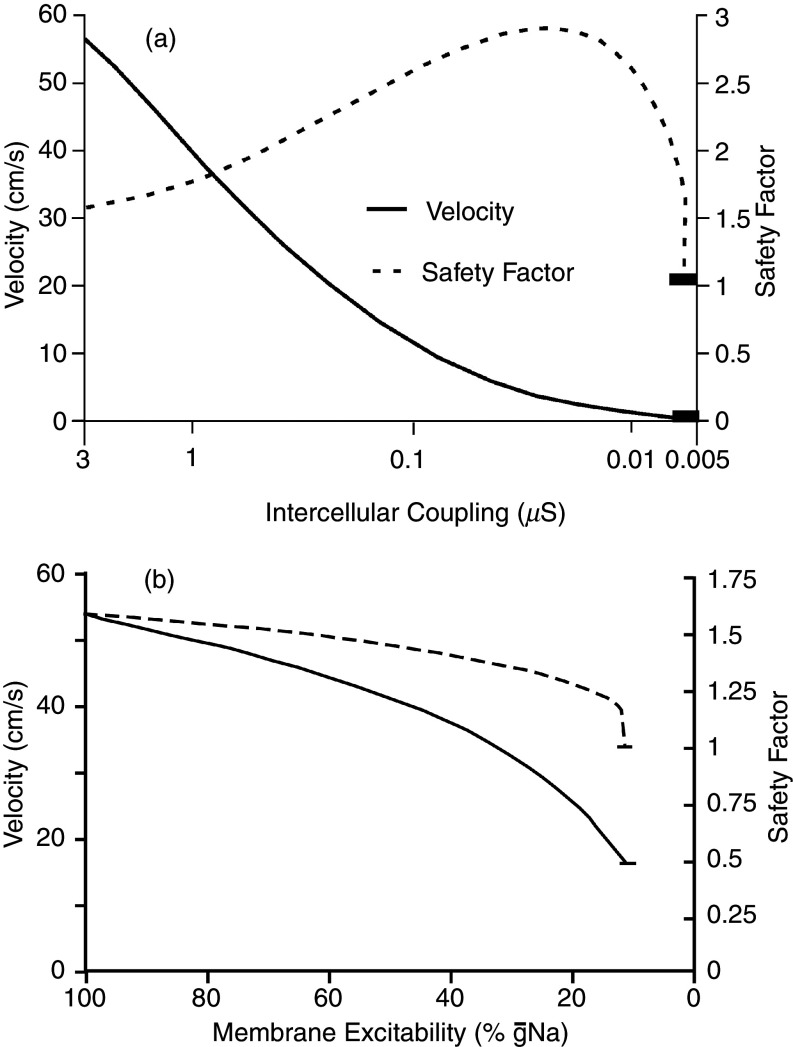
The safety factor of propagation is generally defined as a dimensionless parameter that informs about how secure a propagation wavefront is from failure and formation of propagation block. Formally, several approaches have been used for the biophysical definition of propagation safety and propagation block.66,70,71 A definition of safety factor for linear strands states that propagation is safe as long as the electrical charge movement caused by depolarizing ion channels excitation upstream of the wavefront produces enough electrotonic current to depolarize the resting downstream cells to threshold for excitation (Fig. 11). In the mathematical formulation [Eq. (1)], the safety factor (SF) is represented by the ratio of the charges generated by the excited cell as the numerator and the charge received by this cell from upstream axial current as the denominator. In turn, the numerator has two components: (1) the electrical charge movement through the ion channels flowing into the membrane capacitance, thereby producing the action potential (reflected by the maximal upstroke velocity of the action potential, dV/dtmax, in Fig. 11), and (2) the charge flowing as axial current downstream. Thus, depending on the size of the downstream axial current, the charge producing the action potential, and accordingly dV/dtmax, will vary. This axial current will depend on the downstream electrical impedance, the current sink. This explains why the shape of the cardiac action potential is not only determined by flow through the contributing ion channels but also by the sink, i.e., the resistive and capacitive properties of the tissue. According to this definition, propagation is safe as long as SF > 1. The formulation in Eq. (1) is very helpful for the estimation of the effect of changes in depolarizing ion channels and cell-to-cell uncoupling, as shown in Fig. 11,66
| (1) |
FIG. 11.
Safety factor (SF) of propagation and propagation velocity (PV) in a linear strand of simulated cells. Successful propagation and margin of safety are defined as SF >1 [see Eq. (1)]. Panel (a): Dependence of SF on cell-to-cell coupling. Note logarithmic scale on the abscissa. Of note, SF increases with cell-to-cell coupling until rapid block develops at high levels of uncoupling. The increase in SF is due to the decrease strand impedance following an increase in cell-to-cell resistance. Thus, partial cell-to-cell coupling protects propagation from being blocked, while at the same time decreasing propagation velocity. Panel (b): Decrease of SF with inhibition of Na+ channel conductance. Such inhibition could be due, for instance, to drug inhibition (antiarrhythmic drugs), genetic remodeling or reducing the availability of Na+ channels (ischemia). As a main difference between Panels (a) and (b), cell-to-cell uncoupling preserves propagation down to very slow conduction (≤10 cm/s), whereas block due to Na” channels inhibition occurs abruptly at velocities of > 15 cm/s. Reproduced with permission from R. M. Shaw et al., Circ. Res. 81, 5 (1997). Copyright 1997 Wolters Kluwer Health, Inc.66
In the case of cell-to-cell uncoupling, computation of SF shows that an increase in coupling resistance makes—in a first phase—propagation safer until SF decreases and produces propagation block. The initial increase is explained by the fact that cell-to-cell uncoupling reduces the size of the downstream sink, and excitatory current is more confined to the region just beyond the propagating wavefront. The second phase is explained by the massive reduction of electrotonic current eventually resulting in the failure to excite the downstream cells.
The definition of safety factor as formulated in Eq. (1) holds for a linear excitable structure with homogeneous electrical properties. An extension of the safety factor definition to multidimensional tissue has been published by Boyle and Vigmond.72
IV. THE EFFECT OF DISCONTINUOUS CELLULAR ARCHITECTURE AND NETWORK STRUCTURE
A. The structure of the normal myocardium can be represented by a discontinuous cellular network
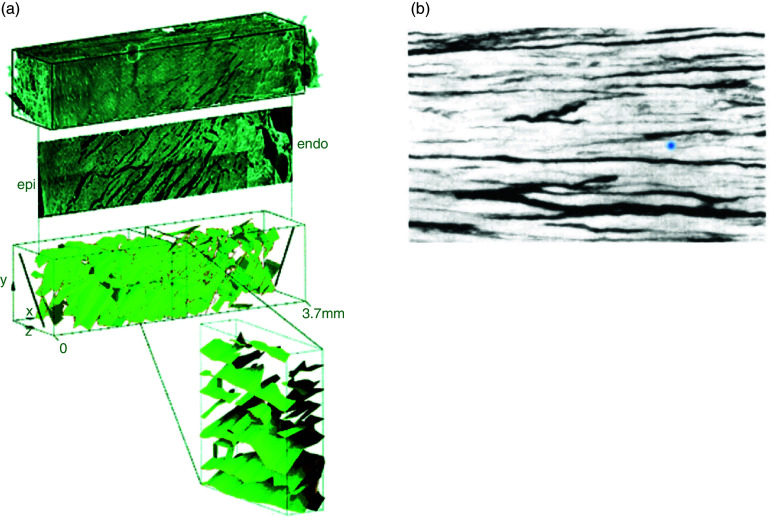
The working ventricular myocardium is composed, in its most part, of muscle layers arranged around the ventricular cavity with the main axis of anisotropy changing from the subepicardium to the subendocardium. These muscular layers or laminae are in average four cells in thickness. The laminae are separated by connective tissue and bridged by branches at a variable density within the ventricular wall.73,74 In addition to this dominating structure, very thin connective tissue sheets becoming more prominent with age separate individual muscle cells and affect microscopical propagation75,76 (Fig. 12). Moreover, pathological states lead to a significant increase in connective tissue with a general increase in connective tissue septa77 and/or a more disordered arrangement of connective tissue eventually forming a scar with surviving tissue strands intermingled with connective tissue.78
FIG. 12.
Discontinuous structure of the myocardium. Panel (a): Reconstructed volume of rat left myocardium shows complex arrangement of cleavage with each layer being 80 μm in thickness. Reproduced with permission from D. A. Hooks et al., Circ. Res. 91, 4 (2002). Copyright 2002 Wolters Kluwer Health, Inc.91 Panel (b): Connective tissue sheets separating human myocardial muscle bundles in atrial pectinate muscle. These connective tissue sheets are typically found in tissue from aged but not from young individuals. Reproduced with permission from M. S. Spach et al., Circ. Res. 58, 3 (1986). Copyright 1986 Wolters Kluwer Health, Inc.76
B. Mismatch between upstream source and downstream sink in cellular networks
A substantial amount of work has been published treating cardiac propagation across structural discontinuities, unveiling a special role of cardiac network structure in cardiac propagation. Structures such as geometrical expansions, pivot points, and narrow tissue isthmuses have been studied in cell cultures, in vivo preparations, and in theoretical work. While these structures have a quite varying structural appearance propagation across or around such structures, they share closely common biophysical rules characterized by a mismatch between the upstream driver of propagation and the downstream sink receiving excitatory current from the upstream site, corresponding to the discontinuous cardiac structure shown in Fig. 12. This is illustrated using an example from a theoretical work of Fast et al. 79 (Fig. 13), showing propagation across an abrupt tissue expansion. Figure 13 illustrates that unidirectional block develops depending on the diameter of the branch emerging into a bulk of tissue and the direction of propagation. In the case the small branch represents the upstream site, a small mass of cells will excite a larger cell mass in the bulk. Due to the changing geometry of the cellular network, the excitatory current produced in the upstream segment will disperse. The dispersion and the associated decrease in current density will produce a local decrease in propagation velocity. Block ensues if the local current density decreases below the value critical for excitation of depolarizing ion channels in the downstream segment. Inversely, propagation from the bulk segment to the small strand will increase local current density and propagation will be locally accelerated. This theoretically and experimentally demonstrated principle has also been quantified in theoretical work and described earlier in neuronal tissue.79–82
FIG. 13.
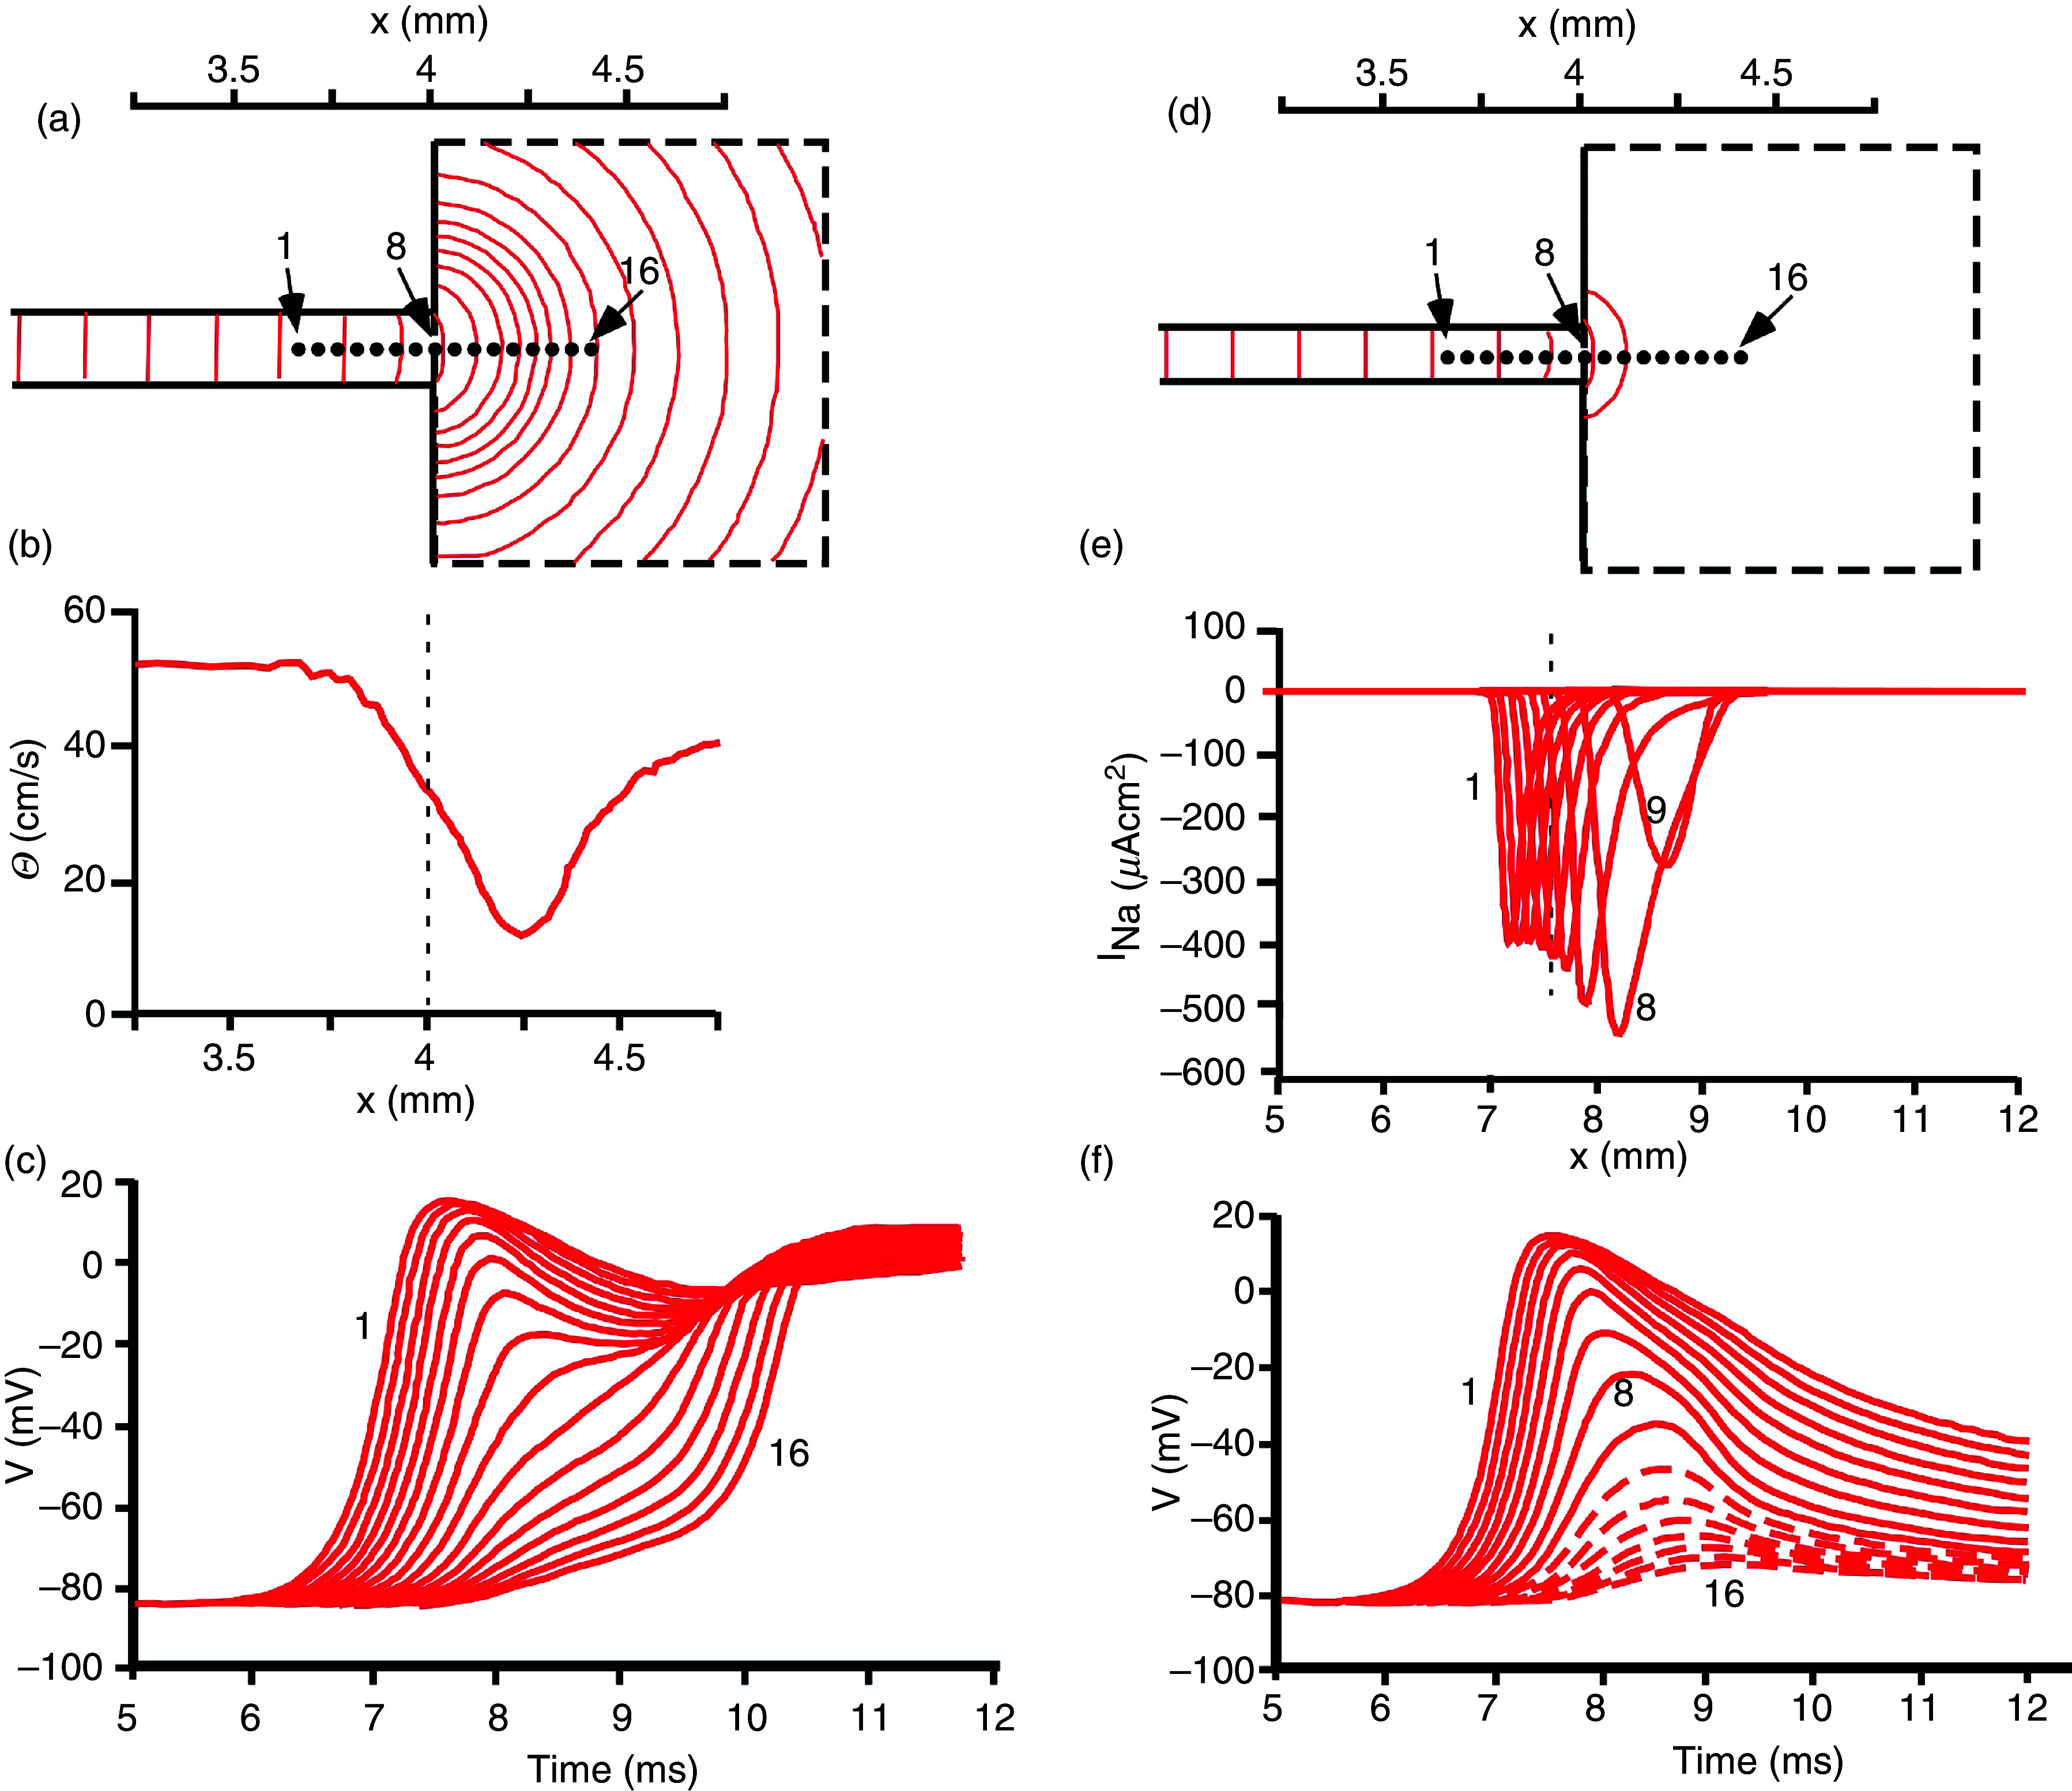
Simulation of electrical propagation across a site of source-to-sink mismatch. Panels (a)–(c): Action potentials propagate from a small strand of 200 μm in width into a large bulk. As a consequence of source-to-sink mismatch and dispersion of local current, isochrones beyond the geometrical transition are curved [panel (a)]. Local propagation velocity computed along the main axis (locations 1–16) shows a significant local decrease reflecting the source-to-load mismatch and the current dispersion. The same events produce the transient decrease in action potential upstrokes shown in panel (c) from sites 1 to 16. Panels (d)–(f): Action potentials propagate from a small strand of 175 μm in width into a large bulk. The smaller source, as compared to panels (a)–(c), produces propagation block at the transition. This can be detected from the absence of isochrones in the bulk [panel (d)] and the flow of inward sodium current (INa) beyond location in panel (e). In panel (f), action potential upstrokes are reflecting decremental propagation from locations 1 to 9. The voltage changes beyond diode 9 (site of block) are due to electrotonic spread and not associated with ion channel activation (interrupted lines). Reproduced with permission from V. G. Fast et al., Cardiovasc. Res. 30, 3 (1995). Copyright 1995 Oxford University Press.79
C. Interactions between changes in depolarizing ion current flow and changes in cell-to-cell coupling and structure affect electrical propagation
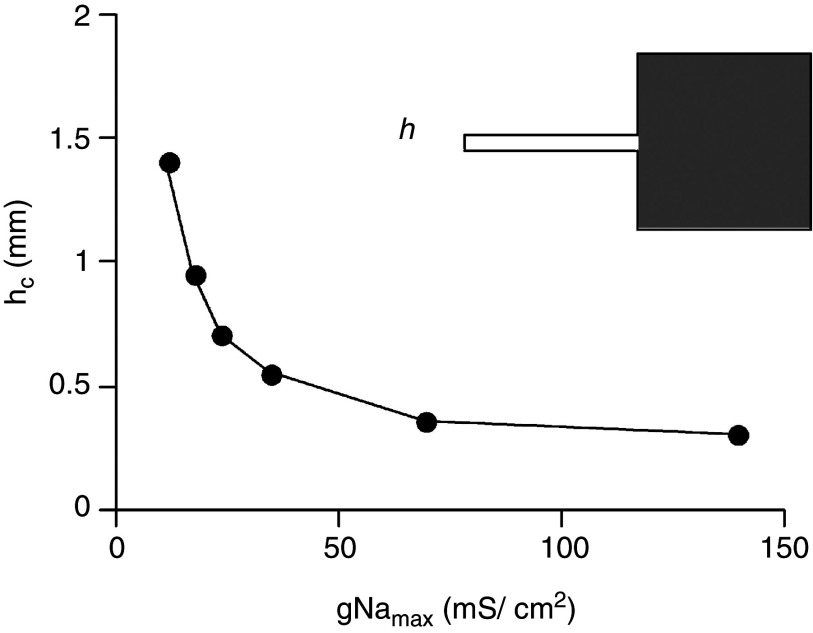
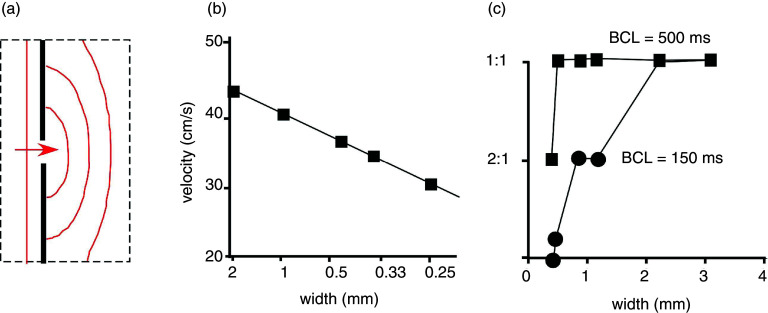
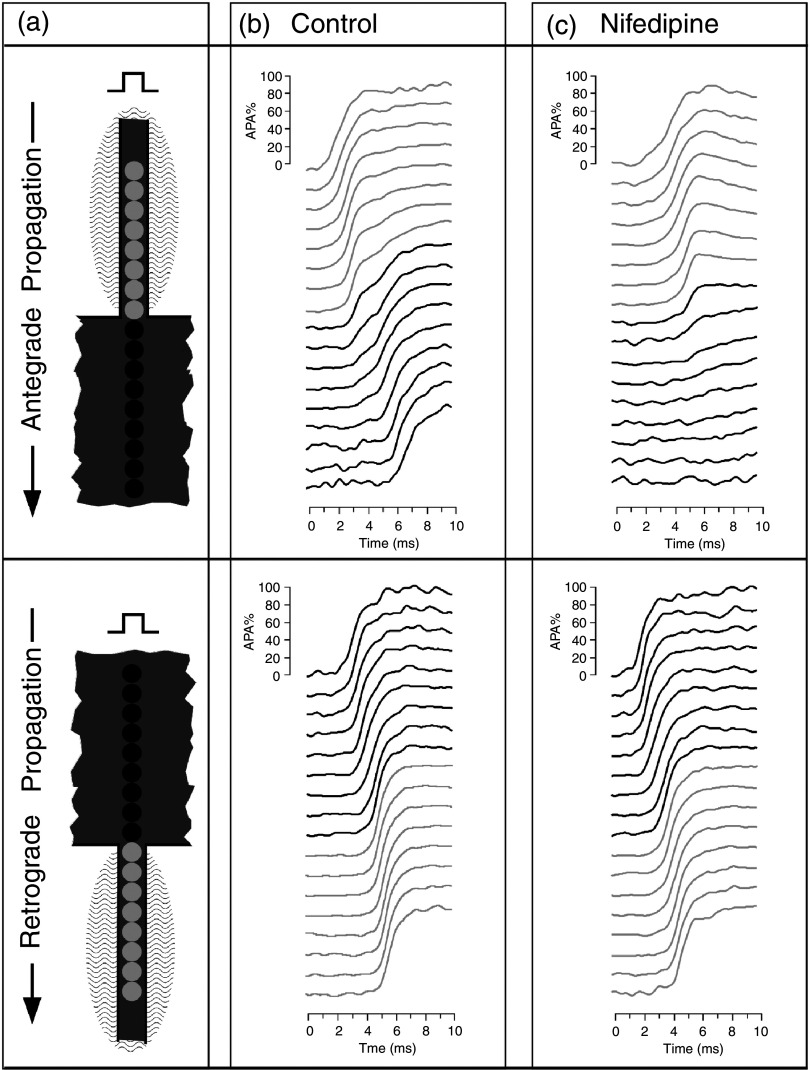
Source-to-load mismatch at tissue discontinuities leads to complex interactions between tissue structure(s), depolarizing ion currents and cell-to-cell coupling, which contribute to initiation and maintenance of circulating excitation and reentry. A first and simple relationship relates to the interaction between depolarizing ion currents and success of propagation at a site of current to load mismatch. Simulation of a first and intuitively simple relationship is depicted in Fig. 14, demonstrating that the success of forward propagation depends on the availability of Na+ channels. As a consequence, depolarizing the cell membrane (for instance in acute myocardial ischemia39) or inhibiting Na+ channels by antiarrhythmic drugs is expected to increase the likelihood of unidirectional block formation. A further important consequence of source-to-sink mismatch is that the formation of block gets more sensitive to heart rate, as illustrated in Fig. 15.83 In this example, taken from an in vitro study using slice of sheep ventricular tissue, the wavefront colliding with an obstacle containing a small conducting path or isthmus. This site of source-to-load mismatch produces, as excitation rate is increased, propagation slowing and eventually block. This phenomenon is explained by the decrease in availability of Na+ channels with increasing rate especially in depolarized tissue.84 It is likely to play an important role in arrhythmogenesis, when small changes in rate during rapid excitation (tachycardia) will determine whether a structural discontinuity will block the electrical impulse or not. Thus—dependent on the underlying excitation rate—the pathways of reentrant excitation during an arrhythmia may vary from beat to beat. A further, important consequence of structural discontinuities relates to the involvement of the Ca2+ inward current in propagation. The two main depolarizing currents system in cardiac cells, the rapid Na+ inward current (INa), flowing through Nav1.5 channels and the Ca2+ inward current, flowing mainly through L-Type Ca2+ channels (ICa,L), activate at different speeds. Time to peak flow of INa occurs within about 1 ms–1.5 ms, and peak flow of ICa,L after about 2 ms or more.85 As illustrated in Fig. 16, the propagation delay produced by a structural discontinuity can amount to 2 ms or more. As a consequence, ICa,L becomes a main driver of propagation, while activation of INa is too fast to excite the downstream cells. This interpretation is corroborated by the fact that propagation across the expansion responds to activators and blockers of INa and ICa,L, as anticipated.86
FIG. 14.
Effect of maximal conductance of Na+ channels, gNamax, on propagation across a tissue expansion (see also Fig. 13). The ordinate shows the critical strand width, hc, at which propagation block, illustrated in Fig. 13, occurs. At gNama ≤ 50 mS/cm2 propagation becomes very sensitive to small changes in conductance. Reproduced with permission from V. G. Fast et al., Cardiovasc. Res. 30, 3 (1995). Copyright 1995 Oxford University Press.79
FIG. 15.
Frequency dependence of propagation and propagation block at a so-called “isthmus,” a site of source-to-sink mismatch. Panel (a): Scheme of a small cleft (interruption of dark vertical line) produced in a sheet of subepicardial tissue form sheep ventricle. Source-to-sink mismatch is characterized by curved spread of propagation beyond the obstacle. Panel (b): Decrease of propagation velocity with decreasing cleft width (corresponding to increasing source-to-sink mismatch). Panel (c): Frequency dependence of propagation block at the isthmus. At a basic cycle length (BCL) = 500 ms (corresponding to a stimulation rate of 2 Hz), 1:1 propagation is preserved down to an isthmus width of 0.5 mm. At BCL of 150 ms (corresponding to a stimulation rate of 6.66 Hz), propagation block starts to develop at isthmus widths < 2 mm. Reproduced with permission from C. Cabo et al., Circ. Res. 75, 6 (1994). Copyright 1994 Wolters Kluwer Health, Inc.83
FIG. 16.
Role of Ca2+ inward current, ICa,L, in discontinuous propagation. Panel (a) depicts in the top part anterograde propagation from a small strand (light photosensitive diodes) into a bulk area (dark diodes) and in the bottom part retrograde propagation from the bull into the small strand. Signals are obtained from the fluorescence change of a voltage-sensitive dye in patterned neonatal rat myocytes. Panel (b) shows propagation during control. During anterograde propagation, the source-to-load mismatch produces a conduction delay at the transition of about 2 ms. During retrograde propagation, this delay is absent, because the cells in the strand receive excitatory current from a large bulk. Instead, the cells in the strand are excited almost simultaneously. Panel (c) shows the effect of superfusion of the small strand with Nifedipine, a blocker of ICa,L. Propagation from the small strand into the bulk becomes totally blocked. This demonstrates that ICa,L is needed to drive propagation across the geometrical expansion. The fact that Nifedipine has no effect on propagation in reverse direction proves that the source-to-load mismatch, a structural component, requires flow of ICa,L. Reproduced with permission from S. Rohr et al., Biophys. J. 72, 2 (1997). Copyright 1997 Elsevier.86
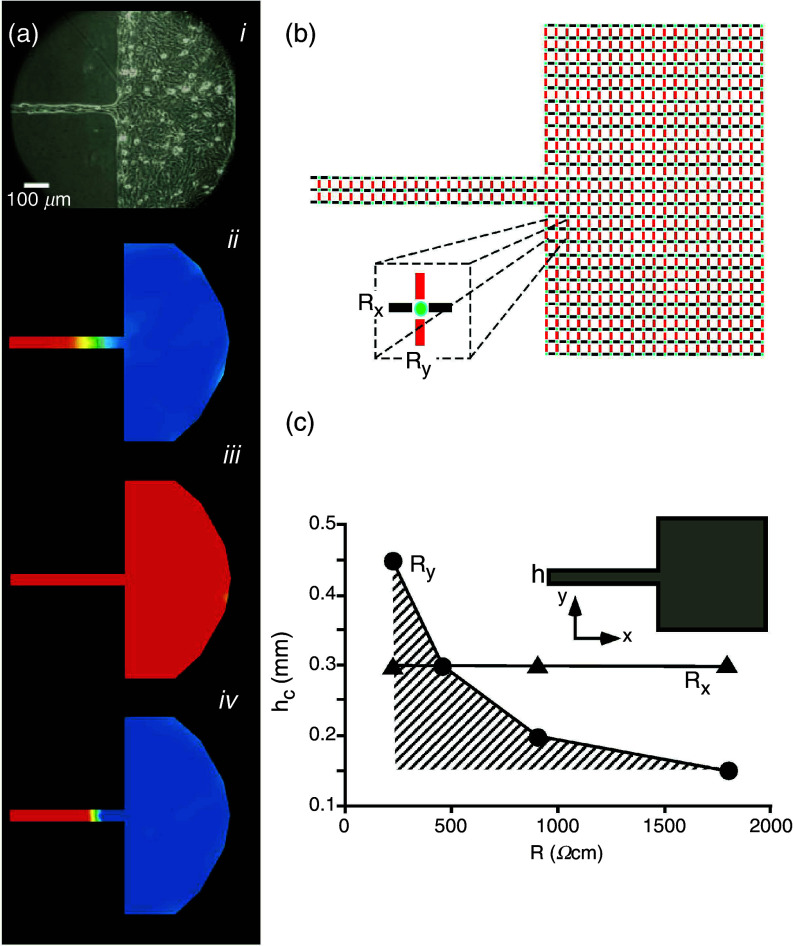
In addition to the discontinuous microscopic tissue architecture and ion currents, cell–to-cell coupling is the third major player affecting discontinuous conduction.79 In many pathological states (myocardial ischemia, cardiac failure), cell-to-cell coupling is reduced to various degrees as a result of myocardial remodeling or acute metabolic changes following arrest of coronary flow and withdrawal of oxygen.37,38,87,88 As discussed in the first paragraph of Sec. III C on linear propagation, cell-to-cell uncoupling slows propagation. In tissue with discontinuous architecture, there is a second effect, which is to decrease the effect of source-to-load mismatch, as shown in theoretical and experimental work (Fig. 17). This effect has been termed “paradoxical” because it can reverse unidirectional block to bidirectional propagation and thus decrease the likelihood for initiation of reentrant arrhythmias.89 The complexity of these effects makes it difficult to define the improvement of cell-to-cell coupling in pathological states by drugs as a straightforward beneficial pharmaceutical principle.
FIG. 17.
Interaction between cell-to-cell coupling and discontinuous propagation. Panel (a): Effect of partial cell-to-cell uncoupling on source-sink mismatch at a site of a tissue discontinuity. Aj: Picture of an engineered culture of neonatal rat ventricular myocytes with a narrow strand (width 50 μm) and transition to a bulk. Ajj: Propagation from the strand into the bulk produces propagation block at the transition. Excited cells (positive membrane potential) are depicted in red, tissue at resting potential level in blue. Propagation from the street to the bulk is blocked, because of source-to-load mismatch. Ajjj: Partial uncoupling with palmitoleic acid restores propagation. Ajv: Total uncoupling produces propagation block. Reproduced with permission from S. Rohr et al., Science 275, 5301 (1997). Copyright 1997 American Association for the Advancement of Science.89 Panel (b): Sketch explaining the biophysical mechanism: The simplified electrical equivalent circuit shows excitable elements (cells) in green, intercellular resistors representing gap junctions in the x-direction in black, and intercellular resistors representing gap junctions in the y-direction in red. Panel (c): Numerical presentation of the dependence of the critical strand width hc, producing propagation block, on cell-to-cell coupling (expressed as intercellular resistance). Hatched area corresponds to propagation block. An increase in coupling resistance, Ry, facilitates propagation, whereas changing Rx has no effect on block formation. This phenomenon is explained by the fact that the only an increase in Ry- resistors reduce the dispersion of current at the geometrical transition. Reproduced with permission from V. G. Fast et al., Cardiovasc. Res. 30, 3 (1995). Copyright 1995 Oxford University Press.79
V. SUMMARY
This review should provide a discussion of the complexities at the molecular, cellular, and tissue levels involved in the biology of gap junction channels and their role in cardiac propagation. Remodeling of myocardial tissue in disease involves a myriad of changes of genetic expression patterns, metabolism, contractile, and electrical function. As a consequence, the complex interactions of the effects of remodeling of structure, ion channels and electrical coupling on the myocardium in pathological states implicates a wholistic approach to developing potential therapeutic principles.
ACKNOWLEDGMENTS
The authors would like to acknowledge funding support from National Institutes of Health Grant No. R01-HL136463.
DATA AVAILABILITY
The data that support the findings of this study are available from the corresponding author upon reasonable request.
References
- 1. Morin D. P., Homoud M. K., and Estes N. A. M. III, Card. Electrophysiol. Clin. 9, 631 (2017). 10.1016/j.ccep.2017.07.012 [DOI] [PubMed] [Google Scholar]
- 2. Chugh S. S., Havmoeller R., Narayanan K., Singh D., Rienstra M., Benjamin E. J., Gillum R. F., Kim Y. H., J. H. McAnulty, Jr. , Zheng Z. J., Forouzanfar M. H., Naghavi M., Mensah G. A., Ezzati M., and Murray C. J., Circulation 129, 837 (2014). 10.1161/CIRCULATIONAHA.113.005119 [DOI] [PMC free article] [PubMed] [Google Scholar]
- 3. Kléber A., Janse M., and Fast V., “ Normal and abnormal conduction in the heart,” in The Handbook of Physiology. The Cardiovascular System. The Heart ( Oxford University Press, 2002), Vol. I, p. 455. [Google Scholar]
- 4. Weidmann S., J. Physiol. 118, 348 (1952). 10.1113/jphysiol.1952.sp004799 [DOI] [PMC free article] [PubMed] [Google Scholar]
- 5. Weidmann S., J. Physiol. 187, 323 (1966). 10.1113/jphysiol.1966.sp008092 [DOI] [PMC free article] [PubMed] [Google Scholar]
- 6. Harris A. L., Spray D. C., and Bennett M. V., J. Gen. Physiol. 77, 95 (1981). 10.1085/jgp.77.1.95 [DOI] [PMC free article] [PubMed] [Google Scholar]
- 7. Spray D. C., Harris A. L., and Bennett M. V., J. Gen. Physiol. 77, 77 (1981). 10.1085/jgp.77.1.77 [DOI] [PMC free article] [PubMed] [Google Scholar]
- 8. Bukauskas F. F., Kreuzberg M. M., Rackauskas M., Bukauskiene A., Bennett M. V., Verselis V. K., and Willecke K., Proc. Natl. Acad. Sci. U. S. A. 103, 9726 (2006). 10.1073/pnas.0603372103 [DOI] [PMC free article] [PubMed] [Google Scholar]
- 9. van Veen A. A., van Rijen H. V., and Opthof T., Cardiovasc. Res. 51, 217 (2001). 10.1016/S0008-6363(01)00324-8 [DOI] [PubMed] [Google Scholar]
- 10. Harris A. L., Q. Rev. Biophys. 34, 325 (2001). 10.1017/S0033583501003705 [DOI] [PubMed] [Google Scholar]
- 11. Martinez A. D., Hayrapetyan V., Moreno A. P., and Beyer E. C., Circ. Res. 90, 1100 (2002). 10.1161/01.RES.0000019580.64013.31 [DOI] [PubMed] [Google Scholar]
- 12. Gourdie R. G., Severs N. J., Green C. R., Rothery S., Germroth P., and Thompson R. P., J. Cell Sci. 105(4), 985 (1993). 10.1242/jcs.105.4.985 [DOI] [PubMed] [Google Scholar]
- 13. Rackauskas M., Kreuzberg M. M., Pranevicius M., Willecke K., Verselis V. K., and Bukauskas F. F., Biophys. J. 92, 1952 (2007). 10.1529/biophysj.106.099358 [DOI] [PMC free article] [PubMed] [Google Scholar]
- 14. Valiunas V., Weingart R., and Brink P. R., Circ. Res. 86, e42 (2000). 10.1161/01.res.86.2.e42 [DOI] [PubMed] [Google Scholar]
- 15. Cottrell G. T. and Burt J. M., Am. J. Physiol. Cell Physiol. 281, C1559 (2001). 10.1152/ajpcell.2001.281.5.C1559 [DOI] [PubMed] [Google Scholar]
- 16. Beauchamp P., Yamada K. A., Baertschi A. J., Green K., Kanter E. M., Saffitz J. E., and Kléber A. G., Circ. Res. 99, 1216 (2006). 10.1161/01.RES.0000250607.34498.b4 [DOI] [PubMed] [Google Scholar]
- 17. Desplantez T., McCain M. L., Beauchamp P., Rigoli G., Rothen-Rutishauser B., Parker K. K., and Kleber A. G., Cardiovasc. Res. 94, 58 (2012). 10.1093/cvr/cvs025 [DOI] [PMC free article] [PubMed] [Google Scholar]
- 18. Kanagaratnam P., Rothery S., Patel P., Severs N. J., and Peters N. S., J. Am. Coll. Cardiol. 39, 116 (2002). 10.1016/S0735-1097(01)01710-7 [DOI] [PubMed] [Google Scholar]
- 19. Thibodeau I. L., Xu J., Li Q., Liu G., Lam K., Veinot J. P., Birnie D. H., Jones D. L., Krahn A. D., Lemery R., Nicholson B. J., and Gollob M. H., Circulation 122, 236 (2010). 10.1161/CIRCULATIONAHA.110.961227 [DOI] [PubMed] [Google Scholar]
- 20. Lin X., Crye M., and Veenstra R. D., Circ. Res. 93, e63 (2003). 10.1161/01.RES.0000093379.61888.35 [DOI] [PubMed] [Google Scholar]
- 21. Vogel R. and Weingart R., J. Physiol. 510(1), 177 (1998). 10.1111/j.1469-7793.1998.177bz.x [DOI] [PMC free article] [PubMed] [Google Scholar]
- 22. Henriquez A. P., Vogel R., Muller-Borer B. J., Henriquez C. S., Weingart R., and Cascio W. E., Biophys. J. 81, 2112 (2001). 10.1016/S0006-3495(01)75859-6 [DOI] [PMC free article] [PubMed] [Google Scholar]
- 23. Shaw R. M., Fay A. J., Puthenveedu M. A., von Zastrow M., Jan Y. N., and Jan L. Y., Cell 128, 547 (2007). 10.1016/j.cell.2006.12.037 [DOI] [PMC free article] [PubMed] [Google Scholar]
- 24. Patel D. M., Dubash A. D., Kreitzer G., and Green K. J., J. Cell Biol. 206, 779 (2014). 10.1083/jcb.201312110 [DOI] [PMC free article] [PubMed] [Google Scholar]
- 25. Smyth J. W., Vogan J. M., Buch P. J., Zhang S. S., Fong T. S., Hong T. T., and Shaw R. M., Circ. Res. 110, 978 (2012). 10.1161/CIRCRESAHA.111.257964 [DOI] [PMC free article] [PubMed] [Google Scholar]
- 26. Zhuang J., Yamada K. A., Saffitz J. E., and Kléber A. G., Circ. Res. 87, 316 (2000). 10.1161/01.RES.87.4.316 [DOI] [PubMed] [Google Scholar]
- 27. Zhang S.-S., Hong S., Kléber A. G., Lee L. P., and Shaw R. M., FEBS Lett. 588, 1439 (2014). 10.1016/j.febslet.2014.01.002 [DOI] [PMC free article] [PubMed] [Google Scholar]
- 28. Xiao S., Shimura D., Baum R., Hernandez D. M., Agvanian S., Nagaoka Y., Katsumata M., Lampe P. D., Kléber A. G., Hong T., and Shaw R. M., J. Clin. Invest. 130, 4858 (2020). 10.1172/JCI134682 [DOI] [PMC free article] [PubMed] [Google Scholar]
- 29. Gaietta G., Deerinck T. J., Adams S. R., Bouwer J., Tour O., Laird D. W., Sosinsky G. E., Tsien R. Y., and Ellisman M. H., Sci. 296, 503 (2002). 10.1126/science.1068793 [DOI] [PubMed] [Google Scholar]
- 30. Smyth J. W., Zhang S. S., Sanchez J. M., Lamouille S., Vogan J. M., Hesketh G. G., Hong T. T., Tomaselli G., and Shaw R. M., Traffic 15, 684 (2014). 10.1111/tra.12169 [DOI] [PMC free article] [PubMed] [Google Scholar]
- 31. Deleze J., J. Physiol. 208, 547 (1970). 10.1113/jphysiol.1970.sp009136 [DOI] [PMC free article] [PubMed] [Google Scholar]
- 32. De Mello W. C., J. Physiol. 250, 231 (1975). 10.1113/jphysiol.1975.sp011051 [DOI] [PMC free article] [PubMed] [Google Scholar]
- 33. Reber W. R. and Weingart R., J. Physiol. 328, 87 (1982). 10.1113/jphysiol.1982.sp014254 [DOI] [PMC free article] [PubMed] [Google Scholar]
- 34. White R. L., Doeller J. E., Verselis V. K., and Wittenberg B. A., J. Gen. Physiol. 95, 1061 (1990). 10.1085/jgp.95.6.1061 [DOI] [PMC free article] [PubMed] [Google Scholar]
- 35. Burt J. M., Am. J. Physiol. 253, C607 (1987). 10.1152/ajpcell.1987.253.4.C607 [DOI] [PubMed] [Google Scholar]
- 36. Matsuda H., Kurata Y., Oka C., Matsuoka S., and Noma A., Prog. Biophys. Mol. Biol. 103, 102 (2010). 10.1016/j.pbiomolbio.2010.05.009 [DOI] [PubMed] [Google Scholar]
- 37. Kléber A. G., Riegger C. B., and Janse M. J., Circ. Res. 61, 271 (1987). 10.1161/01.RES.61.2.271 [DOI] [PubMed] [Google Scholar]
- 38. Riegger C. B., Alperovich G., and Kléber A. G., Circ. Res. 64, 532 (1989). 10.1161/01.RES.64.3.532 [DOI] [PubMed] [Google Scholar]
- 39. Janse M. J. and Wit A. L., Physiol. Rev. 69, 1049 (1989). 10.1152/physrev.1989.69.4.1049 [DOI] [PubMed] [Google Scholar]
- 40. Sperelakis N., Hoshiko T., and Berne R. M., Am. J. Physiol. 198, 531 (1960). 10.1152/ajplegacy.1960.198.3.531 [DOI] [PubMed] [Google Scholar]
- 41. Weidmann S., Annu. Rev. Physiol. 55, 1 (1993). 10.1146/annurev.ph.55.030193.000245 [DOI] [PubMed] [Google Scholar]
- 42. Rhett J. M., Ongstad E. L., Jourdan J., and Gourdie R. G., J. Membr. Biol. 245, 411 (2012). 10.1007/s00232-012-9465-z [DOI] [PMC free article] [PubMed] [Google Scholar]
- 43. Danik S. B., Rosner G., Lader J., Gutstein D. E., Fishman G. I., and Morley G. E., FASEB J. 22, 1204 (2008). 10.1096/fj.07-8974com [DOI] [PMC free article] [PubMed] [Google Scholar]
- 44. Gutstein D. E., Morley G. E., Vaidya D., Liu F., Chen F. L., Stuhlmann H., and Fishman G. I., Circulation 104, 1194 (2001). 10.1161/hc3601.093990 [DOI] [PubMed] [Google Scholar]
- 45. Veeraraghavan R., Gourdie R. G., and Poelzing S., Am. J. Physiol. Heart Circ. Physiol. 306, H619 (2014). 10.1152/ajpheart.00760.2013 [DOI] [PMC free article] [PubMed] [Google Scholar]
- 46. Kucera J. P., Rohr S., and Rudy Y., Circ. Res. 91, 1176 (2002). 10.1161/01.RES.0000046237.54156.0A [DOI] [PMC free article] [PubMed] [Google Scholar]
- 47. Mori Y., Fishman G. I., and Peskin C. S., Proc. Natl. Acad. Sci. U. S. A. 105, 6463 (2008). 10.1073/pnas.0801089105 [DOI] [PMC free article] [PubMed] [Google Scholar]
- 48. Veeraraghavan R., Hoeker G. S., Alvarez-Laviada A., Hoagland D., Wan X., King D. R., Sanchez-Alonso J., Chen C., Jourdan J., Isom L. L., Deschenes I., Smyth J. W., Gorelik J., Poelzing S., and Gourdie R. G., Elife 7, e37610 (2018). 10.7554/eLife.37610 [DOI] [PMC free article] [PubMed] [Google Scholar]
- 49. Abriel H., Rougier J. S., and Jalife J., Circ. Res. 116, 1971 (2015). 10.1161/CIRCRESAHA.116.305017 [DOI] [PMC free article] [PubMed] [Google Scholar]
- 50. Milstein M. L., Musa H., Balbuena D. P., Anumonwo J. M., Auerbach D. S., Furspan P. B., Hou L., Hu B., Schumacher S. M., Vaidyanathan R., Martens J. R., and Jalife J., Proc. Natl. Acad. Sci. U. S. A. 109, E2134 (2012). 10.1073/pnas.1109370109 [DOI] [PMC free article] [PubMed] [Google Scholar]
- 51. Hichri E., Abriel H., and Kucera J. P., J. Physiol. 596, 563 (2018). 10.1113/JP275351 [DOI] [PMC free article] [PubMed] [Google Scholar]
- 52. Roberts D. E., Hersh L. T., and Scher A. M., Circ. Res. 44, 701 (1979). 10.1161/01.RES.44.5.701 [DOI] [PubMed] [Google Scholar]
- 53. Kléber A. G. and Riegger C. B., J. Physiol. 385, 307 (1987). 10.1113/jphysiol.1987.sp016495 [DOI] [PMC free article] [PubMed] [Google Scholar]
- 54. Weingart R. and Maurer P., Circ. Res. 63, 72 (1988). 10.1161/01.RES.63.1.72 [DOI] [PubMed] [Google Scholar]
- 55. Beauchamp P., Choby C., Desplantez T., de Peyer K., Green K., Yamada K. A., Weingart R., Saffitz J. E., and Kléber A. G., Circ. Res. 95, 170 (2004). 10.1161/01.RES.0000134923.05174.2f [DOI] [PubMed] [Google Scholar]
- 56. Schulz R. and Heusch G., Cardiovasc. Res. 62, 335 (2004). 10.1016/j.cardiores.2003.12.017 [DOI] [PubMed] [Google Scholar]
- 57. Rhett J. M., Jourdan J., and Gourdie R. G., Mol. Biol. Cell 22, 1516 (2011). 10.1091/mbc.e10-06-0548 [DOI] [PMC free article] [PubMed] [Google Scholar]
- 58. Sáez J. C., Schalper K. A., Retamal M. A., Orellana J. A., Shoji K. F., and Bennett M. V., Exp. Cell Res. 316, 2377 (2010). 10.1016/j.yexcr.2010.05.026 [DOI] [PubMed] [Google Scholar]
- 59. De Smet M. A., Lissoni A., Nezlobinsky T., Wang N., Dries E., Perez-Hernandez M., Lin X., Amoni M., Vervliet T., Witschas K., Rothenberg E., Bultynck G., Schulz R., Panfilov A. V., Delmar M., Sipido K. R., and Leybaert L., J. Clin. Invest. 131, e137752 (2021). 10.1172/JCI137752 [DOI] [PMC free article] [PubMed] [Google Scholar]
- 60. Smyth J. W. and Shaw R. M., Cell Rep. 5, 611 (2013). 10.1016/j.celrep.2013.10.009 [DOI] [PMC free article] [PubMed] [Google Scholar]
- 61. Fu Y., Zhang S.-S., Xiao S., Basheer W. A., Baum R., Epifantseva I., Hong T., and Shaw R. M., Front. Physiol. 8, 905 (2017). 10.3389/fphys.2017.00905 [DOI] [PMC free article] [PubMed] [Google Scholar]
- 62. Basheer W. A., Fu Y., Shimura D., Xiao S., Agvanian S., Hernandez D. M., Hitzeman T. C., Hong T., and Shaw R. M., JCI insight 3, e121900 (2018). 10.1172/jci.insight.121900 [DOI] [PMC free article] [PubMed] [Google Scholar]
- 63. Basheer W. A., Xiao S., Epifantseva I., Fu Y., Kleber A. G., Hong T., and Shaw R. M., Circ. Res. 121, 1069 (2017). 10.1161/CIRCRESAHA.117.311955 [DOI] [PMC free article] [PubMed] [Google Scholar]
- 64. Weidmann S., J. Physiol. 210, 1041 (1970). 10.1113/jphysiol.1970.sp009256 [DOI] [PMC free article] [PubMed] [Google Scholar]
- 65. Spach M. S. and Heidlage J. F., Circ. Res. 76, 366 (1995). 10.1161/01.RES.76.3.366 [DOI] [PubMed] [Google Scholar]
- 66. Shaw R. M. and Rudy Y., Circ. Res. 81, 727 (1997). 10.1161/01.RES.81.5.727 [DOI] [PubMed] [Google Scholar]
- 67. Fast V. G. and Kléber A. G., Circ. Res. 73, 914 (1993). 10.1161/01.RES.73.5.914 [DOI] [PubMed] [Google Scholar]
- 68. Hoyt R. H., Cohen M. L., and Saffitz J. E., Circ. Res. 64, 563 (1989). 10.1161/01.RES.64.3.563 [DOI] [PubMed] [Google Scholar]
- 69. Spach M. S., Heidlage J. F., Dolber P. C., and Barr R. C., Circ. Res. 86, 302 (2000). 10.1161/01.RES.86.3.302 [DOI] [PubMed] [Google Scholar]
- 70. Delgado C., Steinhaus B., Delmar M., Chialvo D. R., and Jalife J., Circ. Res. 67, 97 (1990). 10.1161/01.RES.67.1.97 [DOI] [PubMed] [Google Scholar]
- 71. Leon L. J. and Roberge F. A., Circ. Res. 69, 378 (1991). 10.1161/01.RES.69.2.378 [DOI] [PubMed] [Google Scholar]
- 72. Boyle P. M. and Vigmond E. J., Biophys. J. 98, L57 (2010). 10.1016/j.bpj.2010.03.018 [DOI] [PMC free article] [PubMed] [Google Scholar]
- 73. LeGrice I. J., Smaill B. H., Chai L. Z., Edgar S. G., Gavin J. B., and Hunter P. J., Am. J. Physiol. Heart Circ. Physiol. 38, H571 (1995). 10.1152/ajpheart.1995.269.2.H571 [DOI] [PubMed] [Google Scholar]
- 74. Pope A. J., Sands G. B., Smaill B. H., and LeGrice I. J., Am. J. Physiol. Heart Circ. Physiol. 295, H1243 (2008). 10.1152/ajpheart.00484.2008 [DOI] [PMC free article] [PubMed] [Google Scholar]
- 75. Dolber P. C. and Spach M. S., Anat. Rec. 218, 45 (1987). 10.1002/ar.1092180109 [DOI] [PubMed] [Google Scholar]
- 76. Spach M. S. and Dolber P. C., Circ. Res. 58, 356 (1986). 10.1161/01.RES.58.3.356 [DOI] [PubMed] [Google Scholar]
- 77. Travers J. G., Kamal F. A., Robbins J., Yutzey K. E., and Blaxall B. C., Circ. Res. 118, 1021 (2016). 10.1161/CIRCRESAHA.115.306565 [DOI] [PMC free article] [PubMed] [Google Scholar]
- 78. Rutherford S. L., Trew M. L., Sands G. B., LeGrice I. J., and Smaill B. H., Circ. Res. 111, 301 (2012). 10.1161/CIRCRESAHA.111.260943 [DOI] [PubMed] [Google Scholar]
- 79. Fast V. G. and Kléber A. G., Cardiovasc. Res. 30, 449 (1995). 10.1016/S0008-6363(95)00071-2 [DOI] [PubMed] [Google Scholar]
- 80. Roth B. J., Crit. Rev. Biomed. Eng. 22, 253 (1994). [PubMed] [Google Scholar]
- 81. Fast V. G. and Kléber A. G., Cardiovasc. Res. 29, 697 (1995). 10.1016/S0008-6363(96)88643-3 [DOI] [PubMed] [Google Scholar]
- 82. Wang Y. and Rudy Y., Am. J. Physiol. Heart Circ. Physiol. 278, H1019 (2000). 10.1152/ajpheart.2000.278.4.H1019 [DOI] [PubMed] [Google Scholar]
- 83. Cabo C., Pertsov A. M., Baxter W. T., Davidenko J. M., Gray R. A., and Jalife J., Circ. Res. 75, 1014 (1994). 10.1161/01.RES.75.6.1014 [DOI] [PubMed] [Google Scholar]
- 84. Gettes L. S. and Reuter H., J. Physiol. 240, 703 (1974). 10.1113/jphysiol.1974.sp010630 [DOI] [PMC free article] [PubMed] [Google Scholar]
- 85. Jousset F. and Rohr S., Neurophotonics 2, 021011 (2015). 10.1117/1.NPh.2.2.021011 [DOI] [PMC free article] [PubMed] [Google Scholar]
- 86. Rohr S. and Kucera J., Biophys. J. 72, 754 (1997). 10.1016/S0006-3495(97)78710-1 [DOI] [PMC free article] [PubMed] [Google Scholar]
- 87. Severs N. J., J. Cardiovasc. Electrophysiol. 5, 462 (1994). 10.1111/j.1540-8167.1994.tb01185.x [DOI] [PubMed] [Google Scholar]
- 88. Severs N. J., J. Card. Fail. 8, S293 (2002). 10.1054/jcaf.2002.129255 [DOI] [PubMed] [Google Scholar]
- 89. Rohr S., Kucera J. P., Fast V. G., and Kléber A. G., Science 275, 841 (1997). 10.1126/science.275.5301.841 [DOI] [PubMed] [Google Scholar]
- 90. Epifantseva I. and Shaw R. M., Biochim. Biophys. Acta, Biomembr. 1860, 40 (2018). 10.1016/j.bbamem.2017.05.018 [DOI] [PMC free article] [PubMed] [Google Scholar]
- 91. Hooks D. A., Tomlinson K. A., Marsden S. G., LeGrice I. J., Smaill B. H., Pullan A. J., and Hunter P. J., Circ. Res 91, 331 (2002). 10.1161/01.RES.0000031957.70034.89 [DOI] [PubMed] [Google Scholar]
Associated Data
This section collects any data citations, data availability statements, or supplementary materials included in this article.
Data Availability Statement
The data that support the findings of this study are available from the corresponding author upon reasonable request.


