

SUMMARY
Background:
Dietary fructans may worsen gastrointestinal symptoms in children with irritable bowel syndrome (IBS).
Aim:
To determine whether gut microbiome composition and function are associated with childhood IBS fructan-induced symptoms.
Methods:
Fecal samples were collected from children 7–17 years (n=38) with pediatric Rome III IBS previously completing a double-blind, randomized, placebo-controlled crossover (fructan vs. maltodextrin) trial. Fructan sensitivity was defined as an increase of ≥30% in abdominal pain frequency during the fructan diet. Gut microbial composition was determined via 16Sv4 rDNA sequencing. LEfSe evaluated taxonomic composition differences. Tax4Fun2 predicted microbial fructan metabolic pathways.
Results:
At baseline, fructan sensitive (n=17) [vs. fructan tolerant (n=21)] subjects had lower alpha diversity (q<0.05) and were enriched in the genus Holdermania; in contrast, fructan tolerant subjects were enriched in fourteen genera from the class Clostridia. During the fructan diet, fructan sensitive (vs. tolerant) subjects were enriched in both Agathobacter (P=0.02) and Cyanobacteria (P=0.0001). In contrast, fructan tolerant subjects were enriched in three genera from the Clostridia class. Comparing the fructan vs. maltodextrin diet, fructan sensitive subjects had a significantly increased relative abundance of Bifidobacterium (P=0.02) while fructan tolerant subjects had increased Anaerostipes (P=0.03) during the fructan diet. Only fructan sensitive subjects had a trend toward increased predicted β-fructofuranosidase during the fructan vs. maltodextrin diet.
Conclusions:
Fructan sensitive children with IBS have distinct gut microbiome signatures. These microbiome signatures differ both at baseline and in response to a fructan challenge.
Keywords: FODMAP, Diet, Pediatric, Food, Inulin, Fructooligosaccharide
INTRODUCTION
Childhood irritable bowel syndrome (IBS) is extremely prevalent, affecting up to 20% of adolescents and schoolchildren worldwide.1 Similar to that in adults, childhood IBS is multifactorial with potential factors including: visceral hyperalgesia, psychosocial factors, gut microbial dysbiosis and diet.2 Diet is extremely important clinically as more than 90% of children and adolescents with IBS identify at least one food that exacerbates their IBS symptoms.3, 4 Dietary components which have garnered increasing attention as IBS symptom inducers are fermentable oligosaccharides disaccharides monosaccharides and polyol (FODMAP) carbohydrates. FODMAP carbohydrates may be malabsorbed and fermented: they include fructose, lactose, galactans, and fructans.5, 6
Fructans are oligosaccharides primarily composed of fructose polymers that are commonly ingested in the Western diet via frequently consumed foods (e.g., wheat and onions).7 Due to a lack of human hydrolases capable of breaking their internal β bonds, fructans arrive in the colon essentially intact and are rapidly fermented.8 Fructans induce IBS symptoms in some but not all adults with IBS.9 Similarly we have recently demonstrated that fructan sensitivity in childhood IBS is highly prevalent with approximately 50% of children having significant worsening of gastrointestinal symptoms (e.g., abdominal pain) during a randomized placebo-controlled fructan challenge.10 We also found baseline gastrointestinal symptoms (e.g. bloating), dietary intake, psychosocial factors (e.g. somatization), and gas production (e.g. breath hydrogen) could not differentiate fructan sensitive vs. tolerant subjects.4
Mechanistic understanding of how fructans induce functional bowel symptoms is lacking and elucidating these mechanism(s) has been determined by experts in the field as an important research goal.11 One potential mechanistic factor garnering increasing attention is the gut microbiome: in both children and adults with IBS, an individual’s gut microbiome composition is associated with symptom improvement on a low FODMAP diet.12, 13 In addition, gut microbiome changes (decreased Bifidobacterium abundance) occur in response to a low FODMAP diet.6, 14 Given the growing data related to the gut microbiome and symptoms in response to fermentable carbohydrate, we sought to determine whether gut microbiome composition and function are associated with fructan-induced symptoms. We hypothesized that children with IBS who are fructan sensitive (vs. tolerant) would be enriched in bacteria capable of metabolizing fructans and in microbial metabolic pathways related to fructan metabolism.
METHODS
Study Population
As previously reported, children with Rome III IBS completed a double-blind placebo (maltodextrin) controlled crossover trial during which either fructans (0.5 g/kg/day up to 19 g) or maltodextrin (same dosage) was provided as a drink along with low FODMAP foods for 72-hour periods.10, 15 Exclusion criteria included antibiotic or probiotic usage within 3 months of enrollment.10
A minimum 10-day washout period occurred between dietary interventions. Fecal samples were obtained at baseline (prior to any dietary intervention) and after a minimum of 24 hours into each dietary intervention (total 3 samples per individual). Dietary interventions have been shown to very rapidly (less than 24 hours) and reproducibly alter both human gut microbiome composition and function as measured via fecal samples.16 A stool “hat” placed in the toilet captured the subject’s bowel movement. The stool was then immediately transferred to a provided sterile container and placed in the subjects’ freezer. A courier transported each fecal specimen on ice to the investigators at which point they were stored at −80° Celsius.
Determination of Fructan Sensitivity
During each dietary intervention, subjects completed a validated diary that captured the number of abdominal pain episodes.10 Fructan sensitivity was defined as a 30% increase in abdominal pain episodes during the fructan- relative to the maltodextrin-intervention. This definition is supported by United States Food and Drug Administration and expert recommendations regarding clinically meaningful pain thresholds in IBS.17 Abdominal pain frequency rather than intensity was chosen given the short duration of the interventions, to be consistent with our previous work evaluating fructans in children with IBS, and because child self-reported abdominal pain intensity (as compared to presence or absence of pain identification) may not be reliable.10, 18 Fructan sensitivity was determined by comparing pain frequency during the fructan vs. maltodextrin dietary intervention periods as these periods controlled the subject’s dietary intake.
Microbiome Sequencing and Quality Control
Microbiome 16S rDNA sequencing and quality control were performed as previously described.19, 20 Briefly, DNA was extracted using a commercial DNA extraction kit (MoBio PowerSoil DNA Isolation KIT, MO-BIO Laboratories) following manufacturer’s instructions and consistent with Human Microbiome Project guidelines.21 The 16Sv4 region was amplified with barcoded primers (GGACTACHVGGGTWTCTAAT and GTGCCAGCMGCCGCGGTAA22) and sequenced via Illumina MiSeq. Quality control measures utilized included the use of non-template controls at the microbial DNA extraction and 16S rRNA gene amplification stages, which were carried through the sequencing process. Each extraction and sequencing run also included a set of positive controls used routinely by the Alkek Center for Metagenomics and Microbiome Research at Baylor College of Medicine as part of its quality management program in conformity with its Clinical Laboratory Improvement Amendments certification. One subject’s sample during the fructan challenge was unable to be sequenced and was removed from subsequent analyses.
Raw sequences were merged and quality filtered using USEARCH with parameters for merging including minimum overlap of 50 base pairs, truncation quality value of 5, and zero mismatches.23 Bowtie2 was used for Illumina PhiX control sequence removal24, while chimeras were removed by UPARSE. 25 The remaining sequences were clustered into operational taxonomic units (OTUs) via UPARSE with taxonomy assignment at 97% identity using the SILVA database (release 138).26 Samples were rarefied to 6736 reads/sample with all subsequent analyses based on this rarefaction.
Microbial Metabolic Pathway Predictions
Tax4Fun2 generated functional metagenomic predictions by linking taxonomic information from the 16S rRNA gene sequences to enzyme classification pathways of interest via KEGG (Kyoto Encyclopedia of Genes and Genomes) annotations of reference genomes.27 Enzyme classification pathways of interest related to fructan metabolism were determined by using the Carbohydrate-Active EnzYmes database.28 The inulin-type fructan metabolism enzyme classifications (EC) identified by Tax4Fun2 included: EC 3.2.1.26 (β-fructofuranosidase); EC 3.2.1.80 (exo-inulinase); and EC 4.2.2.17 (inulin fructotransferase DFA I forming).
Statistical Analyses
Pain frequency analyses were completed using Statistical Analysis Software (SAS) version 9.4 (SAS Institute, Cary, NC, USA). Mean abdominal pain frequency was compared between fructan sensitive vs. tolerant groups and between baseline and the dietary intervention periods (baseline vs. fructan vs. maltodextrin) using generalized linear models. This method enabled us to account for the repeated measurements of pain assessment within subjects. The models specified a random intercept and a fixed effect for fructan sensitivity status (sensitive vs tolerant), assessment period (baseline, fructan, maltodextrin) and sequence (fructan first, maltodextrin first). Pairwise comparisons in the pain frequency between the groups was examined after adjusting for multiple testing using the Tukey method. Since the response was modeled using a log function to account for its Poisson distribution, the parameter estimates and least square means were anti-logged to be interpreted on the response scale. This was achieved by taking the exponent to the baseline.
Microbiome related analyses were completed after the determination of fructan sensitivity. Agile Toolkit for Incisive Microbial Analyses 2 (ATIMA2) visualization and microbiome analysis toolkit was used to evaluate alpha and beta diversity, and to identify initial trends in taxa abundance. ATIMA2 is a standalone tool developed at the Alkek Center for Metagenomics and Microbiome Research built in R and combines publicly available packages and purpose-written code to import sample data and complete the analyses.29, 30 Both the number of OTUs and Shannon Index were used to evaluate and compare alpha diversity. The weighted UniFrac index was used to evaluate beta diversity (similarity and diversity between samples). Linear Discriminant Analysis Effect Size (LEfSe) available at http://huttenhower.sph.harvard.edu/galaxy was used to identify differences in taxa composition between subjects with different fructan sensitivities or between different study periods.31 As used in our previous work and followed by others in the field, we used both a logarithmic Linear Discriminant Analysis (LDA) log10 threshold of 2.0 and alpha value of 0.05 for the factorial Kruskal-Wallis test for identification of discriminative taxonomic features.12, 31 Only LEfSe discriminative features found in greater than 20% of the analyzed samples were reported. IBM SPSS (Armonk, NY) version 25 was used to compare baseline diet components (Mann-Whitney U) between fructan sensitive vs. tolerant participants (Table 1).
Table 1:
Baseline dietary intake in fructan sensitive vs. tolerant children with irritable bowel syndrome. No significant differences in dietary intake between the groups was identified. Diet record unavailable for 2 subjects.
| Nutrient* | Fructan Sensitive (n=16) | Fructan tolerant (n=20) |
|---|---|---|
| Energy (kcal/kg) | 37.3 ± 16.2 | 41.5 ± 13.3 |
| Total Fat | 1.7 ± 0.5 | 1.7 ± 0.6 |
| Total Carbohydrates | 10.1 ± 21 | 5.3 ± 1.8 |
| Total Protein | 1.4 ± 0.5 | 1.5 ± 0.4 |
| Fructose | 0.4 ± 0.3 | 0.4 ± 0.2 |
| Galactose | 0.003 ± 0.003 | 0.02 ± 0.4 |
| Glucose | 0.4 ± 0.3 | 0.4 ± 0.2 |
| Lactose | 0.2 ± 0.1 | 0.2 ± 0.1 |
| Sucrose | 0.8 ± 0.5 | 0.9 ± 0.5 |
| Starch | 2.4 ± 1.0 | 2.6 ± 0.8 |
| Added Sugars | 1.2 ± 0.7 | 1.2 ± 0.8 |
| Dietary Fiber | 0.3 ± 0.1 | 0.4 ± 0.2 |
| Total Polyols | 0.1 ± 0.1 | 0.1 ± 0.1 |
g/kg except where noted
RESULTS
Population
Thirty-eight children with IBS completed the crossover trial and provided fecal samples for analysis. All participants met a minimum adherence threshold of consuming more than 50% of the provided fructan and maltodextrin drinks. Subjects were composed of 28 (85%) females with a mean age of 11.7 (range: 7–16) years. The race of the subjects included: 27 (82%) White, 3 (9%) African American, 2 (6%) Mixed, 1 (3%) Asian. Nineteen (58%) were of Hispanic ethnicity.
Seventeen (45%) subjects were fructan sensitive (Supplementary Figure 1). There were no differences in baseline dietary intake or baseline pain frequency between fructan sensitive vs. fructan tolerant subjects (Table 1). There was a significant difference in abdominal pain frequency between the fructan (mean daily pain frequency=0.62, 95% CI=0.46, 0.84) and maltodextrin (mean daily pain frequency=0.48, 95% CI=0.35, 0.66) intervention periods (P=0.02). Among children classified as fructan sensitive, mean abdominal pain frequency was higher during the fructan intervention period (mean pain frequency=0.81, 95% CI=0.52, 1.3) compared to the maltodextrin intervention period (mean pain frequency=0.33, 95% CI=0.2, 0.53) (P=<0.0001). The reverse was seen among children classified as fructan tolerant, being lower during the fructan intervention period (mean pain frequency=0.48, 95% CI=0.31, 0.72) than the maltodextrin intervention period (mean pain frequency=0.72, 95% CI=0.48, 1.08) (P=0.0039). There was no effect for sequence on abdominal pain frequency.
There were no differences in age, gender, race, or ethnicity between fructan sensitive and fructan tolerant children (data not shown).
Microbial Diversity Evaluations
In fructan sensitive (vs. tolerant) subjects alpha diversity (diversity within samples) was decreased both at baseline and during the maltodextrin dietary challenge (Figure 1). Differences in α diversity between fructan sensitive vs. tolerant subjects were not present during the fructan challenge (Figure 1). When evaluating the entire cohort together, we did not identify significant changes in alpha diversity between the different study periods (Supplementary Figure 2).
Figure 1:
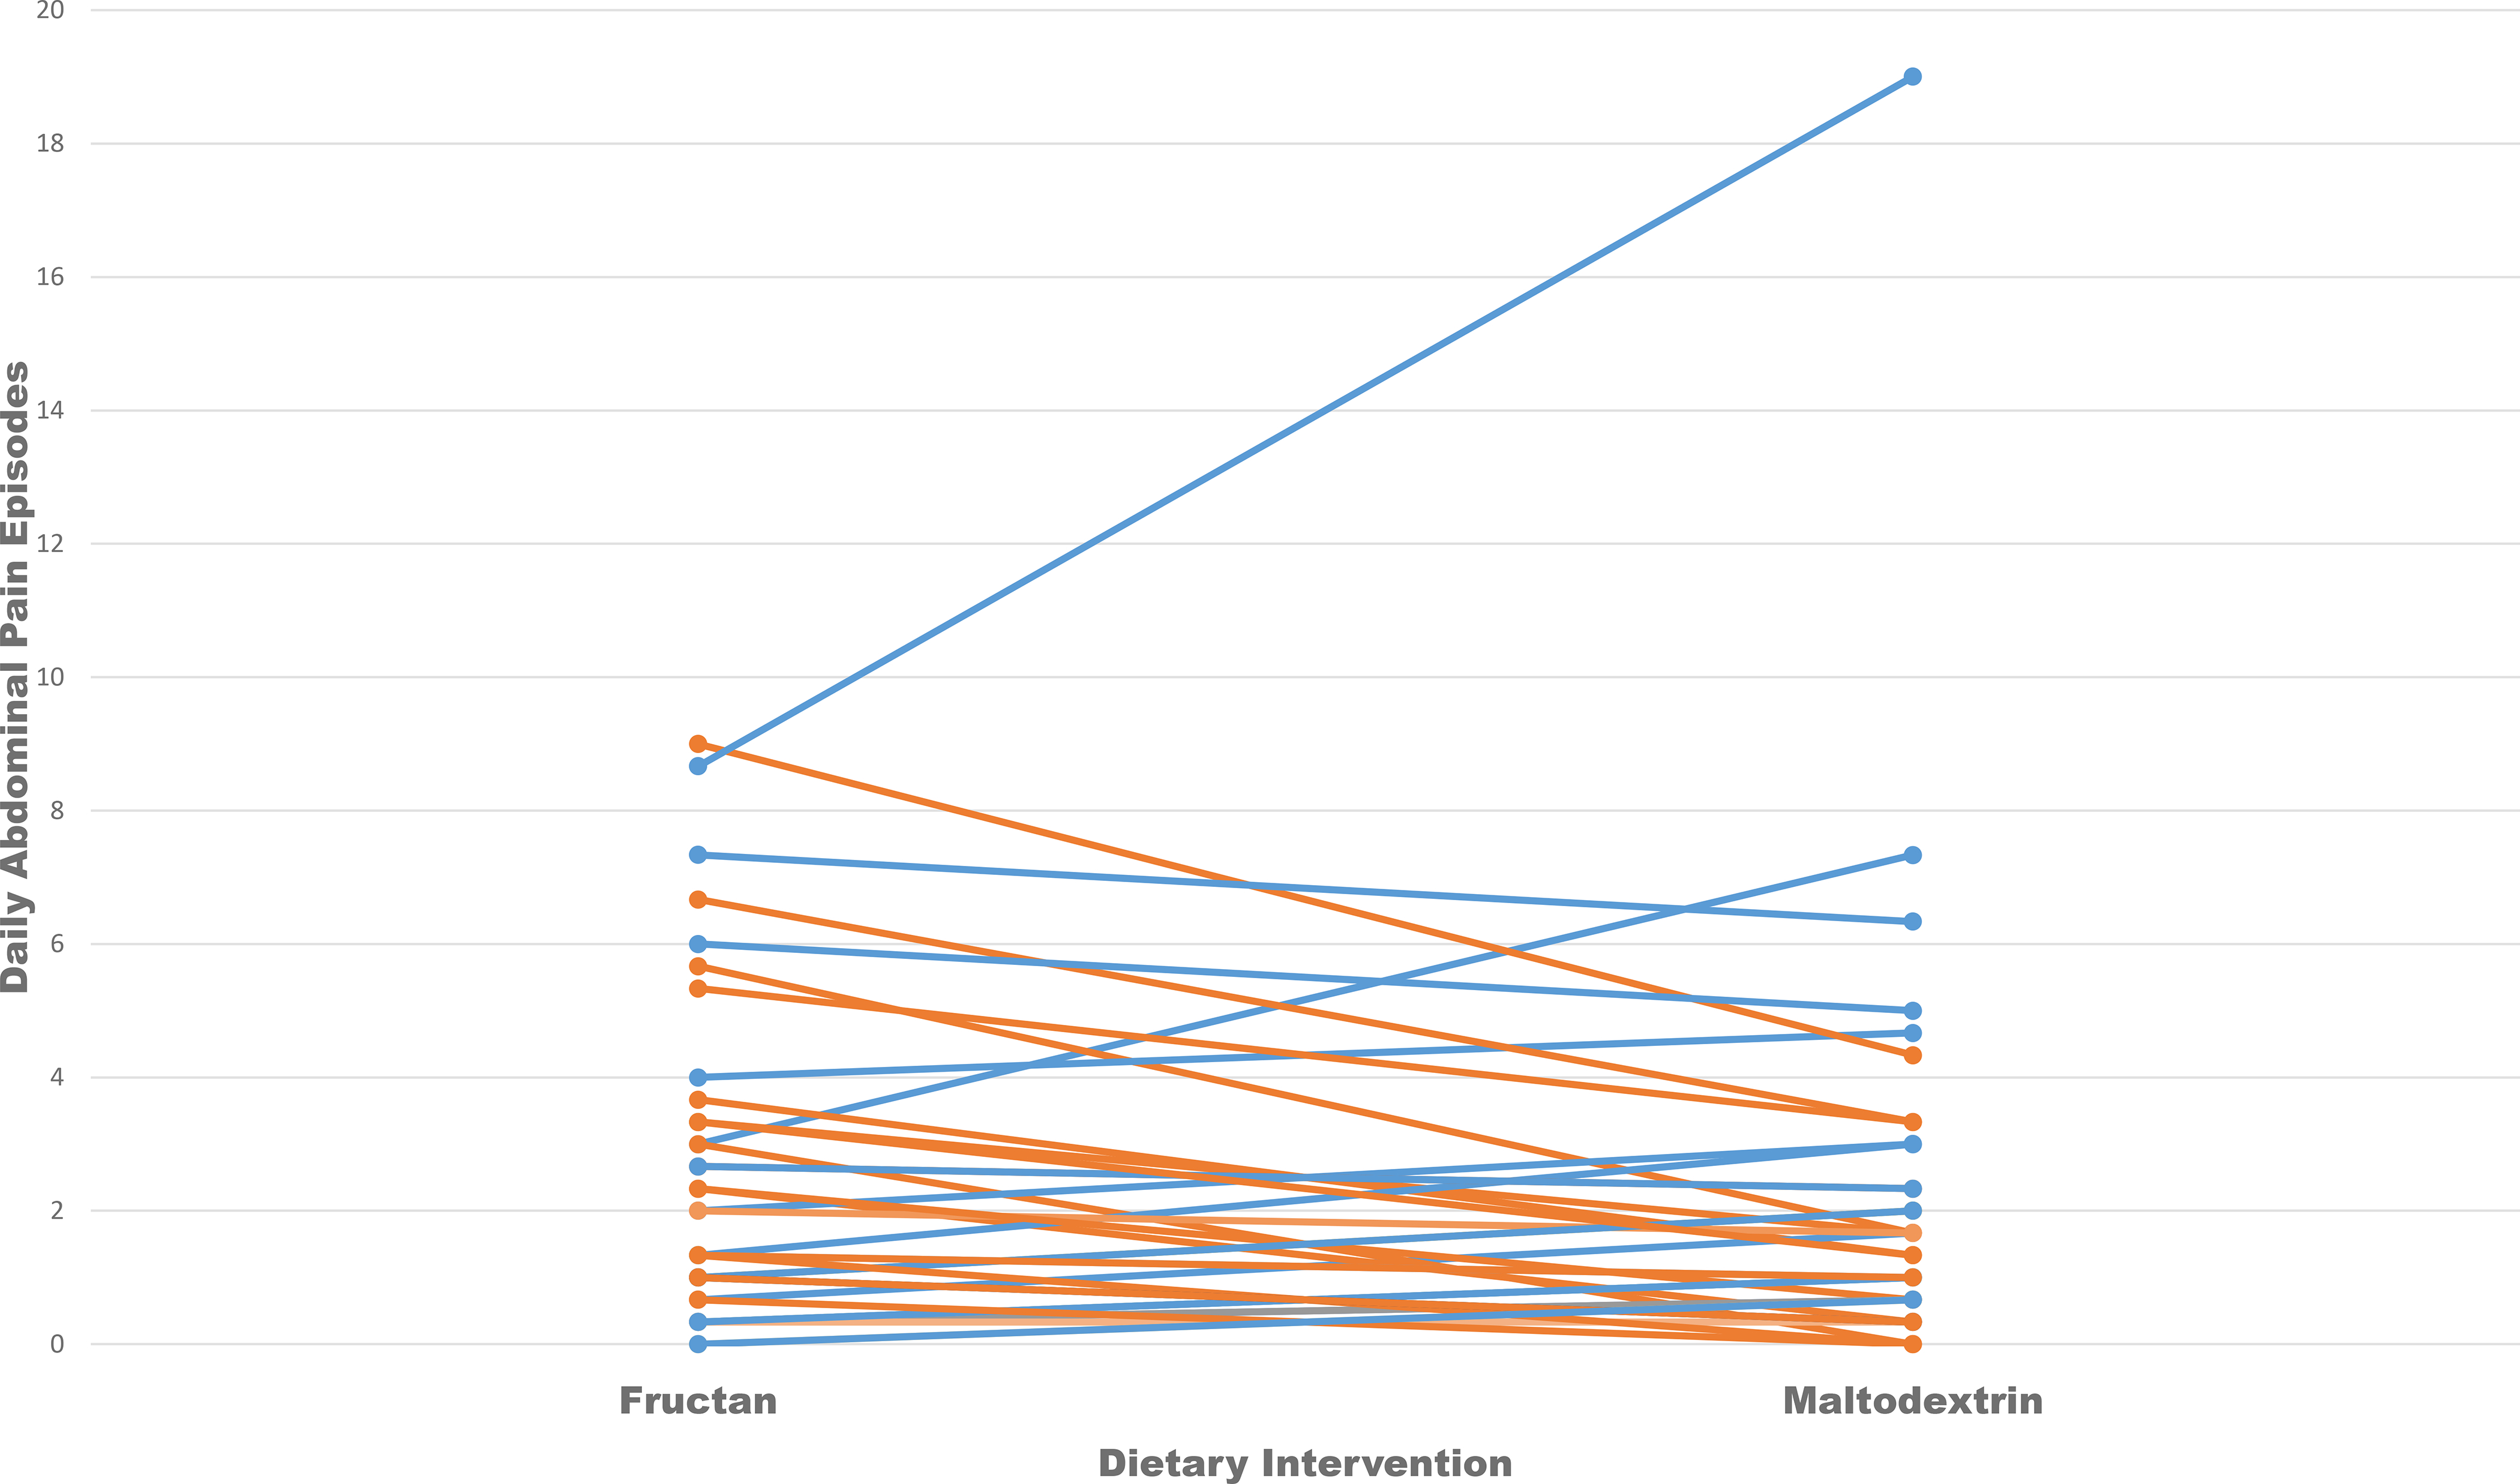
Daily abdominal pain frequency during the fructan vs. maltodextrin dietary intervention in 38 children with IBS classified as fructan sensitive (orange) vs. fructan tolerant (blue).
When including samples from all three (baseline and dietary interventions) periods, we identified a significant difference in beta diversity between fructan sensitive vs. tolerant subjects (Figure 3). Comparing fructan sensitive to tolerant subjects, we identified a significant difference in beta diversity (diversity between samples) at baseline and during the maltodextrin diet (Figure 2).
Figure 3:

Principal coordinates analysis plot based on unweighted Bray-Curtis distances of children with IBS during A) baseline B) fructan diet; and C) maltodextrin diet. Fructan sensitive (blue circles) subjects are compared to fructan tolerant (orange) subjects.
Figure 2:

Comparison of both median number (with 25–75% quartile boxplots) of observed operational taxonomic units (OTUs) and median Shannon index value between fructan sensitive (n=17, orange square/circles) and fructan tolerant (n=21, blue square/circles) children with IBS at baseline, during a fructan challenge, and during a maltodextrin challenge. Statistical comparisons are between fructan sensitive vs. tolerant subjects.
Taxonomic Comparisons between Fructan Sensitive and Fructan Tolerant Subjects During Each Study Period
At baseline, fructan sensitive (vs. tolerant) subjects were enriched in Holdemania (LDA=2.4, P=0.02). In contrast fructan tolerant subjects were enriched in 14 taxa within the Clostridia class including those from genera: Clostridium senso stricto, Blautia, and Ruminococcus (Table 2).
Table 2:
Operational taxonomic units (OTUs) enriched in fructan tolerant (vs. sensitive) children with irritable bowel syndrome at baseline as determined by Linear Discriminant Analysis (LDA) Effect Size. OTUs are assigned the taxonomy by lowest discernable taxonomic rank.
| OTU | Taxonomy | LDA (log 10) | P-Value |
|---|---|---|---|
| Unc01r5e | Clostridium_sensu_stricto_1 (genus) | 3.9 | .005 |
| UncO9244 | Blautia (genus) | 3.8 | .05 |
| Unc01fzy | Ruminococcus (genus) | 3. | .04 |
| Unc03qeu | Peptostreptococcaceae (family) | 3.7 | .03 |
| Unc0ps3k | Oscillospiraceae UCG_002 (genus) | 3.6 | .0008 |
| Unc02jj3 | Oscillospiraceae NK4A214 group (genus) | 3.2 | .04 |
| Unc01e6u | Ruminococcaceae (family) | 3.1 | .008 |
| Unc01xra | Eubacterium nodatum (genus) | 3.1 | .0008 |
| GHQSira3 | Eubacterium siraeum group (genus) | 3.0 | .007 |
| Unc011q4 | Oscillopspiraceae UCG_005 (genus) | 3.0 | .009 |
| Unc02kps | Christensenellaceae_R_7_group (genus) | 2.8 | .05 |
| UncR2457 | Oscillospiraceae UCG_002 (genus) | 2.8 | .03 |
| Unc01hni | Coprococcus (genus) | 2.7 | .05 |
| Unc0mkv4 | Lachnospiraceae (family) | 2.6 | .04 |
During the fructan challenge, fructan sensitive (vs. tolerant) subjects were enriched in taxa belonging to the genus Agathobacter (LDA=4.2, P=0.02) and phylum Cyanobacteria (LDA=3.1, P=0.0001). In contrast, fructan tolerant subjects remained enriched in three bacteria within the Clostridial class including those belonging to the genera: Roseburia (LDA=3.4, P=0.02), Eubacterium nodatum (LDA=3.2, P=0.02), and Ruminococcaceae (LDA=2.9, P=0.03).
During the maltodextrin challenge fructan tolerant subjects were relatively enriched in 12 genera within the class Clostridia. These genera included: Clostridium sensu stricto_1, Blautia, Ruminiclostridium 5, Ruminococcaceae, Intestinibacter, and Eubacterium coprostanoligenes group (Table 3). In contrast, during the maltodextrin challenge fructan sensitive subjects were relatively enriched in Flavonifractor (LDA=2.9; P=.02)
Table 3:
Operational taxonomic units (OTUs) enriched in fructan tolerant (vs. sensitive) children with irritable bowel syndrome during a maltodextrin challenge as determined by Linear Discriminant Analysis (LDA) Effect Size. OTUs are assigned the taxonomy by lowest discernible taxonomic rank.
| OTU | Taxonomy | LDA (log 10) | P-Value |
|---|---|---|---|
| UncO9244 | Blautia (genus) | 4.1 | .02 |
| Unc52498 | Peptostreptococcaceae (family) | 3.9 | .008 |
| Unc92900 | Lachnospiraceae_NK4A136_group (genus) | 3.5 | .006 |
| Unc0pnyb | Eubacterium coprostanoligenes group (family) | 3.5 | .02 |
| Unc0281y | Intestinibacter (genus) | 3.5 | .02 |
| Unc0ps3k | Oscillospiraceae UCG_002 (genus) | 3.2 | .05 |
| Unc01e6u | Ruminococcaceae (family) | 3.1 | .01 |
| Unc02kps | Christensenellaceae_R_7_group (genus) | 2.9 | .02 |
| Unc011q4 | Oscillospiraceae UCG_005 (genus) | 2.8 | .02 |
| Unc52498 | Ruminococcaceae (family) | 2.7 | .02 |
| ZZZ16766 | Lachnoclostridium (genus) | 2.4 | .05 |
Evaluation of Taxonomic Changes Occurring During the Fructan vs. Maltodextrin Dietary Interventions
When evaluating taxonomic changes occurring during the fructan vs maltodextrin dietary periods in the entire cohort, we identified differences in relative abundance changes based on fructan sensitivity. Fructan sensitive but not fructan tolerant subjects had a significant increase in Bifidobacteria (LDA=4.5; P=0.02) during the fructan vs. maltodextrin diet (relative abundance median 8.2% vs. 2.4%, respectively). In contrast, fructan tolerant but not fructan sensitive subjects had a significant relative abundance increase in Anaerostipes (LDA=4.0; P=0.03) during the fructan vs. maltodextrin diet (relative abundance median 3.8% vs. 3%, respectively). Fructan tolerant subjects had a relative abundance increase of Lachnospiraceae_UCG_008 (LDA=3.3; P=0.05) during the maltodextrin diet.
Predicted Microbial Fructan Metabolism Pathways
While we did not identify a difference at baseline, there was a trend increase in inulin fructotransferase (EC.4.2.2.17) in fructan tolerant (vs. fructan sensitive) subjects during the fructan challenge (P=0.052) and maltodextrin challenge (P=0.052). We did not identify statistically significant differences in relative abundance of the predicted beta-fructofuranosidase or exo-inulinase pathways between fructan sensitive and fructan insensitive subjects at baseline or during either the fructan or maltodextrin challenges.
Evaluation of Changes in Relative Abundance of Predicted Microbial Fructan Metabolism Pathways During the Fructan vs. Maltodextrin Dietary Interventions
During the fructan (vs. maltodextrin) challenge, fructan sensitive subjects had a trend increase (1.6x fold change, P=0.058) in β-fructofuranosidase EC:3.2.1.26. Within fructan sensitive subjects we did not identify significant changes in either fructan β fructosidase or inulin fructotransferase comparing the fructan (vs. maltodextrin) challenge. We did not identify significant changes in any of the evaluated pathways within fructan tolerant subjects during the fructan (vs. maltodextrin) challenge.
DISCUSSION
The potential role of the gut microbiome in childhood IBS and as a mechanism by which FODMAP carbohydrates such as fructans induce symptoms in those with functional bowel disorders has garnered increasing attention.12, 13, 32 Our study findings suggest fructan sensitive children differ from fructan tolerant children with IBS with respect to their baseline gut microbiome alpha and beta diversity and taxonomic composition. Furthermore, fructan sensitive (vs. tolerant) children with IBS appear to have different gut microbiome responses relative to both composition and abundance of predicted microbial fructan-related metabolism enzymes when given fructans. These findings add support to the potential role of the gut microbiome as a mechanistic factor for fermentable carbohydrate induced symptoms in those with IBS. If supported by further studies, these findings may lead to personalized nutrition-related strategies for subjects with IBS related to dietary nutrients such as fructans.
A majority, but not all, studies demonstrate IBS (vs. healthy controls) subjects have decreased gut microbial diversity; however, none have specifically associated decreased microbial diversity to diet-induced symptoms.33 Decreased species diversity is associated with communities which are less stable and less resistant to pertubations.34 Fructan sensitive children, with relatively decreased α diversity compared to those who are fructan tolerant, may be more likely to have perturbation (fructan) related changes in both their microbiome composition and metabolic pathways. Fructan tolerant subjects have higher relative α diversity versus their fructan sensitive counterparts and appear to be have different composition changes vs. fructan sensitive subjects when given fructans. Increased diversity may also relate to increased competition among microbiome species.35 Whether increased microbial diversity in fructan tolerant (vs. sensitive) subjects leads to increased competition of fructans as a substrate remains to be determined. Nonetheless, future interventions for those with fructan induced functional bowel symptoms may consider efforts at increasing gut microbiome diversity.
To our knowledge this is the first IBS study in adults or children to associate bacterial metagenomic findings with symptom exacerbation to a single fermentable carbohydrate. We identified several baseline bacterial composition differences between fructan sensitive vs. tolerant subjects. Holdemania was enriched in those who were fructan sensitive: this genus has previously been found to be enriched in both adults and children with IBS.36, 37 In relation to carbohydrate metabolism Holdemania species can metabolize simple sugars (e.g., fructose) but not complex carbohydrates (e.g., polyols or starch).38 In contrast, fructan tolerant subjects were enriched at baseline and during the dietary interventions in genera primarily within the Clostridia class which are often attributed with broad saccharolytic and butyrate producing characteristics.39 In addition to these carbohydrate metabolism related properties, many species within the Clostridia class are commensal and are believed to maintain gut homeostasis.40 For example within the genus Faecalibacterium is F. prausnitizii which has been associated with decreased gut inflammation.41 Future evaluations are needed to elucidate the bacteria of interest in the study at the taxonomic level of species in order to better determine their potential effects on fructan sensitivity.
Fructan sensitive (vs. tolerant) subjects had more marked relative abundance increases in the genus Bifidobacterium during the fructan vs. maltodextrin dietary periods. Fructans are classified as prebiotics given the lack of human intestinal tract hydrolases and their associated colonic bifidogenic effect.8 Many species of bifidobacteria are capable of metabolizing fructans and have higher growth rates on fructans rather than monomeric (e.g. glucose) constituents.42 In parallel, the presence of fructans as a carbon source has been demonstrated to significantly increase the production of bifidobacteria β-fructofuranosidase – consistent with our findings in fructan sensitive subjects.42 However, human studies have identified that fructan associated increases in bifidobacteria are not uniform.43 One factor which appears to influence bifidobacteria growth is the relative number of bifidobacteria prior to fructan supplementation: those with lower initial numbers of bifidobacteria (as we identified in fructan sensitive subjects during the maltodextrin diet) may have larger relative bifidobacteria increases.44, 45 In addition, fructan supplementation does not increase bifidobacteria in all subjects; in fact, some (up to 24%) human subjects consistently have decreases in their bifidobacteria abundance.43, 46 Ultimately, fructan sensitive subjects appear to have biological conditions more favorable for larger increases in bifidobacteria during fructan supplementation. If confirmed, future studies may help delineate the species within the Bifidobacterium genus which increase in response to fructans in fructan sensitive IBS subjects and evaluate for potential bifidobacteria produced metabolites or other related factors which may directly or indirectly affect IBS symptoms.
The microbiome composition differences during a fructan challenge in fructan sensitive vs. tolerant subjects with IBS may reflect different microorganism cross-feeding interrelationships. Increases in both Bifidobacteria and Anaerostipes have been identified in human fructan supplementation studies.47 Certain Anaerostipes species are incapable of metabolizing fructans and in vitro studies have identified species within this genus that utilize lactate and other fructan metabolites from cross-feeding.48 Similarly, Agathobacter species may produce lactate and other metabolites from fructan metabolism and these in turn may be used by Anerostipes or other organisms via cross-feeding.39 These cross-feeding relationships may induce competition for the same substrate, as seen with certain Roseburia species which can only degrade fructans with the addition of acetate which would in theory be provided via cross-feeding.48 Ultimately the inter-relationships between microbial organisms are likely to determine which organisms are enriched (or become less abundant) when substrates such as fructans become available.49
The implications of our findings related to fructan-induced symptoms in children with IBS remain to be determined. We hypothesize that the identified bacterial composition differences found in this study may play a role in determining whether certain microbial related factors (e.g. metabolites) are produced that may affect the host subject with IBS. Both in vitro and in vivo studies suggest the gut microbiome composition and its fructan degrading capabilities determine the subsequent production of metabolites (such as short chain fatty acids) which may affect the host.50, 51 Studies in gnotobiotic mice with human microbiota have demonstrated that differences in microbiome composition during fructan supplementation is associated with different alterations in whole gut transit time.51, 52 Given the identified differences in microbial composition between fructan sensitive vs. tolerant subjects with IBS during the fructan diet, future studies may investigate the potential role of fructan derived microbial fecal metabolites on both symptoms and IBS-relevant physiologic factors (e.g., colonic motility).
This study does have limitations. Abdominal pain severity has been recommended as a primary outcome measure in studies of six weeks or greater in childhood IBS; however, it should be noted that childhood self-rated abdominal pain frequency has been reported to be superior to self-ratings of pain severity.17, 18 Therefore, in the context of the short (72-hour) dietary interventions, and to maintain consistency with previous work evaluating the role of fermentable carbohydrates in children with IBS, abdominal pain frequency was used as the clinical classification measure. Another limitation is that single rather than multiple fecal specimen collections were obtained for analysis for each subject during relatively short baseline and dietary intervention periods. An increase in IBS symptoms due to fermentable carbohydrates may occur within 24 hours; therefore, though short relative to the chronicity of IBS symptoms, a 72-hour dietary intervention period was felt to be sufficient to determine fructan sensitivity.53 It is important to note that our microbiome composition findings parallel studies in other conditions which used significantly longer fructan supplementation periods (e.g., 4 weeks).47 Furthermore, studies involving multiple fecal collections over several months have found that carbohydrate fermentation properties are individual-dependent and stable over long periods of time.54, 55 Nevertheless, further studies in subjects with IBS using longer fermentable carbohydrate challenge periods while evaluating the stability of both symptom and gut microbiological effects are needed. Another limitation is that the fecal specimens came from subjects evaluated at one center in the United States. Future studies from several centers across different geographic areas and encompassing subjects with varied cultural dietary habits will help determine the generalizability of the data. Though we did not identify differences in baseline dietary consumption between fructan sensitive vs. tolerant participants, one limitation is the paucity of information related to fructan and/or galactan content in foods commonly consumed in the United States. To ensure these dietary components are not missed from baseline dietary intake, future studies may need to measure the content of these oligosaccharides specifically. Finally, the dose of fructans used may be perceived as being relatively high. We used a weight based (0.5 g/kg up to 19 grams) dosing regimen to account for the size of our subjects. It should be noted that previous adult IBS fructan challenge trials have used a dose up to 19 grams and studies have demonstrated that 20–30 g/day fructans are well tolerated (particularly in divided doses as we have done) in healthy adults.9, 56 Typical inulin intake in the western diet ranges from 1–10 grams per day.7 Future studies using different fructan doses are needed.
The study has several strengths. First, the analyzed fecal specimens were obtained from subjects meeting Rome III IBS criteria who were carefully clinically phenotyped as fructan sensitive or tolerant via a randomized double blind crossover placebo controlled trial; an approach that increases the scientific rigor of our findings. Second, the crossover nature of the design allowed for subjects to serve as their own controls. This may be particularly important in microbiome related studies in which inter-individual variability has been found to be greater than that attributed to factors such as dietary intake.21 Finally, the microbiome evaluation of the specimens followed previously established protocols set in place by the Human Microbiome Project.57 We anticipate this will help lead to greater reproducibility of the results.
In conclusion, fructan sensitive children with irritable bowel syndrome have distinct microbiome signatures. These microbiome signatures differ at baseline and in response to a fructan diet. Though these findings lend support to the gut microbiome being a factor in fructan induced symptoms in children with IBS, further studies are needed to elucidate the potential mechanistic impact of these findings.
Supplementary Material
Supplementary Figure 1: Comparison of the median (with 25-75% quartile boxplots) number of observed operational taxonomic units (OTUs) and median Shannon index from children with irritable bowel syndrome (n=33) at baseline, during a fructan diet, and during a maltodextrin diet.
Supplementary Figure 2: Principal coordinates analysis plot based on unweighted Bray Curtis distances of all fecal samples (baseline, fructan diet, and maltodextrin diet) from children with IBS (n=38). Fructan sensitive (orange circles) subjects are compared to fructan tolerant subjects (blue circles).
ACKNOWLEDGEMENTS
We thank the subjects who participated and Adetola Vaughan, Vanessa Thyne, Denisse Castaneda, and Deshara Emerson for their help with research coordination.
Declaration of personal interests: BPC previously provided consultancy to Mead-Johnson Nutrition; JV received unrestricted research support from Biogaia AB (Stockholm, Sweden) and serves on the Scientific Advisory Boards of Biomica, Plexus Worldwide, and Seed Health; JFP is founder and chief scientific officer of Diversigen, Inc.; RJS previously provided consultancy for Nutrinia, IMHealth, and Biogaia AB, and previously received restricted research support from Mead-Johnson.
Declaration of funding interests: Financial and/or intellectual support was provided by National Instittutes of Health (NIH) K23 DK101688 (BPC), R03 DK117219 (BPC and JFP), UH3 DK083990 (JV), the United States Department of Agriculture/ Agriculture Research Service under Cooperative Agreement number 6250–51000-043 (RJS), and P30 DK056338 which funds the Texas Medical Center Digestive Disease Center.
Abbreviations:
- FODMAP
Fermentable oligosaccharides disaccharides monosaccharides and polyols
- IBS
irritable bowel syndrome
REFERENCES
- 1.Hyams JS, Di Lorenzo C, Saps M, et al. Functional Disorders: Children and Adolescents. Gastroenterology 2016;150:1456–1468. [DOI] [PubMed] [Google Scholar]
- 2.Chumpitazi BP, Shulman RJ. Underlying molecular and cellular mechanisms in childhood irritable bowel syndrome. Mol Cell Pediatr 2016;3:11. [DOI] [PMC free article] [PubMed] [Google Scholar]
- 3.Chumpitazi BP, Weidler EM, Lu DY, et al. Self-Perceived Food Intolerances Are Common and Associated with Clinical Severity in Childhood Irritable Bowel Syndrome. J Acad Nutr Diet 2016;116:1458–64. [DOI] [PMC free article] [PubMed] [Google Scholar]
- 4.Reed-Knight B, Squires M, Chitkara DK, et al. Adolescents with irritable bowel syndrome report increased eating-associated symptoms, changes in dietary composition, and altered eating behaviors: a pilot comparison study to healthy adolescents. Neurogastroenterol Motil 2016;28:1915–1920. [DOI] [PMC free article] [PubMed] [Google Scholar]
- 5.Chumpitazi BP. Update on Dietary Management of Childhood Functional Abdominal Pain Disorders. Gastroenterol Clin North Am 2018;47:715–726. [DOI] [PMC free article] [PubMed] [Google Scholar]
- 6.Mitchell H, Porter J, Gibson PR, et al. Review article: implementation of a diet low in FODMAPs for patients with irritable bowel syndrome-directions for future research. Aliment Pharmacol Ther 2019;49:124–139. [DOI] [PubMed] [Google Scholar]
- 7.van Loo J, Coussement P, de Leenheer L, et al. On the presence of inulin and oligofructose as natural ingredients in the western diet. Crit Rev Food Sci Nutr 1995;35:525–52. [DOI] [PubMed] [Google Scholar]
- 8.Roberfroid MB. Inulin-type fructans: functional food ingredients. J Nutr 2007;137:2493S–2502S. [DOI] [PubMed] [Google Scholar]
- 9.Shepherd SJ, Parker FC, Muir JG, et al. Dietary triggers of abdominal symptoms in patients with irritable bowel syndrome: randomized placebo-controlled evidence. Clin Gastroenterol Hepatol 2008;6:765–71. [DOI] [PubMed] [Google Scholar]
- 10.Chumpitazi BP, McMeans AR, Vaughan A, et al. Fructans Exacerbate Symptoms in a Subset of Children With Irritable Bowel Syndrome. Clin Gastroenterol Hepatol 2018;16:219–225 e1. [DOI] [PMC free article] [PubMed] [Google Scholar]
- 11.Chang L, Di Lorenzo C, Farrugia G, et al. Functional Bowel Disorders: A Roadmap to Guide the Next Generation of Research. Gastroenterology 2018;154:723–735. [DOI] [PubMed] [Google Scholar]
- 12.Chumpitazi BP, Cope JL, Hollister EB, et al. Randomised clinical trial: gut microbiome biomarkers are associated with clinical response to a low FODMAP diet in children with the irritable bowel syndrome. Aliment Pharmacol Ther 2015;42:418–27. [DOI] [PMC free article] [PubMed] [Google Scholar]
- 13.Valeur J, Smastuen MC, Knudsen T, et al. Exploring Gut Microbiota Composition as an Indicator of Clinical Response to Dietary FODMAP Restriction in Patients with Irritable Bowel Syndrome. Dig Dis Sci 2018;63:429–436. [DOI] [PubMed] [Google Scholar]
- 14.Halmos EP, Christophersen CT, Bird AR, et al. Diets that differ in their FODMAP content alter the colonic luminal microenvironment. Gut 2015;64:93–100. [DOI] [PubMed] [Google Scholar]
- 15.Chumpitazi BP, Lim J, McMeans AR, et al. Evaluation of FODMAP Carbohydrates Content in Selected Foods in the United States. J Pediatr 2018;199:252–255. [DOI] [PMC free article] [PubMed] [Google Scholar]
- 16.David LA, Maurice CF, Carmody RN, et al. Diet rapidly and reproducibly alters the human gut microbiome. Nature 2013. [DOI] [PMC free article] [PubMed] [Google Scholar]
- 17.Saps M, van Tilburg MA, Lavigne JV, et al. Recommendations for pharmacological clinical trials in children with irritable bowel syndrome: the Rome foundation pediatric subcommittee on clinical trials. Neurogastroenterol Motil 2016;28:1619–1631. [DOI] [PubMed] [Google Scholar]
- 18.Lavigne JV, Saps M. Pain Measurement in Children with Functional Abdominal Pain. Curr Gastroenterol Rep 2016;18:20. [DOI] [PubMed] [Google Scholar]
- 19.Hoffman KL, Hutchinson DS, Fowler J, et al. Oral microbiota reveals signs of acculturation in Mexican American women. PLoS One 2018;13:e0194100. [DOI] [PMC free article] [PubMed] [Google Scholar]
- 20.Ramani S, Stewart CJ, Laucirica DR, et al. Human milk oligosaccharides, milk microbiome and infant gut microbiome modulate neonatal rotavirus infection. Nat Commun 2018;9:5010. [DOI] [PMC free article] [PubMed] [Google Scholar]
- 21.Human Microbiome Project C. Structure, function and diversity of the healthy human microbiome. Nature 2012;486:207–14. [DOI] [PMC free article] [PubMed] [Google Scholar]
- 22.Caporaso JG, Lauber CL, Walters WA, et al. Global patterns of 16S rRNA diversity at a depth of millions of sequences per sample. Proc Natl Acad Sci U S A 2011;108 Suppl 1:4516–22. [DOI] [PMC free article] [PubMed] [Google Scholar]
- 23.Edgar RC. Search and clustering orders of magnitude faster than BLAST. Bioinformatics 2010;26:2460–1. [DOI] [PubMed] [Google Scholar]
- 24.Langmead B, Salzberg SL. Fast gapped-read alignment with Bowtie 2. Nat Methods 2012;9:357–9. [DOI] [PMC free article] [PubMed] [Google Scholar]
- 25.Edgar RC. UPARSE: highly accurate OTU sequences from microbial amplicon reads. Nat Methods 2013;10:996–8. [DOI] [PubMed] [Google Scholar]
- 26.Pruesse E, Quast C, Knittel K, et al. SILVA: a comprehensive online resource for quality checked and aligned ribosomal RNA sequence data compatible with ARB. Nucleic Acids Res 2007;35:7188–96. [DOI] [PMC free article] [PubMed] [Google Scholar]
- 27.Asshauer KP, Wemheuer B, Daniel R, et al. Tax4Fun: predicting functional profiles from metagenomic 16S rRNA data. Bioinformatics 2015;31:2882–4. [DOI] [PMC free article] [PubMed] [Google Scholar]
- 28.Cantarel BL, Coutinho PM, Rancurel C, et al. The Carbohydrate-Active EnZymes database (CAZy): an expert resource for Glycogenomics. Nucleic Acids Res 2009;37:D233–8. [DOI] [PMC free article] [PubMed] [Google Scholar]
- 29.Paradis E, Claude J, Strimmer K. APE: Analyses of Phylogenetics and Evolution in R language. Bioinformatics 2004;20:289–90. [DOI] [PubMed] [Google Scholar]
- 30.Ajami NJ, Cope JL, Wong MC, et al. Impact of Oral Fidaxomicin Administration on the Intestinal Microbiota and Susceptibility to Clostridium difficile Colonization in Mice. Antimicrob Agents Chemother 2018;62. [DOI] [PMC free article] [PubMed] [Google Scholar]
- 31.Segata N, Izard J, Waldron L, et al. Metagenomic biomarker discovery and explanation. Genome Biol 2011;12:R60. [DOI] [PMC free article] [PubMed] [Google Scholar]
- 32.Hollister EB, Oezguen N, Chumpitazi BP, et al. Levaraging Human Microbiome Features to Diagnose and Stratify Children with Irritable Bowel Syndrome. J Mol Diag 2019;21:449–461. [DOI] [PMC free article] [PubMed] [Google Scholar]
- 33.Duan R, Zhu S, Wang B, et al. Alterations of Gut Microbiota in Patients With Irritable Bowel Syndrome Based on 16S rRNA-Targeted Sequencing: A Systematic Review. Clin Transl Gastroenterol 2019;10:e00012. [DOI] [PMC free article] [PubMed] [Google Scholar]
- 34.Karkman A, Lehtimaki J, Ruokolainen L. The ecology of human microbiota: dynamics and diversity in health and disease. Ann N Y Acad Sci 2017;1399:78–92. [DOI] [PubMed] [Google Scholar]
- 35.Coyte KZ, Schluter J, Foster KR. The ecology of the microbiome: Networks, competition, and stability. Science 2015;350:663–6. [DOI] [PubMed] [Google Scholar]
- 36.Shankar V, Homer D, Rigsbee L, et al. The networks of human gut microbe-metabolite associations are different between health and irritable bowel syndrome. ISME J 2015;9:1899–903. [DOI] [PMC free article] [PubMed] [Google Scholar]
- 37.Labus JS, Hollister EB, Jacobs J, et al. Differences in gut microbial composition correlate with regional brain volumes in irritable bowel syndrome. Microbiome 2017;5:49. [DOI] [PMC free article] [PubMed] [Google Scholar]
- 38.Willems A, Moore WE, Weiss N, et al. Phenotypic and phylogenetic characterization of some Eubacterium-like isolates containing a novel type B wall murein from human feces: description of Holdemania filiformis gen. nov., sp. nov. Int J Syst Bacteriol 1997;47:1201–4. [DOI] [PubMed] [Google Scholar]
- 39.Moens F, De Vuyst L. Inulin-type fructan degradation capacity of Clostridium cluster IV and XIVa butyrate-producing colon bacteria and their associated metabolic outcomes. Benef Microbes 2017;8:473–490. [DOI] [PubMed] [Google Scholar]
- 40.Lopetuso LR, Scaldaferri F, Petito V, et al. Commensal Clostridia: leading players in the maintenance of gut homeostasis. Gut Pathog 2013;5:23. [DOI] [PMC free article] [PubMed] [Google Scholar]
- 41.Ferreira-Halder CV, Faria AVS, Andrade SS. Action and function of Faecalibacterium prausnitzii in health and disease. Best Pract Res Clin Gastroenterol 2017;31:643–648. [DOI] [PubMed] [Google Scholar]
- 42.Rossi M, Corradini C, Amaretti A, et al. Fermentation of fructooligosaccharides and inulin by bifidobacteria: a comparative study of pure and fecal cultures. Appl Environ Microbiol 2005;71:6150–8. [DOI] [PMC free article] [PubMed] [Google Scholar]
- 43.Holscher HD, Bauer LL, Gourineni V, et al. Agave Inulin Supplementation Affects the Fecal Microbiota of Healthy Adults Participating in a Randomized, Double-Blind, Placebo-Controlled, Crossover Trial. J Nutr 2015;145:2025–32. [DOI] [PubMed] [Google Scholar]
- 44.Hidaka H, Eida T, Takizawa T, et al. Effects of Fructooligosaccharides on Intestinal Flora and Human Health. Bifidobacteria Microflora 1986;5:37–50. [Google Scholar]
- 45.Roberfroid MB, Van Loo JA, Gibson GR. The bifidogenic nature of chicory inulin and its hydrolysis products. J Nutr 1998;128:11–9. [DOI] [PubMed] [Google Scholar]
- 46.Gibson GR, Beatty ER, Wang X, et al. Selective stimulation of bifidobacteria in the human colon by oligofructose and inulin. Gastroenterology 1995;108:975–82. [DOI] [PubMed] [Google Scholar]
- 47.Vandeputte D, Falony G, Vieira-Silva S, et al. Prebiotic inulin-type fructans induce specific changes in the human gut microbiota. Gut 2017;66:1968–1974. [DOI] [PMC free article] [PubMed] [Google Scholar]
- 48.Falony G, Vlachou A, Verbrugghe K, et al. Cross-feeding between Bifidobacterium longum BB536 and acetate-converting, butyrate-producing colon bacteria during growth on oligofructose. Appl Environ Microbiol 2006;72:7835–41. [DOI] [PMC free article] [PubMed] [Google Scholar]
- 49.Chumpitazi BP. The gut microbiome as a predictor of low fermentable oligosaccharides disaccharides monosaccharides and polyols diet efficacy in functional bowel disorders. Curr Opin Gastroenterol 2020;36:147–154. [DOI] [PMC free article] [PubMed] [Google Scholar]
- 50.Smits SA, Marcobal A, Higginbottom S, et al. Individualized Responses of Gut Microbiota to Dietary Intervention Modeled in Humanized Mice. mSystems 2016;1. [DOI] [PMC free article] [PubMed] [Google Scholar]
- 51.Riviere A, Gagnon M, Weckx S, et al. Mutual Cross-Feeding Interactions between Bifidobacterium longum subsp. longum NCC2705 and Eubacterium rectale ATCC 33656 Explain the Bifidogenic and Butyrogenic Effects of Arabinoxylan Oligosaccharides. Appl Environ Microbiol 2015;81:7767–81. [DOI] [PMC free article] [PubMed] [Google Scholar]
- 52.Kashyap PC, Marcobal A, Ursell LK, et al. Complex interactions among diet, gastrointestinal transit, and gut microbiota in humanized mice. Gastroenterology 2013;144:967–77. [DOI] [PMC free article] [PubMed] [Google Scholar]
- 53.Ong DK, Mitchell SB, Barrett JS, et al. Manipulation of dietary short chain carbohydrates alters the pattern of gas production and genesis of symptoms in irritable bowel syndrome. J Gastroenterol Hepatol 2010;25:1366–73. [DOI] [PubMed] [Google Scholar]
- 54.McBurney MI, Thompson LU. Effect of human faecal inoculum on in vitro fermentation variables. Br J Nutr 1987;58:233–43. [DOI] [PubMed] [Google Scholar]
- 55.Weaver GA, Krause JA, Miller TL, et al. Constancy of glucose and starch fermentations by two different human faecal microbial communities. Gut 1989;30:19–25. [DOI] [PMC free article] [PubMed] [Google Scholar]
- 56.Carabin IG, Flamm WG. Evaluation of safety of inulin and oligofructose as dietary fiber. Regul Toxicol Pharmacol 1999;30:268–82. [DOI] [PubMed] [Google Scholar]
- 57.Human Microbiome Project C. A framework for human microbiome research. Nature 2012;486:215–21. [DOI] [PMC free article] [PubMed] [Google Scholar]
Associated Data
This section collects any data citations, data availability statements, or supplementary materials included in this article.
Supplementary Materials
Supplementary Figure 1: Comparison of the median (with 25-75% quartile boxplots) number of observed operational taxonomic units (OTUs) and median Shannon index from children with irritable bowel syndrome (n=33) at baseline, during a fructan diet, and during a maltodextrin diet.
Supplementary Figure 2: Principal coordinates analysis plot based on unweighted Bray Curtis distances of all fecal samples (baseline, fructan diet, and maltodextrin diet) from children with IBS (n=38). Fructan sensitive (orange circles) subjects are compared to fructan tolerant subjects (blue circles).