

Abstract
Objective:
Considering the reported elevation of ω-6/ω-3 fatty acid ratios in breast neoplasms, one particularly important application of 13C MRS could be in more fully understanding the breast lipidome’s relationship to breast cancer incidence. However, the low natural abundance and gyromagnetic ratio of the 13C isotope lead to detection sensitivity challenges. Previous 13C MRS studies have relied on the use of small surface coils with limited field-of-view and shallow penetration depths to achieve adequate signal-to-noise ratio (SNR), and the use of receive array coils is still mostly unexplored.
Methods:
This work presents a unilateral breast 16-channel 13C array coil and interfacing hardware designed to retain the surface sensitivity of a single small loop coil while improving penetration depth and extending the field-of-view over the entire breast at 7T. The coil was characterized through bench measurements and phantom 13C spectroscopy experiments.
Results:
Bench measurements showed receive coil matching better than −17 dB and average preamplifier decoupling of 16.2 dB with no evident peak splitting. Phantom MRS studies show better than a three-fold increase in average SNR over the entirety of the breast region compared to volume coil reception alone as well as an ability for individual array elements to be used for coarse metabolite localization without the use of single-voxel or spectroscopic imaging methods.
Conclusion:
Our current study has shown the benefits of the array. Future in vivolipidomics studies can be pursued.
Significance:
Development of the 16-channel breast array coil opens possibilities of in vivolipidomics studies to elucidate the link between breast cancer incidence and lipid metabolics.
Index Terms—: RF coils, 7T, array coils, MRS, multinuclear, carbon-13, breast cancer
I. Introduction
Cancer is among the most common causes of death worldwide with breast cancer being the most prevalent form among women [1] with lifetime incidence and mortality rates of 1:8 and 1:36 respectively [2]. However, worldwide incidence rates vary, with North America and Europe having highly-elevated incidence rates compared to Asian countries [1, 3, 4]. This has been partially attributed to differing sources of fat consumption between these populations [5, 6] and has led researchers to look more closely at the role of trans-fats [7] and the ω-6/ω-3 polyunsaturated fatty acids (PUFA) ratio [8–21],which is shown elevated in both western diets and in neoplasms [9, 12, 16, 19]. To further assess the link between diet and breast cancer, researchers are interested in longitudinal dietary modulation studies [8, 10, 18, 20] but these require repeatable methods of lipid assessment, making biopsies unsuitable.
One mostly unexplored alternative to biopsies is the use of 13C magnetic resonance spectroscopy (MRS). 13C MRS offers a completely non-invasive, repeatable method of quantification of ω-6 and ω-3 PUFAs as well as trans-fats [22]. However, the low natural abundance and gyromagnetic ratioof the 13C isotope, 1.1% and 10.57 MHz/T respectively, compared to those of 1H (99.9% and 42.57 MHz/T)[23] lead to a relative detection sensitivity loss of four orders of magnitude compared to the 1H nucleus. Combatting this limitation can be partially accomplished by moving to higher field strengths [24–26], but the low sensitivity of the 13C MRS experiment has still necessitated the use of small RF surface coils for their enhanced surface sensitivity [27–30] which has mostly limited studies to superficial anatomies.
Use of RF array coils is a common approach to retaining the surface sensitivity of a small coil while increasing the penetration depth and field-of-view [31–34] for 1H studies, but arrays are still under-utilized for non-1H (X-nuclei) studies largely due to lack of available receiver hardware. However, workaround techniques [35, 36]are being explored, including a frequency translation system used by our group [37]and vendor support is increasing with vendors now offering multi-channel X-nuclei receive capabilities on many systems. Recently, higher channel-count array coils [38–46] for X-nuclei have been reported and are showing significant promise for in vivo spectroscopy. Specifically for 13C, some studies have made use of phased array coils[47–52]; however, these studies have focused primarily on hyperpolarized applicationsat clinical field strengths.
This work describes the design and testing of a 16-channel 13C array coil and interface box intended for interrogation of the breast lipidome at 7T. Additionally, a quadrature 13C transmit coil and linear forced-current-excitation (FCE)[53–55]1H transmit/receive coil were designed for RF excitation, shimming, and scout imaging. The overall coil system was evaluated using bench measurements and phantom MRS studies to demonstrate its improved SNR and localization ability compared to a volume coil.
II. Methods
A. Coil Design and Construction
A custom interface box containing preamplifiers, low-pass filters, and active detuning routing circuitry was first constructed. To provide protection for the 13C preamplifiers from the high-power 1H transmit pulses, low-pass filters were designed as fifth-order Chebyshev filters in a pi network topology with a cutoff frequency of 125 MHz using the online LC Filters Design Tool calculator available through RF Tools [56]. Inclusions of these filters is especially important for studies involving proton decoupling which require very high isolation of the preamplifier input at the proton frequency [57]. Although this technique was not pursued in this work, the interface box was designed to accommodate the method for future experiments. Filter attenuation was checked on the network analyzer through S21 measurement at the 13C and 1H frequencies to ensure minimal noise insertion due to inclusion of the filters.
Low noise preamplifiers (WanTcom WMA74D) with 28 dB gain, 1.5Ω input impedance, and a noise figure of 0.4 dB are included in the interface box and were mounted in separate aluminum shielded enclosures (Hammond) after the low-pass filtering stage. DC blocking capacitors (1200 pF Passive Plus 1111C) were included at the RF input and output of each low noise amplifier (LNA).
The interface box additionally supplied the −5V/12V active detuning signal to each coil element which was routed to individual receive elements at the interface box input using bias-T networks and current limiting resistors (50Ω Vishay) to ensure the appropriate ~100 mA forward bias current during detuning. All interface circuitry was housed in an aluminum enclosure with input BNC coil connectors and output SMA connectors which interfaced with a novel frequency-translation system [37].
The array coil was designed around a hemispherical 3D-printed breast former designed in Solidworks with an outer diameter of 14.6 cm and wall thickness of 1.3 cm. The former included etchings on its outer surface for appropriate coil element positioning. An identical former was printed to support the other breast but left unpopulated. The array consisted of 16 individual loop elements arranged in a “soccer-ball” geometry [55, 58] with 10 larger loops and 6 smaller loops. The total number of elements was chosen to make use of all 16 available receive channels of the frequency-translation unit with which the system interfaced. Element positioning and the large/small element diameter ratio were chosen to ensure proper geometrical decoupling between all adjacent elements as is typical with the “soccer-ball” geometry [58]. Overall array volume was chosen large enough to accommodate 80% of breast volumes of American women [59] to allow use of the array with most breasts while maintaining a high filling factor for most cases. Dimensions of the receive array and transmit coils are shown in Figure 1.
Fig. 1.
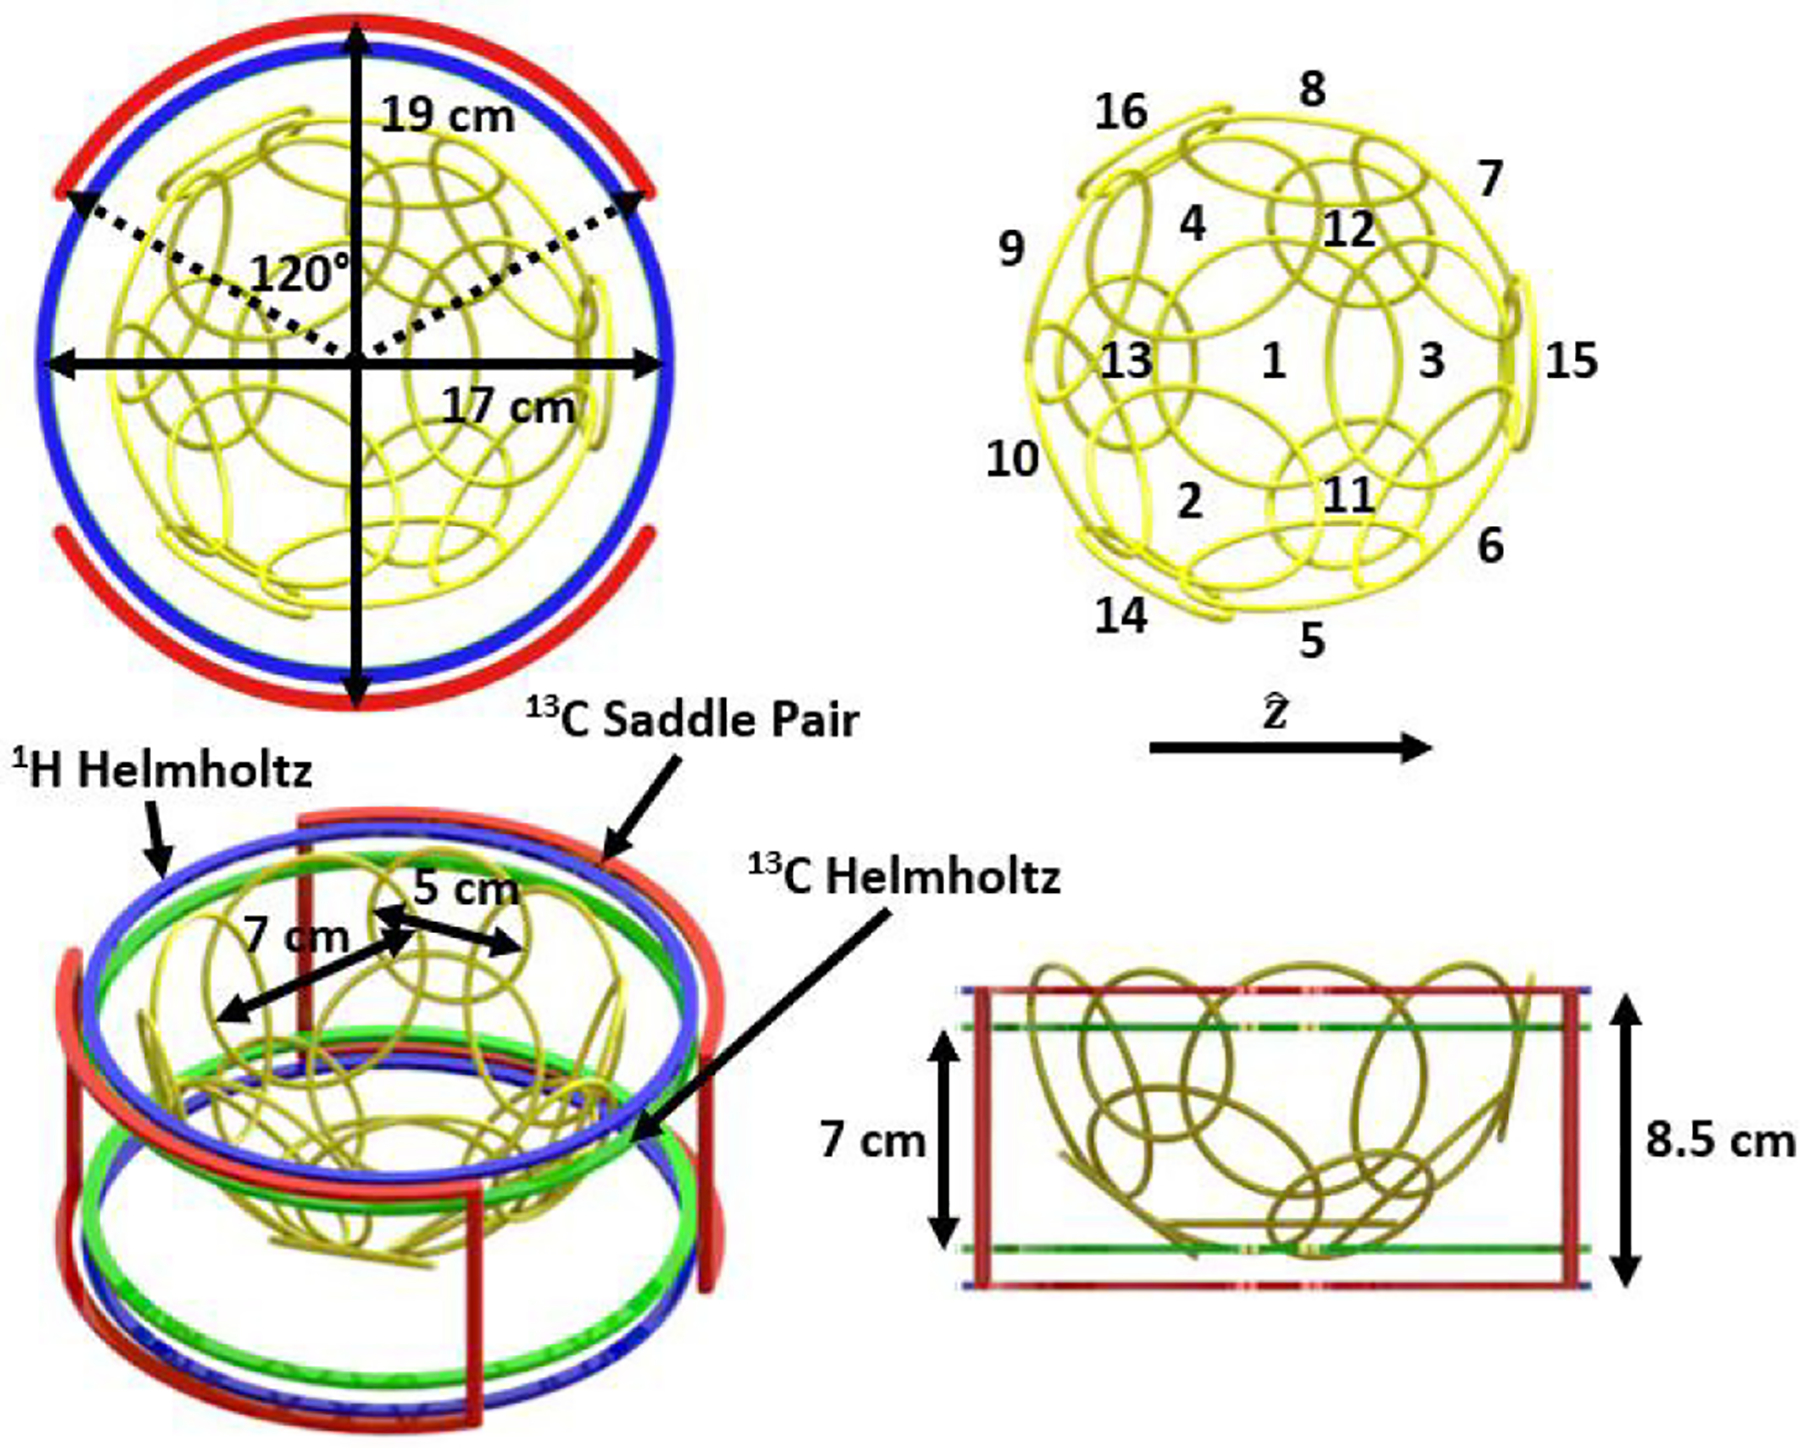
Dimensioned rendering of coil system. The 13C transmit coil system consisted of Helmholtz (green) and saddle pair (red) coils. The 1H Helmholtz coil (blue) used slightly wider loop spacing to encompass the 13C Helmholtz coil. Orientation of receive array elements (yellow) relative to the main magnetic field direction are shown with large elements labeled 1–10 and small elements labeled 11–16 (top right).
Each receive element was constructed of insulated 12 AWG wire, and elements were labeled 1–16 (large elements: 1–10; small elements 11–16). Components for the receive array included fixed capacitors (Passive Plus 1111C), variable capacitors (Sprague Goodman SGC3), variable inductors (Coilcraft 165), and PIN diodes (Macom MA4P7470).
Each receive element contained three breaks in the loop conductor for printed circuit boards with various circuit networks: an LCC trap to provide isolation from the 1H transmit/receive coil [60, 61], an active detuning trap, and an SMA connection to removable match/tune and preamplifier decoupling circuitry. Each of these boards was milled on standard 1.5 mm, 1 oz copper-clad FR4 using an in-house circuit-milling system (LPKF Protomat S63). Before adding these additional networks, an element of each size was first resonated at the 7T, 13C frequency of 75 MHz using equal-valued capacitors soldered across each break to determine appropriate break reactances. Resonance was checked using a VNA (Agilent Technologies E5071C) dual-loop S21 measurement.
Active detuning traps, 1H decoupling traps, andmatch/tune/decoupling networks based on the design presented by Reykowski [62] were constructed for each element. Resonant cable traps tuned to the 13C frequency were also included on for each element with additional floating cable traps tuned to the 1H frequency included on receive coil cable bundles. The SMA connector between the coil loop and match/tune/decoupling network allowed elements to be connected in isolation for initial tuning. The element circuit diagram and various component values for each loop size are shown in Figure 2 and Table 1 respectively.
Fig. 2.
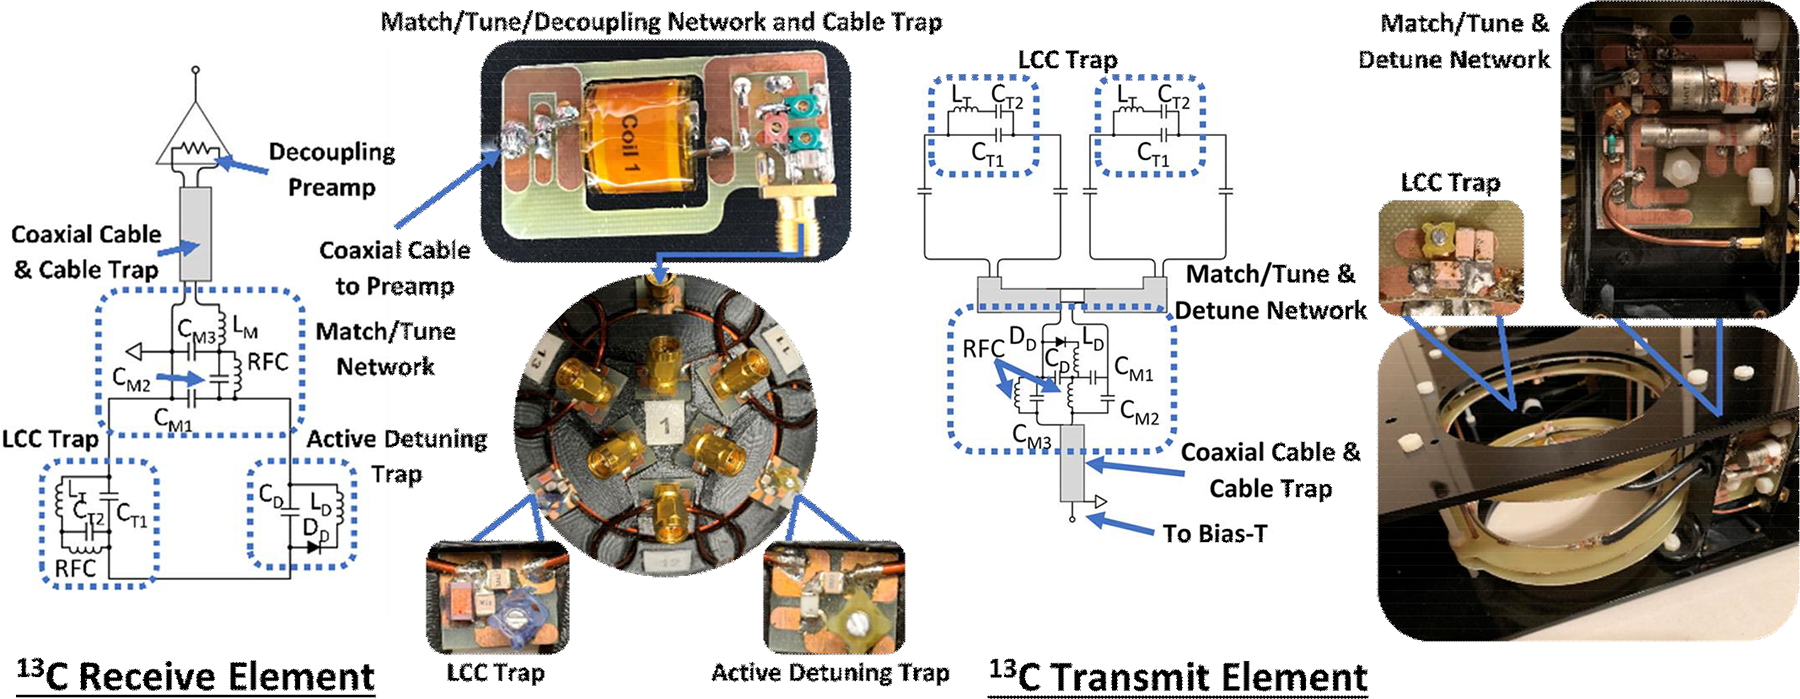
Circuit diagrams and images for single elements of the 13C receive (left) and transmit (right) coils.Insets shown in each image show detailed views of the labeled networks of each circuit diagram. All receive elements used similar layouts. The saddle pair transmit element used a similar layout to the 13C Helmholtz element shown pictured but with the LCC decoupling traps replaced by additional segmenting capacitors.
TABLE I.
Coil Component Values
| Component | Large Rx (pF/nH) | Small Rx (pF/nH) | Tx (pF/nH) |
|---|---|---|---|
| CD | 82 | 150 | 100 |
| LD | (43–60) | (25–32) | (33–48) |
| CT1 | 3.3 | 4.3 | 10 |
| CT2 | 33 | 43 | 12 |
| LT | (68–120) | (54–78) | (43–64) |
| RFC | 560 | 560 | 810 |
| CM1 | 68 + (8–30) | 150 + (8–30) | 18 + (2–10) |
| CM2 | (5.5–20) | (5.5–20) | (2–20) |
| CM3 | (8–30) | (5.5–20) | 18 |
| LM | (33–48) | (79–105) | N/A |
| RFC | 560 | 560 | 810 |
| CS | N/A | N/A | 25 |
All capacitances are show in pF while inductances are shown in nH.
Note that variable components are shown with their tuning range indicated in parenthesis.
Tuning of the detuning and LCC traps to 75 MHz and 298 MHz respectively was accomplished by adjustment of the variable inductors while observing the S11 measurement from a small, lightly-coupled pickup probe. For the detuning traps, the PIN diode was forward biased by 100 mA during this measurement. Cable traps were constructed using ~1 cm diameter, three-turn solenoidal windings of semi-rigid cabling (Pasternack) shielded in 0.5” diameter PVC tubing covered in copper tape. The windings were resonated at the 13C frequency using fixed capacitors (~60 pF, Passive Plus 1111C) while observing the common-mode attenuation through a network analyzer S21 measurement.
With individual networks and cable traps tuned, each coil element was assembled and mounted on the former. RG174 cables (Pasternack) were included after each element’s match/tune network to allow connection to the network analyzer or interface box. An S11 measurement of each coilelement was taken while adjusting coil trimmer capacitors on the match/tune/decoupling network to ensure impedance matching. During the process of these adjustments, preamplifier decoupling was repeatedly checked through dual-probe S21 measurements taken with each element connected to the powered interface box, and trimmer capacitors were adjusted to center the S21 measurement peak split at the 13C frequency. Though all trimmers affected both matching and preamplifier decoupling to some extent, adjustment of CT and CM were primarily responsible for controlling the coil match while CX adjustment was used to control preamplifier decoupling. After adjustment of all trimmer capacitors, active tuning and preamplifier decoupling values were taken as the difference between the S21 measurements with the elements terminated in 50Ω compared to detuned or decoupled. Final matching values for each element were taken with the remaining elements preamplifier decoupled. Coil Q factors were taken in this configuration using the S11 7 dB bandwidth method [63].
In addition to the 16 receive elements, additional test elements were fabricated to study the effects on loss of the various circuit networks – LCC trap, detuning trap, and match/tune/decoupling network. These test elements were identical to the receive elements but with networks other than the one under test replaced by appropriate segmenting capacitors (82 pF, Passive Plus 1111C). Four test elements were constructed for each element size: one element with all networks replaced by segmenting capacitors, one element containing an LCC network only, one element containing a detuning network only, and one element containing a match/tune/decoupling network only. The element containing the match/tune/decoupling network also contained a resonant cable trap identical to those used on array elements. Elements in all configurations were resonant but unmatched except for the case of the element containing the match/tune/decoupling network. Element unloaded Q factors were calculated for each based on the 3 dB bandwidth of a dual-loop probe S21 measurement for each test element.
The transmit coil system consisted of a 13C quadrature Helmholtz [64] and saddle coil pair [65] and linear 1H Helmholtz coil with geometry as shown in Figure 1. Components for the transmit system included fixed capacitors (Passive Plus 2225C), variable capacitors (13C - Voltronics NMNT20; 1H – Voltronics NMAT40HVE), variable inductors (Coilcraft 165), and PIN diodes (Macom MA4P7470). Support structures for all coils were milled on 1.5 mm thick, 1 oz copper-clad FR4 with an in-house circuit milling system (LPKF Protomat S63). Each loop of the 13C Helmholtz coil was made with 14 AWG wire mounted on the support structure and included four equally-spaced breaks for two segmenting capacitors (25 pF), a 1H decoupling LCC trap, and connection to a match/tune board through a 10 cm RG58 cable (Pasternack). A semi-balanced matching network was used, and a cable trap double-tuned for 13C and 1H was included after the matching network. As with the receive elements, chokes were included to allow a path for the DC detuning signal. The 13C Helmholtz coil circuit diagram and various component values are shown in Figure 2 and Table 1 respectively.
After the matching network and cable trap, the coil was connected through coaxial cable (RG58 Pasternack) to a bias-T box to separate the RF pathway from the DC PIN diode biasing pathway. Current-limiting resistors (50Ω Vishay) were also included in the bias-T box to produce the desired 100 mA current when the −5V detuning signal was provided. 1H trap tuning as well as active detuning and matching was accomplished via various S parameter measurements as was done with the receive elements.
The saddle pair coil used a similar design to the Helmholtz coil but with the 1H decoupling trap replaced by an additional segmenting capacitor (36.8 pF). Like the Helmholtz coil, the saddle pair was made using 14 AWG wire, though hollow copper tubing was used to connect the top and bottom portions of each saddle element. The saddle coil match/tune board, cable-trap, and bias-T designs were identical to those of the Helmholtz coil, and coil matching/detuning used the same approach.
A circuit diagram of the 1H coil is shown in Figure 3. Helmholtz loops for the 1H transmit/receive coil were aligned on the same plane as the top and bottom portions of the 13C saddle coil. Loops were milled on 1 oz copper with a trace width of 2.5 mm, and 10 breaks were included around each loop for 9 segmenting capacitors (4.7 pF Passive Plus 1111C) and connection to a match/tune board. 298 MHz quarter-wave twinaxial cable (RG108 Pasternack) connected each loop to a common-voltage point (CVP) on the match/tune board to enforce the forced-current-excitation (FCE) condition [53, 54].
Figure 3:
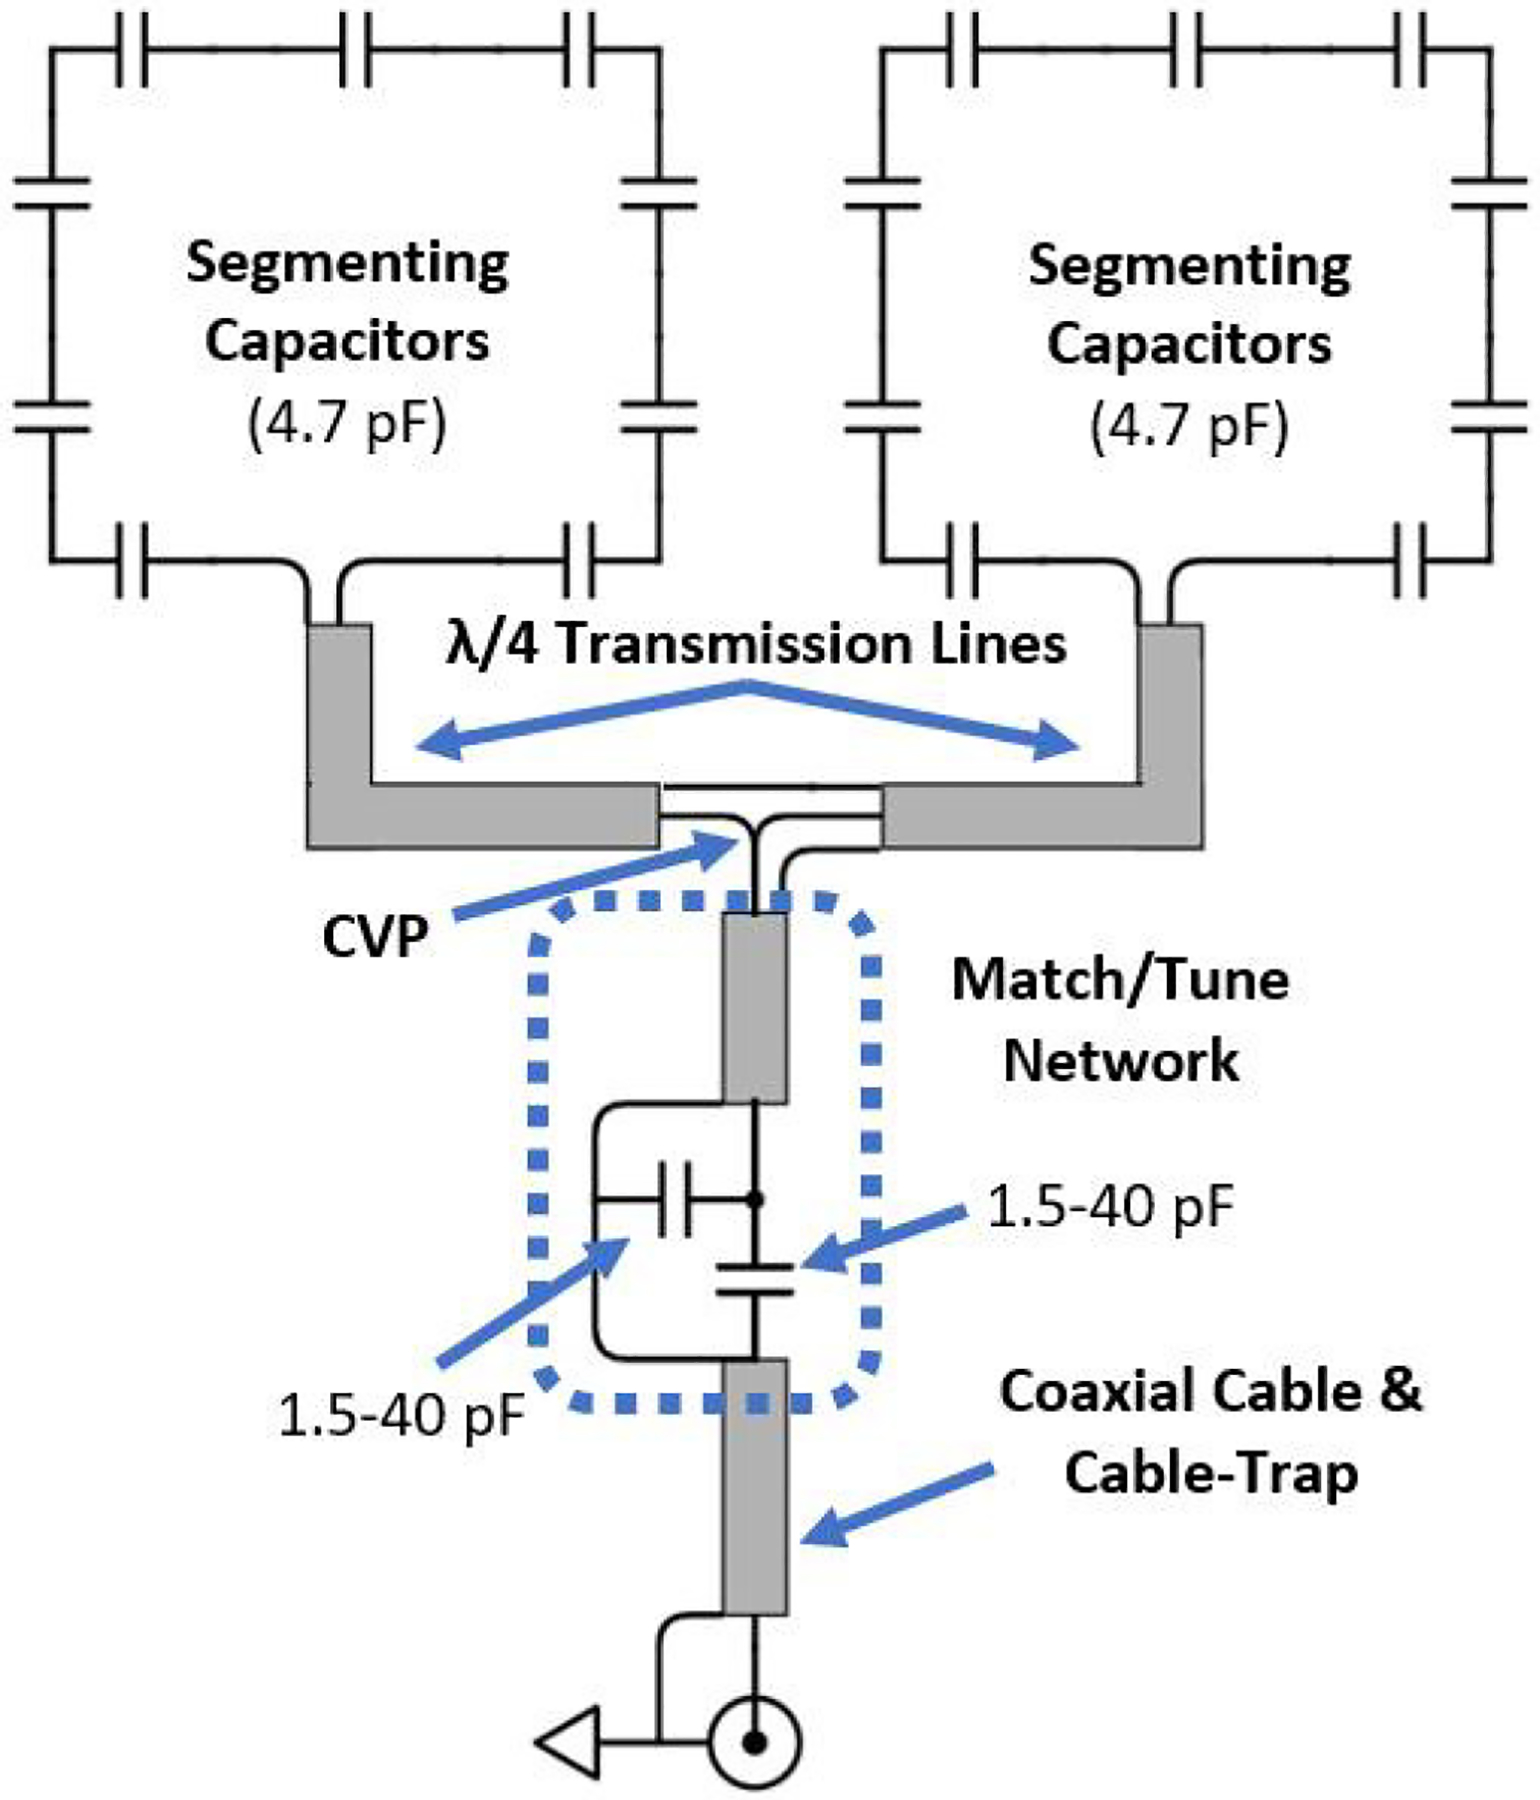
A Helmholtz coil utilizing the FCE condition and a typical L matching network was employed for transmission/reception of the 1H signal.
The FCE condition was needed in this case to ensure equal current distributions on the two Helmholtz loops despite their unequal loading conditions caused by the proximity of the upper loop to the chest wall and array elements. These loading conditions have been found to negatively affect field homogeneity at the 7T proton frequency using more standard free excitation methods but can be counteracted using the FCE method [53, 54].
A 4 cm length of semi-rigid cable (Pasternack) was used to transform the coil impedance presented at the CVP to allow straightforward impedance matching using a typical capacitive L-network with variable capacitors (1.5 – 40 pF). A dual-tuned cable trap was included after the matching network to suppress common-mode currents. Additionally, all transmit cables were bundled with floating cable traps [66] for further common-mode suppression. The receive array and transmit coils were mounted on a laser-cut acrylic former, and coil matching, active detuning, and preamplifier decoupling were rechecked in the final configuration while loaded with a 500 mL round-bottom flask of canola oil.
B. Benchtop Characterization
With the array detuned, isolation between the 13C transmit elements, and between each transmit element and each receive element, was characterized using an S21 measurement at the 13C frequency. Isolation between the 1H coil and each 13C transmit element was additionally characterized at both the 13C and 1H frequencies.
Relative transmit field intensities were checked through S21 measurements using a small ~1.5 cm diameter pickup probe situated in the middle of the transmit coil while transmitting with each transmit element. 13C transmit fields were further quantified through bench-measured B1 field maps. To obtain these, a small quadrature pickup probe was mounted to a Cartesian positioning system [67] and scanned across five coronal slices of the coil volume with 1.9 cm between each slice as the 13C coil transmitted in quadrature mode. Single slices slightly above and below the coil volume were also measured for seven total slices. To achieve quadrature transmission on the bench, the Helmholtz and saddle coil pair transmit ports were connected to the 0° and 90° ports respectively of an external quadrature combiner (Anaren 10011–3) with the input port connected to a network analyzer and the isolation port terminated. Quadrature reception through the probe was achieved with a similar setup with the two probe channels connected to the 0° and 90° ports of a quadrature combiner (Anaren 10011–3), the isolation port connected to the network analyzer, and the transmission port terminated.
Relative B1+ was taken as the normalized S21 between the coil and probe. For a central slice, the measurement was repeated while transmitting in anti-quad mode by switching the transmit coil connections such that the saddle coil pair was now connected to the 0° quadrature combiner port and the Helmholtz coil was connected to the 90° port. Measurements in quadrature mode were also repeated after inserting the array coil with/without active detuning enabled though only four slices could be obtained in this configuration due to the decreased available volume.
C. Spectroscopy Experiments
A series of spectroscopy experiments were run to characterize the coil in terms of SNR improvements and localization ability. For these experiments, two different phantom configurations were used: a 500 mL round-bottom flask of canola oil termed the bulk phantom and a ping-pong ball filled with 99%13C-enriched, 20 mmol/L,bicarbonate solution (Sigma Aldrich) termed the localization phantom.The canola oil phantom was chosen as an analog for fatty breast tissue. Though the abundance of 13C within the localization phantom was much higher than would be expected in vivo, the phantom was chosen to avoid the need for signal averaging when characterizing the array element’s coarse localization ability. Neither phantom was intended to fully mimic the complete chemical composition of the breast, and these phantoms were intended only as a means of coil characterization.
The coil loaded by the bulk phantom, interface box, and frequency-translation unit [37] were set up on a Philips 7T Achieva scanner at UT Southwestern Medical Center. Transmit coil matching was verified and adjusted slightly in-bore to account for the scanner environment. Transmit coils were plugged into the standard Philips Multix interface box.
Using the 1H coil, a survey scan, a flip angle series, and a B0 auto-shim routine were first run, though the flip angle series was stopped before reaching a 90° tip angle due to high power requirements with a 140V peak, 200 μs sinc pulse being the highest power pulse used. The drive scale calculated from the Philips scanner to achieve a 90° tip angle was noted, and the linewidth was measured after shimming as the FWHM of the main lipid peak in the fingerprint region.
A 13C spectrum was next acquired from the quadrature volume coil in T/R mode using a pulse-and-acquire sequence with a hard pulse RF excitation (nominal flip angle – 18°; NSA – 8; SW – 8000 Hz; Tacq – 4096 ms). Prior to data acquisition, drive scale of the 13C transmit coil was increased sequentially using the stated acquisition parameters until spectral SNR appeared to decrease based on visual inspection. The drive scale was then set to the value which gave maximum SNR. This was considered to be a 90° pulse despite the system reporting nominal flip angle of 18°. For later calibration, the transmit pulse amplitude and duration out of the Philips Multix interface box (where the transmit coil would be connected in this setup) were measured by connecting the interface box transmit output to an oscilloscope (LeCroyWavejet 332A) through a 70 dB attenuator.
The system was next set up to acquire equivalent datasets from the 16-channel array. This required the scanner to be operated as if performing a 1H spectroscopy experiment but with the frequency-translation system shifting the transmit and receive frequencies appropriately to the 13C resonances. To ensure comparability between the two setups, the amplitude and duration of the transmit pulse produced by the frequency translation system (where the transmit coil would be connected in this setup) were measured as was done previously while drive scale and pulse duration were adjusted to match previous measurements. Using the same scanner parameters as the T/R mode dataset, 16-channel spectra were acquired for comparison.
The bulk phantom was next replaced by the localized phantom which was placed at the apex of the receive array directly over receive element 1 and outside the sensitive region of the more distal elements. The same sequence used for previous experiments was rerun with reduced averaging (NSA – 1) to account for the 13C enrichment of the phantom.
After separation of the individual channel data all raw spectroscopy data was imported into Matlab for further processing. From the bulk phantom datasets, a noise-correlation matrix for the array was calculated using the last tenth (3200 points) of each channel’s FID datapointsand the Matlab correlation function. Contributions of the NMR signal were negligible within this region of the FID, and the datapoints were assumed to consist only of noise data.
For processing spectra from each phantom experiment, individual channels were first averaged in the time domain. After manually applying first order phase-correction and 3 Hz Lorentzian line-broadening on each channel, real-valued spectra were obtained through Fourier-transform of the timedomain data. The frequency axis was manually shifted to place the canola oil main fingerprinting peak at 30 ppm.
For the bulk phantom experiments, the SNR-weighted combined array spectrum was compared to that acquired by the volume coil in T/R mode. SNR-weighting was accomplished using the highest peak height of each spectrum as a measure of signal intensity [32] after normalizing noise levels and assuming zero mutual resistance. SNR calculation of the combined spectra, as well as for all other spectra obtained, was calculated by dividing the highest intensity peak height by the standard deviation of the first tenth of the spectra which contained no spectral peaks and was considered a noise region.
For the localized phantom experiment, average SNR was calculated for rows of receive elements with each row corresponding to a set of coils situated at a particular height on the former. All coils within a row were approximately equidistant from the localized phantom. Row 1 consisted only of the coil at the apex of the array former where the phantom was placed. Row 3 consisted of the 9 elements most distal to the apex, and Row 2 consisted of the 6 intermediate elements. The relationship between spectra SNR versus phantom proximity was used as the indication of the ability of individual receive elements to receive coarsely localized information.
III. Results
A. Benchtop Characterization
The completed coil system and interface box is shown in Figure 4. Interface box low-pass filters showed the expected frequency response with insertion loss less than 0.11 dB at the 13C frequency and stopband attenuation of greater than 43 dB at the 1H frequency. The expected LNA gain of ~28 dB was observed through the fully-connected interface box.
Fig. 4.
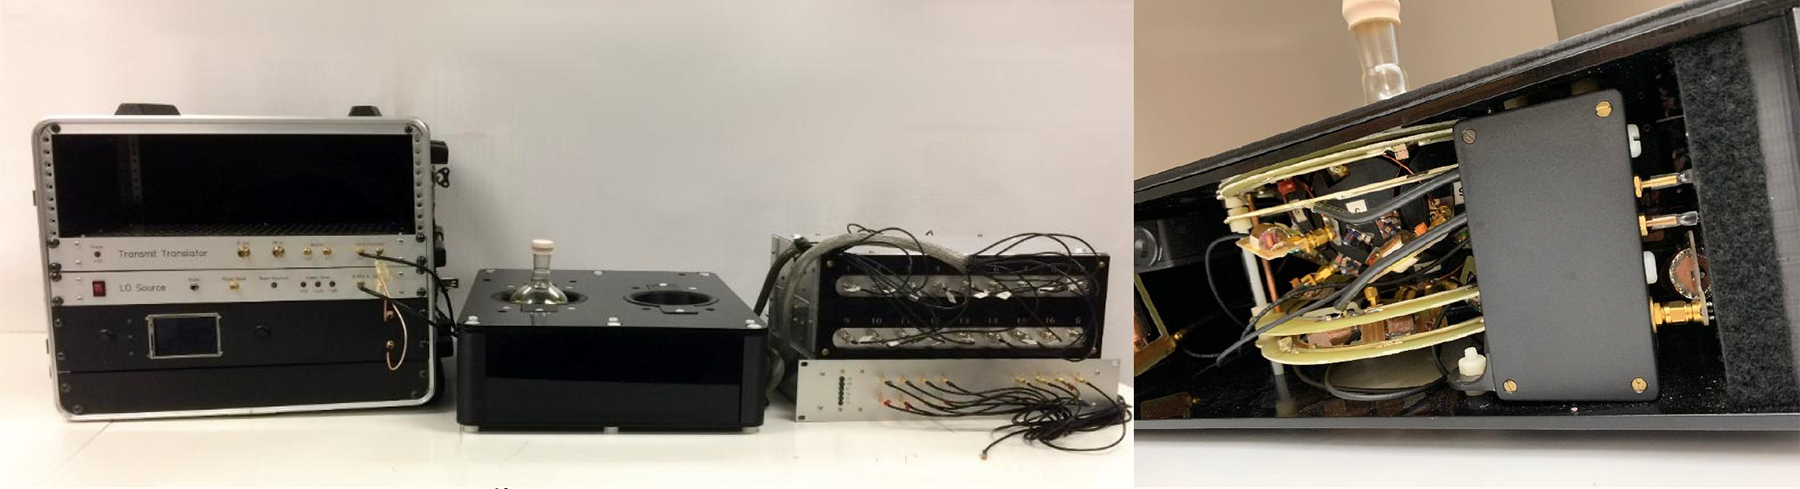
Completed hardware for 16-channel 13C data acquisition including (from left to right) previously-constructed frequency-translation unit, coil system, and interface box. The coil is shown with acrylic paneling removed to allow better visibility of the array coil.
Relevant benchtop measurements for the 13C receive and transmit elements are summarized in Table II. Average loaded coil Q factors were 60.6 for the large receive elements and 49.8 for the small receive elements and were approximately equal to the unloaded Q factors. We attributed the unfavorable Q unloaded/loaded ratio to both the negligible conductivity of the phantom as well as the generally low unloaded Q factors of the elements.
TABLE II.
Summary of Coil Benchtop Measurments
| Coil | S11 (dB) | Active Detuning (dB) | Preamp Decoupling (dB) | Transmit Coupling (dB) | Q |
|---|---|---|---|---|---|
| Helmholtz | −47.7 | 32.4 | N/A | N/A | 146.9 |
| Saddle | −46.0 | 36.5 | N/A | N/A | 156.1 |
| Rx 1 | −25.5 | 45.2 | 17.6 | −34.3 | 62.5 |
| Rx 2 | −24.2 | 47.9 | 16.6 | −36.2 | 62.5 |
| Rx 3 | −26.5 | 51.4 | 16.1 | −35.4 | 53.5 |
| Rx 4 | −23.0 | 48.1 | 16.0 | −37.4 | 57.7 |
| Rx 5 | −28.0 | 49.6 | 19.1 | −42.3 | 62.5 |
| Rx 6 | −23.3 | 46.0 | 17.8 | −34.9 | 57.7 |
| Rx 7 | −26.3 | 50.2 | 17.2 | −49.3 | 65.2 |
| Rx 8 | −23.1 | 50.1 | 17.1 | −35.0 | 65.2 |
| Rx 9 | −21.3 | 49.6 | 17.3 | −36.8 | 68.1 |
| Rx 10 | −29.5 | 49.3 | 16.4 | −35.9 | 51.7 |
| Rx 11 | −26.0 | 44.5 | 14.8 | −42.5 | 46.8 |
| Rx 12 | −29.0 | 51.8 | 15.4 | −43.3 | 50.0 |
| Rx 13 | −25.6 | 48.3 | 15.1 | −46.5 | 53.5 |
| Rx 14 | −34.9 | 43.4 | 11.6 | −41.8 | 53.5 |
| Rx 15 | −29.7 | 43.9 | 16.8 | −41.8 | 46.8 |
| Rx 16 | −24.5 | 46.2 | 14.8 | −40.9 | 48.4 |
Note that transmit coupling is shown as the S21 between the detuned receive element and transmit coil operating in quadrature mode. In some cases, receive element coupling was slightly higher to individual transmit elements operated in linear mode though no case exceeded −32.4 dB.
The quality factor measurements from the test elements with various network replacements revealed significant losses associated with some of the added networks. The Q measurements for the large and small elements with all networks replaced by segmenting capacitors were 310 and 273 respectively, much higher than those for the actual array elements. Inclusion of the detuning networks decreased these values only marginally to 280 and 268. However, Q factors were reduced significantly to 137 and 128 for elements containing LCC traps, indicating large losses in these networks. Similarly, Q factors decreased to 121 and 104 in elements containing the match/tune/decoupling networks. Considering these two networks both contain inductors which invariably increase coil losses, a Q factor reduction was unsurprising; however, the magnitude of the reduction was higher than expected.
The coil construction process indicated very little coupling between receive coil elements with no obvious peak-splitting displayed in any configuration. With all other receive elements actively detuned, no tuning adjustments were necessary compared to their initially-tuned isolated state. Likewise, only small adjustments were needed when the receive elements were preamp decoupled but not actively detuned. Active detuning on all array elements measured greater than 43.4 dB and S21 coupling between any combination of detuned receive element and either tuned 13C transmit element was less than - 32.4 dB.
Coupling was on average 5 dB higher for the larger receive elements compared to the small elements. Clean S11 peaks were observed for all coils when appropriate detuning/decoupling was applied to the remaining elements.
Average preamplifier decoupling for all receive elements measured 16.2 dB (minimum - 11.6 dB) with matching of all coils better than −17 dB with all other receive elements preamplifier decoupled. Regardless of decoupling values, smaller receive elements required less retuning in this configuration and generally coupled less even when other receive elements were left resonant.
The transmit coil also showed matching of both ports of the 13C quadrature coil better than −30 dB and clean S11 plots with the actively-detuned array inserted. Q factors of the Helmholtz and saddle coils were 146.9 and 156.1 respectively in this state. B1 fields for the 13C Helmholtz were 2.8 dB higher than those for the saddle coil at the center of the coil though this difference decreased closer to the saddle elements. Though identical field intensities would be preferable for achieving true circular polarization, this difference was expected due to the significantly greater spacing between saddle elements (19 cm center-to-center) compared to the Helmholtz spacing (7 cm) which was necessary to accommodate the array. Active detuning of the coil was better than 32.4 dB for both transmit coil elements, and the detuned transmit coil did not cause observable peak splitting in any tuned receive coil element.
Regardless of whether any other coil was kept active or detuned, the 1H transmit/receive coil could be matched to better than −20 dB. Isolation between the 1H coil and 13C transmit elements was 26.4 dB and 23.4 dB for the 13C Helmholtz and saddle pair coils respectively at the 1H frequency. Similarly, isolation was 17.1 dB and 26.6 dB at the 13C frequency. Isolation between the 13C Helmholtz and 13C saddle coils was 11.2 dB and 25.2 dB at the 13C and 1H frequencies respectively.
The 13C field mapping shown in Figure 5 revealed relatively homogeneous B1+ fields with less than 2.2 dB variation in average field measured across each slice for all slices that fell within the coil volume. This variation increased to 6.1 dB when including the two slices measured slightly outside the coil volume. Inclusion of the array with/without active detuning enabled decreased the average field in the central slice by 3.8 dB and 14.8 dB respectively due to increased transmit shielding while the array was in the detuned state and due to disruption of transmit coil matching when active detuning of the array was disabled. The decrease in average measured field when detecting B1− compared to B1+ (i.e. when operating in anti-quad mode) in a central slice was 5.4 dB, indicating that the majority of the transmit power was used to produce the correctly-polarized B1+ field.
Fig. 5.
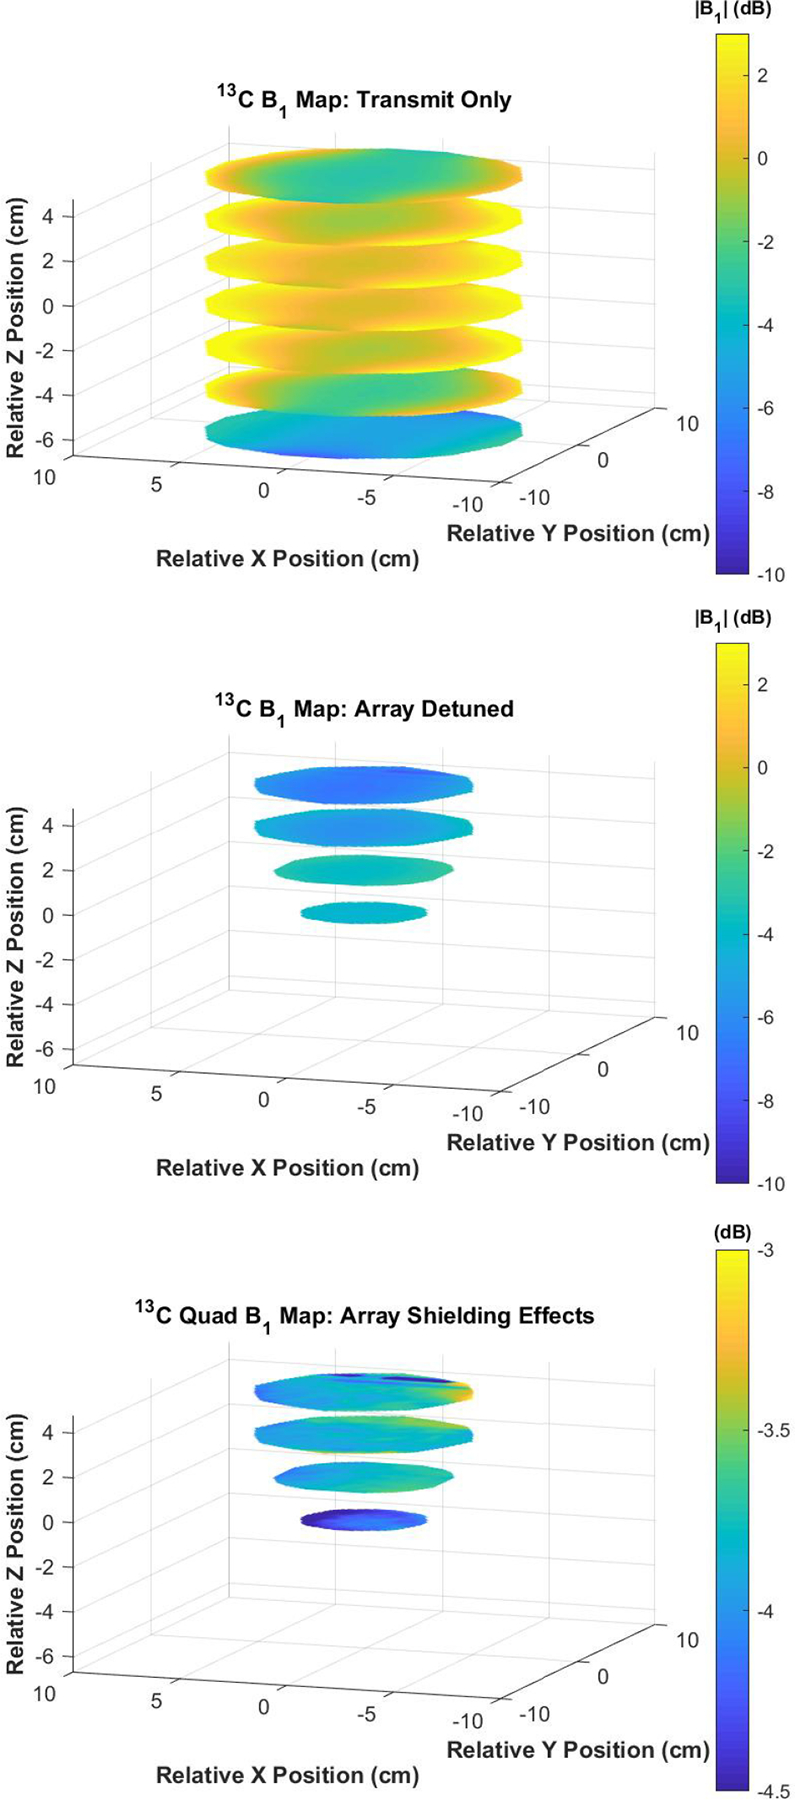
B1 field maps obtained from 13C transmit coil with the array removed (top) and inserted while actively-detuned (middle). The field maps indicate fairly good field homogeneity throughout the coil volume. A large decrease in field intensity is seen after insertion of the detuned array as characterized by the ratio of the fields before and after array insertion (bottom). This loss was attributed to shielding effects from the array elements and their respective circuitry.
B. Spectroscopy Experiments
Bulk spectroscopy experiments indicating the SNR improvement achieved with the array are shown in Figure 6. The signal level varied slightly between receive elements primarily corresponding to differences in coil element orientations with respect to the main magnetic field. For the bulk phantom, array coil SNR measured after Matlab processing was 198.7 compared to 62.1 for the volume coil acquisition indicating an SNR increase by a factor of 3.2. For comparison, the highest SNR from a single individual receive element was 105.7, and individual elements had an average SNR of 47.8, slightly lower than that of the quadrature volume coil which is expected considering the non-localized nature of the experiment.
Fig. 6.
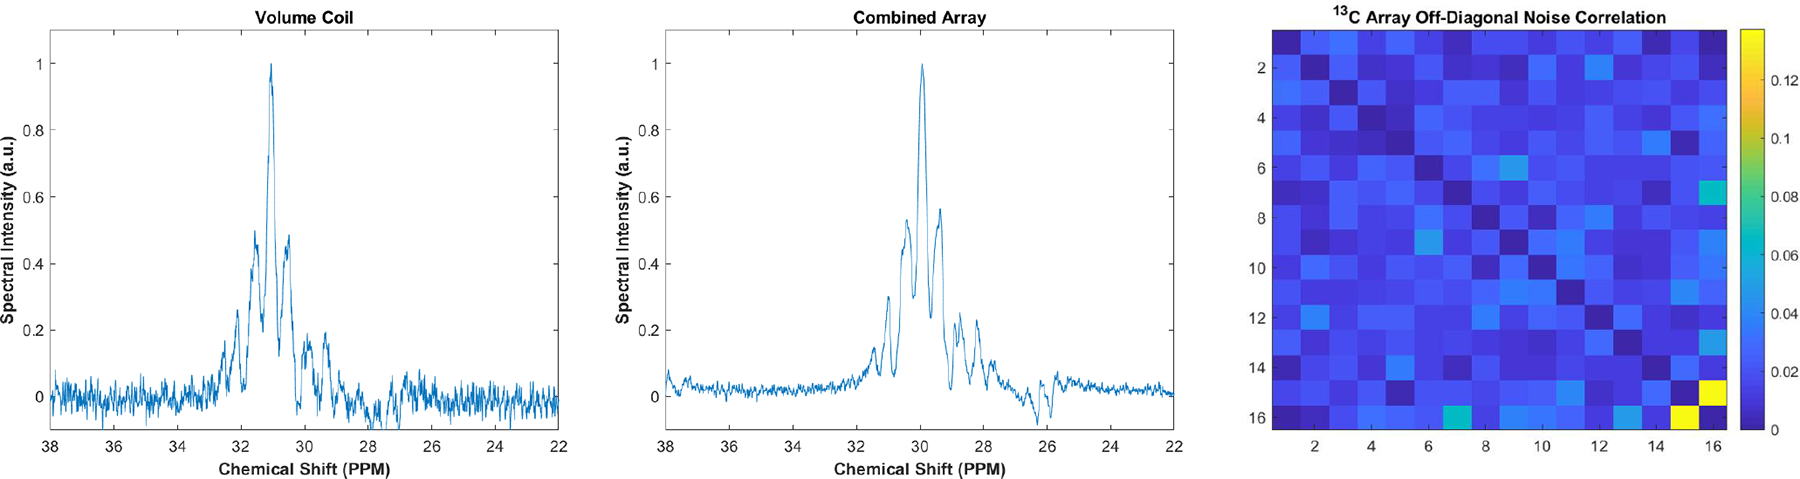
Bulk spectroscopy experimental results. A greater than three times increase in SNR from the array coil (left) compared a similar acquisition using the volume coil in T/R mode (middle) was seen, indicating the array’s ability to improve SNR over the entire breast volume. The noise data from the scan shows little inter-element coupling as expected from bench measurements with the highest coupling of 13.7% shown between elements 15 and 16 and all other elements showing significantly lower values.
Noise correlation between array elements showed minimal coupling. Average noise correlation between all elements was 2.0% with maximum coupling of 13.7%. No noticeable reliance of noise correlation on coil positioning was observed, presumably due to geometric decoupling of nearest neighbor coils and the spherical arrangement of coil elements which meant that most coils had similar levels of coupling.
For the localized bicarbonate phantom experiments (Figure 6), average SNR of individual receive elements was 24.8. The most proximal element to the phantom (i.e. the Row 1 element) had an SNR of 66.7. Row 2 elements had an average SNR of 24.0, and Row 3 elements had an average SNR of 17.6. In general, the observed SNR for receive elements decreased with increasing distance from the phantom as expected due to typical surface coil sensitivity patterns. This effect was even more pronounced in the most distal small receive elements which had an average SNR of 6.3 and would be expected to have sensitivity patterns least receptive to signal at the phantom location.
IV. Discussion
The low coupling measurements between the transmit coil and array made tuning the array elements insensitive to its positioning within the transmit coils. Similarly, the array was insensitive to phantom loading due to both the low conductivity of the phantom and the low element quality factors. Achieving better sample-noise dominance would be worthwhile to further increase SNR gains but is challenging with sources of loss being the additional circuitry needed for 1H decoupling and adequate preamplifier decoupling.
Results of quality factor testing of the various test coil configurations revealed that a “pure” resonant element can achieve a significantly higher quality factor than what was achieved in the array elements reported. While necessary components on the receive array, the addition of the LCC trapping networks, and match/tune/decoupling networks in particular, adds significant loss. Considering SNR is known to be proportional to [32], these losses have a direct on achievable SNR for cases where the coil is not heavily sample-noise dominant. For this work, the large differences in Q for the fully-assembled elements versus the “pure” resonant elements and lack of sample-noise dominancesuggests that SNR could be roughly doubled if network losses were fully mitigated. As sample-noise dominance is increased and coil noise become negligible compared to body noise, these SNR improvements would become less substantial.
Future work to minimize these losses while maintaining similar levels of decoupling may require substantial array modifications such as changing LCC trap component values and reconfiguring the decoupling network to rely on tuning through receive cable phase length rather than the use of inductors. The issue is only exacerbated by the low frequency associated with the 13C nucleus which makes achieving sample load dominance additionally challenging.
Though other groups have reported the need for additional receive element decoupling strategies to maximize SNR in certain X-nuclei arrays [68, 69], these strategies were not pursued in this work due to the low loaded quality factors and coupling coefficients (0.025 for the most tightly coupled coils) of our array elements. While both of these factors should minimize expected SNR gains from further decoupling methods, further study of these effects could still be beneficial. It should also be noted that the low noise correlation values obtained during scanner experiments could be partially attributed to the lack of sample noise dominance. Because coil losses seemed to be the dominant noise source and these losses do not necessarily show the same inter-element correlations as sample noise, noise correlation values may increase as sample noise dominance is approached.Though preamplifier decoupling was generally greater than 15 dB for the array, integration of the preamplifiers onto the coil itself could further enhance SNR and improve preamplifier decoupling values. However, the tight-fitting array geometry made the use of a modular interface box a convenient alternative which could be used for future 13C coils.
Ideally, characterization of transmit homogeneity for the 13C coils could be performed on the scanner using standard B1+ mapping techniques such as the double-angle method [70],DREAM [71], or Bloch-Siegert shift [72] techniques. However, the inherently low NMR sensitivity of the 13C nucleus makes obtaining useful maps using these scanner-based techniques challenging. Use of the benchtop measurement system for measuring transmit fields provided a simple alternative mapping method suitable for the current work. Though the fields could only be measured on this system in an unloaded configuration, the light loading effects of the phantoms used and low frequency of the 13C nucleus suggest that the benchtop-measured maps provided an accurate representation of the fields produced during scanner experiments for this work.
Further SNR improvements are expected if the use of the proton decoupling [73] and the Nuclear Overhauser Effect (NOE) [74, 75] is pursued, though these were not attempted due to the scope of the project. It is likely that improvements in 1H coil transmit efficiency would be necessary to make proton decoupling possible, but this could be accomplished by modifying the 1H coil to use a quadrature implementation.
Though high power requirements were noted for the 1H coil, this had also been seen previously with similar 7T coil designs [54, 55]. Reduced 1H B1+ efficiency was likely due to shielding effects of the added 13C array and transmit coil system [57] as well as impedance mismatches at the element feed points and standing wave effects due to use of the FCE technique [53]. These issues could likely be somewhat alleviated by modification of the current 1H coil to a quadrature design to improve efficiency, but these modifications were not undertaken at this point considering the focus of this work was primarily on the 13C coil system. However, these alterations would undoubtedly be worthwhile for future studies.
Further electromagnetic simulation work would be needed to confirm how best to improve coil efficiency and would also be especially beneficial in considering potential SAR implications of the present coil. SAR guidelines are often a limiting factor in 1H 7T studies [24–26], especially those involving SAR intensive techniques such as proton-decoupling. Simulated SAR maps must be created and verified in further phantom studies before undertaking in vivo studies to verify that the coil can stay within both local and global SAR guidelines. Considering the possibility of SAR-related issues for 1H coils operating at 7T [24–26], this is an important concern, and should be examined closely to ensure patient safety. However, it should be noted that while the FCE technique can lead to decreases in B1+ efficiencies due to impedance mismatches at the element feed point and standing wave effects [53], these losses are not deposited in the patient are not expected to impact SAR efficiency [54]. A loss of efficiency was also noted for the 13C transmit coil system after insertion of the array. Though SAR limitations are less likely a major concern at this frequency, these effects still need to be more well-characterized through simulation work verified through bench and phantom measurements before human studies are pursued.
The bulk phantom spectroscopy experiments indicate the significant SNR benefits of the array over the breast volume. The increased SNR when compared to volume coil reception would be essential for decreasing voxel sizes for localized spectroscopy experiments, and the array geometry means that deeper lesions may be studied more effectively than when using single loop elements for reception.
The results from the array localization experiment using single elements indicated a degree of signal localization ability from the array elements even when performing bulk spectroscopy experiments. The relationship of spectral SNR to coil element positioning suggests that looking at spectra from individual elements could provide a method of coarse signal localization. The low inter-element coupling needed for this was further demonstrated by low array noise correlation values which suggest low g-factors if accelerated, hyperpolarized studies are pursued. True gradient-based spectral localization techniques were not attempted in this work but could be attempted in future work. With the frequency-translation approach used in this work, the scan procedure is performed with the stock system operating as if performing a multichannel 1H scan, so gradient strengths and pulse bandwidths would need to be adjusted to account for the difference in the 13C and 1H gyromagnetic ratios, but adjusting for these changes would be straightforward.
V. Conclusion
The array coil demonstrated superior SNR performance compared to a typical volume coil covering a similar field-of-view. Furthermore, the array design adds the potential benefit of coarse localization through the distinct reception profiles of the individual receive elements. The array performance was demonstrated both on the bench and through phantom spectroscopy studies.
The most obvious future direction for this work is in vivo studies assessing lipid profiles of various populations to better understand the relationship of the lipidome to cancer. The ability of the coil to potentially provide an objective, noninvasive means of lipid analysis makes this particularly advantageous when compared to dietary surveys or biopsies. We hope to pursue such studies, which will of course require IRB approval and a detailed characterization of the B1+ fields and SAR distribution through both electromagnetic simulations and further phantom studies at both the 13C and 1H frequencies. The high channel count and low coupling between array elements also suggest that the coil would be well-suited for use in accelerated dynamic studies using hyperpolarization techniques such as DNP [76, 77] to retain polarization while providing high temporal resolution.
Fig. 7.
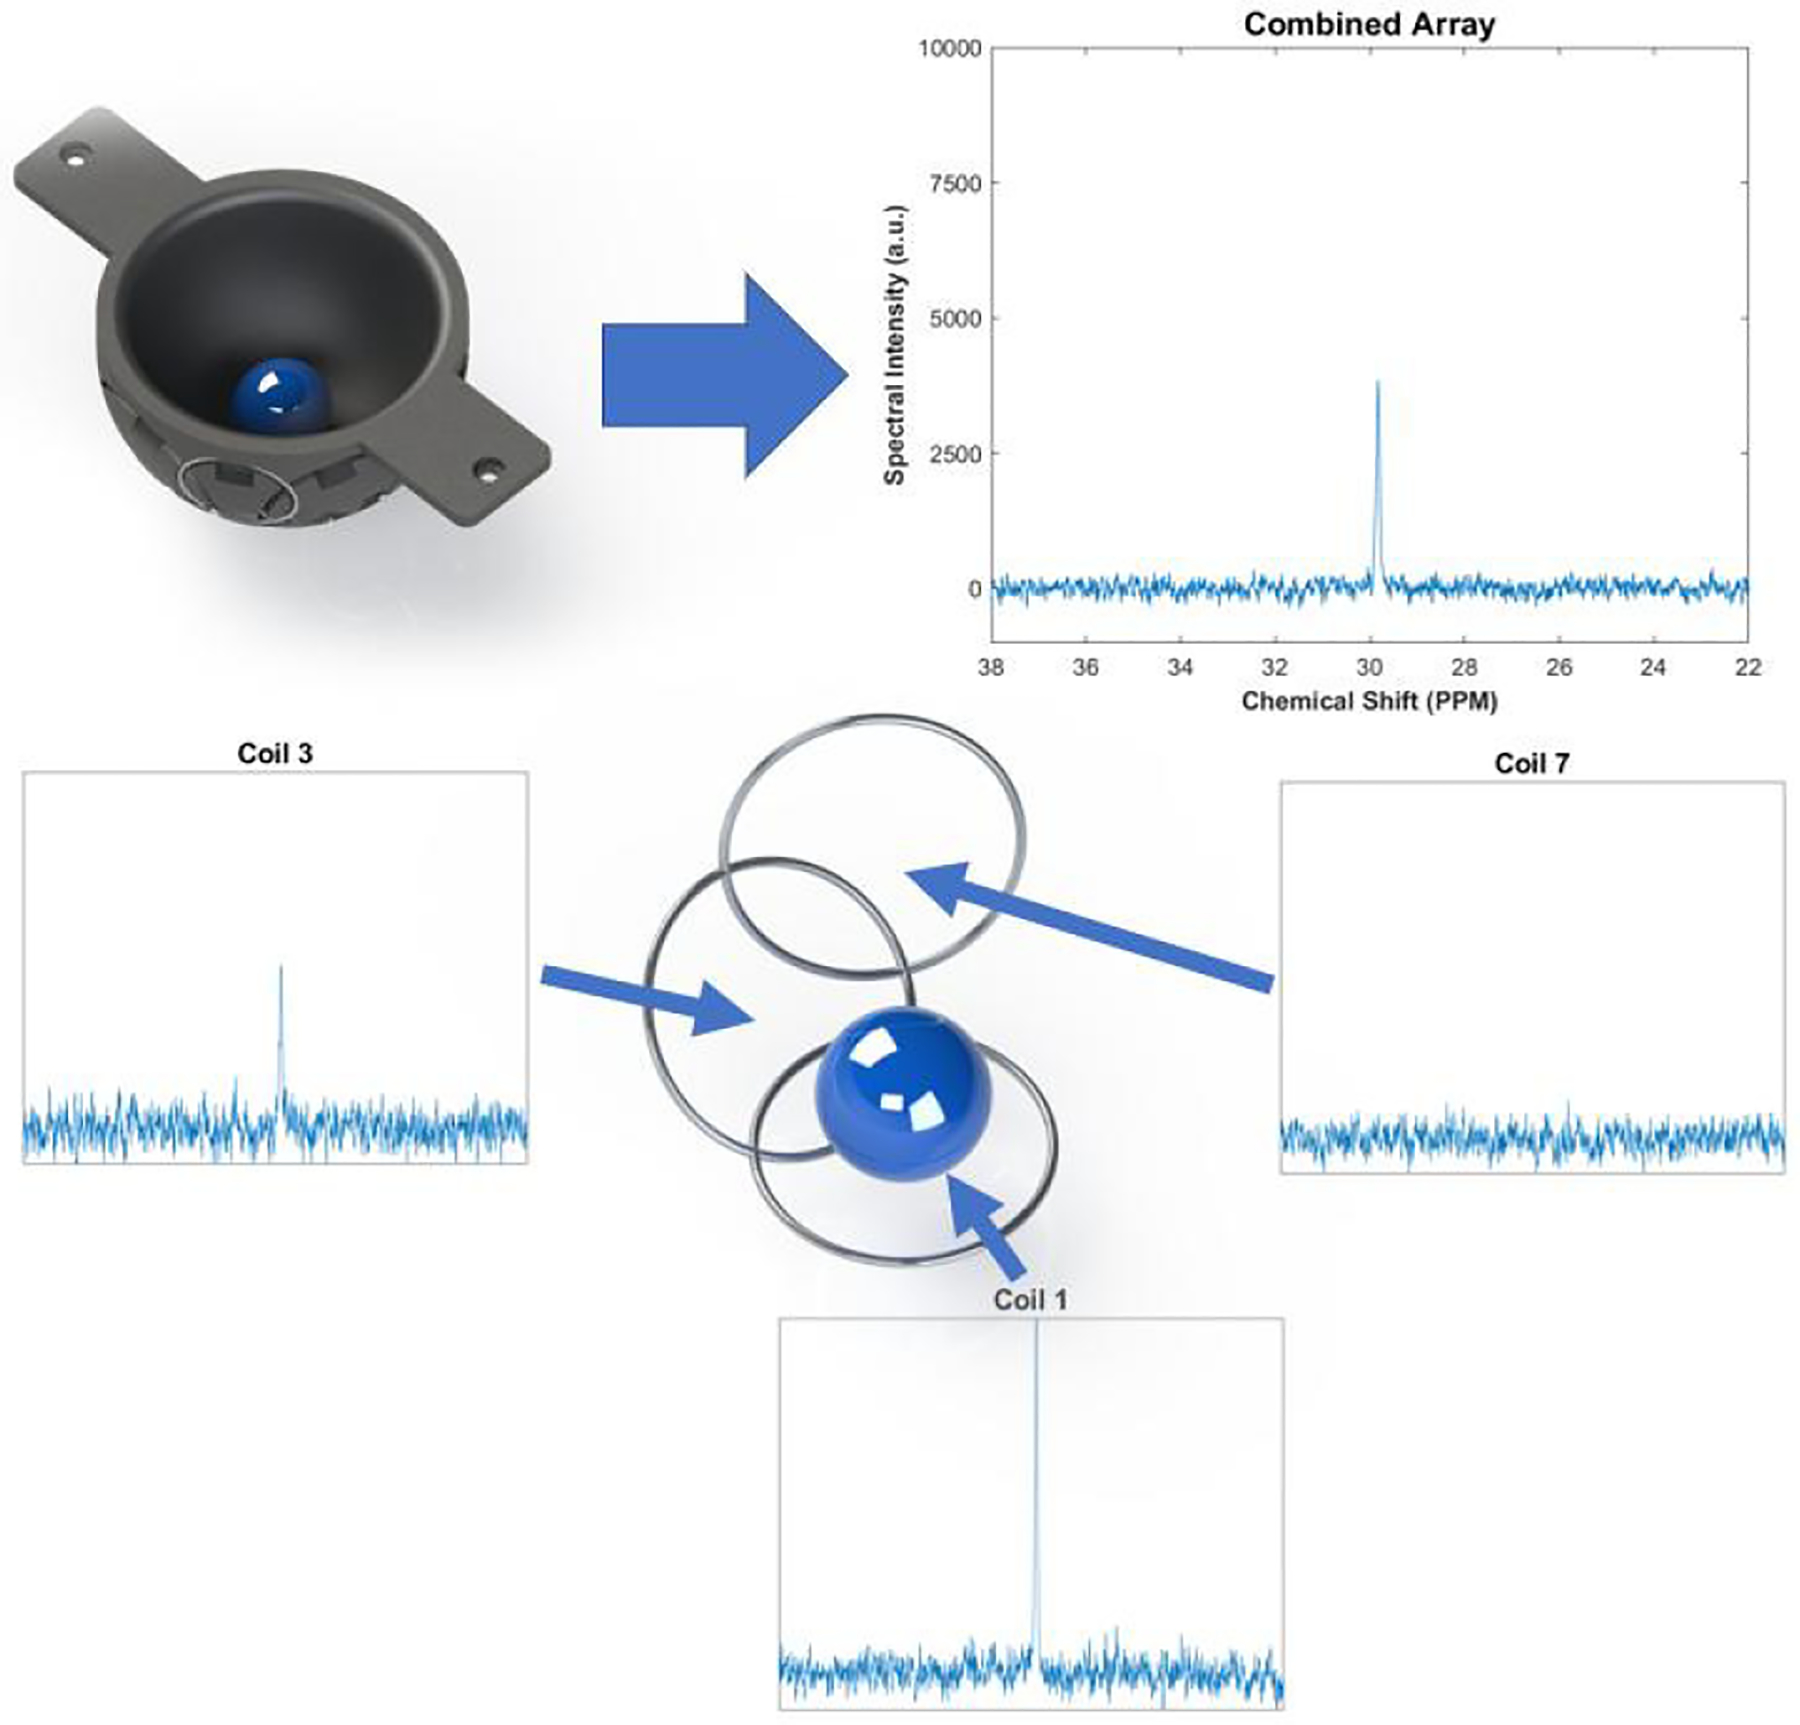
Spectra from example receive elements and the combined array spectra using the localization phantom. A bicarbonate spectrum from each row of receive elements is shown with spectral intensity levels generally decreasing for receive elements more distal to the phantom. Note that scaling was kept consistent between all spectra for easy comparison. The results indicate that spatial sensitivity patterns of individual receive elements may be used for coarse signal localization even without using localized sequences.
VI. Acknowledgement
The authors gratefully acknowledgeSandeepGanji for his assistance in reconstructing the 7T data.
This work was supported by CPRIT under Grant RP150456 and NIH under Grant R21HL120064.
Contributor Information
Matthew Wilcox, Department of Biomedical Engineering, Texas A&M University, College Station, TX 77843 USA.
Stephen Ogier, Department of Electrical and Computer Engineering, Texas A&M University, College Station, TX 77843 USA.
Sergey Cheshkov, Department of Radiology and the Advanced Imaging Research Center, University of Texas Southwestern Medical Center, Dallas, TX 75390 USA during the time of this work. He is now with the Center for Brain Health, University of Texas at Dallas, Dallas, TX, 75235, United States.
Ivan E. Dimitrov, Advanced Imaging Research Center, University of Texas Southwestern Medical Center, Dallas, TX 75390 USA and Philips Healthcare, Gainesville, FL 32608 USA
Craig R. Malloy, Advanced Imaging Research Center and the departments of Radiology and Internal Medicine, University of Texas Southwestern Medical Center, Dallas, TX 75390 USA and the VA North Texas Health Care System, Dallas, TX 75216 USA
Steven M. Wright, Departments of Electrical and Computer Engineering and Biomedical Engineering, Texas A&M University, College Station, TX 77843 USA.
Mary P. McDougall, Departments of Biomedical Engineering and Electrical and Computer Engineering, Texas A&M University, College Station, TX 77843 USA.
References
- 1.Bray F, et al. , Global cancer statistics 2018: GLOBOCAN estimates of incidence and mortality worldwide for 36 cancers in 185 countries. Ca-a Cancer Journal for Clinicians, 2018. 68(6): p. 394–424. [DOI] [PubMed] [Google Scholar]
- 2.DeSantis CE, et al. , Breast cancer statistics, 2017, racial disparity in mortality by state. CA - A Cancer Journal for Clinicians, 2017. 67(6): p. 439–448. [DOI] [PubMed] [Google Scholar]
- 3.Ferlay J, et al. , Estimates of worldwide burden of cancer in 2008: GLOBOCAN 2008. International Journal of Cancer, 2010. 127(12):p. 2893–2917. [DOI] [PubMed] [Google Scholar]
- 4.Kolonel LN, Altshuler D, and Henderson BE,The multiethnic cohort study: Exploring genes, lifestyle and cancer risk. Nature Reviews Cancer, 2004. 4(7): p. 519–527. [DOI] [PubMed] [Google Scholar]
- 5.Armstrong B and Doll R,Environmental Factors and Cancer Incidence and Mortality in Different Countries, with Special Reference to Dietary Practices. International Journal of Cancer, 1975. 15(4): p. 617–631. [DOI] [PubMed] [Google Scholar]
- 6.Cho EY, et al. , Premenopausal fat intake and risk of breast cancer. Journal of the National Cancer Institute, 2003. 95(14): p. 1079–1085. [DOI] [PubMed] [Google Scholar]
- 7.Chajes V, et al. , Association between serum transmonounsaturated fatty acids and breast cancer risk in the E3N-EPIC study. American Journal of Epidemiology, 2008. 167(11): p. 1312–1320. [DOI] [PMC free article] [PubMed] [Google Scholar]
- 8.Siguel EN, Dietary modulation of omega-3/omega-6 polyunsaturated fatty acid ratios in patients with breast cancer. Journal of the National Cancer Institute, 1998. 90(8): p. 629–630. [DOI] [PubMed] [Google Scholar]
- 9.Simonsen N, et al. , Adipose tissue omega-3 and omega-6 fatty acid content and breast cancer in the EURAMIC study. American Journal of Epidemiology, 1998. 147(4): p. 342–352. [DOI] [PubMed] [Google Scholar]
- 10.Fabian CJ, Kimler BF, and Hursting SD,Omega-3 fatty acids for breast cancer prevention and survivorship. Breast Cancer Research, 2015. 17. [DOI] [PMC free article] [PubMed] [Google Scholar]
- 11.Li JM, et al. , Maternal exposure to an n-3 polyunsaturated fatty acid diet decreases mammary cancer risk of female offspring in adulthood. Food & Function, 2018. 9(11): p. 5768–5777. [DOI] [PubMed] [Google Scholar]
- 12.Maillard V, et al. , N-3 and N-6 fatty acids in breast adipose tissue and relative risk of breast cancer in a case-control study in Tours, France. International Journal of Cancer, 2002. 98(1): p. 78–83. [DOI] [PubMed] [Google Scholar]
- 13.Bougnoux P, Giraudeau B, and Couet C,Diet, cancer, and the lipidome. Cancer Epidemiology Biomarkers & Prevention, 2006. 15(3): p. 416–421. [DOI] [PMC free article] [PubMed] [Google Scholar]
- 14.Khankari NK, et al. , Polyunsaturated fatty acid interactions and breast cancer incidence: a population-based case-control study on Long Island, New York. Annals of Epidemiology, 2015. 25(12): p. 929–935. [DOI] [PMC free article] [PubMed] [Google Scholar]
- 15.Bassett JK, et al. , Plasma phospholipids fatty acids, dietary fatty acids, and breast cancer risk. Cancer Causes & Control, 2016. 27(6): p. 759–773. [DOI] [PubMed] [Google Scholar]
- 16.Pender-Cudlip MC, et al. , Delta-6-desaturase activity and arachidonic acid synthesis are increased in human breast cancer tissue. Cancer Science, 2013. 104(6): p. 760–764. [DOI] [PMC free article] [PubMed] [Google Scholar]
- 17.Kiyabu GY, et al. , Fish, n-3 polyunsaturated fatty acids and n-6 polyunsaturated fatty acids intake and breast cancer risk: The Japan Public Health Center-based prospective study. International Journal of Cancer, 2015. 137(12): p. 2915–2926. [DOI] [PubMed] [Google Scholar]
- 18.Yarla NS, et al. , Targeting arachidonic acid pathway by natural products for cancer prevention and therapy. Seminars in Cancer Biology, 2016. 40–41: p. 48–81. [DOI] [PubMed] [Google Scholar]
- 19.Chang NW, et al. , High levels of arachidonic acid and peroxisome proliferator-activated receptor-alpha in breast cancer tissues are associated with promoting cancer cell proliferation. Journal of Nutritional Biochemistry, 2013. 24(1): p. 274–281. [DOI] [PubMed] [Google Scholar]
- 20.Mabasa L, et al. , Maternal Dietary Canola Oil Suppresses Growth of Mammary Carcinogenesis in Female Rat Offspring. Nutrition and Cancer-an International Journal, 2013. 65(5): p. 695–701. [DOI] [PubMed] [Google Scholar]
- 21.Liu JJ and Ma DWL,The Role of n-3 Polyunsaturated Fatty Acids in the Prevention and Treatment of Breast Cancer. Nutrients, 2014. 6(11): p. 5184–5223. [DOI] [PMC free article] [PubMed] [Google Scholar]
- 22.Victor TA, Bergman A, and Knop RH,Detecting Fatty-Acids of Dietary Origin in Normal and Cancerous Human Breast-Tissue by C-13 Nuclear-Magnetic-Resonance Spectroscopy. British Journal of Cancer, 1993. 68(2): p. 336–341. [DOI] [PMC free article] [PubMed] [Google Scholar]
- 23.De Graaf RA, In vivo NMR spectroscopy : principles and techniques. 1998. [Google Scholar]
- 24.Moser E, et al. , 7-T MR-from research to clinical applications? Nmr in Biomedicine, 2012. 25(5): p. 695–716. [DOI] [PubMed] [Google Scholar]
- 25.Trattnig S, et al. , Clinical applications at ultrahigh field (7T). Where does it make the difference? Nmr in Biomedicine, 2016. 29(9): p. 1316–1334. [DOI] [PubMed] [Google Scholar]
- 26.Vaughan JT, et al. , 7T vs. 4T: RF power, homogeneity, and signal-to-noise comparison in head images. Magnetic Resonance in Medicine, 2001. 46(1): p. 24–30. [DOI] [PubMed] [Google Scholar]
- 27.Barker PB, et al. , Broadband proton decoupling for in vivo brain spectroscopy in humans. Magnetic Resonance in Medicine, 2001. 45(2): p. 226–232. [DOI] [PubMed] [Google Scholar]
- 28.Kumaragamage C, et al. , In vivo proton observed carbon edited (POCE) C-13 magnetic resonance spectroscopy of the rat brain using a volumetric transmitter and receive-only surface coil on the proton channel. Magnetic Resonance in Medicine, 2018. 79(2): p. 628–635. [DOI] [PubMed] [Google Scholar]
- 29.Klomp DWJ, et al. , Sensitivity-enhanced C-13 MR spectroscopy of the human brain at 3 Tesla. Magnetic Resonance in Medicine, 2006. 55(2): p. 271–278. [DOI] [PubMed] [Google Scholar]
- 30.Li SZ, et al. , C-13 MRS of occipital and frontal lobes at 3 T using a volume coil for stochastic proton decoupling. NMR in Biomedicine, 2010. 23(8): p. 977–985. [DOI] [PMC free article] [PubMed] [Google Scholar]
- 31.Roemer PB, et al. , The NMR Phased-Array. Magnetic Resonance in Medicine, 1990. 16(2): p. 192–225. [DOI] [PubMed] [Google Scholar]
- 32.Wright SM and Wald LL,Theory and application of array coils in MR spectroscopy. NMR in Biomedicine, 1997. 10(8): p. 394–410. [DOI] [PubMed] [Google Scholar]
- 33.Wright SM, Magin RL, and Kelton JR,Arrays of Mutually Coupled Receiver Coils - Theory and Application. Magnetic Resonance in Medicine, 1991. 17(1): p. 252–268. [DOI] [PubMed] [Google Scholar]
- 34.Keil B and Wald LL,Massively parallel MRI detector arrays. Journal of Magnetic Resonance, 2013. 229: p. 75–89. [DOI] [PMC free article] [PubMed] [Google Scholar]
- 35.Bankson JA and Wright SM Multi-channel magnetic resonance spectroscopy through time domain multiplexing. Magnetic Resonance Imaging, 2001. 19(7): p. 1001–1008. [DOI] [PubMed] [Google Scholar]
- 36.Porter JR and Wright SM,A sixteen-channel multiplexing upgrade for single channel receivers. Magnetic Resonance Imaging, 2001. 19(7): p. 1009–1016. [DOI] [PubMed] [Google Scholar]
- 37.Ogier SE, et al. , A frequency translation system for multi-channel, multi-nuclear MR spectroscopy. Transactions in Biomedical Engineering, 2020. [DOI] [PMC free article] [PubMed] [Google Scholar]
- 38.Meise FM, et al. , Design and Evaluation of a 32-Channel Phased-Array Coil for Lung Imaging with Hyperpolarized 3-Helium. Magnetic Resonance in Medicine, 2010. 63(2): p. 456–464. [DOI] [PubMed] [Google Scholar]
- 39.Panda A, et al. , Phosphorus liver MRSI at 3 T using a novel dual-tuned eight-channel 31P/1H coil. Magnetic Resonance in Medicine, 2012. 68(5): p. 1346–1356. [DOI] [PubMed] [Google Scholar]
- 40.Kaggie JD, et al. , A 3 T Sodium and Proton Composite Array Breast Coil. Magnetic Resonance in Medicine, 2014. 71(6): p. 2231–2242. [DOI] [PMC free article] [PubMed] [Google Scholar]
- 41.Goluch S, et al. , A form-fitted three channel P-31, two channel H-1 transceiver coil array for calf muscle studies at 7 T. Magnetic Resonance in Medicine, 2015. 73(6): p. 2376–2389. [DOI] [PubMed] [Google Scholar]
- 42.Brown R, et al. , Design of a nested eight-channel sodium and four-channel proton coil for 7T knee imaging. Magnetic Resonance in Medicine, 2013. 70(1): p. 259–268. [DOI] [PMC free article] [PubMed] [Google Scholar]
- 43.Qian YX, et al. , Sodium imaging of human brain at 7 T with 15-channel array coil. Magnetic Resonance in Medicine, 2012. 68(6):p. 1808–1814. [DOI] [PMC free article] [PubMed] [Google Scholar]
- 44.Lachner S, et al. , Comparison of optimized intensity correction methods for 23Na MRI of the human brain using a 32-channel phased array coil at 7 Tesla. Zeitschrift für Medizinische Physik, 2020. 30(2): p. 104–115. [DOI] [PubMed] [Google Scholar]
- 45.Valkovič L, et al. , Using a whole-body 31P birdcage transmit coil and 16-element receive array for human cardiac metabolic imaging at 7T. PLOS ONE, 2017. 12(10): p. e0187153. [DOI] [PMC free article] [PubMed] [Google Scholar]
- 46.Shajan G, et al. , Three-layered radio frequency coil arrangement for sodium MRI of the human brain at 9.4 Tesla. Magnetic Resonance in Medicine, 2016. 75(2): p. 906–916. [DOI] [PubMed] [Google Scholar]
- 47.Dominguez-Viqueira W, et al. , Intensity correction for multichannel hyperpolarized 13C imaging of the heart. Magnetic Resonance in Medicine, 2016. 75(2): p. 859–865. [DOI] [PubMed] [Google Scholar]
- 48.Lau AZ, et al. , Simultaneous multislice acquisition without trajectory modification for hyperpolarized 13C experiments. Magnetic Resonance in Medicine, 2018. 80(4): p. 1588–1594. [DOI] [PMC free article] [PubMed] [Google Scholar]
- 49.Arunachalam A, et al. , Accelerated spectroscopic imaging of hyperpolarized C-13 pyruvate using SENSE parallel imaging. NMR in Biomedicine, 2009. 22(8): p. 867–873. [DOI] [PubMed] [Google Scholar]
- 50.Tropp J, et al. , Multi-channel metabolic imaging, with SENSE reconstruction, of hyperpolarized [1–13C] pyruvate in a live rat at 3.0tesla on a clinical MR scanner. Journal of Magnetic Resonance, 2011. 208(1): p. 171–177. [DOI] [PMC free article] [PubMed] [Google Scholar]
- 51.Ohliger MA, et al. , Combined parallel and partial fourier MR reconstruction for accelerated 8-channel hyperpolarized carbon-13 in vivo magnetic resonance Spectroscopic imaging (MRSI). Journal of Magnetic Resonance Imaging, 2013. 38(3): p. 701–713. [DOI] [PMC free article] [PubMed] [Google Scholar]
- 52.Autry AW, et al. , Comparison between 8- and 32-channel phased-array receive coils for in vivo hyperpolarized 13C imaging of the human brain. Magnetic Resonance in Medicine, 2019. 82(2):p. 833–841. [DOI] [PMC free article] [PubMed] [Google Scholar]
- 53.McDougall MP, et al. , A Simple Approach to Overcoming Mutual Coupling Effects in Some Transmit Array Coils for Magnetic Resonance Imaging. 2008 30th Annual International Conference of the IEEE Engineering in Medicine and Biology Society, Vols 1–8, 2008: p. 2043-+. [DOI] [PubMed] [Google Scholar]
- 54.Cui JM, et al. , A Switched-Mode Breast Coil for 7 T MRI Using Forced-Current Excitation. IEEE Transactions on Biomedical Engineering, 2015. 62(7): p. 1777–1783. [DOI] [PMC free article] [PubMed] [Google Scholar]
- 55.By S, et al. , A 16-Channel Receive, Forced Current Excitation Dual-Transmit Coil for Breast Imaging at 7T. PLOS One, 2014. 9(11). [DOI] [PMC free article] [PubMed] [Google Scholar]
- 56.LC Filters Design Tool. RF Tools 2015 [cited 2015; Available from: https://rf-tools.com/lc-filter/.
- 57.Nested Surface Coils for Multinuclear NMR, in eMagRes. [Google Scholar]
- 58.Wiggins GC, et al. , 32-Channel 3 tesla receive-only phased-array head coil with soccer-ball element geometry. Magnetic Resonance in Medicine, 2006. 56(1): p. 216–223. [DOI] [PubMed] [Google Scholar]
- 59.McGhee D and Steele JR, Breast volume and bra size. Int J Cloth Sci Tech., 2011. 23: p. 351–360. [Google Scholar]
- 60.Meyerspeer M, et al. , An Improved Trap Design for Decoupling Multinuclear RF Coils. Magnetic Resonance in Medicine, 2014. 72(2): p. 584–590. [DOI] [PubMed] [Google Scholar]
- 61.Dabirzadeh A and McDougall MP,Trap Design for Insertable Second-Nuclei Radiofrequency Coils for Magnetic Resonance Imaging and Spectroscopy. Concepts in Magnetic Resonance Part B-Magnetic Resonance Engineering, 2009. 35b(3): p. 121–132. [Google Scholar]
- 62.Reykowski A, Wright SM, and Porter JR,Design of Matching Networks for Low-Noise Preamplifiers. Magnetic Resonance in Medicine, 1995. 33(6): p. 848–852. [DOI] [PubMed] [Google Scholar]
- 63.Doty FD, et al. , Noise in High-Power, High-Frequency Double-Tuned Probes. Journal of Magnetic Resonance, 1988. 77(3): p. 536–549. [Google Scholar]
- 64.Wright AC, et al. , Helmholtz-pair transmit coil with integrated receive array for high-resolution MRI of trabecular bone in the distal tibia at 7T. Journal of Magnetic Resonance, 2011. 210(1): p. 113–122. [DOI] [PMC free article] [PubMed] [Google Scholar]
- 65.Ginsberg DM and Melchner MJ,Optimum Geometry of Saddle Shaped Coils for Generating a Uniform Magnetic Field. Review of Scientific Instruments, 1970. 41(1): p. 122–123. [Google Scholar]
- 66.Seeber DA, Jevtic I, and Menon A,Floating shield current suppression trap. Concepts in Magnetic Resonance Part B-Magnetic Resonance Engineering, 2004. 21b(1): p. 26–31. [Google Scholar]
- 67.Boyer JS, Wright SM, and Porter JR,An automated measurement system for characterization of RF and gradient coil parameters. Jmri-Journal of Magnetic Resonance Imaging, 1998. 8(3): p. 740–747. [DOI] [PubMed] [Google Scholar]
- 68.Malzacher M, et al. , Reducing signal-to-noise ratio degradation due to coil coupling in a receiver array for 35Cl MRI at 9.4 T: A comparison of matching and decoupling strategies. Concepts in Magnetic Resonance Part B: Magnetic Resonance Engineering, 2018. 48B(2): p. e21383. [Google Scholar]
- 69.Brown R, et al. , A flexible nested sodium and proton coil array with wideband matching for knee cartilage MRI at 3T. Magnetic Resonance in Medicine, 2016. 76(4): p. 1325–1334. [DOI] [PMC free article] [PubMed] [Google Scholar]
- 70.Bouhrara M and Spencer RG, Steady-State Double-Angle Method for Rapid B1 Mapping. Magnetic Resonance in Medicine, 2019. 82(1): p. 189–201. [DOI] [PMC free article] [PubMed] [Google Scholar]
- 71.Nehrke K and Börnert P, DREAM—a novel approach for robust, ultrafast, multislice B1 mapping. Magn Reson Med, 2012. 68: p. 1517–1526. [DOI] [PubMed] [Google Scholar]
- 72.Sacolick LI, et al. , B1 mapping by Bloch-Siegert shift. Magn Reson Med, 2010. 63(5): p. 1315–22. [DOI] [PMC free article] [PubMed] [Google Scholar]
- 73.Shaka AJ, Keeler J, and Freeman R,Evaluation of a New Broad-Band Decoupling Sequence - Waltz-16. Journal of Magnetic Resonance, 1983. 53(2): p. 313–340. [Google Scholar]
- 74.Overhauser AW, Polarization of Nuclei in Metals. Physical Review, 1953. 92(2): p. 411–415. [Google Scholar]
- 75.Anderson WA and Freeman R,Influence of a Second Radiofrequency Field on High-Resolution Nuclear Magnetic Resonance Spectra. Journal of Chemical Physics, 1962. 37(1): p. 85–103. [Google Scholar]
- 76.Maly T, et al. , Dynamic nuclear polarization at high magnetic fields. Journal of Chemical Physics, 2008. 128(5). [DOI] [PMC free article] [PubMed] [Google Scholar]
- 77.Ardenkjaer-Larsen JH, et al. , Increase in signal-to-noise ratio of > 10,000 times in liquid-state NMR. Proceedings of the National Academy of Sciences of the United States of America, 2003. 100(18): p. 10158–10163. [DOI] [PMC free article] [PubMed] [Google Scholar]