

Summary
Mordes et al. did not detect survival or motor phenotypes in C9orf72 BAC transgenic mice originally described by Liu and colleagues. We discuss methodological differences between the Mordes and Liu studies, several additional studies in which survival and motor phenotypes were found and possible environmental and genetic effects. First, Nguyen et al. showed robust ALS/FTD phenotypes in C9-BAC versus non-transgenic (NT) mice and that α-GA1 treatment improved survival, behavior and neurodegeneration. The groups of Drs. Gelbard and Saxena also show decreased survival of C9-BAC vs NT mice and neuropathological and behavioral deficits similar to Liu. While FVB/N mice can have seizures, increases in seizure severity and the death of both C9 and NT animals that may mask C9 disease phenotypes have been observed in recent C9-500 FVB/NJ bred cohorts. In summary, we provide an update on phenotypes seen in FVB C9-BAC mice and additional details to successfully use this model.
Introduction
The C9orf72 hexanucleotide repeat expansion mutation is the most common genetic cause of both amyotrophic lateral sclerosis and frontotemporal dementia (DeJesus-Hernandez et al., 2011; Renton et al., 2011) and physiologically relevant mouse models are critically important for understanding the biology of the disease and for therapy development. Towards this end, four groups generated BAC transgenic mouse models carrying the intronic C9orf72 expansion mutation and human flanking sequences were generated. Three groups used the B6 genetic background (Jiang et al., 2016; O’Rourke et al., 2015; Peters et al., 2015) and the other group used the FVB (Liu et al., 2016) background. While all of these models develop molecular features of the disease, only two models reported behavioral and pathological phenotypes (Jiang et al., 2016; Liu et al., 2016). Phenotypes in the Jiang et al. model on the C57BL/6 genetic background showed age-dependent, anxiety-like behavior, impaired cognitive function and mild hippocampal neuronal loss at 12 months (Jiang et al., 2016). In contrast, Liu and colleagues developed multiple lines of mice on the FVB/NJ background that develop repeat-length and dose-dependent phenotypes including motor deficits and neurodegenerative features of ALS/FTD (Liu et al., 2016). Importantly and similar to the human disease, the neurodegenerative and behavioral phenotypes were variable with some animals developing an acute disease (30–35%, Acute Mice) and others showing milder slowly progressive phenotypes (~40–45%, Slow Progressive Mice) or no detectable phenotypes (~20–30%, Asymptomatic Mice). Acutely affected mice are overtly sick. Phenotypes that have been observed in acute mice at end-stage include some but not necessarily all of the following: severe hippocampal and cortical degeneration (layers II/III and V of the motor cortex), sudden weight loss, grip strength abnormalities, inactivity, and paralysis of one or both hind limbs. Motor neuron loss, neuroinflammation, decreased survival, gait and open field abnormalities, as well as sense and antisense RNA foci and RAN protein aggregates were detectable in both Acute and Slow Progressive C9(+) mice. Neuromuscular junction abnormalities were also found in both Acute and Slow Progressive animals but were more profound in the Acute end-stage animals (Liu et al., 2016).
The C9–500 mice (Liu et al., 2016) were deposited at the Jackson Laboratory (JAX) (FVB/NJ-Tg(C9orf72)500Lpwr/J) in 2017 to provide the broader scientific community with a tool that can be used to increase our understanding of the biology of the disease and for the development of therapeutic strategies (Liu et al., 2016; Nguyen et al., 2020; Shao et al., 2019). Unfortunately, a number of groups have had difficulties detecting phenotypes in cohorts of mice established at various institutions. For example, a note on the JAX lab website (https://www.jax.org/strain/029099) states that cohorts of C9–500 mice generated at their facility did not show some of the disease specific phenotypes and that C9–500 mice and their non-transgenic (NT) littermates die at similar rates. In the Matters Arising article by Mordes et al., (Mordes et al., 2020) two independent groups failed to detect decreased survival, grip strength and motor phenotypes in their cohorts. We thank these authors for raising this issue. In response, we highlight differences in the methods used in the Mordes versus Liu studies that would be likely to lead to disparate conclusions. We also highlight four additional studies that have reproduced phenotypes described by Liu and colleagues (Liu et al., 2016). The first done at the University of Florida (UF) by Nguyen et al., shows robust ALS/FTD phenotypes including decreased survival, motor neuron loss, and molecular and behavioral abnormalities in cohorts of C9-BAC versus NT mice (Nguyen et al., 2020). This study also shows the prevention of these phenotypes using a human derived recombinant antibody against the GA dipeptide RAN proteins. These data provide strong support that the phenotypes found in these animals are relevant to the disease and are driven by RAN protein pathology. A second study performed at UF also showed that C9-BAC mice had significantly decreased survival compared to NT littermates (Pattamatta et al., 2020). While these two studies were done at UF, two additional studies using this mouse model, which were independently performed at different institutions, had similar findings.
In this Matters Arising response, we include new data from a third and fourth study. The third study, performed by the Saxena lab at the University of Bern (UBern), shows reduced survival, behavioral deficits, neuronal loss, neuroinflammation, and molecular features of disease in C9-BAC mice. Additionally, the fourth study, conducted by the Gelbard lab at the University of Rochester Medical Center (URMC), shows decreased survival of C9-BAC mice vs NT controls as well as neurodegenerative changes. We also describe severe seizure phenotypes affecting both C9 and NT animals in an additional recent cohort of mice which were bred from JAX FVB/NJ. In summary, we provide an update on the phenotypes seen in the FVB C9-BAC mice, and additional details on how to successfully use this mouse model that we hope will be useful to the scientific community.
Results and Discussion
Survival differences in FVB C9-BAC mouse cohorts
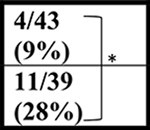
In contrast to the decreased survival of the C9-BAC mice reported by Liu et al., (Liu et al., 2016) Mordes and colleagues (Mordes et al., 2020) report two cohorts of mice generated at Harvard University (HU) and Johns Hopkins (JHU) in which no survival differences between C9–500 and NT littermate cohorts were detected at 52 weeks. Because gene silencing and substantial differences in repeat length between the Liu and Mordes studies were ruled out, Mordes and colleagues suggest that the differences in survival between the HU, JHU, and UF cohorts may result from environmental differences in the animal facilities at various institutions and that the phenotypes observed in the mice could result from the FVB background alone. To better understand differences in survival between different cohorts of C9 mice, we compare survival data from the Mordes study, the Liu study, and four additional studies. Two of these studies, Nguyen et al., 2020 and Pattamatta et al., 2020, were done in the same breeding facility at the University of Florida as the original Liu et al. study (Nguyen et al., 2020; Pattamatta et al., 2020) and two additional studies were performed in the Gelbard laboratory at the University of Rochester Medical Center (URMC) and the Saxena laboratory at the University of Bern (UBern). Because decreased survival in female C9-BAC mice was originally reported by Liu et al., death rates in females were compared, except for the UBern cohort, which includes both males and females. Similar to the cohort reported by Liu et al., significant differences in survival are found between the C9 and NT animals in the Nguyen et al., Pattamatta et al., studies and the URMC, and UBern cohorts (Table 1).
Table 1.
C9 and NT survival comparisons.
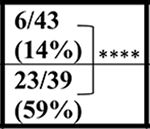
| Age | UF Liu et al. | HU | JHU | URMC | UBern# | UF Nguyen et al. | UF Pattamatta et al. | |
|---|---|---|---|---|---|---|---|---|
| Repeat Length | 500 | 500 | 500 | 500–800 | 650–800 | 500–750 | 500 | |
| NT | 20 wks | 0/50 (0%) | 0/20 (0%) | ∼2/22 (∼9%) | 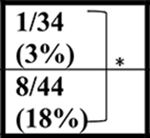 |
 |
 |
0/32 (0%) |
| C9+ | 0/28 (0%) | ∼3/31 (∼10%) | ∼3/39 (∼2%) | 2/37 (5%) | ||||
| NT | 43 wks | 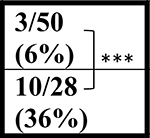 |
∼2/20 (∼10%) | ∼3/22 (∼14%) | ND | 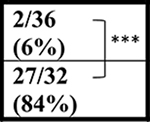 |
 |
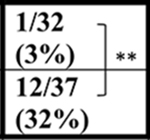 |
| C9+ | ∼4/31 (∼12%) | ∼11/39 (∼28%) | ND | |||||
| NT | 52 wks | 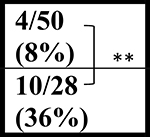 |
∼3/20 (∼15%) | ∼6/22 (27%) | ND | 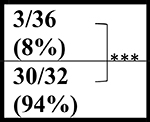 |
ND | 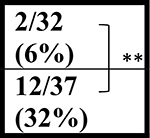 |
| C9+ | ∼5/31 (∼16%) | ∼14/39 (36%) | ND | ND |
ND, not done; ∼ estimated number; Statistical analyses were performed using Log-rank Mantel-Cox test. Bolded borders indicate significant differences in survival between C9 and NT groups.
p <0.05
p <0.01
p <0.001
p <0.0001.
the cohort of mice from UBern included both males and females while the other cohorts included female mice only.
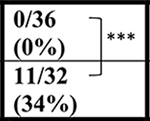
The Gelbard laboratory at URMC established their cohort of C9-BAC mice from C9–500Lpwr and FVB/NJ breeders purchased from JAX labs. Similar to Liu et al., sudden death caused by acute disease was observed post-mortem (in the 10 to 12 hour period between PM and AM monitoring) in 8/44 (18%) female C9-BAC mice by 20 weeks of age, with the earliest death observed at ~16 weeks of age. Mortality in NT mice was 1/34 (3%) (Table 1). In contrast to the other mouse cohorts, the Saxena lab at UBern bred the C9–500 mice obtained from JAX to FVB animals from Janvier Labs. The Jackson Lab FVB (FVB/NJ) and Janvier-FVB mice were imported from NIH outbred Swiss mice in late 1988 and 1996, respectively, but knowledge on how they differ from each other is limited. In the UBern cohort, we observed decreased survival in both male and female C9(+) mice at 20, 43, and 52 weeks (Table 1) with survival curves shown in (Figure 1A). Importantly, mortality among the UBern NT animals ranged from 6% at 43 weeks to 8% at 52 weeks with 3/36 deaths. Taken together, the URMC and UBern experiences (described here) combined with the Liu et al., Nguyen et al. and Pattamatta et al. studies demonstrate that the C9orf72 transgene and not the FVB background cause the increased mortality of the C9(+) animals in these studies.
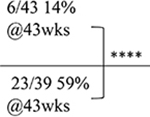
Figure 1. Decreased survival C9-BAC mice.

(A-C) Log-rank Mantel-Cox survival curves of: (A) female (n=20) and male (n=12) UBern C9-BAC mice vs. non-transgenic (NT) littermates (n = 36); (B) C9-BAC mice (C9–500 line) without (left – Liu study) and with (right – Nguyen study) weekly intraperitoneal (i.p.) injections. Liu cohort n=50 NT, n=28 C9(+) and Nguyen cohort, n=43 NT, n=39 C9(+); (C) uninjected (n=39) and PBS i.p.-injected C9(+) mice n=38. **** p < 0.0001. (See also Supplementary Table 1 and 2 and Supplementary Figures 1 and 2)
While we found survival phenotypes to be consistent features in these studies, we agree with Mordes et al. that environmental stresses can affect survival phenotypes (Mordes et al., 2020). For example, the rates of death were higher in C9-BAC mice that were subjected to weekly intraperitoneal (i.p.) injections (Nguyen et al., 2020) (59%) compared to cohorts of C9-BAC mice housed at UF that had not been subjected to this stress (Liu et al., 36% and Pattamatta et al., 32%) at 43 weeks of age (Figure 1B and Table 1). While the longer repeat lengths in C9(+) mice reported in the Nguyen et al. study may contribute to the increased rate of death compared to Liu et al., direct comparisons between repeat length matched cohorts of mice bred from the same founders used in the Nguyen et al. study show that mice undergoing weekly i.p. injections began dying earlier than mice that did not undergo this weekly stress (Figure 1C). Additionally, the C9-BAC cohorts generated at URMC and UBern show earlier and more frequent death of C9(+) vs. NT littermates compared to the Liu study (Table 1). Deaths in the C9(+) mice in the UBern study include deaths in both C9(+) male and female mice (Table 1 and Figure1A), with a subset of female mice showing earlier death and acute phenotypes consistent with those described for female C9(+) mice in the Liu et al. study. The variability in the death rates among these studies may result from environmental differences. Additionally, for the UBern cohort, genetic effects of the Janvier FVB background may increase the penetrance of disease for both male and female mice. Finally, while the differences in rates of death between the C9(+) and NT littermates in the HU and JHU cohorts were not significantly different, the failure to detect significant survival differences between C9(+) and NT mice in the JHU and HU cohorts at 52 weeks may be related to the relatively small number of NT controls in JHU (n=22) and the HU (n=20) studies compared to the other studies (UF Liu n=50 NT; URMC n=34 NT; UF Nguyen n=43 NT; UF Pattamatta n=32; NT; UBern n=36 NT). Power analyses calculated to detect a 20% difference in survival in C9(+) vs NT littermates based on a 20% standard deviation is estimated to require 33 animals per group (Faul et al., 2007; Liu et al., 2016). It is also notable that the rates of death in the NT animals in the JHU cohort were unexpectedly high at 27% by 1 year (n=22) compared to similar studies not involving stressful i.p. injections that were done by Liu (8.0 %, n=50) and Pattamatta (6.25%, n=32) at UF, and in the UBern cohort (8%, n=36).
Methodological differences may explain weight loss, grip strength and open field discrepancies
Weight Loss:
In contrast to Liu and colleagues, Mordes et al. (Mordes et al., 2020) did not detect weight loss, grip strength, or open-field abnormalities. Here we want to stress that Liu and colleagues reported these phenotypes only in overtly sick, acutely affected C9-BAC animals. For example, the weight loss graphs presented in Figure 3C of the previously published Liu et al. study, showed rapid weight loss over a period of a day or two in individual mice (Liu et al., 2016). To catch these phenotypes, animals were weighed weekly and animals that showed decreases in weight of 10% or more were then weighed daily. Typically, the weight and the health of these individual animals rapidly declined, consistent with decreased food and water intake. Weight loss in individual animals is a consistent feature of this model that has been found in multiple UF mouse cohorts including animals used in the recent Nguyen et al. paper (Nguyen et al., 2020). Similar to Liu et al., data from individual acutely affected C9(+) animals in the Nguyen et al. study showed weight loss phenotypes (Figure 2A) that were not detectable when looking at average weights of larger cohorts of mice (Figure 2B). Of the four NT mice that died in the control cohort in the published Nguyen et al. (2020) study (Nguyen et al., 2020), none of the animals showed significant weight loss and only one animal had a seizure prior to its death. Similarly, significant weight loss is found in a subset of C9(+) females (n=11) with acute fast progressing disease compared to NT littermates in the UBern cohort (Figure 2C). More frequent weighing of individual animals in the JHU cohort may have allowed the detection of weight loss phenotypes in individual animals. We did notice, however, that in the JHU data set, a dip in the average weight of the cohort of C9(+) female mice is evident at 29 and 45 weeks, which coincides with drops in the survival curves at these times. If additional data are available, it would be interesting to know if individual mice that died in the HU or JHU studies showed weight-loss phenotypes prior to death, similar to those found in the Liu et al. and Nguyen et al. studies.
Figure 3. Clasping and hanging wire phenotypes show progressive weakness precedes death in C9-BAC mice from the UBern cohort.

(A) Representative images showing the scoring criteria of the clasping phenotypes. (B-E) Graphical depiction of clasping scores and survival phenotypes from 5–17 weeks in acute C9(+) females (B); 9–60 weeks in NT males and females (C), slowly progressive C9(+) females (D) and slowly progressive C9(+) males (E). (F) Hanging wire data show latency to first fall (top) and number of falls (bottom) at 21.4 weeks (P150) in slowly progressive C9(+) mice and NT controls, n=10 animals per genotype. Statistical comparisons were performed using two-tailed unpaired t-test, *** p < 0.001, **** p < 0.0001. (See also Supplementary Movies 1 and 2).
Figure 2: Weight loss phenotypes detected in acutely affected C9(+) mice at UBern and UF.

(A) Examples of rapid weight loss in three acutely affected C9(+) female mice from the Nguyen et al. study. (B) Average weights of NT (n=41–50) and C9(+) (n=27–43) mice from the Nguyen study. (C) Average weights of NT (n=10) and C9(+) acute female mice (n=11) from UBern. Statistical comparisons were performed by t-test, * p < 0.05.
Grip strength:
Mordes et al. also failed to detect grip strength abnormalities in the HU and JHU mouse cohorts (Mordes et al., 2020). Similar to the weight-loss phenotypes, grip strength abnormalities reported by Liu et al. (Liu et al., 2016) were found in acutely affected C9(+) overtly sick mice but not in cohorts of asymptomatic C9(+) animals (Figure 2D of Liu et al.). Therefore, testing large cohorts of mice as was done by Mordes and colleagues would be unlikely to allow detection of grip strength phenotypes.
Open Field:
Mordes et al. (Mordes et al., 2020) also reported a lack of significant open field phenotypes. Avoidance of the center portion of an open field chamber is used to indicate anxiety-like behavior. Liu et al. reported significantly reduced center times in Acute C9(+) mice compared to NT littermates (Figure 3G of Liu et al.) (Liu et al., 2016). Our additional experience is that open field testing can also detect significant differences between C9(+) and NT littermates in relatively large cohorts of randomly selected female mice but larger cohorts of mice are needed (~20–30 animals per group). Mordes et al. showed trends toward reduced center time and total distance at 48 weeks of age when comparing a small group of C9(+) mice (n = 7) with NT mice (n = 14), but the number of animals used for these studies is likely too small. It is puzzling that the open field data set reported by Mordes et al. shows several NT mice that did not move at all. We have not observed a complete lack of movement in our NT animals, suggesting that there may be some biological or technical differences between our experiments from those reported by Mordes et al..
In summary, our experience is that open field phenotypes can be detected in both acutely affected female C9(+) mice and also in larger cohorts of randomly selected female mice. Methodology, cohort size, and sex differences may have prevented the detection of these phenotypes in the Mordes et al. study.
Weakness and muscle phenotypes in male and female C9(+) mice from the UBern cohort on Janvier FVB/N background
Clasping and hanging wire indicate weakness in C9(+) animals:
Consistent with Liu et al., in the UBern cohort we also observe a severe clasping phenotype indicative of hindlimb weakness in C9(+) mice compared to NT controls (Figure 3, Supplementary Movie 1). These clasping phenotypes, which precede death, occurred earlier in a subset of rapidly progressing females that died between 12–17 weeks (Figure 3A–B). In contrast, no clasping phenotypes and no death was detected in NT controls by 17 weeks (Figure 3C). Among the slowly progressing C9(+) animals, both male and female mice showed progressively worsening clasping phenotypes and all of the animals in both groups were dead by 60 weeks (Figure 3D, E). In contrast, the NT cohort showed only mild clasping phenotypes and only 3/36 NT animals died by 60 weeks. Similar to the study by Liu et al., in the UBern cohort most of the acutely affected C9(+) female mice (10/11) were found dead in their cages with only one of 11 animals euthanized because it had reached clinical endpoint by 17 weeks (Supplemental Figure 1A). In contrast, most of the slowly progressive animals were euthanized because they had reached humane endpoints (Supplemental Figure 1B, Supplemental Tables 1 and 2). Additional signs of weakness in the UBern cohort are evident in the results from the hanging wire test, with significant differences in both the latency to fall and in the average number of falls in C9(+) versus NT animals at P150 (~21 weeks) (Figure 3F).
Data generated from mice in the UBern cohort showing clasping and hanging wire phenotypes further highlights the weakness and the behavioral differences between the C9(+) mice compared to NT controls. These data also confirm previous findings that a subset of female C9(+) mice develop a more rapidly progressing disease. Additionally, these data show that slowly progressive weakness and decreased survival phenotypes are found in both male and female C9(+) mice but not NT controls in the Saxena cohort, which are on the Janvier FVB/N background.
Pathological changes in C9-BAC mice
Mordes and co-workers also failed to detect neuronal loss in their C9(+) animals, but again small cohort sizes selected by Mordes et al. focusing on the hippocampus and frontal cortex, make the comparisons to the Liu et al study challenging and difficult to interpret. Hippocampal and motor cortex phenotypes reported by Liu et al. focused on acutely affected C9–500 animals that were overtly sick (Liu et al., 2016). The extensive neuronal loss found in layers II/III and layer V of the motor cortex of acute end-stage C9-BAC versus NT animals was highly statistically significant (p-values < 0.0001), indicating that FVB background alone did not account for these pathological changes. Consistent with this result, C9-BAC mice in the UBern cohort showed decreased numbers of NeuN(+) cells in layers II/III and V of the motor cortex (Figure 4A) in cohorts of near end stage animals at P280 (40 weeks). Mice from the UBern cohort also showed a reduction in the number of NeuN(+) cells in the prefrontal cortex of C9(+) mice, demonstrating neurodegeneration across multiple brain regions compared to NT controls (Figure 4B).
Figure 4. Neuronal loss in C9-BAC mice from the UBern and URMC cohorts.

(A,B) IHC staining of NeuN in motor cortex (A) and prefrontal cortex (B) of C9(+) and NT animals from UBern. n=3 females per genotype. Scale bar = 100μm. (C) ChAT staining of lumbar spinal cord of C9(+) and NT UBern animals, n=10 to 12 sections from 3 animals per genotype. Scale bar = 150μm. (D) NeuN staining of hippocampus of acutely affected or asymptomatic C9(+) or NT URMC females at ~20 weeks. Dim circles are an artifact of the 4x objective. Areas of neuronal loss highlighted with yellow arrows. Scale bar =180μm. Data presented as mean ± SEM, with unpaired t-test, * p<0.05, ** p<0.01, *** p<0.001, **** p < 0.0001.
In addition to the robust pathological changes found in acutely affected C9-BAC animals, both the Liu et al. and the Nguyen et al. studies (Liu et al., 2016; Nguyen et al., 2020), as well as data from the UBern cohort (Figure 4C), showed a significant loss of ChAT-positive motor neurons in the lumbar spinal cord in C9(+) vs. NT animals. Additionally, Nguyen et al. showed that loss of ChAT(+) spinal motor neurons and neurons in the posterior horn of the lumbar spinal cord are robust phenotypes that can be used to test drug efficacy in preclinical studies (Nguyen et al., 2020). Specifically, Nguyen et al. demonstrated that loss of ChAT(+) spinal motor neurons in the lumbar spinal cord and NeuN+ neurons in the posterior horn of the spinal cord in randomly selected cohorts of repeat length matched C9-BAC mice can be prevented by targeting GA proteins with a human-derived C9 antibody (Nguyen et al., 2020). Variable patterns of hippocampal neurodegeneration were also seen in acute end-stage C9-BAC mice in both Liu et al. (see Figure 5C and S6D of Liu et al.) and in the URMC cohort (Figure 4D).
On the skeletal muscle side, Liu et al. described denervation of the neuromuscular junctions (Liu et al., 2016) in C9(+) females with either rapid or slowly progressive disease. In the UBern cohort, hematoxylin and eosin (H&E) staining of the gastrocnemius muscle shows variations in fiber size and groups of angular fibers indicative of muscle fiber degeneration and denervation in C9(+) but not NT mice at 32 weeks of age (Figure 5A). Additionally, nicotinamide adenine dinucleotide (NADH) staining of C9(+) mice shows strong staining of angular fibers in the C9(+) animals, indicating mitochondrial or sarcoplasmic reticulum abnormalities (Figure 5B). The muscle atrophy seen in these mice is consistent with the sedentary behavior and immobility of the C9(+) animals (Supplementary Movie 2).
Figure 5. Pathology in lateral gastrocnemius muscle demonstrates C9-related phenotype.

(A) H&E staining of the lateral gastrocnemius muscle in 32-week old NT and C9(+) mice from the UBern. Black arrows indicate angular and grouped fibers. Scale bar =200μm (left), 100μm (right). White arrow indicates muscle fiber with central nucleus. n=3 NT, 4 C9(+). (B) NADH staining of gastrocnemius muscle at 32 weeks in NT and C9(+) animals. Red arrows indicate strongly reacting angular fibers (dark staining). Scale bar =200μm left; 50μm right. n=2 animals/genotype.
In addition to the neuronal loss phenotypes, Liu et al. reported neuroinflammation including increased GFAP and Iba1 staining in C9(+) mouse brains. Similar increases in GFAP and Iba1 staining were found in C9(+) animals in both the Nguyen et al. (Nguyen et al., 2020) and UBern cohorts (Figure 6A–B). These data combined with data showing denervation of neuromuscular junctions in the tibialis anterior and diaphragm muscles and decreased numbers of large axons in the spinal ventral roots (Liu et al., 2016) provide further evidence that C9-BAC mice develop a wide range of ALS-relevant neurodegenerative phenotypes (Table 2).
Figure 6. Neuroinflammation in slowly progressive C9-BAC mice from the UBern cohort.

(A) GFAP staining of motor cortex and hippocampus at P170 (~24 weeks) in slowly progressive C9(+) mice compared to NT littermates. (B) Iba1 staining and quantitative analysis at P170 (~24 weeks) in C9(+) vs NT animals. n=3 animals/group. Statistical comparisons were performed using two-tailed unpaired t-test, *** p < 0.001, **** p < 0.0001.
Table 2.
Phenotypes detected in acutely affected mice from Liu et al. and a large cohort of mice from Nguyen et al..
| Study | Liu et al. 2016 | Nguyen et al. 2020 | |
|---|---|---|---|
| Generation number | III-V | VII-IX | |
| Characterized mice | Acute /symptomatic | Large cohort study | |
| Animal death | NT | 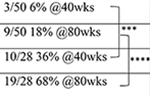 |
 |
| C9-500 | |||
| Weight loss of individual mice | Yes | Yes | |
| NMJ denervation | Yes | ND | |
| Inflammation in motor cortex | GFAP | Yes | Yes |
| Iba1 | Yes | ND | |
| Spinal cord degeneration | Motor neurons | Yes | Yes |
| Posterior horn neurons | Yes | Yes | |
| Ventral root axons | Yes | ND | |
| Hippocampal neuron loss | Yes | ND | |
| Cortical neuron loss | Layer II/III | Yes | ND |
| Layer V | Yes | ND | |
| RNA foci | Yes | Yes | |
| RAN proteins | Yes | Yes | |
| DigiGait | Yes | Yes | |
| Open Field | Yes (Male & female) | Yes (Female only) | |
ND, not done; Statistical analyses was done with Log-rank (Mantel-Cox) test to compare survival differences between NT and C9 groups, at indicated time points.
P<0.001
P<0.0001.
In summary, highly significant differences in the neurodegenerative and neuroinflammatory changes have been found between C9(+) and NT controls in multiple studies performed at the University of Florida, the University of Rochester and the University of Bern. These data demonstrate that pathological changes found in C9-BAC mice are detected by independent investigators at multiple institutions. The further demonstration that targeting GA RAN proteins, a product of the C9orf72 expansion mutation, with the human α-GA1 antibody improved survival and prevented motor neuron loss strongly argues that the survival and neurodegenerative phenotypes in the C9-BAC mice are caused by RAN proteins and not the FVB background (Nguyen et al., 2020). Finally, while some of the neurodegenerative phenotypes, including the severe cortical and hippocampal changes reported by Liu et al. (Liu et al., 2016), were found only in acutely affected end-stage C9-BAC animals, other phenotypes, including increased GFAP staining in the motor cortex and motor neuron loss in the lumbar spinal cord, have been reproducibly detected in randomly selected cohorts of C9-BAC mice. In summary C9-BAC mice present both molecular, behavioral and neurodegenerative ALS/FTD relevant phenotypes (Table 2).
Phenotypes detectable in cohorts of C9 vs. NT littermates
Similar to the human disease, the phenotypes in the C9 BAC mice are variable. Neurodegenerative changes, weakness, and other phenotypes are easier to detect when an animal reaches endpoint, i.e. animals with acute disease. Nevertheless, cohorts of mice rather than just acutely ill individual mice are required for pre-clinical studies. The recent study published by Nguyen et al. successfully used large cohorts of mice to test the effects of anti-RAN antibodies in this model. Phenotypes that were robustly detected in cohorts of C9-BAC mice compared to littermate controls included DigiGait abnormalities, open field abnormalities, motor neuron loss, interneuron loss in the lumbar spinal cord, increased GFAP staining of layer II/III in the motor cortex, RNA foci, and RAN protein accumulation (Nguyen et al., 2020). Treatment with the α-GA1 antibody improved each of these phenotypes and also improved survival. These data indicate that targeting GA RAN proteins mitigates disease and that the phenotypes that were improved by α-GA1 treatment were directly caused by the C9orf72 expansion mutation and did not result from deficits in the FVB background.
Severe seizures and increased death in a recent cohort at UF
As proposed by Mordes et al., (Mordes et al., 2020) a possible explanation for differences in survival of the C9-BAC vs. NT mice housed at HU and JHU compared to Liu et al. may be the presence of FVB lethal epileptic syndrome (FLES), otherwise referred to as “Space cadet” syndrome (Hennemann, 2007; Kohnken and Schwahn, 2016; Mahler et al., 1996; Rosenbaum et al., 2007; Shoieb et al., 2014; Ward et al., 2000). While occasional seizures occurred in NT FVB mice as reported in the initial study by Liu and colleagues, the presence of seizures did not interfere with the detection of clear phenotypic differences in behavior, neuropathology, and survival between C9-BAC mice and their NT littermates (Liu et al., 2016). Similar findings with clear phenotypic differences between C9-BAC mice and their NT littermates have also been seen in several other studies that have been published or are described here: Nguyen et al. (Nguyen et al., 2020), Pattamatta et al. (Pattamatta et al., 2020) and the URMC and UBern mouse cohorts. In general, C9-BAC mice bred at UF through generation IX, which included the Nguyen and Pattamatta studies, had phenotypes similar to those described by Liu et al. (Liu et al., 2016; Nguyen et al., 2020; Pattamatta et al., 2020). In contrast, in a separate large cohort of C9 mice from generations X-XII bred to FVB/NJ dams in 2018 (Generation 10–12 study [G10–12]), we observed dramatic increases in the frequency and severity of seizures and increased death. For example, in the G10–12 study NT animals died at a much higher frequency 46% (43/94) compared to the Nguyen study at 20 weeks in which 9.3% (4/43) of the NT animals died. The G10–12 and Nguyen studies were similar because both cohorts were bred and housed in the same animal room and both cohorts underwent weekly weighing and i.p. injections. A striking phenotypic difference between these cohorts was the increased severity and frequency of severe seizures, which likely led to the higher rates of death in NT animals in the G10–12 study. Animals that suffered seizures lasting more than 2 minutes were euthanized, and many additional animals had to be sacrificed after suffering seizures from which they were unable to recover. The majority of deaths in the NT group were sudden and animals that appeared otherwise healthy were found dead overnight often with dried saliva or blood on the ventral neck. These phenotypes have been reported by other groups and attributed to probable seizures (Mahler et al., 1996; Schauwecker et al., 2004). The C9(+) animals also died earlier and at a higher rate than in previous studies with 36% of the C9(+) animals dead by 20 weeks compared to 28% in the Nguyen study. Because the death rates in the NT controls were abnormally high in this study, it is not clear whether deaths among the C9(+) animals were caused by ALS/FTD-related disease or from a separate, independently segregating seizure phenotype unrelated to the C9-BAC transgene in the G10–12 cohort.
The severe seizure phenotypes and high NT death rates in the G10–12 study were not seen in our colony prior to generation X, raising the possibility that a genetic mutation unlinked to the C9-BAC integration site caused these phenotypes. Twenty-two C9(+) male breeders used in the G10–12 cohort were from six different sub-lineages in our colony, and progeny from all six sub-lineages had sudden increases in death. This suggests that a mutation causing the increased death was introduced into our colony through FVB/NJ female breeders. Consistent with this idea, the group of JAX FVB/NJ breeders used to generate the G10–12 cohort were uncharacteristically aggressive toward the C9(+) males, with 16 of the 22 male breeders having to be removed or exchanged during breeding because they had been injured by the females. In contrast, in the Nguyen and Pattamatta studies, no similar aggression was observed by the dams and none of the 11 male breeders used needed to be replaced. It is possible that these recent lethal phenotypes have also affected additional studies performed outside of UF and may explain the higher than expected death rates of NT animals in the JHU cohort (27% by 1 year of age). While we understand that JAX has a breeding scheme in which they try to prevent genetic drift, the increased aggression seen in the breeders combined with increased seizures and death in both the NT and C9(+) progeny suggests that a genetic mutation that brings out these FLES-like phenotypes was present at a higher frequency in the JAX breeders that were ordered for the G10–12 study. Consistent with this possibility, for the UBern cohort, C9–500 mice that were obtained from JAX but bred to Janvier FVB dams, showed death rates of NT animals that were similar to the Liu and Pattamatta studies before the severe seizure problem arose (Table 1). Possible genetic and environmental causes for the increased death of NT animals in the G10–12 study are being investigated.
Breeding, handling and characterizing FVB C9-BAC mice
Here we summarize a number of robust ALS/FTD phenotypes that can be detected in cohorts of mice and are useful for preclinical testing (Table 2). For these studies it is critical that C9 repeat lengths are matched for all treatment comparisons. Below we highlight factors we think minimize experimental variations across laboratories and that we believe are critical for successful experiments using the C9–500 mice (FVB/NJ-Tg(C9orf72)500Lpwr/J).
Breeding.
To establish large cohorts of mice we use C9(+) male mice that are less than 6 months old with repeat sizes ≥ 500 repeats for breeding. The repeat size of individual breeders is determined using Southern and/or PCR-based methods (Cleary et al., 2016) on genomic DNA from mouse tails. Animals used for breeding have clean bands predicting repeat sizes ≥ 500 with no additional bands or smears that would indicate somatic mosaicism. At ~8 weeks of age, female FVB mice ordered from JAX or Janvier labs are used to mate with C9(+) male breeders after a 1–2-week acclimatization period. If a large number of mice are required for the study, two female FVB mice can be bred with one C9(+) BAC male mouse for 3–4 days; thus, a single male mouse may mate with up to 4 female mice per week. Individual pups are genotyped and checked for repeat length after weaning. The colony at UF is maintained by crossing C9(+) male mice to FVB/NJ dams ordered from JAX, or similarly to Janvier FVB mice at UBern, to minimize the potential risk of genetic drift within the cohort.
Repeat size.
Both somatic and intergenerational repeat length instability are observed in C9orf72 ALS/FTD patients and in the C9-BAC mice. We have observed differences in repeat size between breeders and their pups. Thus, for studies that include multiple treatment groups, repeat size should be strictly controlled among groups. Repeat size is determined for every mouse included in the study and repeat size-matched littermates are equally distributed into treatment groups and different treatment groups include similar numbers of animals from each sire. Mice included in efficacy studies have repeat lengths greater than or equal to 500 repeats, while those with shorter repeats or more than one band-indicating somatic mosaicism-are excluded. Sizing of repeat lengths was initially done by Southern blotting as described by Liu et al. (Liu et al., 2016) and Nguyen et al. (Nguyen et al., 2020), and more recently by long range PCR using a protocol similar to that reported by Cleary et al., 2016 (Cleary et al., 2016) for animals in the G10–12 and UBern cohorts (Supplementary Figure 2).
Sex.
As shown by Liu et al., disease phenotypes are more robust in female mice compared to male mice (Liu et al., 2016). Thus, studies using this model should be controlled for sex. While only female mice were included in the studies done at UF and URMC, male mice also showed phenotypes (Liu et al., 2016) and it is possible that both male and female mice have additional uncharacterized disease phenotypes. In the study done at UBern, a subset of female mice showed acute rapidly progressive phenotypes. Additionally, slow progressing male and female mice both showed robust survival, clasping, and hanging wire phenotypes as well as neurodegenerative changes. The apparent increase in disease penetrance in the C9(+) mice in the UBern cohort may be caused by variations in repeat length or differences that resulted from breeding the C9(+) mice to FVB mice obtained from Janvier Laboratories.
Cohort size.
Projected animal numbers needed for efficacy or survival studies are calculated using G Power analysis software to determine the number of animals needed to detect a 20% difference in survival at a significance level of 0.05. We typically include ~40 mice per group, so breeders are set up based on the number of groups and total animals needed, and additional animals if a mid-study takedown is required. Breeding typically requires ~20% more C9-BAC animals to allow for repeat length matching and removal of animals that have undergone repeat contractions or have somatic instability.
Number of animals used in behavioral tests.
Gait deficits detected using DigiGait analysis have been consistently seen in the Ranum lab (Table 2). Gait abnormalities can be detected at 16 weeks of age before overt symptoms of disease occur but are more robust at 24 weeks of age. For treatment studies we assign mice with the same repeat sizes to various groups (e.g. groups 1–50, referred to as size-matched groups). Animals among the size-matched groups are randomly selected for mid-study take-downs, DigiGait, and open field studies before drug administration begins and before phenotypes are evident. Because low penetrance and variable disease onset have been observed in this model, relatively large number of animals per treatment group are used for DigiGait testing (~15–20 mice/group), open field testing (~20–30), or mid-study sacrifice for molecular and histological analyses (7–8 mice) to increase the likelihood of detecting differences among treatment groups. Study groups always include cohorts of C9(+) and NT mice receiving mock treatments.
Animal health check.
Mice are checked daily by lab members and animal care staff before they are ~14 weeks old and twice daily after ~14 weeks or as soon as any phenotypic signs are observed. At approximately 32 weeks (UF) and 24 weeks (UBern), mice are scored based on their behavior according to the scoring criteria described in Supplemental Tables 1 and 2. Animals with cumulative scores of greater than 11, or individual scores of 3 in any particular parameter, such as >20% body weight loss, are determined to have reached a humane endpoint and are euthanized for molecular and pathological analyses. Further, during weekly weighing of animals in a cohort, the weight loss from week to week is calculated and any animal that has lost more than 10% body weight is closely monitored and more than 20% body weight is sacrificed.
Conclusions
We describe a number of methodological differences in the way that Mordes and colleagues characterized weight loss, grip strength, and open field phenotypes in their C9–500 BAC cohorts that likely prevented them from detecting phenotypes that were previously described and reported in acutely ill mice (Liu et al., 2016). Here we show independent cohorts of mice generated at the University of Rochester Medical Center and the University of Bern also show decreased survival and other ALS/FTD-relevant phenotypes in C9(+) vs NT littermates. These data combined with the increased survival and improved behavior and motor neuron loss phenotypes in response to antibody treatment in the Nguyen et al. study independently demonstrate that these phenotypes are caused by the C9orf72 expansion mutation and not by FVB strain phenotypes. Additional data from UF show that survival phenotypes are variable, which can be influenced by handling and may also be affected by other environmental factors. We provide additional details on generating and characterizing cohorts of C9–500 mice for preclinical studies. While consistent phenotypes have been observed in more than six independent cohorts of mice bred at UF, UBern and URMC, recent increases in seizures and death in both C9(+) animals and their NT littermates at UF suggest that an independently segregating FLES gene may mask C9 ALS/FTD phenotypes. If a genetic mutation leading to increased FLES phenotypes came from JAX lab breeders it may affect studies at multiple institutions.
While the reduced penetrance found in the C9–500 mice requires the analysis of larger groups of mice compared to many overexpression models, this feature is valuable because it recapitulates the reduced penetrance in C9orf72 families (Galimberti et al., 2014; Majounie et al., 2012). Expression of the C9orf72 mutation in the context of the endogenous human sense and antisense promoters is also advantageous compared to models that ectopically overexpress the repeat expansion or individual RAN proteins as it provides an opportunity to understand the complex biology of the disease and to test therapeutic strategies in a translationally relevant mouse model that simultaneously expresses two expansion RNAs and multiple RAN proteins. Finally, we hope that this Matters Arising response helps clarify some of the differences between the Mordes et al. and Liu et al. studies. We also hope that our response will help the scientific community fully utilize this C9-BAC transgenic model and welcome future collaborations to facilitate successful studies across the scientific community.
STAR Methods
Resource Availability
Lead Contact
Further information and requests for resources and reagents should be directed to and will be fulfilled by the Lead Contact, Dr. Laura Ranum (ranum@ufl.edu).
Materials Availability
This study did not generate new unique reagents.
Data and Code Availability
The published article includes all datasets generated or analyzed during this study.
Experimental Model and Subject Details
Animals
University of Florida
All studies were approved by the Institutional Animal Care and Use Committee at the University of Florida. C9-BAC mice (Liu et al., 2016) were maintained in-house and bred with wildtype FVB mice (Jackson Laboratory; RRID: IMSR_JAX:001800).
University of Rochester
All studies were approved by the Institutional Animal Care and Use Committee at the University of Rochester. C9–500 mice were obtained from JAX (Jackson Laboratory; RRID: IMSR_JAX:029099).
University of Bern
Animal care, housing (IVC cages), ethical usage and procedures were in accordance with the
Swiss Veterinary Law guidelines and study was approved by the animal commission of Canton Bern. C9–500 mice were obtained from JAX (Jackson Laboratory; RRID: IMSR_JAX:029099) and bred with wildtype FVB-N female mice obtained from Janvier Labs.
Animal housing
Male and female mice were separately housed. At the University of Florida, no special bedding or dividers were used but C9(+) and NT males on the FVB/NJ background from different litters were co-housed at weaning and C9(+) and NT males that fight are separated. At the University of Bern, male mice show heightened aggressive behavior towards each other when maturity is reached, and therefore not more than 3–4 males are housed together. Besides the usual mouse-housing toys, further enrichment for their housing consists of carton dividers (mice can access the entire cage) that are placed at the time of the weaning inside the cage together with a hemp rope (Swiss Mamutec). If males must be singly housed because of fighting issues, then hemp rope, a carton roll and additional nesting material is added inside the cage. For females, the cage is set with a hemp rope and a carton roll in order to provide a consistent environment.
Method Details
Immunohistochemistry
NeuN and ChAT Staining – University of Bern
Mice were transcardially perfused with 4% paraformaldehyde (PFA) in 1X phosphate buffered saline (PBS); spinal cord, brain, and cerebellum were isolated and kept overnight at 4°C in the same fixative solution, followed by cryoprotection in 30% sucrose/PBS until use. For immunohistochemistry staining of NeuN and ChAT positive neurons, 30 μm free floating brain or 50 μm spinal cord section were cut using a cryostat. Exclusively for ChAT staining, heat-mediated antigen retrieval was performed using 10mM Sodium Citrate buffer, pH6. The endogenous peroxidases were inactivated in 0.3% hydrogen peroxide, followed by 1-hour blocking step in PBS solution containing 0.05% Triton X-100 and 10% normal donkey serum (Jackson ImmunoResearch). The sections were incubated overnight with primary antibody (mouse anti-NeuN, Millipore Sigma; goat anti-ChAT, Millipore Sigma) at 4°C in the same blocking solution. Sections were washed in PBS and appropriate secondary antibody was applied for 1 hour at room temperature. The sections were then incubated for 1 hour with Avidin-biotin complex (ABC HRP Kit, Vector Laboratories) solution, washed 3 times for 10 minutes with PBS before the 3’-Diaminobenzidine (DAB) reaction (Millipore Sigma). The glass slides were dehydrated via ascending concentration of ethanol and cover slipped. Images were acquired using an Olympus microscope (BX51). Neurons from primary motor cortex, medial prefrontal cortex, and lumbar spinal cord were manually counted using the cell counter plugin of Fiji software in ImageJ. Statistical analyses were performed using GraphPad Prism 6, with p<0.05 considered statistically significant.
NeuN Staining – University of Rochester
Age-matched littermate mice were anesthetized with ketamine/xylazine (100mg/kg and 10mg/kg, respectively), then intracardially perfused with PBS containing ethylenediaminetetraacetic acid (EDTA, 1.5mg/ml) (Millipore Sigma), then 4% PFA. The brains were then post-fixed in 4% PFA for 1 day under gentle rocking at room temperature and were stored in 1X PBS at 4°C until sectioning. Brains were coronally sectioned at 40 μm thickness using a vibratome (Leica V1000) and stored in cryoprotectant solution of 30% PEG300 (Millipore Sigma), 20% 0.1M phosphate buffer, 30% glycerol (Millipore Sigma), and 20% dH2O at −20°C. Sections were then washed 3 times in 1X PBS for 30 minutes each and incubated in 1X PBS with 100mM glycine for 30 minutes. Sections were washed 3 times in 1X PBS for 5–15 minutes, followed by incubation in citrate antigen unmasking solution (Vector Laboratories) with 0.05% Tween at 37°C for 30 minutes. Sections were then washed 3 times in 1X PBS for 5–15 minutes before incubation in primary antibody (mouse anti-NeuN, Millipore Sigma) in goat blocking solution of 3% BSA (Millipore Sigma), 1.5% normal goat serum (Vector Laboratories), and 0.5% Triton X-100 (Promega) in 1X PBS with 1.8% NaCl at room temperature for 72 hours. Sections were then washed 3 times in 1X PBS with 1.8% NaCl before incubation in secondary antibody (goat anti-mouse IgG 647, Invitrogen) in the same goat blocking solution overnight at room temperature. Sections were washed 3 times in 1X PBS with 1.8% NaCl before mounting onto glass slides. Slides were allowed to dry before being coverslipped with ProLong Diamond Antifade Mounting Media with DAPI (Invitrogen). Images were acquired using a Hamamatsu ORCA-ER camera on an Olympus BX-51 upright microscope using the Quitopic Optigrid hardware. The Hamamatsu ORCA-ER camera was operated with Volocity 6.3 (PerkinElmer & Quorum Technologies). Light intensity and exposure were controlled for all images acquired.
Iba1 and GFAP Staining
Thirty micrometer cryosections of brain were obtained and incubated with primary antibody (rabbit anti-Iba1, Fujifilm/Wako; anti-GFAP, Abcam), followed by incubation with biotinylated secondary antibodies (1:200, Vector Laboratories). Antibodies were combined with standard ABC reagents (Vectastain Elite ABC kit, Vector Laboratories) and the signal was visualized with 3,3’-diaminobenzidine (DAB). The areas of Iba1 and GFAP distribution in the brain were determined by measuring the area of immunopositive staining in square millimeters in every sixth brain section.
Muscle Staining
Animals were deeply anesthetized with isoflurane and decapitated before the gastrocnemius muscles were dissected. Muscles were embedded in OCT compound (Fisher Scientific) and placed on dry ice. Sections were cut at 14μm on a cryostat and placed directly onto coverslips. For hematoxylin & eosin (H&E) staining, muscle sections were stained with hematoxylin for 5 minutes, followed by three 10-minute washes in deionized H2O. Muscles were then placed in eosin G for 1 minute, then rinsed in 70% ethanol. The tissue was then dehydrated in a series of ethanol washes (70%, 95%, 100%), rinsed in xylene, then mounted on a glass slide. NADH staining was performed by incubating muscle sections in 0.2M Tris buffer containing Nitrotetrazolium Blue (Sigma) and β-nicotinamide adenine dinucleotide (NADH, Sigma) for 30 minutes at 37°C. Following three washes in deionized H2O, coverslips were mounted onto a glass slide and imaged using an Olympus microscope (BX-51).
Hanging Wire Test
The animals were placed on a cage top that is suspended on top of the home cage. When the animal is stable, the cage top is inverted and the latency of the first fall is recorded. The animal is placed on the inverted cage top each time it falls within a time window of 120 seconds (maximum duration of test) to assess the average number of falls.
Hindlimb clasping assay
Hindlimb clasping analysis was adapted from (Gennarino et al., 2015). The tails of the mice were grasped from the base and the mice were lifted for 20 seconds. The position needs to be maintained for 20 seconds and failure to do so results in the termination of the test. If both hindlimbs are consistently splayed outward, away from the abdomen it is assigned a score of “0”. If only one of the hindlimbs is retracted near the abdomen for the majority of the time, the score assigned is “1”. If both hindlimbs are retracted close to the abdomen, the animal receives a score of “2”. Finally, close to end stage animals that show both hindlimbs tightly clinched to the abdomen when they are lifted are assigned a score of “3”.
Long-Range PCR
To quantify the total number of G4C2 repeats in each animal, long-range PCR (LR-PCR) was performed on C9(+) mice as described by Cleary et al. 2016 (Cleary et al., 2016) with minor modifications including the use of unlabeled primers, the detection of LR-PCR products by ethidium bromide after gel electrophoresis, the use of AccuPrime Pfx DNA polymerase and PCRx buffer. Flanking PCR primer sequences used were as described for F3: 5’- AGC AAG CTC TGG AAC TCA GGA GTC G −3’ and R6: 5’- CCT CAC TCA CCC ACT CGC CAC −3’ but were unlabeled. PCR was performed for 30 cycles at: 95°C for 45”, 98°C for 10”; 58°C for 30” and 78°C 6 min with a slow ramp of 0.6°C/second. The amplicon produced by this reaction is 158bp for a non-expanded allele that contains three G4C2 repeats or 140 bp with no repeats. The length of the G4C2 repeat expansions in C9(+) animals is calculated by subtracting 140bp (flanking sequence) from the length of the PCR product and dividing by six.
Quantification and Statistical Analyses
The number of animals and biological replicates, as well as measurement values (e.g. mean, median, standard deviation, standard error of the mean [SEM]) can be found in figures and/or figure legends. GraphPad Prism 8 was used to perform statistical analyses, with p<0.05 considered statistically significant. Survival curves for the different studies were generated in GraphPad using the Kaplan-Meier method and statistical significance was assessed using the Log Mantel-Cox test.
Supplementary Material
Supplementary Movie 1. Example of clasping phenotype in C9(+) mouse from the University of Bern cohort. Representative video showing C9(+) mouse (7 mo) with hind-limb clasping abnormalities compared to NT (6 mo) control. (Related to Figure 3).
Supplementary Movie 2. Cage behavior of animals from the University of Bern cohort. Representative videos showing male and female C9(+) animals and NT controls from the UBern cohort at 8 months of age. (Related to Figure 3 and Table 1).
KEY RESOURCES TABLE.
| REAGENT or RESOURCE | SOURCE | IDENTIFIER |
|---|---|---|
| Antibodies | ||
| Mouse anti-NeuN | Millipore Sigma | Cat No: MAB377 RRID: AB_2298772 |
| Goat anti-mouse IgG | Vector Laboratories | Cat No: BA-9200 RRID: AB_2336171 |
| Goat anti-ChAT | Millipore Sigma | Cat No: AB144P RRID: AB_2079751 |
| Donkey anti-goat IgG H&L | Abcam | Cat No: ab6884 RRID: AB_954842 |
| Goat anti-mouse IgG, Alexa Fluor 647 | Invitrogen | Cat No: A-21236 RRID: AB_141725 |
| Rabbit anti-Iba1 | Fujifilm/Wako | Cat No: 019-19741 RRID: AB_839504 |
| Rabbit anti-GFAP | Abcam | Cat No: ab53554 RRID: AB_880202 |
| Goat anti-rabbit IgG | Vector Laboratories | Cat No: BA-1000 RRID: AB_2313606 |
| Chemicals, Peptides, and Recombinant Proteins | ||
| Normal donkey serum | Jackson ImmunoResearch | Cat No: 017-000-121 |
| Vectastain Elite ABC HRP Kit | Vector Laboratories | Cat No: PK4000 |
| DAB (3’-diaminobenzidine) | Millipore Sigma | Cat No: D7304 |
| DAB Substrate Kit, HRP | Vector Laboratories | Cat No: Sk-4100 |
| EDTA (ethylenediaminetetraacetic acid) | Millipore Sigma | Cat No: E9884 |
| PEG300 (polyethylene glycol) | Millipore Sigma | Cat No: 8074841000 |
| Glycerol | Millipore Sigma | Cat No: G5516 |
| Citrate antigen unmasking solution | Vector Laboratories | Cat No: H3300 |
| BSA (bovine serum albumin) | Millipore Sigma | Cat No: A3294 |
| Normal goat serum | Vector Laboratories | Cat No: S-1000-20 |
| Triton X-100 | Promega | Cat No: H5141 |
| ProLong Diamond Antifade Mount with DAPI | Invitrogen | Cat No: P36962 |
| Andwin Scientific CRYO-OCT Compound | Fisher Scientific | Cat No: 14-373-65 |
| Nitroblue-Tetrazolium | Millipore Sigma | Cat No: N6876 |
| β-nicotinamide adenine dinucleotide (NADH) | Millipore Sigma | Cat No: N8129 |
| AccuPrime Pfx DNA polymerase | Fisher Scientific | Cat No: 12344-024 |
| PCRx amplification buffer | Fisher Scientific | Cat No: 11495-017 |
| Experimental Models: Organisms/Strains | ||
| Mouse, C9-BAC | (Liu et al. 2016), The Jackson Laboratory | Stock No: 029099 RRID:IMSR_JAX:029099 |
| Mouse, FVB/NJ | The Jackson Laboratory | Stock No: 001800 RRID:IMSR_JAX:001800 |
| Mouse, FVB/NRj | Janvier Laboratories | Stock No: SC-FVBN-F |
| Software and Algorithms | ||
| Prism | GraphPad | https://www.graphpad.com/ |
| Excel, 2016 | Microsoft | https://www.microsoft.com |
| ImageJ | NIH | https://imagej.nih.gov/ij/ |
Acknowledgements
Funding: We thank the National Institutes of Health (RO1 NS098819), Target ALS, the ALS Association, the Packard Center, and the Muscular Dystrophy Association for support, as well as URVentures and URMC for the Technology Development Fund to support this work. Research at UBern was supported by Swiss National Science Foundation, Swiss Foundation for Research on Muscle Diseases and European Research Council (ERC) under the European Union’s Horizon 2020 research and innovation program (grant agreement #725825). We thank Bettina Rotzetter, Inselspital University Hospital for editing the movies and Susan Elaine Ames (UF) for maintenance of the C9-500 colony.
Footnotes
Declaration of Interests
L.P.W.R., T.Z. and L.N. are inventors on patents related to RAN translation filed by the University of Florida and L.P.W.R. is a Co-Founder and Director of RanTran, Inc.
References
- Cleary EM, Pal S, Azam T, Moore DJ, Swingler R, Gorrie G, Stephenson L, Colville S, Chandran S, Porteous M, et al. (2016). Improved PCR based methods for detecting C9orf72 hexanucleotide repeat expansions. Mol Cell Probes 30, 218–224. [DOI] [PMC free article] [PubMed] [Google Scholar]
- DeJesus-Hernandez M, Mackenzie IR, Boeve BF, Boxer AL, Baker M, Rutherford NJ, Nicholson AM, Finch NA, Flynn H, Adamson J, et al. (2011). Expanded GGGGCC Hexanucleotide Repeat in Noncoding Region of C9ORF72 Causes Chromosome 9p-Linked FTD and ALS. Neuron 72, 245–256. [DOI] [PMC free article] [PubMed] [Google Scholar]
- Faul F, Erdfelder E, Lang AG, and Buchner A (2007). G*Power 3: a flexible statistical power analysis program for the social, behavioral, and biomedical sciences. Behav Res Methods 39, 175–191. [DOI] [PubMed] [Google Scholar]
- Gennarino VA, Singh RK, White JJ, De Maio A, Han K, Kim JY, Jafar-Nejad P, di Ronza A, Kang H, Sayegh LS, et al. (2015). Pumilio1 haploinsufficiency leads to SCA1-like neurodegeneration by increasing wild-type Ataxin1 levels. Cell 160, 1087–1098. [DOI] [PMC free article] [PubMed] [Google Scholar]
- Hennemann DE (2007). Diagnosis | ‘Space cadet’ sydrome of female FVB/n mice. Lab Animal 36, 16. [Google Scholar]
- Jiang J, Zhu Q, Gendron TF, Saberi S, McAlonis-Downes M, Seelman A, Stauffer JE, Jafar-Nejad P, Drenner K, Schulte D, et al. (2016). Gain of Toxicity from ALS/FTD-Linked Repeat Expansions in C9ORF72 Is Alleviated by Antisense Oligonucleotides Targeting GGGGCC-Containing RNAs. Neuron 90, 535–550. [DOI] [PMC free article] [PubMed] [Google Scholar]
- Kohnken RA, and Schwahn DJ (2016). Lack of Chronic Histologic Lesions Supportive of Sublethal Spontaneous Seizures in FVB/N Mice. Comp Med 66, 105–111. [PMC free article] [PubMed] [Google Scholar]
- Liu Y, Pattamatta A, Zu T, Reid T, Bardhi O, Borchelt DR, Yachnis AT, and Ranum LP (2016). C9orf72 BAC Mouse Model with Motor Deficits and Neurodegenerative Features of ALS/FTD. Neuron 90, 521–534. [DOI] [PubMed] [Google Scholar]
- Mahler JF, Stokes W, Mann PC, Takaoka M, and Maronpot RR (1996). Spontaneous lesions in aging FVB/N mice. Toxicol Pathol 24, 710–716. [DOI] [PubMed] [Google Scholar]
- Mordes D, Morrison BM, Ament XH, Cantrell C, Mok J, Eggan P, Xue C, Wang JY, Eggan K, and Rothstein JD (2020). Absence of survival and motor deficits in 500 repeat C9ORF72 BAC mice. Neuron (ADD CORRECT CITATION). [DOI] [PubMed] [Google Scholar]
- Nguyen L, Montrasio F, Pattamatta A, Tusi SK, Bardhi O, Meyer KD, Hayes L, Nakamura K, Banez-Coronel M, Coyne A, et al. (2020). Antibody Therapy Targeting RAN Proteins Rescues C9 ALS/FTD Phenotypes in C9orf72 Mouse Model. Neuron 105, 645–662 e611. [DOI] [PMC free article] [PubMed] [Google Scholar]
- O’Rourke JG, Bogdanik L, Muhammad AK, Gendron TF, Kim KJ, Austin A, Cady J, Liu EY, Zarrow J, Grant S, et al. (2015). C9orf72 BAC Transgenic Mice Display Typical Pathologic Features of ALS/FTD. Neuron 88, 892–901. [DOI] [PMC free article] [PubMed] [Google Scholar]
- Pattamatta A, Nguyen L, Olafson H, Scotti M, Laboissonniere LA, Richardson J, Berglund JA, Zu T, Wang ET, and Ranum LPW (2020). Repeat length increases disease penetrance and severity in C9orf72 ALS/FTD BAC transgenic mice. BioRxiv, doi: 10.1101/2020.1105.1121.107425. [DOI] [PMC free article] [PubMed] [Google Scholar]
- Peters OM, Cabrera GT, Tran H, Gendron TF, McKeon JE, Metterville J, Weiss A, Wightman N, Salameh J, Kim J, et al. (2015). Human C9ORF72 Hexanucleotide Expansion Reproduces RNA Foci and Dipeptide Repeat Proteins but Not Neurodegeneration in BAC Transgenic Mice. Neuron 88, 902–909. [DOI] [PMC free article] [PubMed] [Google Scholar]
- Renton AE, Majounie E, Waite A, Simon-Sanchez J, Rollinson S, Gibbs JR, Schymick JC, Laaksovirta H, van Swieten JC, Myllykangas L, et al. (2011). A Hexanucleotide Repeat Expansion in C9ORF72 Is the Cause of Chromosome 9p21-Linked ALS-FTD. Neuron 72, 257–268. [DOI] [PMC free article] [PubMed] [Google Scholar]
- Rosenbaum MD, VandeWoude S, and Bielefeldt-Ohmann H (2007). Sudden onset of mortality within a colony of FVB/n mice. Lab Anim (NY) 36, 15–16. [DOI] [PubMed] [Google Scholar]
- Schauwecker PE, Williams RW, and Santos JB (2004). Genetic control of sensitivity to hippocampal cell death induced by kainic acid: a quantitative trait loci analysis. J Comp Neurol 477, 96–107. [DOI] [PubMed] [Google Scholar]
- Shao Q, Liang C, Chang Q, Zhang W, Yang M, and Chen JF (2019). C9orf72 deficiency promotes motor deficits of a C9ALS/FTD mouse model in a dose-dependent manner. Acta Neuropathol Commun 7, 32. [DOI] [PMC free article] [PubMed] [Google Scholar]
- Shoieb A, Allavena R, and Ibrahim A (2014). Neuronal necrosis due to a lethal epileptic syndrome affecting FVB strain B-actin luciferase transgenic mice. Amercan Journal of Animal and Veterinary Sciences 9, 189–193. [Google Scholar]
- Ward JM, Anver MR, Mahler JF, and Devor-Henneman DE (2000). Pathology of mice commonly used in genetic engineering (C57BL/6;129; B6, 129; and FVB/N). In Pathology of Genetically Engineered Mice, Ward JM, Mahler JF, Maronpot RR, and Sundberg JP, eds. (Ames Iowa: Iowa State University Press; ), pp. 161–179. [Google Scholar]
Associated Data
This section collects any data citations, data availability statements, or supplementary materials included in this article.
Supplementary Materials
Supplementary Movie 1. Example of clasping phenotype in C9(+) mouse from the University of Bern cohort. Representative video showing C9(+) mouse (7 mo) with hind-limb clasping abnormalities compared to NT (6 mo) control. (Related to Figure 3).
Supplementary Movie 2. Cage behavior of animals from the University of Bern cohort. Representative videos showing male and female C9(+) animals and NT controls from the UBern cohort at 8 months of age. (Related to Figure 3 and Table 1).
Data Availability Statement
The published article includes all datasets generated or analyzed during this study.