

Abstract
We report results of small angle neutron scattering measurements made on sodium polystyrene sulfonate in aqueous salt solutions. The correlation length (ξ) and osmotic compressibility are measured as a function of polymer (c) and added salt (cS) concentrations, and the results are compared with scaling predictions and the random-phase approximation (RPA). In Dobrynin et al.’s scaling model the osmotic pressure consists of a counter-ion contribution and a polymer contribution. The polymer contribution is found to be two orders of magnitude smaller than expected from the scaling model, in agreement with earlier observations made on neutral polymers in good solvent condition. RPA allows the determination of single-chain dimensions in semidilute solutions at high polymer and added salt concentrations, but fails for cS ≤ 2 M. The χ parameter can be modelled as the sum of an intrinsic contribution (χ0) and an electrostatic term: χ ~ χ0 + K′/√cs , where χ0 > 0.5 is consistent with the hydrophobic nature of the backbone of NaPSS. The dependence of χelec ~ 1/√cs disagrees with the random-phase approximation (χelec ~ 1/cs), but agrees with the light scattering results in dilute solution and Dobrynin et al.’s scaling treatment of electrostatic excluded volume.
I. Introduction
The effect of counterions on the conformation and structure of polyelectrolytes in solution has attracted a great deal of interest because of its importance in many biological processes such as DNA condensation,1 protein folding2 or joint lubrication.3,4 An understanding of the mechanisms that determine the conformation of charged macromolecules is required to tailor the properties of novel functional materials, including pharma-ceutical5,6 and food products.7,8 It has been found that changes induced by monovalent salts can be described by the Poisson–Boltzmann model despite its serious limitations arising from its the mean-field nature.9–15 For example, the Boltzmann distribution does not account for the finite size of ions and the size dependent ion–ion correlations and fluctuation contribution to the ion distributions. In certain systems, specific interactions between the polymer chains and the ions may also play a significant role, which introduces further complexities that make the interpretation of the experimental results more difficult.16–20
In semidilute polymer solutions, i.e., above the overlap concentration, polymer chains interpenetrate forming networks with a concentration dependent mesh size ξ, known as the correlation length.21 The correlation length governs the thermodynamic, conformational and hydrodynamic properties of polymer solutions and gels.21–33 The concentration and solvent quality dependence of ξ in semidilute and concentrated solutions of neutral polymers has been extensively studied, and interpreted by mean-field and scaling theories.21,23–25 Polyelectrolytes in salt-free solution display markedly different behavior from those of neutral polymers.26–29 Owing to strong electrostatic repulsion along the backbone, they adopt highly extended conformations and their scattering function displays a correlation peak. Traditional liquid state theories such as the mean spherical approximation or the random approximation show limited success in describing the properties of salt-free polyelectrolytes due to the strong correlations between chains.34 More recent works by Jiang et al. and von Solms and co-workers based on the mean spherical approximation and hypernetted chain closures to the Ornstein–Zernike equations give more accurate results, but the calculation methods are rather involved and mapping analytical calculations to experimental data requires unrealistic values for the monomer volume of vinylic polyelectrolytes.35–39 PRISM theories, which have been applied extensively to polyelectrolytes by Yethiraj and co-workers give a more accurate description of the conformational and thermodynamic properties of polyelectrolytes in salt-free and excess salt solutions, and can reproduce many of their scattering properties.34,40,41
Structural and thermodynamic features of polyelectrolyte solutions have been successfully reproduced by simulations,14,15,42–50 including the concentration dependence of the scattering peak in the dilute and semidilute regimes,51,52 or the low-q upturn.47,48 Simulations by Dobrynin and co-workers are in good agreement with Dobrynin et al.’s scaling predictions for the chain size and osmotic pressure of polyelectrolyte solutions.53–57 More recently, simulations of Chang et al.58 have suggested that the polymer contribution to the osmotic pressure of polyelectrolyte solutions exceeds that expected from Dobrynin et al.’s scaling model.
A transition from highly extended rod-like conformation in salt-free solutions to expanded coils in excess salt has been observed for various systems in dilute solution.33,59–61 Studies on the scattering properties of semidilute polyelectrolyte solutions with excess added salt are sparse, with most earlier literature focusing either on single chain properties62,63 on the influence of specifically interacting multivalent counterions.64,65 It is frequently assumed that polyelectrolytes in large excess of added salt behave like neutral polymers. When the concentration of added ions is sufficiently high, the electrostatic interaction between the charged groups is largely screened, resulting in a polymer that is essentially neutral with only weak effective electrostatic interactions. Extensive studies by Norisuye and co-workers have shown that the conformational (chain size) and transport (diffusion coefficient, intrinsic viscosity) properties of polyelectrolytes in dilute solutions containing excess added salt are similar to those of neutral polymers in good solvent.66–70 The persistence length and excluded volume strength of various polyelectrolytes have been shown to decrease with increasing ionic strength.29,66–70 At sufficiently high salt concentrations, the chemical details of the chain become important, and hydrophobicity and specific ion effects lead to a decrease of the solvation of the polymer backbone. Such effects are difficult to treat theoretically.
In the present work, the small angle neutron scattering (SANS) response of sodium polystyrene sulfonate (NaPSS) solutions containing large excess of monovalent counterions has been systematically investigated in the semidilute concentration regime. NaPSS is a well-suited model polymer to investigate ion-polymer interactions, particularly the effect of sodium counterions on the electrostatic interactions and molecular conformation, because no specific interactions between NaPSS and sodium ions have been reported in aqueous solutions.
We report experimental results for the correlation length and osmotic compressibility of NaPSS solutions as a function of the added salt concentration, primarily focusing on the excess added salt-regime. It is found that the results disagree with the predictions of the scaling theory. It is also demonstrated that the behaviour of charged polymers in solutions at high salt concentrations exhibit significant differences from that of neutral polymers.
The paper is organized as follows. The theoretical section is followed by a brief description of the materials and methods. Then we present the results of SANS measurements analyzed in terms of the Ornstein–Zernike equation. The influence of the polymer concentration and monovalent ions (sodium chloride) concentration is studied in semidilute NaPSS solutions.
II. Theory
Using simple scaling arguments, de Gennes derived the concentration dependence of ξ of polymer solutions:22
| (1) |
where c is the polymer concentration (number of repeating units per unit volume), R is the end-to-end distance of the polymer chain, c* is the overlap concentration, and A is a constant depending on the monomer size, Kuhn length and thermal blob size. Eqn (1) has been found to be in agreement with experimental data for the correlation length of neutral polymers, particularly under good solvent conditions [see ref. 22, 23, 71–73]. Scaling theory predicts that correlation blobs repel each other with an energy kT, where k is the Boltzmann constant and T is the absolute temperature. The polymer contribution to the osmotic pressure (Πp) is:
| (2) |
which describes the concentration dependence of Π of neutral polymers both in good and θ solvents. [We use the subscript Π to distinguish the correlation length obtained from the osmotic pressure from that determined from scattering measurements ξOZ, (see eqn (9))]. For neutral polymers, ξΠ is proportional to and larger than ξOZ, with the proportionality constant increasing with increasing solvent quality.22,23
The correlation length of polyelectrolyte solutions depends on the polymer and added salt concentrations. Dobrynin’s scaling model predicts:53
| (3) |
where ξ(0) ≡ ξSF = (b′)3/2c−1/2 is the correlation length in salt-free solution, b′ = b/B is the effective monomer length, with b the chemical monomer size and B the stretching parameter,29,53 cS is the added salt concentration and f is the degree of dissociated counterions. For cS ≫ fc, eqn (3) has the form ξ ∝ c 1/4sc−3/4.
The osmotic pressure of polyelectrolyte solutions contains a contribution analogous to that of neutral polymers in good solvent (kTξ −3) and a term arising from counterion osmotic pressure, which may be approximated as:53
see ref. 54–58, 71, 74, 75 for a discussion of the validity of this term. The osmotic compressibility arising from the polymer and counterions for solutions in excess added salt can, therefore, be given as:
| (4a) |
| (4b) |
where ξΠ = AΠcγ and 4cS/f ≫ c.76–80 The scaling exponent predicted by eqn (4a) has been shown to apply for several neutral polymer–solvent systems of varying solvent quality,21,72,73 as well as biological polyelectrolytes in excess added salt.28
The structure factor at zero scattering wave-vector q is:
| (5) |
where ϕ is the volume fraction and dϕ/dΠ is the inverse osmotic compressibility. For neutral polymers in good solvent (excluded volume exponent ν = 0.59) scaling theory predicts ξ ∝ c−0.77, Π ∝ c2.3 and S(0)/c ∝ c−0.31, which matches the experimental data, see ref. 21, 23–25, 72, 73, 81–87. However, the correlation length obtained from scattering and osmotic pressure measurements differs by a factor of ≈4, which is not anticipated from the scaling theory. At high polymer concentrations, ξ decreases to values well below the Kuhn length (lK) of neutral polymers, which is incompatible with the scaling interpretation of the correlation length.24,88
In many experiments made on neutral polymers the structure factor of the polymer solution has been modeled by the random phase approximation (RPA) expression:
| (6) |
where νs and νm are the volumes of the solvent and monomer molecules, respectively, ϕ is the volume fraction of the polymer and P(q) is the polymer form factor, normalized to P(0) = 1, and χ provides a measure of the polymer–solvent interaction. For 1/Rg < q < 1/ξ, the form factor can be approximated as P(q) ≃ 2/(qRg)2, where Rg is the radius of gyration. Eqn (6) then gives:
| (7) |
In the range 1/ξ < q < 1/lK, the form factor depends on the solvent quality P(q) ∝ (qRg)1/ν, and eqn (7) takes a similar form but with the term in square brackets being multiplied by q1.7 instead of q2. For semidilute solutions, where excluded volume interactions are screened beyond the correlation length, Rg2/N does not depend on N and eqn (6) predicts I(q) to be independent of the polymer molar mass, a feature that agrees with experimental observations of neutral polymers.
The random phase approximation method was applied to weakly and strongly charged polyelectrolytes by Vilgis and Borsali,89,90 yielding expressions, which in the excess salt limit become analogous to eqn (6)–(7), with a χ parameter that depends on cS. Muthukumar’s double screening theory91 makes a similar prediction for flexible polyelectrolytes in the presence of excess added salt.
In the present paper, we interpret the polyelectrolyte solution data by eqn (6) understanding that this equation is only appropriate for high salt concentrations, where polyelectrolyte chain aggregation is suppressed. For polyelectrolytes in excess salt solution, the χ parameter contains an intrinsic contribution (χ0), which reflects the polymer solvent interactions in the absence of Coulombic forces, and an electrostatic contribution, which we consider in more detail in the Discussion section.
III. Experimental
Materials
Sodium styrene sulfonate (NaSS), sodium chloride and D2O were purchased from Sigma-Aldrich. Potassium persulfate (KPS) was purchased from VWR.92 De-ionised (DI) water was obtained from a Milli-Q source. Dialysis membranes were purchased from Spectra-Por. (The identification of commercial products does not imply endorsement by the National Institute of Standards and Technology nor does it imply that these are the best for the purpose.)
Preparation of sodium polystyrene sulfonate
NaPSS was synthesized by free-radical polymerization of (NaSS) in aqueous media using KPS as an initiator. 70 mL of water was de-gassed for one hour and heated to 50 °C in a round bottomed flask. An aqueous solution of KPS was added and stirring was continued until it was fully mixed. The reaction was allowed to proceed for five hours, with nitrogen being bubbled continuously. The solution was cooled down and the polymer was precipitated by addition of fourfold methanol and excess NaCl. The polymer was then washed in methanol and re-dissolved in water. Solutions were extensively dialyzed against DI water to remove any residual salt and then freeze dried. This method is expected to yield 100% sulfonation. Five other NaPSS polymers synthesised by sulfonation of polystyrene standards were purchased from Polymer Standard Services (Mainz, Germany). The molar mass of these samples varies between 258 kg mol−1 and 2000 kg mol−1, and the sulfonation degree is estimated by the manufacturer to be ≈95% and the polydispersity is pd ≈ 1.1. Solutions from the dried polymer were prepared gravimetrically by assuming a polymer density of 1.65 g mL−1.
Small angle neutron scattering
SANS experiments were performed at the NGB 30 m and NGB 10 m Small Angle Neutron Scattering instruments at the NIST Center for Neutron Research (Gaithersburg, MD, USA) and the D11 beamline at the ILL. We employed sample-to-detector distances of 1.3 m, 4 m and 13.4 m and 1.5 m, 4.5 m and 13 m (NGB 30 m, λ = 6 Å), 1.5 and 8 m (D11, λ = 6 Å) and 1.55 m and 5 m (NGB 10 m, λ = 5 Å). More details on instrument configuration are given in the ESI.† An empty cell reading was subtracted from the samples. Absolute calibration was made against a direct beam, according to NIST standard procedures. Samples were measured in Hellma cells of the QS series.
IV. Results and data analysis
Fig. 1 shows the background subtracted SANS profiles of NaPSS solutions measured at different polymer concentrations at constant salt concentration (part a) and at different salt concentrations at constant polymer concentration (part b).
Fig. 1.
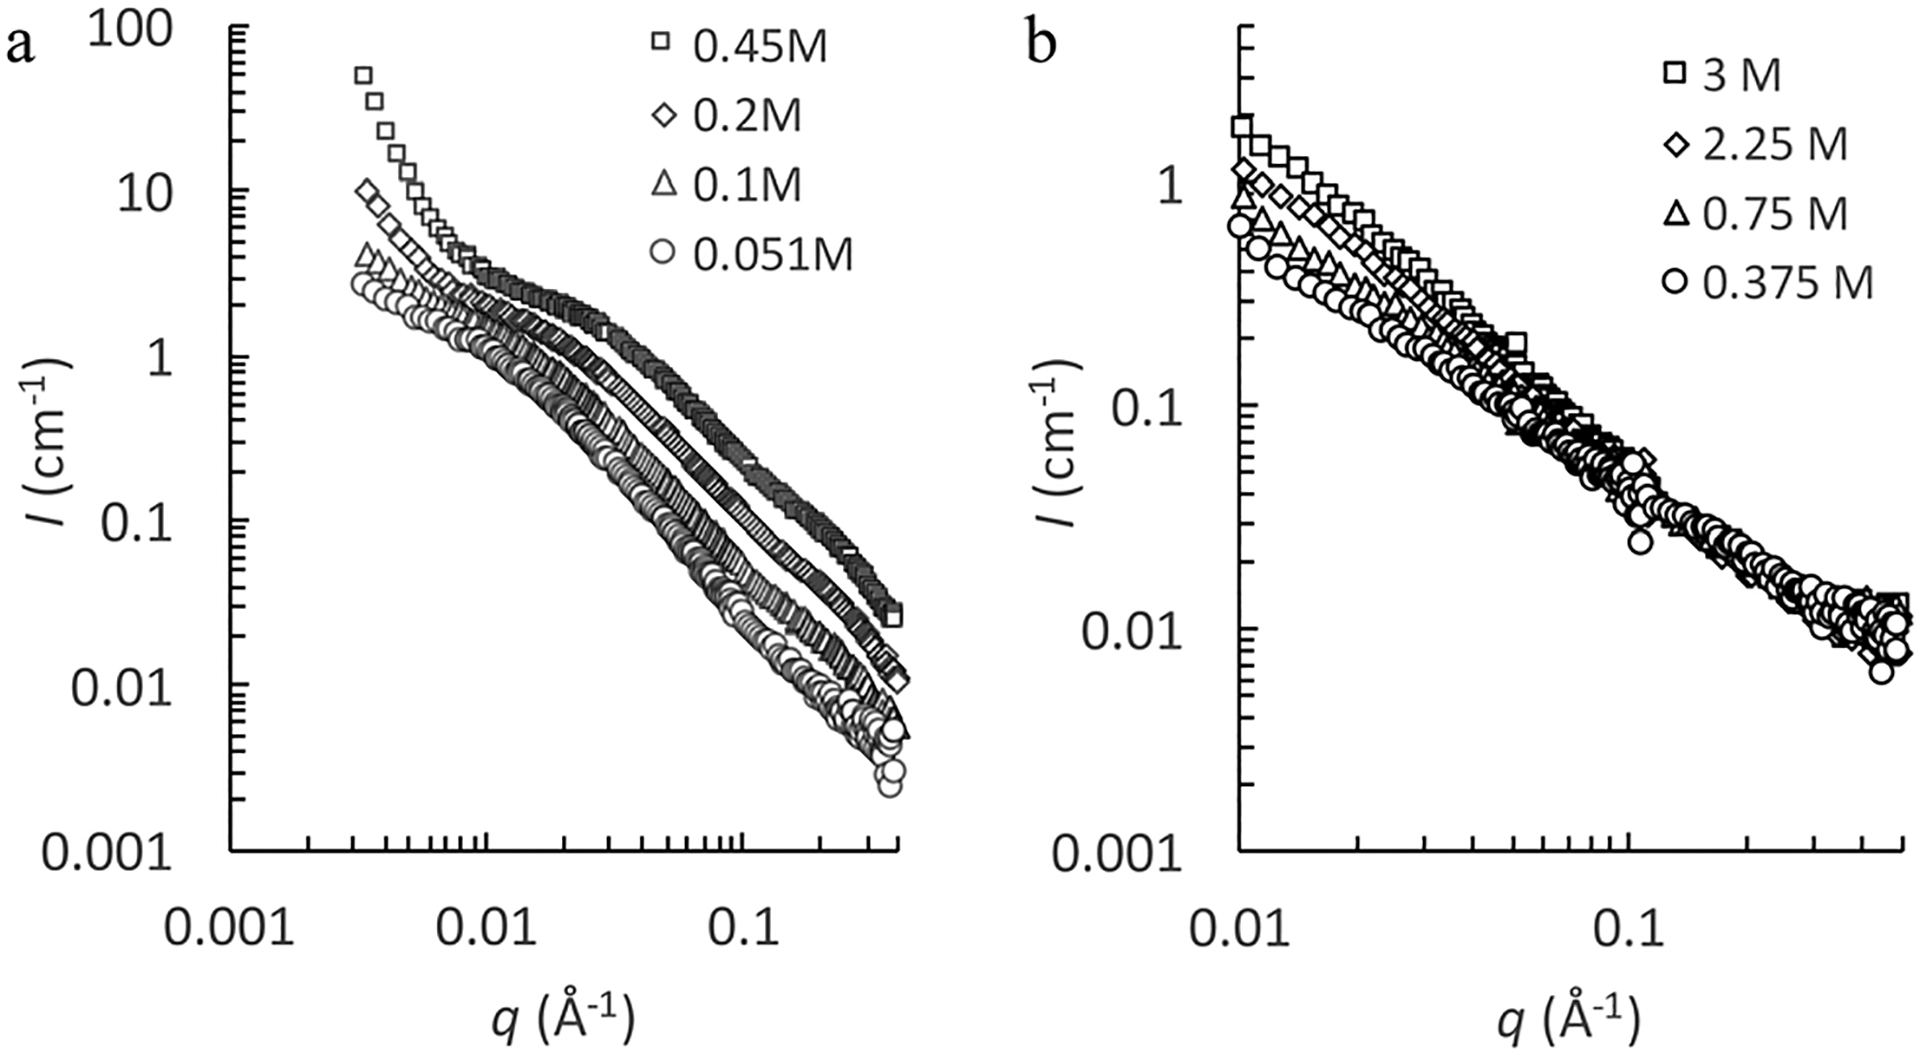
Background subtracted scattering intensity for NaPSS in aqueous NaCl solutions. (a) cS = 3 M, polymer concentrations are indicated in the figure. The lowest two concentration solutions were filtered (0.2 μm) prior to measurement. Measurements made by the NGB 30 m instrument. (b) c = 0.1 M, salt concentrations are indicated in the figure. Measurements made by the NGB 10 m instrument.
The scattering intensity relates to the structure factor as:
| (8) |
where b and ν are the scattering length and volume, respectively, and the subscripts m and s refer to the monomer and solvent. In eqn (8) the scattering arising from salt is neglected.
In analogy to neutral polymers, the scattering of a polyelectrolyte solution in excess added salt can be described by a Lorentzian function:
| (9) |
where A and B are fit parameters, related to the zero angle scattering intensity and correlation length as I(0) = 1/A and ξOZ = B/A. We use the subscript OZ to denote that the correlation length was obtained by fitting the Ornstein–Zernike expression.
The osmotic correlation length ξΠ is obtained from the experimentally determined values of I(0) and eqn (4), (5) and (8), see the ESI† for more details.
The fitting procedure to estimate the background (including incoherent and other q-independent scattering contributions), correlation length and clustering term is illustrated in Fig. 2. The high q region is fitted to a worm-like chain form factor in the qLK > 1 limit: , where b′ is the effective monomer length,23,53 RC is the cross-sectional radius of the chain (set to 0.4 nm93) and Bkgd is a constant that accounts for the q-independent scattering contribution. A representative fit to this equation is shown in Fig. 2a. The correlation length is estimated by fitting the Ornstein–Zernike function (eqn (9)) in the mid-q region, as illustrated in Fig. 2b. Finally, a power-law term I(q) = Dq−m, where D and m are constants, is added to account for the excess scattering at low-q, see Fig. 2c.
Fig. 2.

Fitting procedure to determine the correlation length and zero-scattering intensity. Circles: coherent scattering intensity for sample with c = 0.38 M, cS = 3 M. (a) Fit to worm-like chain form factor at high q, red line is . (b) Fit to Lorentzian function (first term of eqn (9)). (c) Fit to eqn (9) with clustering term (dotted line) and to Lorentzian term only (full line).
V. Discussion
Fig. 3a and b show the correlation length and reduced zero angle scattering intensity respectively as a function of polymer concentration in solutions of different salt contents for the NaPSS synthesised by polymerisation of styrene sulfonate. Data for samples obtained by sulfonation of polystyrene are shown in the ESI† and yield similar results. No effect of the polymer molar mass on ξ or I(0) is observed, as expected for semidilute solutions. Both ξ and I(0) decrease as power-laws of the polymer concentration at constant salt concentration, as shown by the best-fit lines. The increase of the correlation length and of the zero-angle scattering intensity with increasing content of added salt is consistent with a decrease in solvent quality, which leads to concentration fluctuations occurring on larger length-scales.
Fig. 3.

Correlation length (a) and reduced zero angle scattering intensity (b) as a function of the polymer concentration at different concentrations of added salt. Symbols: cS = 3 M (blue), 1.5 M (red) and 0.375 M (black).
A. Scaling analysis
The scaling model predicts that ξ and I(0) are related through eqn (2), (4) and (5). Applying these equations, we find that the calculated values of I(0) are nearly two orders of magnitude smaller than the measured ones. This discrepancy indicates that ξOZ < ξΠ, which has been reported for several neutral polymer systems.24,25
Fig. 4a plots the ratio ξΠ/ξOZ required to match the measured and calculated osmotic compressibilities as a function of the added salt concentration, (see ESI† for more details). At high cS, ξΠ/ξOZ ≃ 4.2 is found, which is close to the value 3.8 reported for neutral polymers in good solvent,24,25 indicated by the dashed line in Fig. 4a. The observed I(0)/c vs. c exponents and those calculated from eqn (4) and (5) are in reasonably good agreement (see Fig. 4b). The origin of the ξΠ/ξOZ ≈ 4.2 factor is discussed below.
Fig. 4.

(a) Ratio of osmotic (ξΠ) and scattering (ξOZ) correlation lengths. Full line: average value at high salt concentration, dashed line: value for neutral polymers in good solvent.25 (b) Exponent for the c dependence of I(0)/c. Data points are experimental values, dashed line shows the variation of the exponent calculated from eqn (2), (4) and (5). (c) Exponent γ, which relates the polymer concentration and correlation length as ξ ∝ cγ. Dotted line is the scaling prediction for neutral polymers in good solvent and for polyelectrolytes in the presence of excess added salt.
In Fig. 4c the exponent γ obtained from the concentration dependence of ξ (∝ cγ) is plotted as a function of cS. For cS = 0.375 M, the data display the expected53 scaling dependence of ξ ∝ c −0.75. For higher cS, the concentration dependence becomes weaker, and matches experimental results obtained for flexible neutral polymers in good solvents such as polystyrene in dichloromethane or PDMS in toluene.23,24 As cS increases, the solutions approach the θ point (≃ 4.17 M NaCl at T ≃ 290 K94). Scaling theory predicts that γ should decrease from −0.77 at low added excess salt concentration (i.e. cS ≪ 4.17 M, cS ≫ fc/2) to γ = −1 at the θ state, a feature that has been observed in some neutral polymer systems in organic solvents (e.g., polystyrene/cyclohexane21,23) but not in aqueous environment.95,96 In the present system the exponent increases to γ ≃ −0.45 at cS = 3 M. This type of behaviour is similar to that observed for neutral polymers in aqueous solutions near the θ point. To the best of our knowledge, two such systems have been previously studied: polyethylene oxide (PEO) in D2O for T = 5–95 °C95,96 poly(isopropylacrylamide) (PNIPAM) solutions in D2O73 for T = 23–34 °C. Shibayama and co-authors73 attributed the deviation from the scaling theory to the dependence of the spinodal temperature (TS) on the polymer concentration. Experimental data obtained for polystyrene/cyclohexane system show a similar concentration dependence of TS, but the ξ ≈ c−1 dependence predicted by the scaling theory is observed.97 Given that γ appears to be consistently higher in aqueous solution than in organic solvent, it is possible that hydrophobic interactions are responsible for the discrepancy.
The observed results for NaPSS upon increasing cS are consistent with this trend: increasing the concentration of added salt decreases the excluded volume strength of the polymer and therefore has an analogous effect as that of the increasing temperature in the PEO/water or PNIPAM/water system. We note that it is well documented that in polyelectrolyte systems the polymer–solvent interaction parameter is strongly affected by the added salt.98 At high salt content the hydrophobic forces between the hydrophobic groups on the polymer molecules dominate, and result in chain aggregation. This behavior is different from neutral polymer solutions, in which, at constant temperature and pressure, the thermodynamic interactions are defined by the polymer and the solvent molecules only. As discussed below, the experimental values of χ and I(0) for NaPSS in excess added salt can be accounted for by the RPA method.
The measured ξ vs. c exponents at the highest added salt concentrations differ appreciably from those observed for non-ionic polystyrene in good (toluene, 25 °C) or θ (cyclohexane, 35 °C) solvent. However, the fact that the ratio of ξΠ/ξOZ is similar for sulfonated polystyrene in excess added salt (ξΠ/ξOZ ≈ 4) and non-sulfonated polystyrene in good solvent25,83,85 (ξΠ/ξOZ ≈ 3.8) signals that the polymer contribution to the osmotic pressure is similar in both systems. The difference between the exponents may be the consequence of hydrophobic interactions.
The salt-dependence of the correlation length at constant polymer concentration is shown in Fig. 5a. The best fit exponents for c = 0.05, 0.1 and 0.2 M, are 0.28 ± 0.07, 0.29 ± 0.08 and 0.42 ± 0.19, respectively. These values exceed the scaling prediction of 0.25 (see eqn (3)). In Fig. 5b ξ at fixed polymer concentrations is plotted as a function of [1 + 2cS/fc]1/4. According to eqn (3) these plots should yield straight lines going through the origin, with a slope of ξ(0). The first feature is approximately observed for data in excess salt, however, the slopes of the lines are smaller than expected from the correlation length values of polystyrene sulfonate in salt-free solution. The values of ξ in salt-free solution, calculated as ξ(cS = 0) = ξpeak = 33c−1/2, following earlier work,29,99–101 are plotted as hollow symbols in Fig. 5b. The salt-free values of the correlation length are 5–7 times larger than the values extrapolated from the excess salt data, depending on the polymer concentration. The scaling theory defines the correlation length as being equal to the end-to-end distance of a chain at the overlap concentration, i.e. ξ(c*) = 61/2Rg(c*) for Gaussian chains. On the other hand, comparison of eqn (9) with the Zimm approximation yields ξ(c*) ≃ Rg/√3. The correlation lengths obtained from eqn (9) are therefore expected to be much smaller than ξ calculated by scaling. Adjusting the results of eqn (9) by a factor of (3 × 6)1/2 ≈ 4.2 would bring the excess-salt and salt-free data plotted in Fig. 5b to better agreement, and would help explain the differences observed between ξΠ and ξOZ both for NaPSS in excess added NaCl and for non-ionic polymers in good or θ solvents.24,72 An additional discussion on the length-scales at which excluded volume becomes screened is provided in Section V.B.
Fig. 5.

(a) Dependence of correlation length on the added salt concentration for different polymer concentrations, indicated on the legend. (b) Scaling plot according to eqn (3). Filled symbols are data measured in excess salt (ξOZ). Hollow symbols are for salt-free solutions, calculated from ξpeak = 33c−1/2 Å.95,96 Symbols have the same meaning in parts a and b.
B. RPA and double screening theory
Given the discrepancies between experimental data and the scaling theory, in particular with respect to the dependence of the correlation length on the polymer concentration, we compare our experiments with the random phase approximation method, which is known to provide a reasonably good description of scattering from concentrated solutions of neutral flexible polymers.
I. Chain dimensions.
The concentration dependence of Rg in salt-free solution is discussed extensively in ref. 29 and shown to be in agreement with the scaling theory of Dobrynin et al.53 and Muthukumar’s double screening theory.91 Fig. 6a and b compare the values of Rg2/N in excess salt calculated from eqn (7) and our data with direct measurements by Spiteri102 using the zero-average contrast (ZAC) method as a function of polymer and added salt concentrations, respectively. Spiteri estimated Rg from the slope of the form factor at low-q, using the Zimm approximation.102 For cS = 3 M, good agreement is found between the two methods. For lower added salt concentrations, the RPA consistently underestimates the dimensions of NaPSS chains. The level of disagreement between the two estimates is similar to that observed by Graessley for neutral polymers in good and θ solvents.24
Fig. 6.

(a) Chain dimensions calculated from eqn (7) (hollow symbols) and from single chain measurements by Spiteri102 using the zero-average contrast method (filled symbols) as a function of polymer concentration in 3 M NaCl. The dashed line represents the θ dimensions of the chain in 3 M NaCl, see the text for details. (b) Same as part (a) but plotted as a function of added salt concentration for c = 0.34 M. The datum at cS = 4.17 M corresponds to NaPSS at the θ condition 17.8 °C.94 All values calculated from eqn (7) are for solutions in excess added salt.
Semidilute solution data from this study and Spiteri’s may be compared with Norisuye and co-workers’ measurement in dilute solution.66,69,94,103 At cS = 3 M, the unperturbed (i.e. theta) dimensions of NaPSS are calculated as Rg2/N = (LLK)/6N using Norisuye and co-worker’s estimates for the Kuhn length and mass per unit length of LK = 15 Å and ML = 880 g mol−1 nm−1. This gives a value of Rg2/N = 5.5 Å2, which is significantly lower than our estimates based on the RPA method and Spiteri’s direct measurements Rg2/N ≈ 12 Å2 at c ≈ 0.4 M, see the ESI† for further discussion of this.
II. Correlation length and zero-angle scattering intensity.
Muthukumar’s double screening theory91 predicts ξ ~ c−1/2 at low added salt concentrations, ξ ~ c−3/4 at high salt and moderate polymer concentrations, and ξ ~ c−1/2 for concentrated polyelectrolyte solutions in the presence of excess salt. The RPA (eqn (7)) also expects ξ ~ c−1/2 and I(0)/c ~ c−1 in excess salt if Rg2/N and 1/(1 – φ) – 2χ do not vary appreciably with the polymer concentration. The observed dependences for NaPSS in 3 M NaCl deviate from this prediction by 20–30%, which may be attributed to a concentration dependence of the χ parameter and a decrease of Rg2/N with concentration. The zero-angle scattering intensity, plotted for selected added salt concentrations in Fig. 3b, may be expressed in terms of the χ parameter using eqn (6). The RPA method and Muthukumar’s double screening theory predict:
| (10) |
where K is a constant, that depends on the relative permittivity of the solvent and the Kuhn length of the polymer.91
In Fig. 7 the χ parameter is plotted as a function of 1/cS for c = 0.05 and 0.1 M. The linear relation predicted by eqn (10) is observed for all polymer concentrations studied. The 1/cS = 0 intercept yields χ0 ≃ 0.49, which appears too low given the hydrophobic nature of the polystyrene backbone. Assuming instead a dependence of
| (11) |
gives a more reasonable estimate χ0′ ≃ 0.52. The various χ0 and K values obtained from fits at different concentrations are listed in Table 1. No clear trends are discernible for K or K′ due to the relatively large experimental errors. At the infinite-salt limit χ appears to show a weak increase with polymer concentration, in accordance with findings for neutral polymer solutions and gels.24,74,75 The level of agreement between eqn (10) and (11) and the experimental χ data are similar, as can be seen from the R2 metrics in Table 1.
Fig. 7.

The polymer–solvent interaction parameter χ as a function of 1/cS (full circles) and 1/√cS (open triangles) for c = 0.05 M (a) and c = 0.1 M (b). Lines are the best linear fits to the data, see Table 1.
Table 1.
Best-fit values and 95% confidence intervals for χ vs. cS data fitted to χ = χ0 − K/cS and χ = χ0′ − K′/cs1/2 at different polymer concentrations as indicated in the first column. The values in square brackets indicate the cS range over which the preceding expressions were fitted. The R2 coefficient for each fit is indicated below the best-fit values
| c (M) [cs range] | Eqn (10) | Eqn (11) | ||
|---|---|---|---|---|
| χ0 | K | χ0′ | K′ | |
| 0.05 [3–0.15 M] | 0.486 ± 0.009 | 0.016 ± 0.003 | 0.52 ± 0.01 | 0.041 ± 0.007 |
| R2 = 0.97 | R2 = 0.98 | |||
| 0.1 [3–0.3 M] | 0.50 ± 0.01 | 0.019 ± 0.007 | 0.52 ± 0.01 | 0.046 ± 0.012 |
| R2 = 0.91 | R2 = 0.95 | |||
| 0.2 [3–0.75 M] | 0.51 ± 0.01 | 0.032 ± 0.02 | 0.54 ± 0.01 | 0.057 ± 0.016 |
| R2 = 0.97 | R2 = 0.99 | |||
An earlier estimate of χ0 ≈ 1.1 was obtained by Prabhu et al.65,104 by extrapolating χ vs. 1/cS to infinite ionic strength for NaPSS in excess barium chloride. The larger value of χ0 can be explained as arising from two factors: first, the NaPSS of ref. 40 was synthesized by sulfonation of polystyrene, giving a degree of sulfonation of 96%, instead of 100% obtained for samples made by radical polymerization of styrene sulfonate,94 as is the case in the present work. The small fraction of non-sulfonated polystyrene is known to lead to greater backbone hydrophobicity, which manifests itself in, for example, smaller chain dimensions in dilute excess-salt solution and a lower θ-salt concentration.94,105 A second factor that may account for the discrepancy is that Ba2+ cations interact specifically with the sulfonate groups, leading to different chain conformations and phase behaviour.65,104,106,107 It is possible that χ exhibits a different cS scaling in the presence of NaCl and BaCl2, thus complicating a comparison of the extrapolations to infinite ionic strength.
The dependence of the χ parameter on the square root of the added salt concentration is consistent with results reported for various polyelectrolyte systems,66–70 and is also in line with Dobrynin et al.’s53 and Odijk et al.’s108 treatments of excluded volume in excess salt solutions, which expect the excluded volume strength to vary linearly with the Debye screening length.
VI. Conclusions
We have evaluated the correlation length and osmotic compressibility of polyelectrolyte solutions in excess salt. Scaling theory correctly describes the variation of the correlation length with the polymer concentration at low and moderate added salt concentrations, but at high salt concentrations the RPA and double screening theory work better. The ratio of the scattering correlation length and the osmotic correlation length is found to be ≃4 at high added salt concentration, in agreement with earlier reports for neutral polymers in good solvents. The correlation lengths obtained from the peak position in the scattering profiles of salt-free polyelectrolytes and from the fit to a Lorentzian function differ by an order of magnitude. The electrostatic χ parameter is found to vary as χelec ~ 1/cS1/2, in contrast with the linear dependence predicted by various theories. We quantified important similarities and differences between the behaviour of neutral polymers and polyelectrolytes in solutions at high salt concentrations. It is likely that at high salt concentrations the behavior of polyelectrolyte solutions is governed by hydrophobic interactions due to the hydrophobic nature of the backbone of the polyelectrolyte molecules.
Acknowledgements
F. H. and M. M. acknowledge the support of the Intramural Research Program of the NIH, NICHD. Access to the NGB 30 m SANS was provided by the Center for High Resolution Neutron Scattering, a partnership between the National Institute of Standards and Technology and the National Science Foundation under Agreement No. DMR-1508249. Use of the NGB 10 m SANS was supported by the NIST nSoft Consortium. We thank the ILL for beamtime. We thank Dr B. Hammouda for his excellent advice.
Footnotes
Electronic supplementary information (ESI) available. See DOI: 10.1039/d0sm00464b
Conflicts of interest
There are no conflicts to declare.
References
- 1.Bloomfield VA, Biopolymers, 1997, 44(3), 269–282. [DOI] [PubMed] [Google Scholar]
- 2.Brandon D and Tooze J, Introduction to Protein Structure, Garland Publishing, London, New York, 1991. [Google Scholar]
- 3.Klein J, Proc. Inst. Mech. Eng., Part J, 2006, 220(8), 691–710. [Google Scholar]
- 4.Dėdinaitė A, Soft Matter, 2012, 8(2), 273–284. [Google Scholar]
- 5.Meka VS, Sing MK, Pichika MR, Nali SR, Kolapalli VR and Kesharwani P, Drug Discovery Today, 2017, 22(11), 1697–1706. [DOI] [PubMed] [Google Scholar]
- 6.Parhi R, Adv. Pharm. Bull, 2017, 7(4), 515–530. [DOI] [PMC free article] [PubMed] [Google Scholar]
- 7.Kayitmazer AB, Seeman D, Minsky BB, Dubin PL and Xu Y, Soft Matter, 2013, 9(9), 2553–2583. [Google Scholar]
- 8.Moschakis T and Biliaderis CG, Curr. Opin. Colloid Interface Sci, 2017, 28, 96–109. [Google Scholar]
- 9.Denton AR, Coarse-Grained Modeling of Charged Colloidal Suspensions: From Poisson-Boltzmann Theory to Effective Interactions, Electrostatics of Soft and Disordered Matter, 2014, p. 201. [Google Scholar]
- 10.Wang L, Lin J and Zhang Q, Soft Matter, 2013, 9(15), 4015–4025. [Google Scholar]
- 11.Batys P, Luukkonen S and Sammalkorpi M, Phys. Chem. Chem. Phys, 2017, 19(36), 24583–24593. [DOI] [PubMed] [Google Scholar]
- 12.Hsu HP and Lee E, Electrochem. Commun, 2012, 15(1), 59–62. [Google Scholar]
- 13.Wypysek SK, Scotti A, Alziyadi MO, Potemkin II, Denton AR and Richtering W, Macromol. Rapid Commun, 2020, 41(1), 1900422. [DOI] [PubMed] [Google Scholar]
- 14.Batys P, Luukkonen S and Sammalkorpi M, Phys. Chem. Chem. Phys, 2017, 19(36), 24583–24593. [DOI] [PubMed] [Google Scholar]
- 15.Smiatek J, Molecules, 2020, 25(7), 1661. [DOI] [PMC free article] [PubMed] [Google Scholar]
- 16.Hansch M, Hämisch B, Schweins R, Prévost S and Huber K, J. Chem. Phys, 2018, 148(1), 014901. [DOI] [PubMed] [Google Scholar]
- 17.Kou R, Zhang J, Chen Z and Liu G, ChemPhysChem, 2018, 19(11), 1404–1413. [DOI] [PubMed] [Google Scholar]
- 18.Yu J, Mao J, Yuan G, Satija S, Jiang Z, Chen W and Tirrell M, Macromolecules, 2016, 49(15), 5609–5617. [Google Scholar]
- 19.Carl N, Prévost S, Schweins R, Houston JE, Morfin I and Huber K, Macromolecules, 2019, 52(22), 8759–8770. [Google Scholar]
- 20.Hansch M, Kaub HP, Deck S, Carl N and Huber K, J. Chem. Phys, 2018, 148(11), 114906. [DOI] [PubMed] [Google Scholar]
- 21.Rubinstein M and Colby RH, Polymer Physics, Oxford, 2003. [Google Scholar]
- 22.De Gennes P-G and Gennes P-G, Scaling concepts in polymer physics, Cornell University Press, 1979. [Google Scholar]
- 23.Bennett A, Daivis PJ, Shanks R and Knott R, Polymer, 2004, 45(25), 8531–8540. [Google Scholar]
- 24.Graessley WW, Polymeric liquids & networks: structure and properties, Garland Science, 2003. [Google Scholar]
- 25.Huang JR and Witten TA, Macromolecules, 2002, 35(27), 10225–10232. [Google Scholar]
- 26.Salamon K, Aumiler D, Pabst G and Vuletic T, Macromolecules, 2013, 46(3), 1107–1118. [Google Scholar]
- 27.Horkay F, Basser PJ, Hecht AM and Geissler E, Macromolecules, 2012, 45(6), 2882–2890. [DOI] [PMC free article] [PubMed] [Google Scholar]
- 28.Geissler E, Hecht AM and Horkay F, Scaling Behavior of Hyaluronic Acid in Solution with Mono- and Divalent Ions, Macromolecular symposia, Wiley-VCH Verlag, Weinheim, 2010, vol. 291, no. 1, pp. 362–370. [DOI] [PMC free article] [PubMed] [Google Scholar]
- 29.Lopez CG and Richtering W, J. Chem. Phys, 2018, 148(24), 244902. [DOI] [PubMed] [Google Scholar]
- 30.Tsuji Y, Li X and Shibayama M, Gels, 2018, 4(2), 50. [DOI] [PMC free article] [PubMed] [Google Scholar]
- 31.Matsunaga T, Sakai T, Akagi Y, Chung UI and Shibayama M, Macromolecules, 2009, 42(16), 6245–6252. [Google Scholar]
- 32.Shibayama M, Polym. J, 2011, 43(1), 18. [Google Scholar]
- 33.Lopez CG, Colby RH and Cabral JT, Macromolecules, 2018, 51(8), 3165–3175. [Google Scholar]
- 34.Yethiraj A, Phys. Rev. Lett, 1997, 78(19), 3789. [Google Scholar]
- 35.von Solms N and Chiew YC, J. Chem. Phys, 2003, 118(9), 4321–4330. [Google Scholar]
- 36.Jiang JW, Blum L, Bernard O and Prausnitz JM, Mol. Phys, 2001, 99(13), 1121–1128. [Google Scholar]
- 37.Jiang J, Liu H and Hu Y, J. Chem. Phys, 1999, 110(10), 4952–4962. [Google Scholar]
- 38.Jiang J, Liu H, Hu Y and Prausnitz JM, J. Chem. Phys, 1998, 108(2), 780–784. [Google Scholar]
- 39.Von Solms N and Chiew YC, J. Chem. Phys, 1999, 111(10), 4839–4850. [Google Scholar]
- 40.Yethiraj A, J. Phys. Chem. B, 2009, 113(6), 1539–1551. [DOI] [PubMed] [Google Scholar]
- 41.Shew CY, Do C, Hong K, Liu Y, Porcar L, Smith GS and Chen WR, J. Chem. Phys, 2012, 137(2), 024907. [DOI] [PubMed] [Google Scholar]
- 42.Landsgesell J, Nová L, Rud O, Uhlík F, Sean D, Hebbeker P, Holm C and Košovan P, Soft Matter, 2019, 15(6), 1155–1185. [DOI] [PubMed] [Google Scholar]
- 43.Carrillo JMY and Dobrynin AV, J. Phys. Chem. B, 2010, 114(29), 9391–9399. [DOI] [PubMed] [Google Scholar]
- 44.Mantha S and Yethiraj A, J. Phys. Chem. B, 2015, 119(34), 11010–11018. [DOI] [PubMed] [Google Scholar]
- 45.Ramachandran S, Katha AR, Kolake SM, Jung B and Han S, J. Phys. Chem. B, 2013, 117(44), 13906–13913. [DOI] [PubMed] [Google Scholar]
- 46.Yao G, Zhao J, Ramisetti SB and Wen D, Ind. Eng. Chem. Res, 2018, 57(50), 17129–17141. [Google Scholar]
- 47.Chremos A and Douglas JF, J. Chem. Phys, 2018, 149(16), 163305. [DOI] [PMC free article] [PubMed] [Google Scholar]
- 48.Chremos A and Douglas JF, J. Chem. Phys, 2017, 147(24), 241103. [DOI] [PMC free article] [PubMed] [Google Scholar]
- 49.Soysa WC, Dünweg B and Prakash JR, J. Chem. Phys, 2015, 143(6), 064906. [DOI] [PubMed] [Google Scholar]
- 50.Adamczyk Z, Morga M, Kosior D and Batys P, J. Phys. Chem. C, 2018, 122(40), 23180–23190. [Google Scholar]
- 51.Stevens MJ and Kremer K, J. Chem. Phys, 1995, 103(4), 1669–1690. [Google Scholar]
- 52.Carrillo JMY and Dobrynin AV, Macromolecules, 2011, 44(14), 5798–5816. [Google Scholar]
- 53.Dobrynin AV, Colby RH and Rubinstein M, Macromolecules, 1995, 28(6), 1859–1871. [Google Scholar]
- 54.Carrillo JMY and Dobrynin AV, Polymers, 2014, 6(7), 1897–1913. [Google Scholar]
- 55.Liao Q, Dobrynin AV and Rubinstein M, Macromolecules, 2003, 36(9), 3399–3410. [Google Scholar]
- 56.Rubinstein M, Colby RH, Dobrynin AV and Joanny JF, Macromolecules, 1996, 29(1), 398–406. [Google Scholar]
- 57.Ullner M, Qamhieh K and Cabane B, Soft Matter, 2018, 14(28), 5832–5846. [DOI] [PubMed] [Google Scholar]
- 58.Chang R, Kim Y and Yethiraj A, Macromolecules, 2015, 48(19), 7370–7377. [Google Scholar]
- 59.Lopez CG, ACS Macro Lett, 2019, 8(8), 979–983. [DOI] [PubMed] [Google Scholar]
- 60.Xu G, Luo S, Yang Q, Yang J and Zhao J, J. Chem. Phys, 2016, 145(14), 144903. [DOI] [PubMed] [Google Scholar]
- 61.Xu G, Yang J and Zhao J, J. Chem. Phys, 2018, 149(16), 163329. [DOI] [PubMed] [Google Scholar]
- 62.Spiteri MN, Boué F, Lapp A and Cotton JP, Phys. Rev. Lett, 1996, 77(26), 5218. [DOI] [PubMed] [Google Scholar]
- 63.Spiteri MN, Boue F, Lapp A and Cotton JP, Phys. B, 1997, 234, 303–305. [Google Scholar]
- 64.Dubois E and Boué F, Macromolecules, 2001, 34(11), 3684–3697. [Google Scholar]
- 65.Prabhu VM, Muthukumar M, Wignall GD and Melnichenko YB, Polymer, 2001, 42(21), 8935–8946. [Google Scholar]
- 66.Iwamoto Y, Hirose E and Norisuye T, Polym. J, 2000, 32(5), 428–434. [Google Scholar]
- 67.Hayashi K, Tsutsumi K, Norisuye T and Teramoto A, Polym. J, 1996, 28(10), 922–928. [Google Scholar]
- 68.Yashiro J, Hagino R, Sato S and Norisuye T, Polym. J, 2006, 38(1), 57–63. [Google Scholar]
- 69.Yashiro J and Norisuye T, J. Polym. Sci., Part B: Polym. Phys, 2002, 40(23), 2728–2735. [Google Scholar]
- 70.Tsutsumi K and Norisuye T, Polym. J, 1998, 30(4), 345–349. [Google Scholar]
- 71.Brown W and Nicolai T, Colloid Polym. Sci, 1990, 268(11), 977–990. [Google Scholar]
- 72.Broseta D, Leibler L, Lapp A and Strazielle C, EPL, 1986, 2(9), 733. [Google Scholar]
- 73.Shibayama M, Tanaka T and Han CC, J. Chem. Phys, 1992, 97(9), 6829–6841. [Google Scholar]
- 74.Horkay F, Han MH, Han IS, Bang IS and Magda JJ, Polymer, 2006, 47(21), 7335–7338. [DOI] [PMC free article] [PubMed] [Google Scholar]
- 75.Lopez CG, Lohmeier T, Wong JE and Richtering W, J. Colloid Interface Sci, 2019, 558, 200–210. [DOI] [PubMed] [Google Scholar]
- 76. For NaPSS in aqueous solution, f ≃ 0.2–0.3, see ref. 52–56 and this condition is therefore satisfied when cS ≫ c/20, which is met for all solutions considered in this work except those in salt-free D2O.
- 77.Colby RH, Boris DC, Krause WE and Tan JS, J. Polym. Sci., Part B: Polym. Phys, 1997, 35(17), 2951–2960. [Google Scholar]
- 78.Bordi F, Cametti C and Colby RH, J. Phys.: Condens. Matter, 2004, 16(49), R1423. [Google Scholar]
- 79.Böhme U and Scheler U, Macromol. Chem. Phys, 2007, 208(19–20), 2254–2257. [Google Scholar]
- 80.Huber K and Scheler U, Curr. Opin. Colloid Interface Sci, 2012, 17(2), 64–73. [Google Scholar]
- 81.Destrée M, Lyulin A and Ryckaert JP, Macromolecules, 1996, 29(5), 1721–1727. [Google Scholar]
- 82.Müller M, Binder K and Schäfer L, Macromolecules, 2000, 33(12), 4568–4580. [Google Scholar]
- 83.Cotton JP, Nierlich M, Boue F, Daoud M, Farnoux B, Jannink G, Duplessix R and Picot C, J. Chem. Phys, 1976, 65(3), 1101–1108. [Google Scholar]
- 84.Hamada F, Kinugasa S, Hayashi H and Nakajima A, Macromolecules, 1985, 18(11), 2290–2294. [Google Scholar]
- 85.Stepanek P, Perzynski R, Delsanti M and Adam M, Macromolecules, 1984, 17(11), 2340–2343. [Google Scholar]
- 86.Colby RH, Rheol. Acta, 2010, 49(5), 425–442. [Google Scholar]
- 87.Flory PJ and Daoust H, J. Polym. Sci, 1957, 25(111), 429–440. [Google Scholar]
- 88.Graessley WW, Macromolecules, 2002, 35(8), 3184–3188. [Google Scholar]
- 89.Vilgis TA and Borsali R, Phys. Rev. A: At., Mol., Opt. Phys, 1991, 43(12), 6857. [DOI] [PubMed] [Google Scholar]
- 90. Vilgis and Borsali’s theory is, as discussed in their paper valid only for strongly charged polyelectrolytes when their conformation can be assumed to be Gaussian at long distance scales (more specifically, when electrostatic stiffening does not cause a strong deviation of P(q) from that of the Debye form factor at low q). For the high concentrations of added salt considered in this experiment, we expect this condition to be met.
- 91.Muthukumar M, J. Chem. Phys, 1996, 105(12), 5183–5199. [Google Scholar]
- 92. Certain Commercial Equipment, Instruments, or Materials Are Identified in This Paper in Order to Specify the Experimental Procedure Accurately. Such Identification Is Not Intended to Imply Recommendation or Endorsement by the National Institute of Standards and Technology, nor Is It Intended to Imply That the Materials or Equipment Identified Are Necessarily the Best Available for the Purpose.
- 93.Kassapidou K, Jesse W, Kuil ME, Lapp A, Egelhaaf S and Van der Maarel JRC, Macromolecules, 1997, 30(9), 2671–2684. [Google Scholar]
- 94.Hirose E, Iwamoto Y and Norisuye T, Macromolecules, 1999, 32(25), 8629–8634. [Google Scholar]
- 95.Hammouda B and Ho DL, J. Polym. Sci., Part B: Polym. Phys, 2007, 45(16), 2196–2200. [Google Scholar]
- 96.Hammouda B, Ho D and Kline S, Macromolecules, 2002, 35(22), 8578–8585. [Google Scholar]
- 97.Nicolai T and Brown W, Macromolecules, 1990, 23(12), 3150–3155. [Google Scholar]
- 98.Horkay F, Tasaki I and Basser PJ, Biomacromolecules, 2000, 1(1), 84–90. [DOI] [PubMed] [Google Scholar]
- 99.Nierlich M, Williams CE, Boue F, Cotton JP, Daoud M, Famoux B, Jannink G, Picot C, Moan M, Wolff C and Rinaudo M, J. Phys, 1979, 40(7), 701–704. [Google Scholar]
- 100.Kaji K, Urakawa H, Kanaya T and Kitamaru R, J. Phys, 1988, 49(6), 993–1000. [Google Scholar]
- 101. In salt-free solution, the correlation length is calculated as ξSF = 2π/q*, where q* is the scattering wave-vector of the peak in the scattering intensity.
- 102.Spiteri M, PhD thesis, Universite Orsay – Paris-Sud, 1997.
- 103. Norisuye and co-workers report data in the 0.05–4.17 M cS range. The values quoted are interpolated for cS = 3 M.
- 104.Prabhu VM, Muthukumar M, Wignall GD and Melnichenko YB, J. Chem. Phys, 2003, 119(7), 4085–4098. [Google Scholar]
- 105.Takahashi A, Kato T and Nagasawa M, J. Phys. Chem, 1967, 71(7), 2001–2010. [Google Scholar]
- 106.Požar J, Bohinc K, Vlachy V and Kovačević D, Phys. Chem. Chem. Phys, 2011, 13(34), 15610–15618. [DOI] [PubMed] [Google Scholar]
- 107.Zhang Y, Douglas JF, Ermi BD and Amis EJ, J. Chem.Phys, 2001, 114(7), 3299–3313. [Google Scholar]
- 108.Odijk T and Houwaart AC, J. Polym. Sci., Polym. Phys. Ed, 1978, 16(4), 627–639. [Google Scholar]