

Abstract
To shed light on how acute exercise affects blood glucose (BG) concentrations in nondiabetic subjects, we develop a physiological pharmacokinetic/pharmacodynamic model of postprandial glucose dynamics during exercise. We unify several concepts of exercise physiology to derive a multiscale model that includes three important effects of exercise on glucose dynamics: increased endogenous glucose production (EGP), increased glucose uptake in skeletal muscle (SM), and increased glucose delivery to SM by capillary recruitment (i.e. an increase in surface area and blood flow in capillary beds). We compare simulations to experimental observations taken in two cohorts of healthy nondiabetic subjects (resting subjects (n = 12) and exercising subjects (n = 12)) who were each given a mixed-meal tolerance test. Metabolic tracers were used to quantify the glucose flux. Simulations reasonably agree with postprandial measurements of BG concentration and EGP during exercise. Exercise-induced capillary recruitment is predicted to increase glucose transport to SM by 100%, causing hypoglycemia. When recruitment is blunted, as in those with capillary dysfunction, the opposite occurs and higher than expected BG levels are predicted. Model simulations show how three important exercise-induced phenomena interact, impacting BG concentrations. This model describes nondiabetic subjects, but it is a first step to a model that describes glucose dynamics during exercise in those with type 1 diabetes (T1D). Clinicians and engineers can use the insights gained from the model simulations to better understand the connection between exercise and glucose dynamics and ultimately help patients with T1D make more informed insulin dosing decisions around exercise.
Keywords: Glucose dynamics, Exercise, Modeling, Kinetics, Capillary recruitment, Type 1 diabetes, Artificial pancreas, Endogenous glucose production, Metabolic tracers
Introduction
Only four grams of glucose exist in the adult human circulatory system [1]. During heavy exercise, this amount of glucose can be metabolized in less than 10 min [2]. To compensate for this rapid metabolism the human body possesses an outstanding glucose-control system to maintain glucose levels very near normal basal levels, even during rigorous exercise. Unfortunately, because of the inability to produce insulin endogenously, the glucose-control system is faulty in those with type 1 diabetes (T1D). In cases of extremely high glucose, diabetic ketoacidosis (DKA) may occur, which can be life threatening. Another complication that can result from exercise, specifically for those with diabetes that are on short-acting insulin therapy, is severe hypoglycemia. This can occur because insulin-on-board following an injection cannot be downregulated, unlike in healthy subjects where endogenous insulin secretion is downregulated during exercise [3, 4].
A model of insulin-glucose dynamics during exercise can further our understanding of how physiology and dosing decisions may affect glucose levels during exercise. This knowledge is useful for clinicians and medical device engineers working on the artificial pancreas (AP) and decision support systems (DSS).
The goal of this work is to integrate knowledge of several measurable glucose regulatory processes known to change acutely during exercise into a single coherent mathematical model. The model presented in this paper describes the glucose dynamics of a nondiabetic subject during exercise, and is a first step to creating a model to describe the glucose physiology of a subject with diabetes. A full model for persons with diabetes will be developed in subsequent work.
Several pharmacokinetic-pharmacodynamic models (PKPD) of insulin-glucose dynamics exist in the literature, and range from minimal and simple [5] to broad and complex [6–8]. Some of the most popular models are the oral minimal model (OMM) developed by Bergman and Cobelli [5, 9], the glucose-insulin meal (GIM) model developed by Dalla Man and Cobelli [8, 10], and the Sorensen model [7]. All three of these models were originally derived to model insulin-glucose dynamics during rest, but since their inception they have been amended in various ways to account for exercise [11–14].
Each of the previously described models has its own benefits and drawbacks. The OMM, as its name suggests, has the advantage of containing the ‘minimal’ amount of variables and parameters needed to represent a subject’s insulin-glucose dynamics. However, due to the limited model structure, it can only be applied in very limited situations and significant modifications would need to be made to amend fully the model for exercise conditions. The GIM is a more comprehensive and better validated insulin-glucose model, and is the basis for the UVa/Padova Simulator which has been accepted by the Food and Drug Administration as a replacement for animal trials in T1D closed-loop controller studies [15]. An exercise module has been added to the GIM [13], and provides reasonable predictions. However, various important effects, such as exercise effects on endogenous glucose production, have not yet been included directly. The Sorensen model [7] is one of the most maximal and comprehensive models available, with a total of 15 compartments used to represent insulin-glucose dynamics. Roy and Lenart [14] amended the Sorensen model to include the effects of exercise. However, because of the complexity of the model, it is not clear how and to what degree their amendments violated the original model assumptions. For example, some parameters, such as the rate constant of glucose movement from blood to interstitial fluid, are known to change because of enhanced blood flow and capillary recruitment. In all of these models this parameter was kept the same from rest to exercise, which likely violates the original assumption of glucose transport to interstitial fluid (ISF) in the resting state. Despite the mentioned limitations, each of these three models has made significant contributions to our understanding of insulin-glucose dynamics. For example, the GIM model has allowed us to understand and model diurnal variation in insulin sensitivity. Still, none of these models were developed with the specific purpose of understanding the effects of exercise on glucose dynamics, and hence did not include several important phenomena that should be included in the underlying structure of the model.
Exercise is known to (1) increase endogenous glucose production (EGP) to keep up with glucose demand [16, 17], (2) increase glucose utilization in exercising tissue [2], and (3) induce capillary recruitment which increases the available capillary surface area in peripheral tissues, expediting nutrient exchange between the circulatory system and skeletal muscle [18]. All three of these phenomena play a critical role in maintaining glucose homeostasis during exercise, and have been included in the present model. To the authors’ knowledge, the third effect, capillary recruitment, has never been included in a mathematical model of insulin-glucose dynamics, and is one of the significant novel aspects of the present work.
Keeping with the principle of parsimony, our base glucose model has two compartments, similar to the description by Dalla Man in the GIM model [8, 10]. The main places where our model differs from the GIM is in our descriptions of EGP, liver glucose uptake, and changes in the rate of glucose uptake by peripheral tissues brought on by exercise.
With the present model we examine how these three effects work in concert to maintain glucose homeostasis in healthy nondiabetic subjects. Through simulation we show how physiological dysfunction, such as an inability to recruit capillaries [19], can cause glucose intolerance.
First, in section “Methods” we give a brief overview of the model derivation, with many details relegated to the supplementary material. In section “Results”, a number of test cases are simulated during rest and exercise, and compared to data taken from two cohorts of healthy nondiabetic subjects, one in resting state and one during exercise. In section “Discussion”, insights, model strengths, and limitations are discussed.
Methods
Model development
The purpose of this work is to evaluate the acute (i.e. immediate) effects of exercise on glucose dynamics. We are not focused on considering the prolonged effects of exercise, such as changes in insulin sensitivity. We created a PKPD model that focuses on three significant acute effects of exercise:
the increase in the rate of endogenous glucose production (EGP) that results from the necessity to keep up with increased glucose demand
the increase in the rate of glucose uptake (RGU) in peripheral tissues that results from the energy needs of muscle contractions
the increase in the rate of glucose delivery from the circulatory system to skeletal muscle tissues (a.k.a. the glucose delivery mass flow rate or glucose uptake by capillaries) that results from capillary recruitment
The present model consists of two domains, the circulatory system (CS) domain and the skeletal muscle (SM) domain. The SM domain actually consists of subcutaneous (SC) tissue and skeletal muscle tissue, but we treat these two tissue groups as one domain. A simple schematic of the model is shown in Fig. 1. The liver is not treated as a separate compartment, and is modeled as a sink from the CS compartment. We account for metabolism in other regions of the body by including glucose sources and sinks.
Fig. 1.
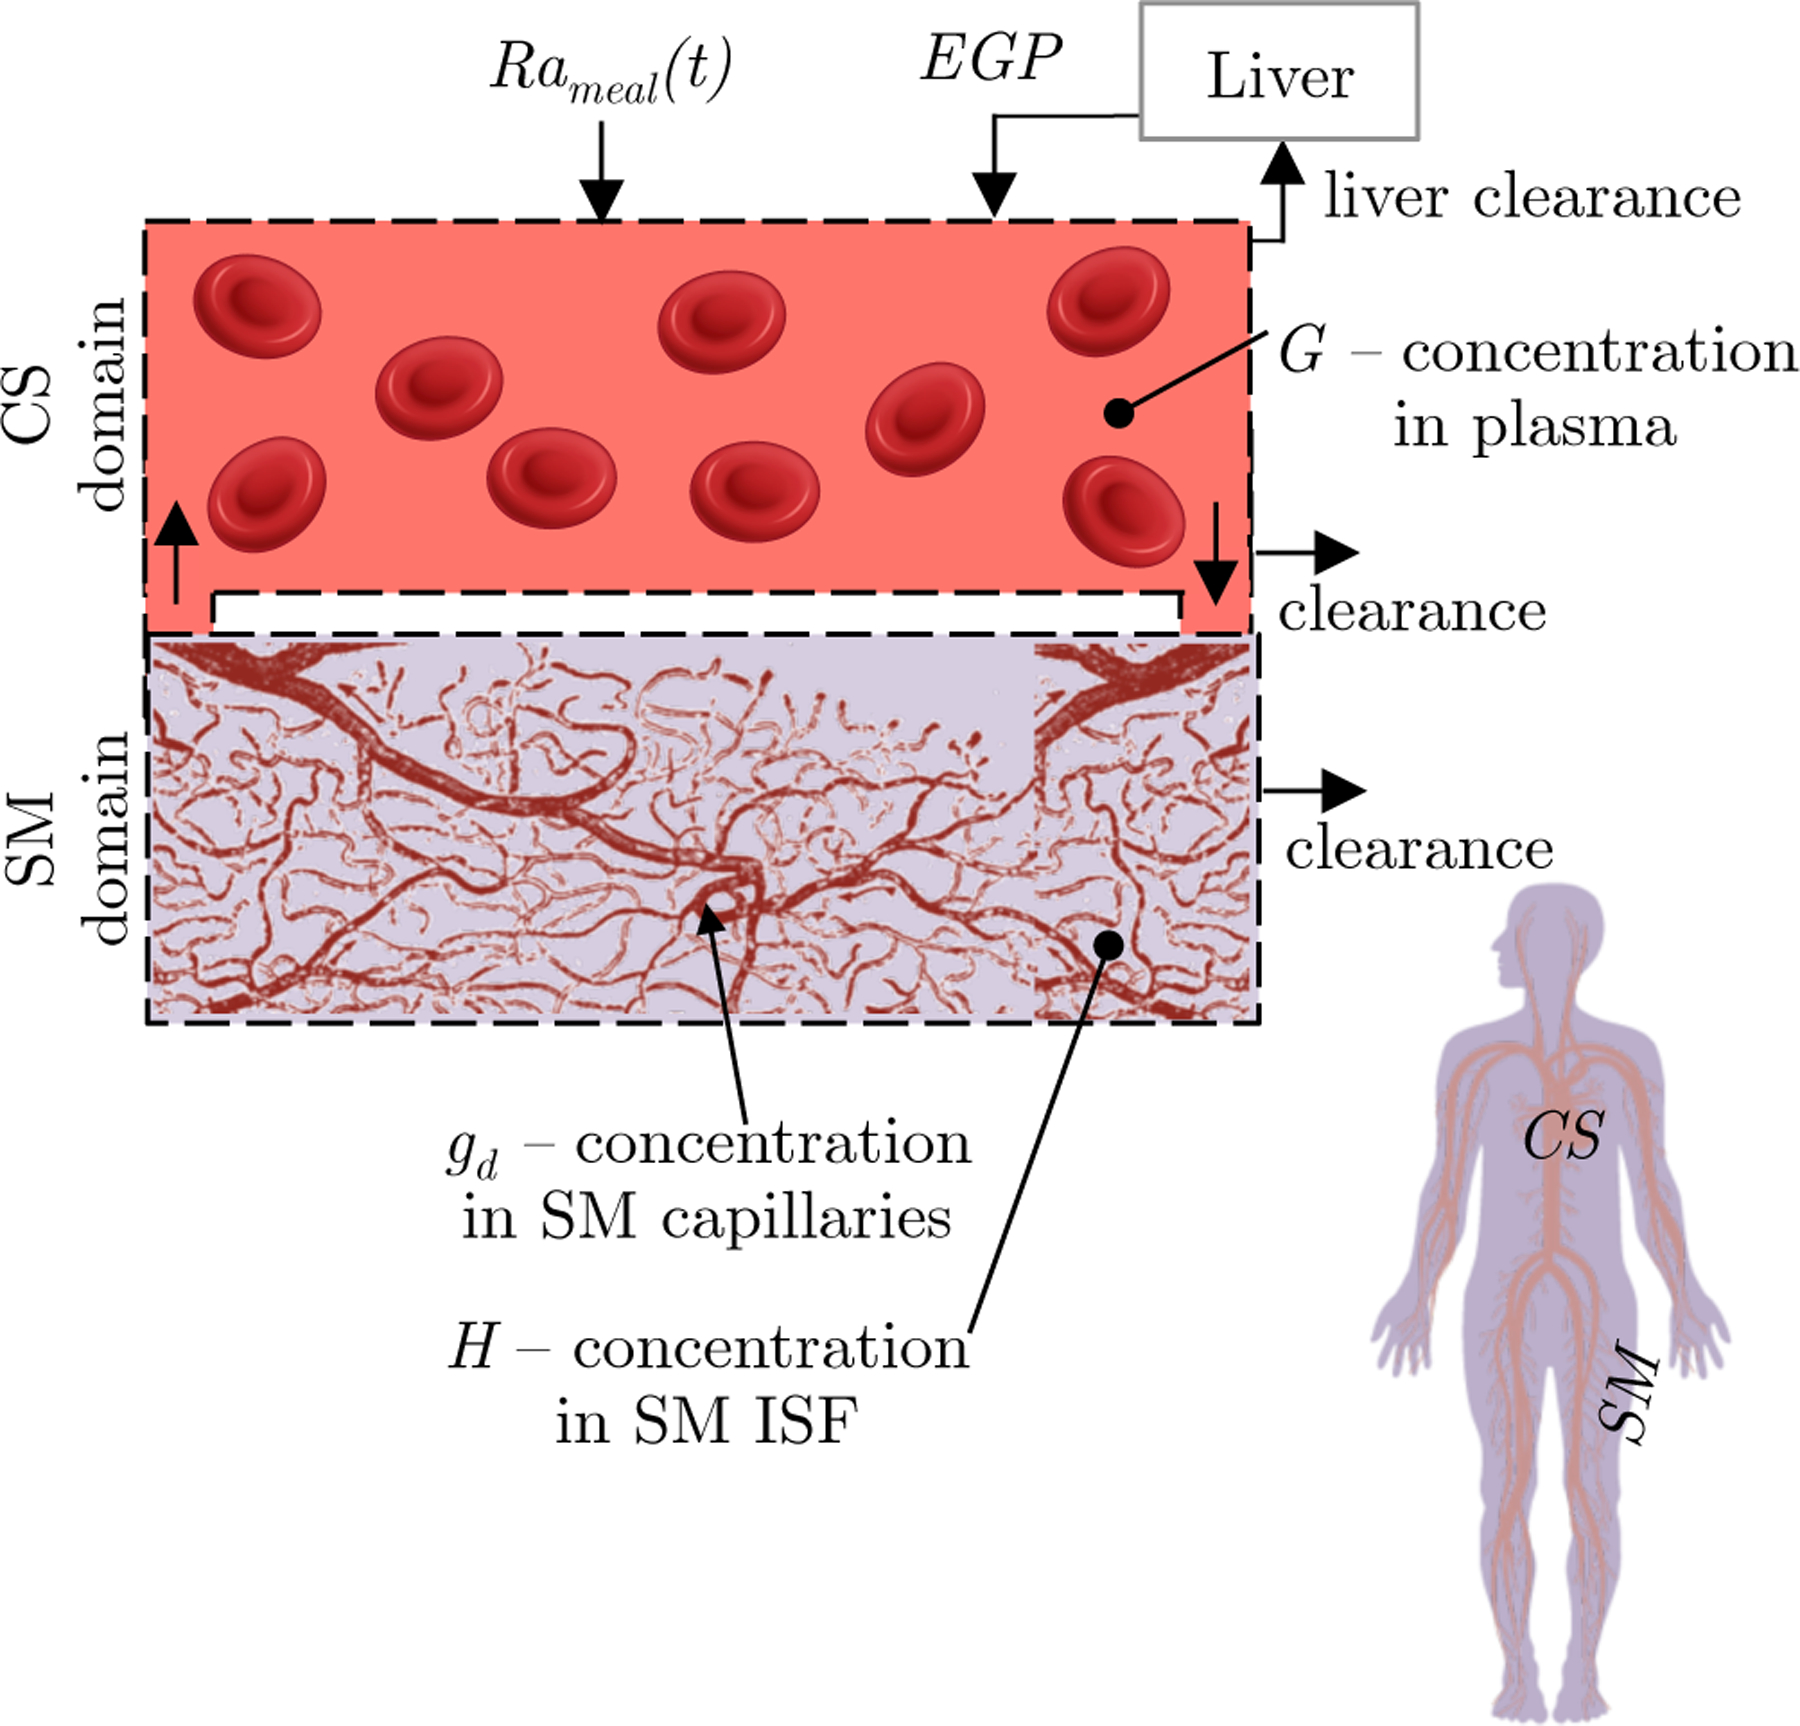
Physiological representation of the glucose dynamics model. The model consists of two distinct domains: the CS domain, and the SM domain. The SM comprises capillaries and ISF. The human silhouette illustrates the relative size of each domain by color. Glucose originates from either the gastrointestinal (GI) tract (Rameal) or the liver (EGP) and enters the CS. Glucose moves from the CS to the SM by penetrating capillary walls. The model is multiscale with dynamics of the capillaries modeled at the microscale and dynamics of the fluid volumes in the CS and SM modeled at the macroscale
We utilize a multiscale modeling approach to include the three listed effects of exercise on glucose dynamics. The dynamics of the broad CS and SM domains are modeled at the macroscale by a compartmental modeling approach. The dynamics of capillary recruitment are modeled at the microscale with the convection diffusion equation. Figure 1 illustrates the multiscale modeling approach.
Model summary
The governing equations of the final glucose model are
| (1) |
| (2) |
| (3) |
| (4) |
| (5) |
The complete model is a system of five non-linear ordinary differential equations with non-constant coefficients. All the parameters of the model are defined in Table 1. Equation 1 describes G, the concentration of glucose in plasma, as a function of meal intake (the rate of meal appearance , EGP, and glucose uptake and delivery to other compartments. Equation 2 describes H, the glucose concentration in the SM ISF, as a function of diffusion from the CS and uptake by cells. Plasma insulin concentration I(t) and exercise intensity E(t) are inputs to the system (I(t) traces can be found in [20, 21]). S is the ISF insulin concentration in the SM domain. M and L are not concrete physiological variables: M is a multiplier that describes glucose uptake by the liver , adapted from Sorensen [7] and L is a multiplier called exercise-action on EGP.
Table 1.
Parameters used in glucose dynamics model for healthy nondiabetic subjects
| Parameter | Description | Unit | Value | Source |
|---|---|---|---|---|
| Metabolic clearance rate of glucose in the brain | mg/min | 71 | [32, p. 219] | |
| Metabolic clearance rate of glucose in the heart | mg/min | 3.7 | [32, p. 219] | |
| Metabolic clearance rate of glucose in the kidneys | mg/min | 3.7 | [32, p. 219] | |
| Metabolic clearance rate of glucose in the gut | mg/min | 16.6b | [32, p. 219] | |
| Basal metabolic clearance rate of glucose in the peripheral tissue | mg/min | 45.2 | [32, p. 219] | |
| Basal metabolic clearance rate of glucose in the liver | mg/min | 14.8b | [32, p. 219] | |
| Insulin sensitivity of glucose clearance in skeletal muscle | mg/min per lU/mL | 5 | [34] | |
| Exercise sensitivity of glucose clearance in skeletal muscle | mg/min per E | 860 | [2, 16, 17, 35, 36]c | |
| Normalized volume of distribution of glucose in circulatory system | mL/kga | 0.7 | [7] | |
| Normalized volume of distribution of glucose in skeletal muscle | mL/kga | 0.96 | [7] | |
| Normalized volume of tissue in skeletal muscle | mL/kga | 540 | [41] | |
| τliv | Time lag of insulin action of liver glucose uptake | min | 25 | [7] |
| Tissue perfusion rate in skeletal muscle tissue at rest | mLb/mLtiss/min | 0.038 | [41] | |
| Capillary permeability surface area to glucose during rest | mLb/mLtiss/min | 0.01 | [38–40] | |
| Rd | Capillary recruitment factor in skeletal muscle tissue | 1 | 1.46 | [19, 56, 57]c |
| γ | Capillary recruitment saturation rate | 1 | 10 | [19, 56, 57]c |
| λd | Sensitivity of tissue perfusion rate to exercise | mLb/mLtiss/min per E | 1.1 | [37] |
| τEGP | Time lag of exercise action on endogenous glucose production | min | 20 | [16, 17]c |
| η | Maximum exercise action on endogenous glucose production | 1 | 4 | [16, 17]c |
| Normalized volume of distribution of insulin in skeletal muscle | mL/kga | 1.2 | [7, 42] | |
| Normalized metabolic clearance rate of insulin in skeletal muscle | 1/min | 0.02 | [58–60]c | |
| Capillary permeability surface area to insulin during rest | mLb/mLtiss/min | 0.005 | [39, 40] | |
| h | Hematocrit percentage in blood | 1 | 0.4 | [43] |
The various RGU and EGP are defined as
| (6) |
| (7) |
| (8) |
| (9) |
| (10) |
Subscript b represents basal concentrations. rG is the rate of glucose uptake, with the subscript denoting the domain, and the second subscript denoting other specifying information, such as whether in the fixed rate tissues (fix) or liver tissue (liv). Equation 6 describes uptake in the fixed rate tissues . Equation 7 describes uptake by the liver, and because developing a liver uptake model is beyond the scope of this work, we adopted this model from Sorensen [7]. Equations 8 and 9 describes insulin-induced and exercise-induced uptake in the peripheral tissues, respectively. Equation 10 describes endogenous glucose production.
The kinetic rates k in Eqs. 1–3 depend on E(t) through tissue perfusion rate Q and tissue permeability surface area PS and are defined as
| (11) |
| (12) |
| (13) |
| (14) |
| (15) |
| (16) |
Qd is the total blood perfusion rate and is only the plasma perfusion rate. The difference is the h = 0.4 hematocrit which is included because insulin is mainly confined to plasma. and are the permeability surface area of glucose and insulin, respectively, and represent the increase in surface area that accompanies capillary recruitment.
The initial conditions are found by evaluating the model at basal resting and fasting conditions (G = Gb, H = Hb, S = Sb, E = 0, Rameal = 0, EGPb is set to be equal and opposite to total RGU):
| (17) |
| (18) |
| (19) |
| (20) |
| (21) |
The subscript data indicates that direct measurements of the basal value of G and I are used. M is initially 1 because this gives basal . L is initially 0 because we assume that the subject is initially at rest.
Brief derivation notes
For brevity, the details of the glucose model derivation are described in the supplementary material. Here we provide a brief description of the model assumptions and novel derivation steps.
In deriving our expression for the CS compartment (Eq. 1) we assume glucose is well-mixed. Lacking information on the effects of exercise on glucose uptake in the fixed-rate organs (Eq. 6) and the liver (Eq. 7), we assume that and do not depend on E.
In deriving our expression for the SM compartment we lump the peripheral tissues of the body (SM and SC tissue) and again assume well-mixed. This compartment includes the delivering capillaries (capillaries that perfuse the peripheral tissues) and the ISF. Glucose uptake from the SM domain can occur from either insulin-induced (Eq. 8) or exercise-induced mechanisms (Eq. 9) [1]. Each of these mechanisms is postulated to be dependent on recruitment of the GLUT4 transporter to the cell membrane [1, 22–24], which facilitates glucose uptake by cells. Data on synergistic interactions is sparse and thus we assume the two effects are purely additive - however whether or not the insulin and exercise effects are additive is still an ongoing debate [1, 2, 22]. We call and the insulin sensitivity and exercise sensitivity on glucose uptake in skeletal muscle, respectively.
In our uptake expressions and we assume that cellular uptake is a diffusive process driven by a linear glucose gradient and that the cell membrane permeability is linearly proportional to the surrounding insulin concentration S and the exercise intensity E (see schematic in supplementary material Fig. 8). We have also implicitly assumed that and are non-saturable. Non-saturability has been assumed because RGU doesn’t significantly deviate from linear behavior until very high glucose concentration > 250 [mg/dL] [25]. This is a good assumption for a nondiabetic subject, however, in a T1D subject, non-saturability may be a poor assumption.
In modeling the kinetic aspects, we assume glucose is delivered by diffusion from the CS into the SM tissue by permeating capillary walls through endothelial pores and junctions [26]. The glucose concentration gd in a delivering capillary is governed by the cylindrically symmetric convection-diffusion equation with axial flow and diffusion at the walls. We solve the differential equation by assuming a homogeneous capillary bed to obtain Eq. 43 (shown in supplementary material). In the real case the capillary bed is heterogeneous, and thus our homogeneous assumption may prevent us from capturing some non-linear effects [27].
Using Eq. 43 we couple the CS and SM domains to obtain kd shown in Eqs. 11 and 12. A similar solution was previously derived for the purposes of studying the microcirculation and nutrient delivery by Renkin [27, 28]. We have independently derived our expression of kd for the purposes of modeling insulin/glucose delivery during exercise.
kd depends on the ratio of permeability surface area PSd to tissue perfusion rate Qd and the relative values determine whether transport is surface area limited (diffusion limited) or flow limited. For typical glucose parameters is less than 1, but not small compared to 1, and so glucose transport is neither flow limited nor surface area limited. Exercise-induced capillary recruitment increases and Qd, increasing the delivery rate (See Fig. 4), and pushing transport to be surface area limited.
Fig. 4.

The model of permeability surface area (Eq. 15) simulates a rapid increase in surface area with exercise, and reaches a plateau value at only E = 0.25. The plateau exists because there is a finite reservoir of capillaries in the tissue and once they are all fully perfused surface area can no longer increase. The delivery rate (Eq. 11) similarly increases
(Eq. 12) is the insulin delivery rate and is modeled identically to but with different parameters. Details of can be found in [29].
The main difference of our glucose kinetics description from other previously published models is that we allow for changes in the rate constant governing movement of glucose between compartments, , to change with exercise. The previously published models did not account for this exercise-induced change in kinetics [11–14].
Model of endogenous glucose production
A distinct novelty of this work is that we have direct measurements of EGP, EGPdata, that can be used as an input into the glucose dynamics model. However, the limitation of using EGPdata as an input is that it is only valid under the original conditions of measurement. We wish to predict glucose dynamics under conditions other than those of the original experiment, for example when exercise occurs in the fasting state (not shown). To do this we have developed an EGP model using our knowledge of physiology and data from the literature. The predictions of this model are then validated on the current EGPdata that was acquired using the triple-tracer technique [30].
We assume a mathematical form for EGP (Eq. 10) where EGPb is the basal value of EGP, set to be equal and opposite to the total rate of glucose uptake under basal conditions. EGP is further assumed to be inversely proportional to G and S based on observations of near complete EGP suppression following a meal [20, 21].
Next, we create a new pharmacodynamic variable L, which we call the exercise-action on EGP and is governed by an ODE that takes exercise intensity E as its input (Eq. 5). L is a pharmacodynamic variable that can be thought of as a proxy for glucagon, which is known to increase during exercise. The parameter η is the maximum exercise-action on EGP. For example, an η=2 [unitless] allows EGP to increase by a maximum of 200% as a result of exercise. The parameter τEGP is the time-constant that represents the time-lag of exercise-action on EGP. L is delayed because changes in EGP due to exercise are known to lag the onset of exercise [16, 17, 20]. Details of parameter selection for the EGP model are given in Sect. 2.5.3.
Inputs and parameters
E(t), , and I(t) are the three measured model inputs. Then, the model parameters are either taken directly from the literature, fit from data found in literature, or derived from physiological assumptions of system dynamics. All the parameters are summarized in Table 1.
Exercise intensity, E
For the inputs and parameters that are dependent on exercise, we introduce E to quantify exercise intensity. We define E, as a fraction of
E is a continuous input to the glucose dynamics model. We consider E to be the exercise signal above rest. When the subject is at rest E = 0, and when the subject is at maximal exercise E = 1.
Measured glucose fluxes Rameal and EGPdata
Two glucose fluxes, Rameal and EGPdata, are measured using the triple-tracer technique (originally measured for a separate study [20], and their use for the present study is secondary). EGPdata is not used as a model input, rather we use our model of EGP(G, S, L(E)) and compare predictions to EGPdata in the results section.
Average measurements of Rameal and EGPdata following a 75 [g] carbohydrate (CHO) meal in healthy nondiabetic resting subjects and exercising subjects are shown in Fig. 2. Notice that EGPdata rapidly increases during exercise. We have post-processed EGPdata by forcing the basal value of EGP to be 155 [mg/min], consistent with the average basal EGP found in literature [16, 17]. Rameal was also post-processed so that the total glucose absorbed into the bloodstream is equal to 90% of the total ingested glucose, consistent with the early findings of Radziuk [31].
Fig. 2.

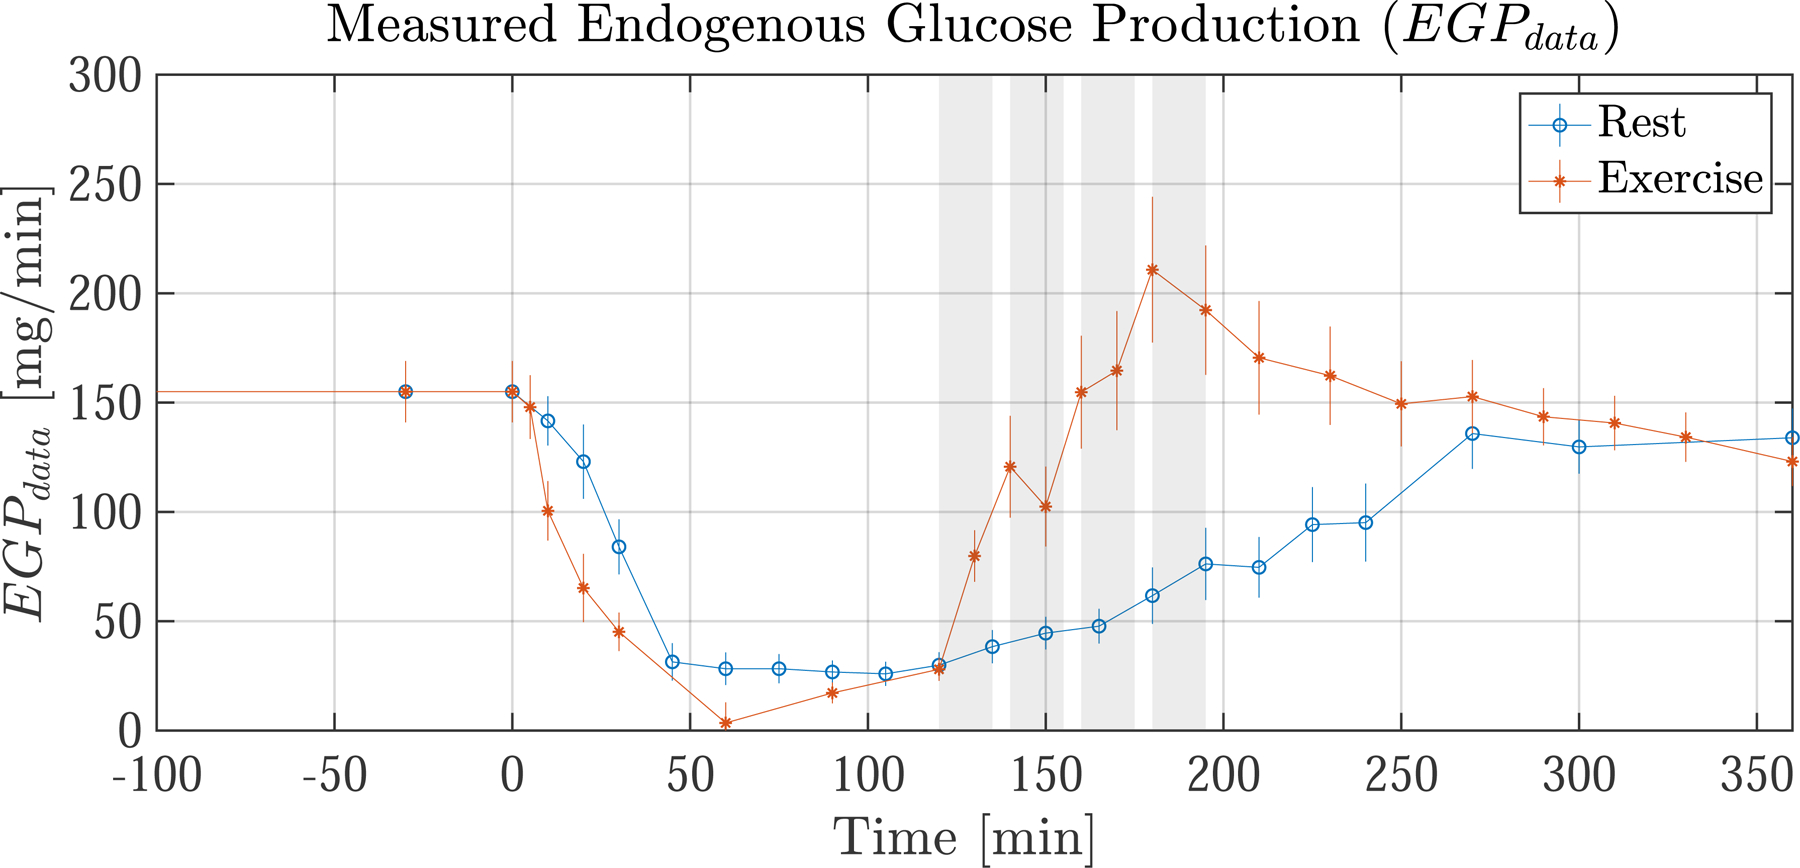
Average glucose flux measurements from healthy nondiabetic resting subjects (blue) and exercising subjects (orange). (top) Measured rate of meal appearance (Rameal), which is used as an input to the model. (bottom) Measured endogenous glucose production (EGPdata) which is not an input but is used for comparison to the EGP model predictions (see Fig. 6). Meal ingestion occurs at t= 0. The exercising subjects have four 15 min exercise bouts from t = 120–195 shown by shaded regions (shaded regions do not apply to resting subjects). During exercise EGPdata is seen to increase rapidly. Error bars indicate the standard error of the mean (SEM)
EGP model parameters
The EGP model contains two parameters, τEGP and η. These parameters are estimated from independent data taken from two studies by Ahlborg where EGP was measured during exercise at 60% [16] and 30% [17]. The data from these studies is referred to as , not to be confused with the present study data EGPdata. The model fit is shown in Fig. 3 (left). The estimated parameters are τEGP=20 [min] and η=4 [unitless]. The EGP model was fit in a least-squares sense (R2 = 97.5) to all measurements taken prior to t = 120 min.
Fig. 3.

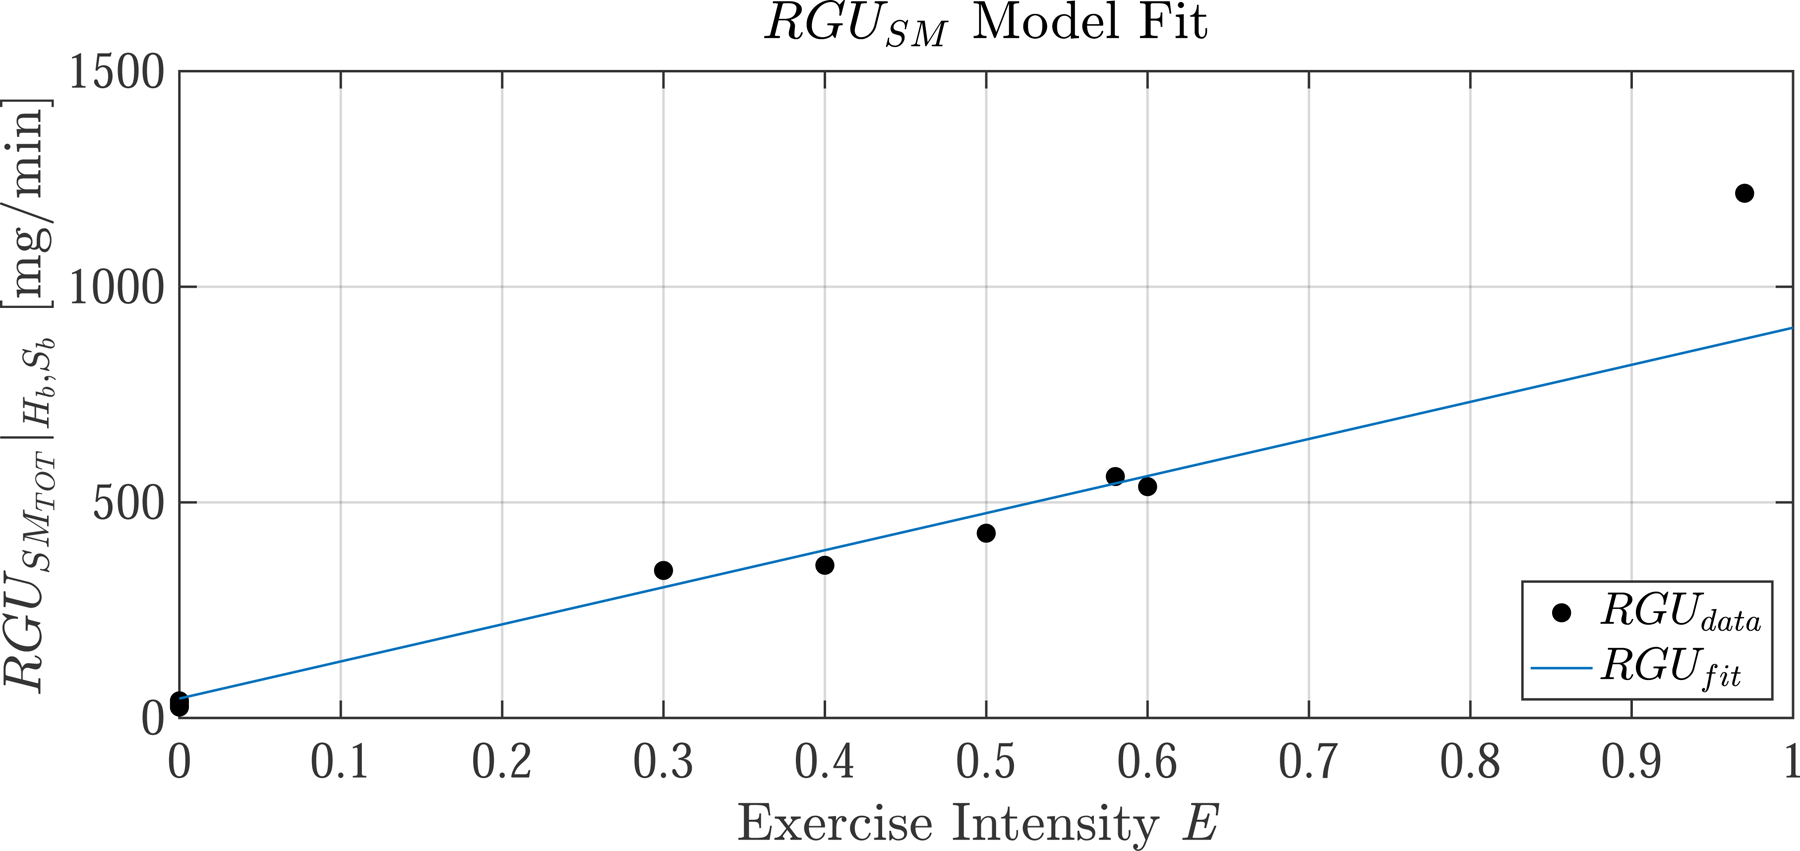
(left) The identified EGP model is simulated at two intensities (E=0.3 and E=0.6) and compared to data taken from two independent studies (dots,). Data points taken after prolonged exercise are neglected, as the present EGP model does not account for glycogen depletion and thus is not valid beyond two hours of continuous exercise. (right) The identified model of rate of glucose uptake in skeletal muscle (, Eq. 40, blue line), held at at basal glucose Hb and basal insulin Sb, is compared to data aggregated from literature [2, 16, 17, 35, 36]. During parameter identification, the E = 0.9 data point is excluded, and thus the model is not valid for high intensity exercise E > 0.75. Model parameters were identified by least-squares curve fitting: R2 = 97.5 for the EGP model (excluding points beyond t = 120 [min]) and R2 = 85.8 for the RGU model (excluding points beyond E = 0.75)
Rate of glucose uptake from the circulatory system, RGUCS
The RGU of the fixed rate organs (brain, heart, gut, and kidneys) were taken from [32, p. 219]. For the liver, we have adapted a model of the rate of liver glucose uptake (Eq. 7) developed by Sorensen [7]. In the original Sorensen model, depended on the glucose and insulin concentration in the liver. In our model, we have not included the liver as a separate compartment, and we instead assume that uptake is dependent on G and S. This should be a reasonable modification, as the time-lag between our remote compartment should be similar to the time-lag in Sorensen’s liver compartment. The basal rate of liver uptake, , is set to 15 [mg/min], a slight downward adjustment from 20 [mg/min] used by Sorensen. This ensured that RGUliver is approximately equal to 50% of total glucose ingested, which is consistent with a study by Ferrannini [33].
Rate of glucose uptake from the skeletal muscle, RGUSM
The RGU in skeletal muscle is described by Eqs. 8 and 9. There are three parameters , , and which represent, respectively, the metabolic clearance rate due to insulin (i.e. insulin sensitivity), the metabolic clearance rate due to exercise (i.e. exercise sensitivity), and the metabolic clearance rate at resting basal conditions.
We use data from Castillo and Bergman [34] to estimate insulin sensitivity of [mg/min per µU/mL]. We set [mg/min] from [32, p. 219]. For , we utilize data from several studies on leg glucose uptake during exercise. Each study was carried out at basal glucose and insulin concentrations so we evaluate total at H = Hb and S = Sb and fit the resulting linear function to the measured RGU data at different exercise intensities from [2, 16, 17, 35, 36]. is plotted in Fig. 3 (right) and the resulting slope is [mg/min] per unit E. The linear regression fits well (R2 = 85.8) in the range of moderate-exercise intensities but underestimates uptake in the high-intensity range because of non-linearity. We have specifically neglected the E=0.9 data point when carrying out the curve fit, and hence RGUSM may not be valid for high intensity exercise above 75 %.
Capillary bed parameters, Q and PS
We use the data of Saltin [37] to define a linear relationship between Qd and E, shown in Equation 13.
The increase in PS that results from capillary recruitment during muscle contractions is modeled as a saturable function (Eqs. 15 and 16). We define the recruitment factor Rd as the maximum proportional increase in PS. γ is a free parameter that serves to modulate how quickly the function reaches its plateau value. The parameters Rd and γ are derived in [29], and will not be re-derived here. Rd was estimated to be 1.46, signifying that capillary recruitment increases the surface area by almost 150% during exercise.
The only other parameter that needs to be estimated to fully define Eq. 15 is . For this, we take direct measurements from the literature [38, p. 33] [39, 40], which place in the range of 0.6–2.0 [mlb/100gtiss/min]. We choose [mlb/100gtiss/min] or 0.01 [mlb/mltiss/min]. is plotted vs. E in Fig. 4.
With expressions for Qd and it is illustrative to examine how the glucose delivery rate depends on E. By substituting Eqs. 13 and 15 into Eq. 11, we obtain the curve in Fig. 4. follows a path very similar to . This is because Qd is high during exercise, and thus flow is not the limiting factor in glucose delivery. Rather, the limiting factor in glucose delivery is surface-area, and so almost directly determines .
Volume parameters
Glucose in the CS is contained in both the plasma and the red blood cells (RBC) and we use . In the SM domain, glucose mainly distributes in the ISF and we use [7, p. 43]. The volume of tissue in the SM domain is estimated to be [41] indicating that 54% of body volume is SM and SC tissue.
Insulin model inputs and parameters
The insulin model parameters were derived in [29] and details are omitted here. The plasma insulin concentration I(t) is measured in each subject and the average is given as an input to the insulin model. The volume of distribution of insulin that we use in the SM domain is [7, 42, 43]. The normalized metabolic clearance rate of insulin from the SM is . The capillary permeability surface area to insulin is [29].
Simulation information
The equations constituting the model (1–16) were solved numerically with an explicit scheme on MATLAB R2017b. The timestep was 0.1 [min]. The initial conditions were found by solving Equations 17–21, at to = −420 [min] or 0000h (midnight) when glucose levels are relatively stable.
Human subjects data
The data used in this study comes from two separate inpatient research studies on healthy nondiabetic human subjects and is the secondary use of existing data. A summary of the demographic information is shown in Table 2. Detailed protocol and demographic information can be found in [20, 21]. Note, these two studies were not paired; different subjects were used for each group. We will refer to the resting group as ‘rest’ and the exercising group as ‘exercise’. To simulate an average subject in each cohort, we took the subject mean at each measurement time point and used this as the input.
Table 2.
Demographics of healthy nondiabetic subjects
In each study the start time of the mixed meal tolerance test (MMTT) was 0700, the meal size was 75 [g] CHO, the meal content was 55 % carbohydrate, 15% protein, and 30% fat, the number of subjects was n=12, and the triple-tracer protocol for measuring Rameal and EGPdata was the same [30]. The only significant difference in the studies is that one group exercised in the period from t =120 to 195 [min] following meal ingestion at t =0. Figure 5 shows the timeline for each protocol.
Fig. 5.


Timeline for the MMTT (top) resting protocol and (bottom) exercising protocol. Subjects in each group are healthy nondiabetics. At time 0 the subjects ingested a 75 [g] CHO mixed-meal. The resting group rested throughout the entire study period. The exercise group exercised at 50% for four 15 min exercise periods with 5 min breaks, starting at minute 120
For the study visit all subjects spent 40 h in the clinical research unit (CRU). The ‘exercising’ subjects did not engage in vigorous physical activities for 72 h before screen and study visits. On day 1 subjects were admitted to the CRU at 1600. They were then provided a standard 10 kcal/kg meal (55% carbohydrate, 15% protein, and 30% fat) consumed between 1700 and 1730. No additional food was provided until the next morning. On day 2 at 0600 h, an intravenous cannula was inserted retrogradely into a hand vein for periodic blood draws. The hand was placed in a heated (55C) Plexiglas box to enable drawing of arterialized-venous blood for glucose and hormone analyses. At 0700 the MMTT study containing 75 g of glucose was ingested (time 0). At 120 min following the first bite, the ‘exercising’ subjects stepped on a treadmill to exercise at moderate-intensity activity : i.e., four bouts of walking at 3–4 miles/h for 15 min with rest periods of 5 min between each walking bout. Lunch at 1300 and dinner at 1900 were provided, each meal contributing 33% of daily estimated caloric intake. The patient was discharged the next morning at 0800.
Results
We simulate the effects of exercise on glucose dynamics by examining three test cases: (1) Resting case and thus no capillary recruitment. The predictions are compared to data from the resting cohort in Fig. 6 (left), (2) Exercising case with capillary recruitment set to ‘on’, which is the default. Capillary function is considered normal. Simulation predictions are compared to data from the exercising cohort in Fig. 6 (right, solid line), and (3) exercising case with capillary recruitment turned ‘off’. The ‘off’ case is simulated by setting Rd and λd to 0, simulating capillary dysfunction. ‘off’ does not allow surface area or tissue perfusion to increase during exercise. Simulation predictions are also plotted in Fig. 6 (right, dotted line).
Fig. 6.
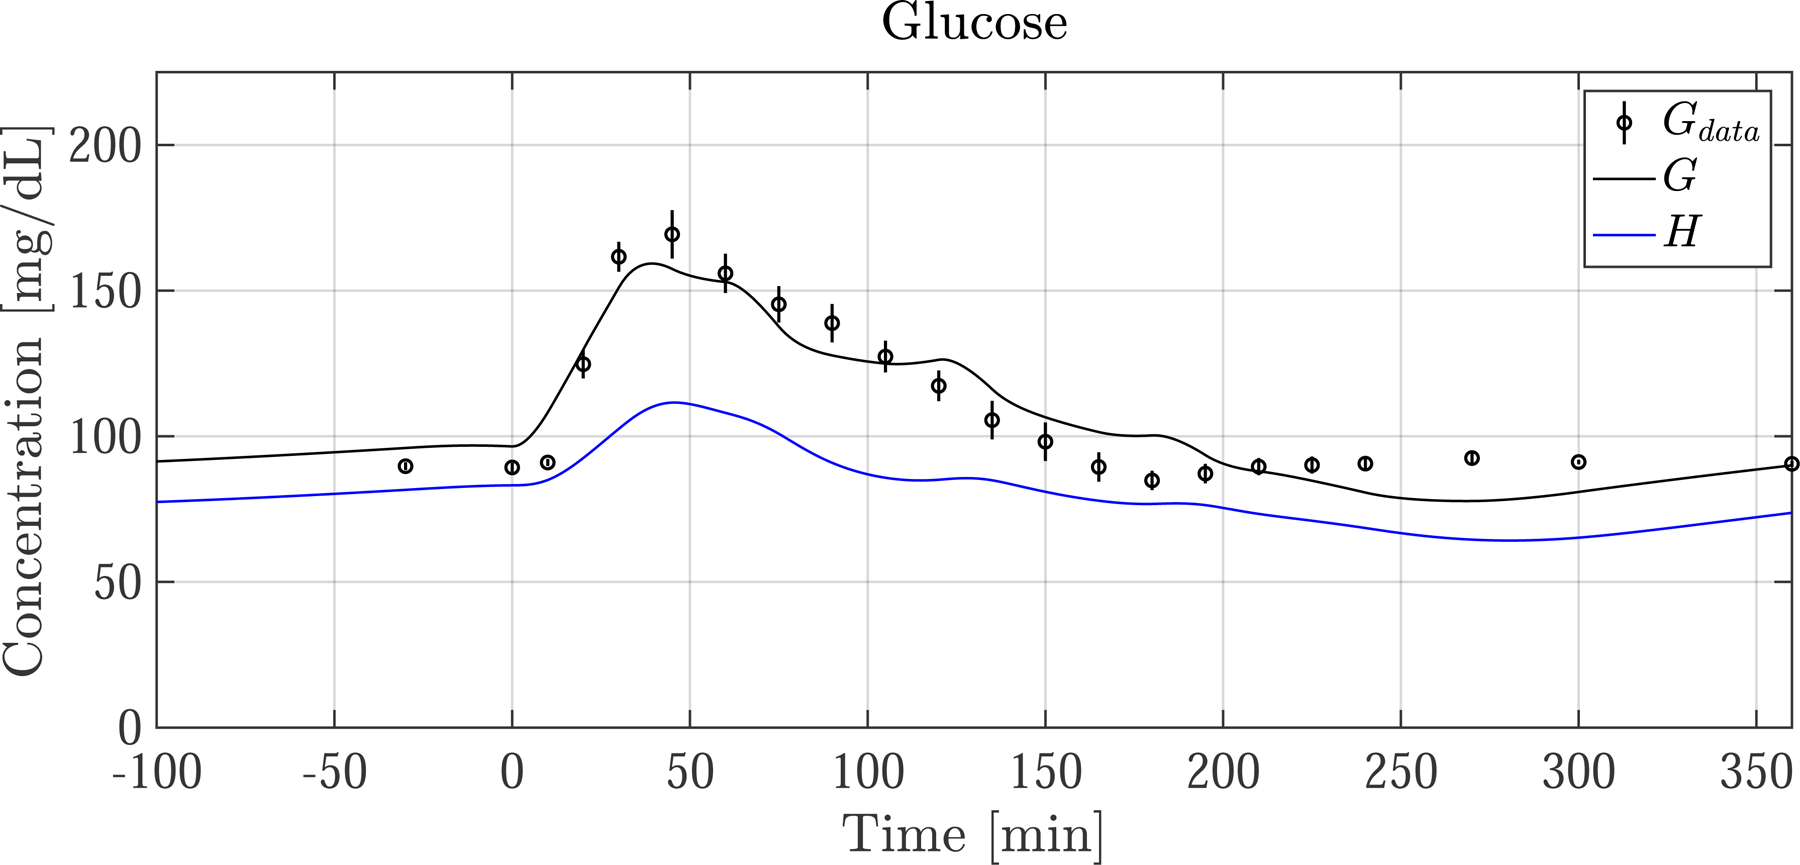
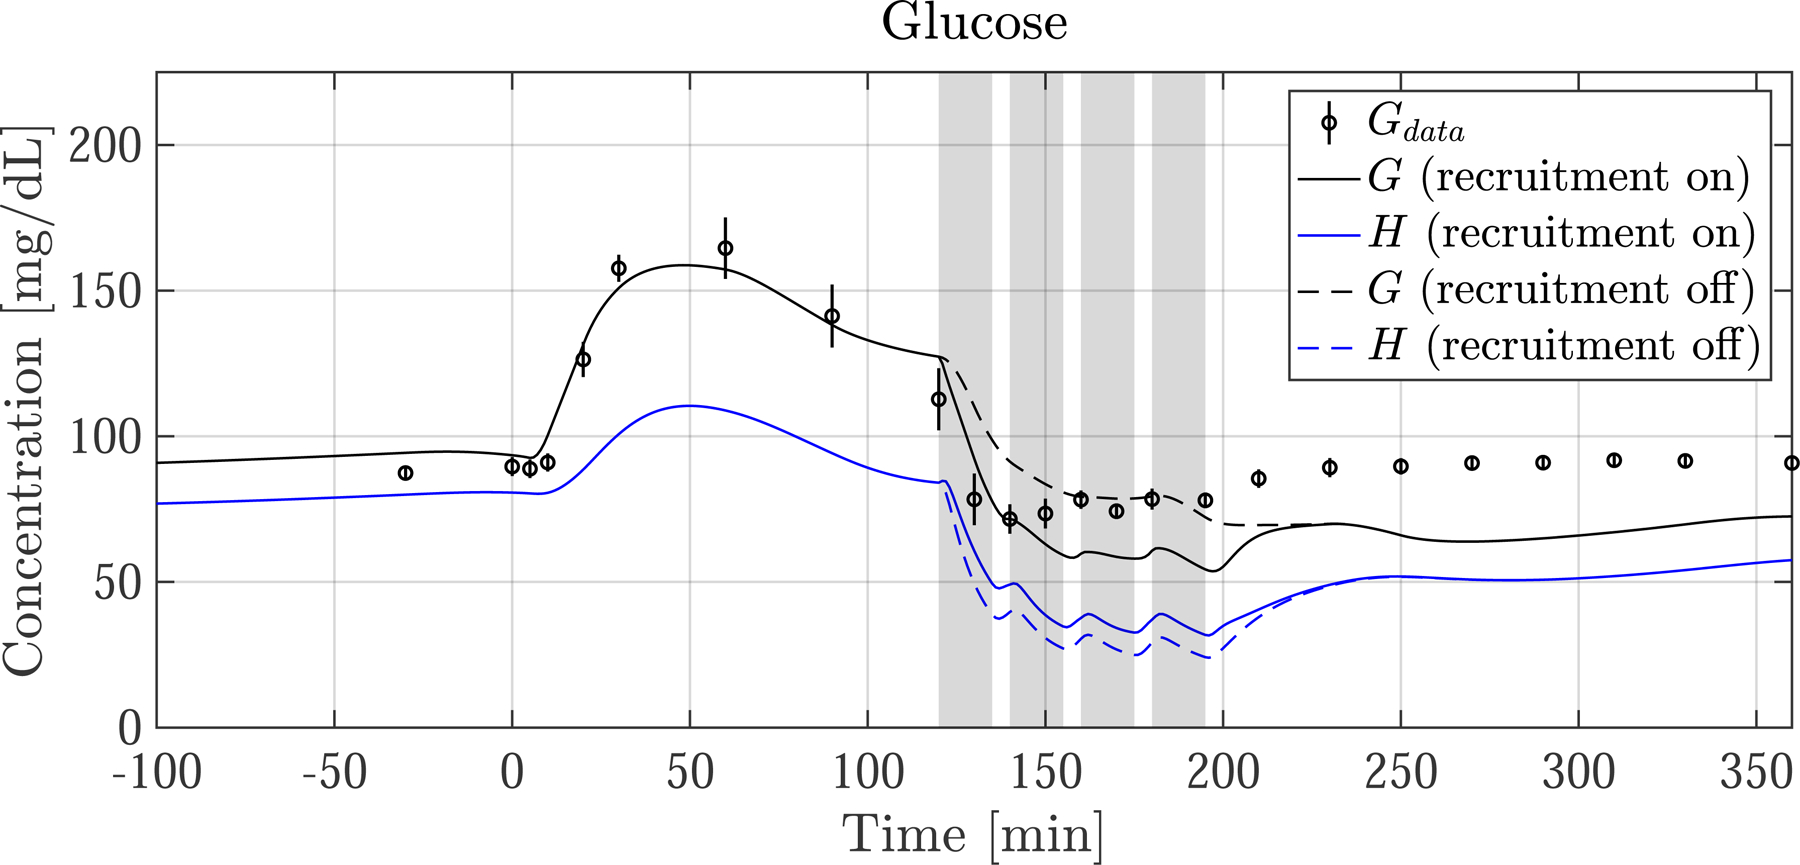


Postprandial G and EGP following a meal ingested at time 0. (left column) Average resting nondiabetic subject and (right column) average exercising nondiabetic subject. Measurements (dots) are shown with SEM as vertical lines. Model predictions of G are shown with measurement of plasma glucose concentration Gdata. Skeletal muscle glucose concentration H is also shown. The grey bars indicate the four 15 min exercise periods. The dotted lines show predictions when exercise-induced capillary recruitment is turned ‘off’. There is strong agreement between G and Gdata, as well as EGP and EGPdata. During exercise G is predicted to drop slightly more than Gdata indicates, consistent with EGP being slightly underestimated. After exercise ends, EGP drops and temporarily diverges from EGPdata. For the case when capillary recruitment is artificially turned ‘off’ (dotted lines), glucose delivery to SM is limited, and G is buoyed—illustrating how capillary dysfunction can keep glucose levels higher than normal during exercise
G and EGP (solid lines) refer to the simulated variables, and Gdata and EGPdata (black dots with vertical line representing SEM) refer to measurement.
The postprandial glucose and EGP responses are shown in Fig. 6 for the resting group and exercising group. There is good agreement of model predictions with measurements in both groups prior to exercise, with simulated G following a similar trajectory as the data for the first 120 min.
In the resting group, G and Gdata decay slowly after spiking and reach basal levels at around t = 160 [min]. In this same period the predicted EGP is almost completely suppressed to 0 [mg/min] until beginning to rise again around minute 150, consistent with EGPdata.
There are some noteworthy differences between the resting and exercising cohorts, even before exercise commences at t = 120. First, glucose is slightly rising in both cohorts, even before the meal is ingested at t = 0. This is because I and EGP were not in perfect steady-state prior to the meal, which is expected. Also, in the timeframe between 0 and 120 min, there is more suppression of EGPdata in the exercising cohort than in the resting cohort. This is because of biological variability and slight measurement errors between the cohorts, however the relative magnitude of these differences (5–25 [mg/min]) compared to Rameal (500 [mg/min]), makes its impact on G minimal. Lastly, there are some ”wobbles’’ in the G trajectory—this can be explained by slight noise in the measurement of Rameal, as seen in Fig. 2.
In the exercise simulation with recruitment ‘on’, (solid line, right panel of Fig. 6) G drops into hypoglycemia (<70 [mg/dL]) shortly after exercise begins, similar to Gdata. After entering hypoglycemic territory G no longer drops because of the significant increase in EGP, which quickly increases, peaking toward the end of the exercise period. The G and EGP predictions show jagged responses during exercise because of the 5 min break periods. After exercise ceases, predicted G stays in mild hypoglycemic territory and does not quickly rise back to basal levels. This is not consistent with Gdata which clearly returns to basal levels after exercise ends. This discrepancy can be explained by the underestimation of EGP following exercise.
Figure 7 shows model predictions of two often-used kinetics variables—the extraction fraction of glucose (efG) and the glucose delivery mass flow rate to SM , a.k.a. glucose uptake by capillaries. In our study ef G and are not measured directly. Instead, we use the developed model to express ef G and as derived quantities in terms of G and H. Section 12 in the supplementary material shows the details of how ef G and were calculated.
Fig. 7.
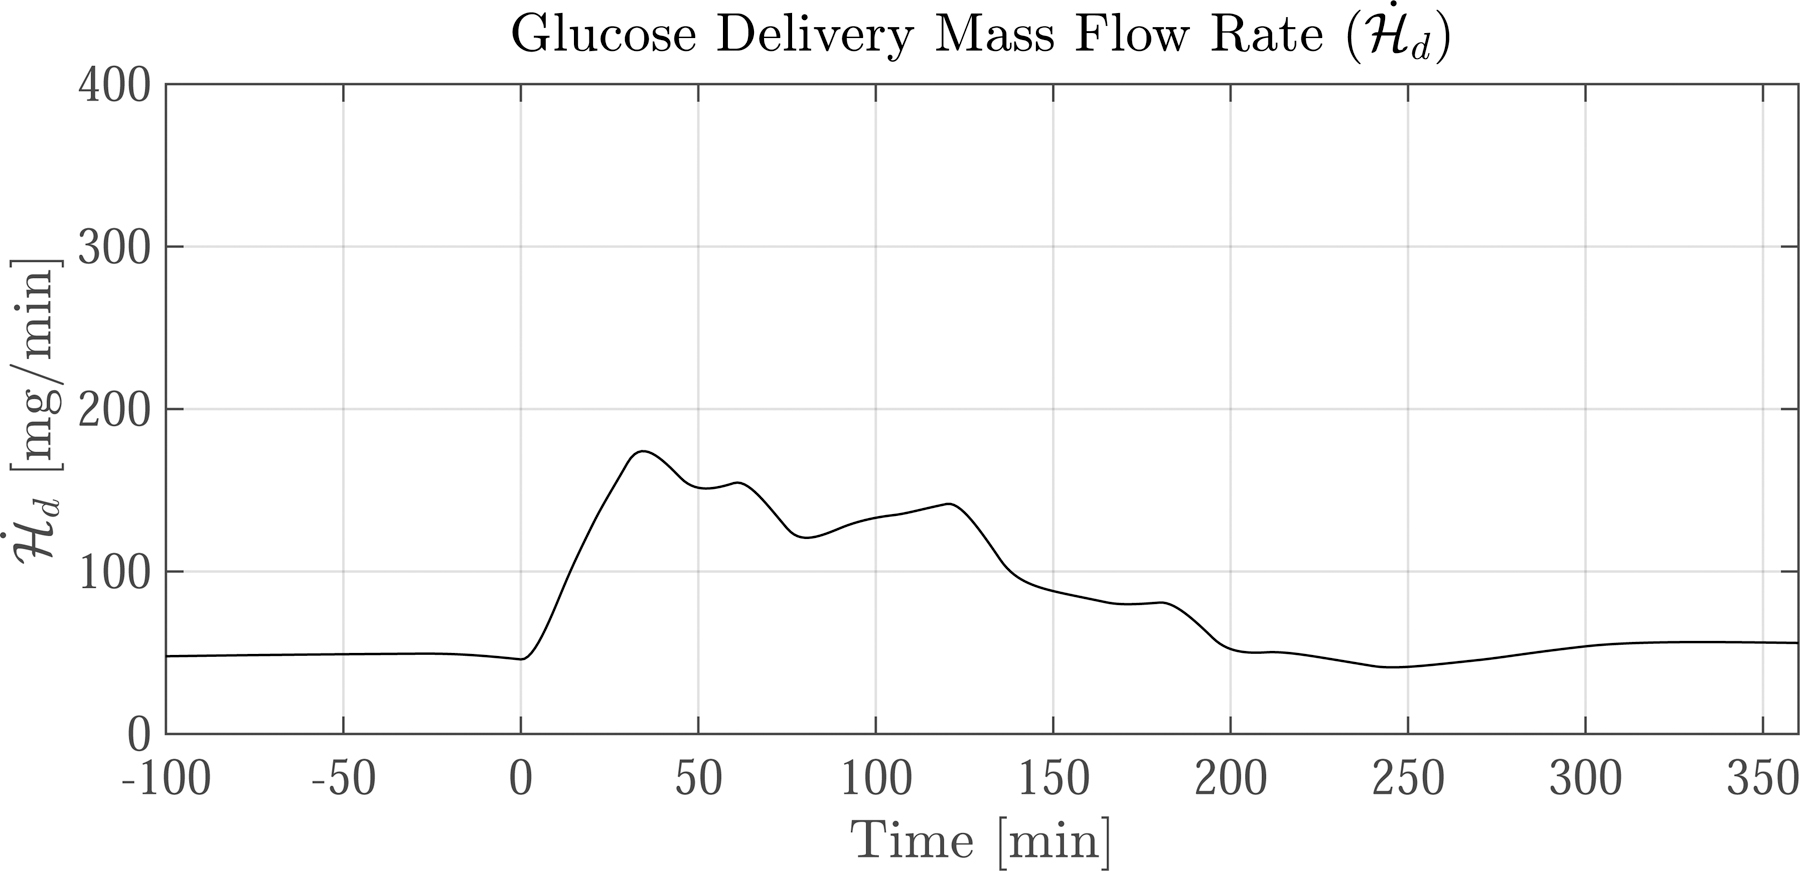


Predictions of extraction fraction (ef G) and glucose delivery mass flow rate following a meal ingested at time 0. (left column) Average resting nondiabetic subject and (right column) average exercising nondiabetic subject. The grey bars indicate the four 15 min exercise periods. The dotted lines show predictions for when exercise-induced capillary recruitment is turned ‘off’. The corresponding glucose dynamics are shown in Fig. 6. Upon meal ingestion, the ef G and increase concomitantly. After exercise commences the trajectories of ef G and diverge. ef G drops considerably because the 10-fold increase in blood flow reduces the capillary transit time—but despite the drop in ef G, increases by over 100% during exercise because of increased surface area. Notice that when capillary recruitment is turned ‘off’ (dotted lines), ef G increases while only marginally increases
The resulting ef G and are plotted in Fig. 7 for both the resting (left column) and exercising (right column) cases. The solid black lines show the model predictions. The dotted lines are model predictions for when capillary recruitment is ‘off’.
First we focus on the default capillary recruitment ‘on’ case. Initially ef G is 3.5 %, consistent with direct measurements found in literature [32, p. 219]. Upon meal ingestion at t = 0 [min], ef G increases to just above 8%. After the initial steep rise, ef G decreases and then paradoxically increases again, maxing out at about 7%. After the commencement of exercise ef G rapidly drops to less than 2%. This happens because of a 10-fold increase in Qd, which decreases the time available for glucose exchange in capillaries. After exercise ends, ef G sharply increases again due to the persistence of the large G – H gradient and the rapid drop of Qd back to basal levels.
Initially, is 45 [mg/min], equal to the basal glucose uptake rate in the SM. After meal ingestion rises four-fold in both groups. In the exercise case with recruitment ‘on’ (solid lines), doubles, rising from 150 to 325 [mg/min]. This sharp increase is mainly due to capillary recruitment, which increases by 150%, greatly expediting glucose exchange between the CS and SM. As soon as exercise ceases drops because capillaries de-recruit, reducing .
The effect of shutting off capillary recruitment is shown by the dotted lines in Figs. 6 and 7. Exchange between the CS and SM is limited in the ‘off’ case— only marginally increases during exercise, compared to a steep rise in the ‘on’ case. The sharp limitation on causes a significant drop in H, but G is buoyed (see Fig. 6) because less glucose leaves the CS. This has two effects: (1) to blunt the EGP response and (2) to double the G–H gradient and thus double ef G. Still, despite the increase in ef G, Fig. 7 shows that remains significantly lower in the ‘off’ case than the ‘on’ case throughout the exercise period.
Discussion
Glucose dynamics drastically change during exercise. In this study, we demonstrate via a modeling approach how three important exercise induced mechanisms affect glucose concentrations. A deep understanding of these effects is warranted because insulin therapy in those with T1D is often confounded by exercise. The model presented describes healthy nondiabetic subjects, and is a first step to developing a glucose dynamics model to describe how exercise affects subjects with T1D.
The first included factor is EGP, which is important in maintaining glucose at sufficient concentrations during exercise. Previously, EGP has been shown to increase 2-fold during prolonged exercise [16]. We have accounted for the additional glucose production by creating a model that simulates the EGP response during exercise (Eqs. 5 and 10). The parameters of the EGP model were identified using data from independent studies [16, 17], as shown by the model fit in Fig. 3. EGP predictions, shown in Fig. 6, reasonably agree with measurements that were obtained using advanced triple-tracer methods. The ability to compare EGP model predictions to data represents an advantage over previous models of glucose metabolism during exercise [7, 11, 14], where measurements of EGP were not available for comparison or the increase in EGP was simply ignored.
The second included factor was the increase in the rate of glucose uptake (RGUSM) by insulin-sensitive cells in skeletal muscle. This effect was included by creating a phenomenological model that relates the rate of glucose uptake to exercise intensity E (Eq. 9). Model parameters were identified by aggregating data from various studies that measure directly the peripheral glucose uptake during exercise (see Fig. 3 (right)) via arteriovenous catheterization [2, 16, 17, 35, 36]. Our predictions during exercise in Fig. 6 show how the G–H gradient can be large, owing to the local glucose uptake in the SM. This large gradient may have significant implications on the accurate estimation of blood glucose when sampling glucose from peripheral tissues, such as with continuous glucose monitoring, which typically samples glucose in the interstitial fluid of subcutaneous tissue.
The third included factor is the enhancement of glucose delivery to skeletal muscle during exercise. We included this effect by developing a microscale model of mass-transfer in capillaries based on first principles (Eq. 11). To the authors’ best knowledge, no previous model of glucose dynamics has included the effects of capillary recruitment. The simulations of ‘on’ and ‘off’ demonstrate how capillary recruitment, or a lack thereof, alters glucose dynamics during exercise: there is a significant increase in glucose delivery to skeletal muscle (Fig. 7), a significant reduction in the G–H gradient (Fig. 6 (right, top)), a blunting of the EGP response (Fig. 6 (right, bottom)) and an increase in overall RGU as a result of glucose being more effectively delivered to the SM. The last observation is clear when comparing to the recruitment ‘off’ case in which the G–H gradient is smaller, and the resulting G during exercise is higher - a potential explanation for how microvascular dysfunction (reduced recruitment) can lead to glucose intolerance, or hyperglycemia during exercise. In fact, Womack et al. [19] showed that microvascular recruitment is highly attenuated in those with type 2 diabetes with microvascular complications. Our model supports this finding and further demonstrates how deficient capillary recruitment can cause prolonged hyperglycemia following a meal, also shown experimentally by Vincent et al. [44].
We examine the default capillary recruitment ‘on’ case, shown in Fig. 6. During the initial onset of exercise, G precipitously drops, in agreement with Gdata. However, G begins to undershoot after the first 20 min of exercise, and levels out at about 60 [mg/dL], approximately 15 [mg/dL] lower than Gdata. G remains lower for the remainder of exercise, and slightly recovers after exercise ends, but never completely returns to the basal glucose level of 90 [mg/dL]. This is likely explained by the slight underestimation of EGP (Fig. 6 bottom right), which closely follows EGPdata during rest, but lags the data during exercise, and then spuriously drops following exercise during the recovery phase, which is inconsistent with the data. This is likely because our model is not sufficiently responsive to account for rapid changes in EGP during the onset of exercise and the recovery phase following exercise, as can be seen by the lag in EGP during the exercise period. Still, the agreement is favorable, and future work will focus on further tuning of the EGP model which will likely improve the agreement between G and Gdata during exercise.
Though model simulations agree favorably with the data, further validation is required on independent datasets. It also must be mentioned that all comparisons were made for an average subject and hence between-subject variability was not included.
As in any complex biological system, there are limitations to modeling. These limitations come from model assumptions and inaccurate parameters, which are usually borne out of unavailable or inaccurate experimental data, especially in vivo. We outline several limitations.
First, the significant drop of H to 40 [mg/dL] shown in Fig. 6 may be overestimated. This is because our derived model for solute exchange in capillary beds (Eq. 11) may underestimate glucose delivery to SM during exercise. These inaccuracies in glucose transport are apparent in Fig. 7 which shows that even though model predictions during fasting and resting agree with observation (ef G ≈ 3–4 %), ef G during exercise is predicted to drop to 2%, which is inconsistent with direct measurements of ef G showing an increase to 8% across the leg during exercise [2, 17]. This would imply that the predicted 100% increase of is actually an underestimation, and that capillary recruitment may play an even greater role in altering glucose kinetics than our model suggests. Various prominent researchers such as Renkin [27] have proposed that capillary bed heterogeneity could be the culprit in the inability of a homogeneous capillary exchange model (like ours) to capture accurately the observed behaviors. It is also possible that unmodeled transport phenomena, such as microfiltration and active transport, could account for the discrepancy.
Another reason for inaccurate glucose transport predictions is the uncertainty in the permeability surface area . Measurements of capillary permeability vary significantly, from 0.006 to 0.02 [mLb/mLtiss/min] [38, p. 33] [39, 40], with some estimates as high as 0.05 [mLb/mLtiss/min] [26]. The difficulty in consistently and accurately quantifying stems from measurement techniques that are model-dependent as well as from confounding factors, such as hyperglycemia, hyperinsulinemia, stress, and whether the subject is in a fasting or postprandial state. Any of these factors can potentially alter . Future work should seek to improve the capillary transport model by either adopting a fully phenomenological model (purely data driven and not based on fluid dynamics models) for capillary exchange, or by attempting to improve the model by including more accurate parameters derived from well-designed experiments.
In the current model H represents the average concentration of all peripheral tissue. Clearly, different tissues have different characteristics, and ideally each of these tissue groups should be represented by a separate compartment. It is expected that if the single SM compartment were subdivided into several compartments, the glucose concentration in active SM would differ from resting SM. Another limitation is the model for peripheral glucose uptake . Our model for was developed for low to moderate intensity leg exercise, but has not been tested for high intensity exercise, or anaerobic exercise. We have also assumed that uptake is not saturable. At glucose concentrations greater than 300 [mg/dL] this may be a poor assumption [25, 45]. Also, does not include any synergistic (nonlinear) effects of insulin and exercise, even though some authors have shown these effects to be significant [2].
This study is one of the first to utilize Rameal and EGPdata collected during exercise using the triple-tracer technique [20]. It is important to note that despite these methods being state-of-the-art they are still prone to error because of steady state assumptions, and hence results should be cautiously interpreted.
Little is understood about liver glucose uptake during exercise. Because of limited understanding and a lack of data, the liver glucose uptake model we used was adapted from Sorensen [7] and small parameter adjustments were made to ensure liver uptake estimates were consistent with the 55–60% of meal ingestion measured by Felig [46] and Defronzo [46]. Clearly, more work needs to be done to understand liver uptake, especially during exercise, and should be the focus of future experimental work.
Finally, the model, as it is designed, facilitates a mechanistic understanding of glucose regulation in healthy nondiabetic subjects during exercise. However, to understand the mechanisms of glucose regulation during exercise in subjects with T1D, the model must be amended. Future iterations will include a model of insulin resistance, subcutaneous insulin infusion (as in this accompanying study [29]), and other physiological effects observed in those with T1D.
Conclusion
Glucose dynamics are known to drastically change during exercise. We have developed a model of glucose dynamics specifically to account for the effects of exercise. The design of the model includes three important exercise-induced effects: an increase in endogenous glucose production (EGP), an increase in the rate of glucose production in peripheral tissue, and an increase in the rate of glucose transport to peripheral tissue by capillary recruitment. For the first time we have shown through simulation how capillary recruitment enhances glucose transport to peripheral tissue, lowering blood glucose levels in blood, and how capillary dysfunction (a lack of capillary recruitment) may cause glucose intolerance. Also, for the first time we have compared EGP model predictions to triple-tracer measurements taken during exercise. In general, model predictions compare favorably to clinical data taken during exercise in healthy nondiabetic subjects. The model derivation and simulations provide mechanistic insight into how three important physiological processes affect glucose concentrations during exercise, providing a pathway toward developing a similar model in subjects with type 1 diabetes.
Supplementary Material
Acknowledgements
We thank C. Funke and J. Gomez for their help and insight into this work.
This work was supported by the National Science Foundation Graduate Research Fellowship Program (S.F.). Studies supported by NIH Grant Nos. DK 085516, DK 094331, and UL1-R000135 from the National Center for Advancing Translational Sciences.
Footnotes
Electronic supplementary material The online version of this article (https://doi.org/10.1007/s10928-020-09726-9) contains supplementary material, which is available to authorized users.
References
- 1.Wasserman DH (2009) Four grams of glucose. Am J Physiol Endocrinol Metab 296(1):E11–21. 10.1152/ajpendo.90563.2008 [DOI] [PMC free article] [PubMed] [Google Scholar]
- 2.DeFronzo RA, Ferrannini E, Sato Y, Felig P, Wahren J (1981) Synergistic interaction between exercise and insulin on peripheral glucose uptake. J Clin Investig 68(6):1468–1474 [DOI] [PMC free article] [PubMed] [Google Scholar]
- 3.Aarnio P, Lauritsen T, Dela F (2001) Insulin secretion and glucose kinetics during exercise with and without pharmacological a1- and a2-receptor blockade. Diabetes 50(8):1834–1843. 10.2337/diabetes.50.8.1834 [DOI] [PubMed] [Google Scholar]
- 4.Marliss EB, Vranic M (2002) Intense exercise has unique effects on both insulin release and its roles in glucoregulation: implications for diabetes. Diabetes 51(suppl 1):S271–S283. 10.2337/diabetes.51.2007.S271 [DOI] [PubMed] [Google Scholar]
- 5.Bergman RN (1989) Toward physiological understanding of glucose tolerance. Minimal-model approach. Diabetes 38(12):1512–1527 [DOI] [PubMed] [Google Scholar]
- 6.Schaller S, Willman S, Lippert J, Schaupp L, Pieber T, Schuppert A, Eissing T (2013) A generic integrated physiologically based whole-body model of the glucose-insulin-glucagon regulatory system. CPT 2(8):40. 10.1038/psp.2013.40 [DOI] [PMC free article] [PubMed] [Google Scholar]
- 7.Sorensen J (1985) A Physiologic Model of Glucose Metabolism in Man and Its use to Design and Assess Improved Insulin Therapies for Diabetes. PhD thesis, Massachusetts Institute of Technology [Google Scholar]
- 8.Dalla Man C, Rizza RA, Cobelli C (2007) Meal simulation model of the glucose-insulin system. IEEE Trans Bio-medical Eng 54(10):1740–1749. 10.1109/TBME.2007.893506 [DOI] [PubMed] [Google Scholar]
- 9.Dalla Man C, Caumo A, Cobelli C (2002) The oral glucose minimal model: estimation of insulin sensitivity from a meal test. IEEE Trans Bio-medical Eng 49(5):419–429. 10.1109/10.995680 [DOI] [PubMed] [Google Scholar]
- 10.Dalla Man C, Raimondo DM, Rizza RA, Cobelli C (2007) GIM, simulation software of meal glucose-insulin model. J Diabetes Sci Technol 1(3):323–330 [DOI] [PMC free article] [PubMed] [Google Scholar]
- 11.Roy A, Parker RS (2007) Dynamic modeling of exercise effects on plasma glucose and insulin levels. J Diabetes Sci Technol 1(3):338–347 [DOI] [PMC free article] [PubMed] [Google Scholar]
- 12.Breton MD (2008) Physical activity-the major unaccounted impediment to closed loop control. J Diabetes Sci Technol 2(1):169–174 [DOI] [PMC free article] [PubMed] [Google Scholar]
- 13.Man CD, Breton MD, Cobelli C (2009) Physical activity into the meal glucose-insulin model of type 1 diabetes: In silico studies. J Diabetes Sci Technol 3(1):56–67 [DOI] [PMC free article] [PubMed] [Google Scholar]
- 14.Lenart PJ, Parker RS (2002) Modeling exercise effects in type 1 diabetic patients. IFAC Proc Vol 35(1):247–252. 10.3182/20020721-6-ES-1901.01350 [DOI] [Google Scholar]
- 15.Kovatchev BP, Breton M, Man CD, Cobelli C (2009) In silico preclinical trials: a proof of concept in closed-loop control of type 1 diabetes. J Diabetes Sci Technol 3(1):44–55 [DOI] [PMC free article] [PubMed] [Google Scholar]
- 16.Ahlborg G, Felig P (1982) Lactate and glucose exchange across the forearm, legs, and splanchnic bed during and after prolonged leg exercise. J Clin Investig 69(1):45–54 [DOI] [PMC free article] [PubMed] [Google Scholar]
- 17.Ahlborg G, Felig P, Hagenfeldt L, Hendler R, Wahren J (1974) Substrate turnover during prolonged exercise in man. Splanchnic and leg metabolism of glucose, free fatty acids, and amino acids. J Clin Investig 53(4):1080–1090. 10.1172/JCI107645 [DOI] [PMC free article] [PubMed] [Google Scholar]
- 18.Renkin EM, Hudlicka O, Sheehan RM (1966) Influence of metabolic vasodilatation on blood-tissue diffusion in skeletal muscle. Am J Physiol 211(1):87–98 [DOI] [PubMed] [Google Scholar]
- 19.Womack L, Peters D, Barrett EJ, Kaul S, Price W, Lindner JR (2009) Abnormal skeletal muscle capillary recruitment during exercise in patients with type 2 diabetes mellitus and microvascular complications. J Am Coll Cardiol 53(23):2175–2183. 10.1016/j.jacc.2009.02.042 [DOI] [PMC free article] [PubMed] [Google Scholar]
- 20.Schiavon M, Hinshaw L, Mallad A, Dalla Man C, Sparacino G, Johnson M, Carter R, Basu R, Kudva Y, Cobelli C, Basu A (2013) Postprandial glucose fluxes and insulin sensitivity during exercise: a study in healthy individuals. Am J Physiol Endocrinol Metab 305(4):E557–566. 10.1152/ajpendo.00182.2013 [DOI] [PMC free article] [PubMed] [Google Scholar]
- 21.Hinshaw L, Schiavon M, Mallad A, Man CD, Basu R, Bharucha AE, Cobelli C, Carter RE, Basu A, Kudva YC (2014) Effects of delayed gastric emptying on postprandial glucose kinetics, insulin sensitivity, and beta-cell function. Am J Physiol Endocrinol Metab 307(6):494. 10.1152/ajpendo.00199.2014 [DOI] [PMC free article] [PubMed] [Google Scholar]
- 22.Richter EA, Hargreaves M (2013) Exercise, GLUT4, and skeletal muscle glucose uptake. Physiol Rev 93(3):993–1017. 10.1152/physrev.00038.2012 [DOI] [PubMed] [Google Scholar]
- 23.Ren JM, Semenkovich CF, Gulve EA, Gao J, Holloszy JO (1994) Exercise induces rapid increases in GLUT4 expression, glucose transport capacity, and insulin-stimulated glycogen storage in muscle. J Biol Chem 269(20):14396–14401 [PubMed] [Google Scholar]
- 24.Rose AJ, Richter EA (2005) Skeletal muscle glucose uptake during exercise: how is it regulated? Physiology (Bethesda, Md) 20:260–270. 10.1152/physiol.00012.2005 [DOI] [PubMed] [Google Scholar]
- 25.Yki-Järvinen H, Young AA, Lamkin C, Foley JE (1987) Kinetics of glucose disposal in whole body and across the forearm in man. J Clin Investiga 79(6):1713–1719 [DOI] [PMC free article] [PubMed] [Google Scholar]
- 26.Renkin EM (1977) Multiple pathways of capillary permeability. Circ Res 41(6):735–743. 10.1161/01.RES.41.6.735 [DOI] [PubMed] [Google Scholar]
- 27.Renkin EM (1985) B. W. Zweifach Award lecture. Regulation of the microcirculation. Microvasc Res 30(3):251–263 [DOI] [PubMed] [Google Scholar]
- 28.Renkin EM (1959) Transport of potassium-42 from blood to tissue in isolated mammalian skeletal muscles. Am J Physiol 197:1205–1210 [DOI] [PubMed] [Google Scholar]
- 29.Frank S, Jbaily A, Hinshaw L, Basu R, Basu A, Szeri AJ (2018) Modeling the acute effects of exercise on insulin kinetics in type 1 diabetes. J Pharmacokinet Pharmacodyn 45(6):829–845. 10.1007/s10928-018-9611-z [DOI] [PMC free article] [PubMed] [Google Scholar]
- 30.Basu R, Di Camillo B, Toffolo G, Basu A, Shah P, Vella A, Rizza R, Cobelli C (2003) Use of a novel triple-tracer approach to assess postprandial glucose metabolism. Am J Physiol Endocrinol Metab 284(1):55. 10.1152/ajpendo.00190.2001 [DOI] [PubMed] [Google Scholar]
- 31.Radziuk J, McDonald TJ, Rubenstein D, Dupre J (1978) Initial splanchnic extraction of ingested glucose in normal man. Metabolism 27(6):657–669. 10.1016/0026-0495(78)90003-3 [DOI] [PubMed] [Google Scholar]
- 32.DeFronzo RA, Ferrannini E, Alberti KGMM, Zimmet P, Alberti G (2015) International textbook of diabetes mellitus. Wiley, Hoboken [Google Scholar]
- 33.Ferrannini E, Wahren J, Felig P, DeFronzo RA (1980) The role of fractional glucose extraction in the regulation of splanchnic glucose metabolism in normal and diabetic man. Metabolism 29(1):28–35. 10.1016/0026-0495(80)90094-3 [DOI] [PubMed] [Google Scholar]
- 34.Castillo C, Bogardus C, Bergman R, Thuillez P, Lillioja S (1994) Interstitial insulin concentrations determine glucose uptake rates but not insulin resistance in lean and obese men. J Clin Investig 93(1):10–16 [DOI] [PMC free article] [PubMed] [Google Scholar]
- 35.Nielsen B, Savard G, Richter E, Hargreaves M, Saltin B (1990) Muscle blood flow and muscle metabolism during exercise and heat stress. J Appl Physiol 69(3):1040–1046 [DOI] [PubMed] [Google Scholar]
- 36.Katz A, Broberg S, Sahlin K, Wahren J (1986) Leg glucose uptake during maximal dynamic exercise in humans. Am J Physiol Endocrinol Metab 251(1):E65–E70 [DOI] [PubMed] [Google Scholar]
- 37.Saltin B (1988) Capacity of blood flow delivery to exercising skeletal muscle in humans. The American journal of cardiology 62(8):30E–35E [DOI] [PubMed] [Google Scholar]
- 38.Fournier RL (2011) Basic transport phenomena in biomedical engineering. CRC Press, Boca Raton [Google Scholar]
- 39.Gudbjörnsdóttir S, Sjöstrand M, Strindberg L, Wahren J, Lönnroth P (2003) Direct measurements of the permeability surface area for insulin and glucose in human skeletal muscle. J Clin Endocrinol Metab 88(10):4559–4564. 10.1210/jc.2003-030434 [DOI] [PubMed] [Google Scholar]
- 40.Gudbjornsdottir S, Sjostrand M, Strindberg L, Lonnroth P (2005) Decreased muscle capillary permeability surface area in type 2 diabetic subjects. J Clin Endocrinol Metab 90(2):1078–1082. 10.1210/jc.2004-0947 [DOI] [PubMed] [Google Scholar]
- 41.Williams LR, Leggett RW (1989) Reference values for resting blood flow to organs of man. Clin Phys Physiol Meas 10(3):187. [DOI] [PubMed] [Google Scholar]
- 42.Bergman RN, Yang YJ, Hope ID, Ader M (1990) The role of the transcapillary insulin transport in the efficiency of insulin action: studies with glucose clamps and the minimal model. Hormone Metab Res Suppl Series 24:49–56 [PubMed] [Google Scholar]
- 43.Guyton A, Hall J (2006) Textbook of medical physiology, 11th edn. Elsevier Saunders, Amsterdam [Google Scholar]
- 44.Vincent MA, Clerk LH, Lindner JR, Price WJ, Jahn LA, Leong-Poi H, Barrett EJ (2006) Mixed meal and light exercise each recruit muscle capillaries in healthy humans. Am J Physiol Endocrinol Metab 290(6):E1191–1197. 10.1152/ajpendo.00497.2005 [DOI] [PubMed] [Google Scholar]
- 45.Richter EA (2010) Glucose utilization. Comprehensive physiology. Wiley, Hoboken [Google Scholar]
- 46.Felig P, Wahren J, Hendler R (1975) Influence of oral glucose ingestion on splanchnic glucose and gluconeogenic substrate metabolism in man. Diabetes 24(5):468–475. 10.2337/diab.24.5.468 [DOI] [PubMed] [Google Scholar]
- 47.Bergman RN, Ider YZ, Bowden CR, Cobelli C (1979) Quantitative estimation of insulin sensitivity. Am J Physiol 236(6):E667–677 [DOI] [PubMed] [Google Scholar]
- 48.Cobelli C, Dalla Man C, Toffolo G, Basu R, Vella A, Rizza R (2014) The oral minimal model method. Diabetes 63(4):1203–1213. 10.2337/db13-1198 [DOI] [PMC free article] [PubMed] [Google Scholar]
- 49.Dalla Man C, Caumo A, Basu R, Rizza R, Toffolo G, Cobelli C (2004) Minimal model estimation of glucose absorption and insulin sensitivity from oral test: validation with a tracer method. Am J Physiol Endocrinol Metab 287(4):E637–643. 10.1152/ajpendo.00319.2003 [DOI] [PubMed] [Google Scholar]
- 50.Baron AD, Brechtel G, Wallace P, Edelman SV (1988) Rates and tissue sites of non-insulin- and insulin-mediated glucose uptake in humans. Am J Physiol 255(6 Pt 1):E769–774 [DOI] [PubMed] [Google Scholar]
- 51.Holmäng A, Mimura K, Lönnroth P (2002) Involuntary leg movements affect interstitial nutrient gradients and blood flow in rat skeletal muscle. J Appl Physiol 92(3):982–988. 10.1152/japplphysiol.01194.2000 [DOI] [PubMed] [Google Scholar]
- 52.Sjöstrand M, Holmäng A, Lönnroth P (1999) Measurement of interstitial insulin in human muscle. Am J Physiol Endocrinol Metab 276(1):E151–E154 [DOI] [PubMed] [Google Scholar]
- 53.Jansson PAE, Fowelin JP, Von Schenck HP, Smith UP, Lönnroth PN (1993) Measurement by microdialysis of the insulin concentration in subcutaneous interstitial fluid: importance of the endothelial barrier for insulin. Diabetes 42(10):1469–1473. 10.2337/diab.42.10.1469 [DOI] [PubMed] [Google Scholar]
- 54.Hasgall P, Di Gebbari F, Baumgartner C, Neufeld E, Gosselin M, Payne D, Klingenböck A, Kuster N (2015) IT’IS Database for thermal and electromagnetic parameters of biological tissues 3.0, 10.13099/VIP21000-03-0 [DOI]
- 55.Clark MG, Rattigan S, Barrett EJ, Vincent MA (2008) Point:Counterpoint: there is/is not capillary recruitment in active skeletal muscle during exercise. J Appl Physiol 104(3):889–891. 10.1152/japplphysiol.00779.2007 [DOI] [PubMed] [Google Scholar]
- 56.Dawson D, Vincent MA, Barrett EJ, Kaul S, Clark A, Leong-Poi H, Lindner JR (2002) Vascular recruitment in skeletal muscle during exercise and hyperinsulinemia assessed by contrast ultrasound. Am J Physiol Endocrinol Metab 282(3):E714–720. 10.1152/ajpendo.00373.2001 [DOI] [PubMed] [Google Scholar]
- 57.Coggins M, Lindner J, Rattigan S, Jahn L, Fasy E, Kaul S, Barrett E (2001) Physiologic hyperinsulinemia enhances human skeletal muscle perfusion by capillary recruitment. Diabetes 50(12):2682–2690 [DOI] [PubMed] [Google Scholar]
- 58.De Feo P, Perriello G, Ventura MM, Calcinaro F, Basta G, Lolli C, Cruciani C, Dell’Olio A, Santeusanio F, Brunetti P (1986) Studies on overnight insulin requirements and metabolic clearance rate of insulin in normal and diabetic man: relevance to the pathogenesis of the dawn phenomenon. Diabetologia 29(8):475–480 [DOI] [PubMed] [Google Scholar]
- 59.Thorsteinsson B, Fugleberg S, Binder C (1988) Insulin clearance from plasma in type i (insulin-dependent) diabetic patients: influence of glycaemic level. Pharmacol Toxicol 62(4):206–209. 10.1111/j.1600-0773.1988.tb01873.x [DOI] [PubMed] [Google Scholar]
- 60.Thorsteinsson B, Fugleberg S, Feldt-Rasmussen B, Ellemann K, Andersen OO, Binder C (1987) Kinetic Models for insulin disappearance from plasma in type I diabetic patients. Pharmacol Toxicol 60(2):90–95. 10.1111/j.1600-0773.1987.tb01502.x [DOI] [PubMed] [Google Scholar]
Associated Data
This section collects any data citations, data availability statements, or supplementary materials included in this article.