

Abstract
Prostate cancer exhibits a propensity to metastasize to the bone, which often leads to fatality. Bone metastasis is characterized by complex biochemical, morphological, pathophysiological, and genetic changes to cancer cells as they colonize at bone sites. In this study, we report the evaluation of MDA PCa2b prostate cancer cells’ nanomechanical properties during the mesenchymal-to-epithelial transition (MET) and during disease progression at the metastatic site. Bone-mimetic tissue-engineered 3D nanoclay scaffolds have been used to create in vitro metastatic site for prostate cancer. A significant softening of the prostate cancer cells during MET and further softening as disease progression occurs at metastasis is also reported. The significant reduction in elastic modulus of prostate cancer cells during MET was attributed to actin reorganization and depolymerization. This study provides input towards direct nanomechanical measurements to evaluate the time evolution of cells’ mechanical behavior in tumors at bone metastasis site.
Keywords: Prostate cancer, metastasis, nanomechanics, mechanobiology, nanoclay, scaffolds
1. Introduction
In recent years, the investigation of the relationship of the mechanical behavior of cells and tissues with the state of the disease has been a topic of immense scientific engagement (Radmacher, Fritz, et al. 1996; Bao and Suresh 2003, Hessler, Budor, et al. 2005). The World Health Organization reports 359,000 deaths due to prostate cancer in 2018, arising primarily from metastasis to bone. Biomarkers for metastasis are not available. Stiffness of cells measured using AFM has been considered a biomarker for disease progression (Hoyt, Castaneda, et al. 2008, Xu, Mezencev, et al. 2012). An AFM based study reported reduced elastic modulus of cancer cells during malignant progression (Iida, Sakai, et al. 2017), while another reported an increase during invasion into collagen matrices (Staunton, Doss, et al. 2016). Two very significant events occur during cancer metastasis, one at the primary tumor site when epithelial cancer cells gain mesenchymal phenotype and invade surrounding tissues (EMT) and another at the secondary metastatic site mesenchymal-to-epithelial transition (MET) occurs. Cell softening is associated with the induction of EMT (the reverse of MET at the primary tumor site), in human lung and tongue squamous cancer cells (Zhou, Zheng, et al. 2013; Iida, Sakai, et al. 2017). It has also been reported that metastatic cancer cells stiffen after EMT during the invasion into surrounding tissues (Staunton, Doss, et al. 2016). These studies in the literature are based on epithelial to mesenchymal transition (EMT) of cancer cells or isolated cancer cells that are not at the metastasis site. Indeed both the stage of cancer metastasis and phenotype affect the mechanical property of the cell. Thus, the mechanical properties of cancer cells vary during different stages of the metastatic cascade.
Various theoretical models have been applied to describe the elastic moduli obtained from load-displacement (L-D) curves from cellular indentation (Guz, Dokukin, et al. 2014). In the last few years, many advances have been made in evaluating the elastic moduli of live cells (Katti, Katti, et al. 2019). Various L-D curve-fitting models, indenter geometries, displacements, substrate stiffnesses have been used (Vinckier and Semenza 1998; Guz, Dokukin, et al. 2014). These studies report differences in elastic moduli between healthy and cancerous cells (Lekka, Laidler, et al. 1999, Suresh 2007, Sawyers 2008, Lekka 2016). These studies motivated our current investigations into changes to cells’ mechanical properties during cancer progression at metastasis.
Investigation of new markers of metastasis requires the availability of tissues from the metastasis site. Metastasis to the bone is often preceded by death in animal models, and the limited availability of metastatic human prostate cancer samples necessitates the use of in vitro models. Hence, translational models that mimic the skeletal metastasis of prostate cancer are useful for investigating metastasis (Berish, Ali, et al. 2018). 3D models of cancer metastasis have been attempted recently (Griffith and Swartz 2006, Dhurjati, Krishnan, et al. 2008, Hutmacher 2010, Pathi, Lin, et al. 2011; Ye, Mohanty, et al. 2014; Holen, Nutter, et al. 2015, Marlow and Dontu 2015, Zhu, Wang, et al. 2015, Herroon, Diedrich, et al. 2016, Liu and Vunjak-Novakovic 2016, Salamanna, Contartese, et al. 2016, Angeloni, Contessi, et al. 2017, Choudhary, Ramasundaram, et al. 2018, Hao, Ha et al. 2018, Qiao and Tang 2018, Sitarski, Fairfield et al. 2018, Song, Miermont, et al. 2018). These models evaluate important factors for metastasis, and evaluating cancer cells at the remodeling bone niche remains a worthwhile goal.
We have used nanoclay tissue engineering scaffolds to develop in vitro remodeling bone structures (Ambre, Katti, et al. 2010, Ambre, Katti, et al. 2011; Ambre, Katti, et al. 2013; Ambre, Katti, et al. 2015) exhibiting characteristics of immature bone (Katti, Ambre, et al. 2015) using polymer-clay-nanocomposites (Sikdar, Pradhan et al. 2008). Experiments in literature have indicated that metastasis initiation occurs at immature bone sites (He, Chiou et al. 2017). Sequential culture of prostate cancer cells on bone-mimetic scaffolds led to the development of prostate cancer tumoroids in the MET stage (Katti, Molla, et al. 2016, Molla, Katti, et al. 2018; Molla, Katti, et al. 2019, Molla, Katti, et al. 2020), as illustrated by enhanced MET (E-cadherin and FGFR2) and angiogenesis (HIF-1 and VEGF) markers and inhibited EMT markers (Twist1, Snail1, and Vimentin). We have observed similar behavior with breast cancer cell lines MCF-7 and MDA-MB-231 on bone scaffolds (Kar, Katti, et al. 2019; Kar, Molla, et al. 2019; Kar, Jasuja, et al. 2020, Kar, Katti, et al. 2020). The MET stage is successfully recapitulated using two different prostate cell lines, MDA-PCa-2b and PC-3 (Molla, Katti, et al. 2018, Molla, Katti, et al. 2019). These studies also indicated that the cells in the tumoroids at the bone metastasis location exhibit hypoxia, inducing secretion of angiogenesis markers. Also, SEM images of the prostate cancer cells cultured on bone scaffolds indicate tight junction tumoroids, which is the characteristic phenotype of epithelial cells. Prostate cancer cells with hypoxic core regions and tight cellular junctions in the bone-like microenvironment have been reported earlier (Sieh, Lubik, et al. 2010; Girard, Wang, et al. 2013). When only prostate cancer cells (monoculture) are seeded in the 3D scaffolds, they do not form tumoroids (Katti, Molla, et al. 2016). Hence, the presence of bone cells (differentiated from MSCs) and minerals secreted from the bone cells significantly affects the genotypic and phenotypic characteristics of prostate cancer cells. Interestingly, there is a concurrent impact of the cancer cells on the bone environment (Molla, Katti, et al. 2020).
Cancer metastasis results in dramatic remodeling of the cytoskeleton, an interconnected network of filamentous polymers and regulatory proteins (Yilmaz and Christofori 2009). Continuous remodeling and reorganizing of the cytoskeletal structure is accompanied by progressive changes in cellular morphology (Fife, McCarroll, et al. 2014). However, how the mechanical properties of cancer cells evolve during metastasis remains unknown.
We used an in situ displacement-controlled nanoindentation for indenting live cells (Khanna, Katti, et al. 2012) to probe the nanomechanical changes of prostate cancer cells and tumoroids at the metastasis site. The long-term goals are developing reliable and robust computational models of cancer prediction for which preliminary studies have been initiated (Katti and Katti 2017).
2. Materials and Methods
2.1. Preparation of 3D porous scaffolds.
Bone-mimetic 3D scaffolds for bone tissue engineering were prepared using modified NaMMT clay, hydroxyapatite (HAP), and polycaprolactone (PCL), following the protocol described in our previous studies (Ambre, Katti, et al. 2015). NaMMT clay was purchased from Clay Minerals Respiratory at the University of Missouri, Columbia.
2.2. Cell lines and culture reagents.
Human prostate cancer cell line MDA PCa 2b(PCa) was purchased from American Type Culture Collection (VA, USA) and maintained in the media consisting of 80% BRFF-HPC1 (AthenaES, 0403) and 20% fetal bovine serum (ATCC, 30–2020). Human bone marrow-derived mesenchymal stem cells (MSCs) were purchased from Lonza, Walkersville (PT-2501), and maintained in MSCGM™ Bulletkit™ medium (Lonza, Walkersville, PT-3001). The Bulletkit™ medium was prepared by adding MSCGM™ SingleQuots™ (Lonza, Walkersville, PT-4105) to MSCBM™ (Lonza, Walkersville, PT-3238). The cells were maintained at 37 °C and 5% CO2 in a completely humidified incubator.
2.3. 3D sequential culture to mimic MET.
Initially, cylindrical-shaped 3D scaffolds with 12 mm diameter and 3 mm thickness were sterilized and placed in 24-well plates for cell seeding. MSCs were seeded on each scaffold at a density of 5 × 10⁴ and cultured for 23 days to allow bone formation. MSCs were maintained in MSCGM™ Bulletkit™ medium, and fresh media was added every two days. After 23 days, MDA PCa 2b cells were added into the newly formed bone tissue containing scaffolds at a density of 5×10⁴ per scaffolds. The MSCs and PCa media were used in a ratio of 1:1.
Nanomechanical Testing
Hysitron Triboscope (Minneapolis, MN) equipped with multimode AFM (Nanoscope IIIa controller and J-type piezo scanner system) (Veeco Metrology, Santa Barbara, CA) was used for nanomechanical characterization of PCa cells. For testing live cells in a fluid environment, a special fluid cell was designed as described in Appendix I. Displacement controlled nanoindentation tests on PCa cells were performed at maximum displacements of 500 nm and 1000 nm at loading and unloading rates of 10 nm/s.
2.4. Scanning electron microscopy
The tissue-cultured scaffold samples were washed with PBS and fixed with 2.5% glutaraldehyde followed by ethanol series treatment (10%, 30%, 50%, 70%, and 100% v/v) for dehydration. The samples were dried using hexamethyldisilazane after alcohol treatment. The samples were then gold-coated and mounted on SEM stubs for observation using the JEOL JSM 6490LV scanning electron microscope.
2.6. Analysis of nanomechanical response.
The Oliver & Pharr method was used to calculate contact stiffness by applying a power-law fit to the initial unloading portion of the load-displacement (L-D) curve and analytically differentiating the power-law relation (Oliver and Pharr 1992). Elastic moduli of the PCa cells were calculated from the reduced moduli using the following equation:
| (1) |
where Er,Es, and Eirepresent the reduced elastic modulus, elastic modulus of the sample, and elastic modulus of indenter (1141 GPa) respectively and vs and virepresent the Poisson’s ratio of the sample (0.5) and indenter (0.07), respectively. All experiments were repeated in triplicate, and at least 22 indentations were done for each sample. Distribution of elastic modulus is presented as box plots, where median value, 25th percentile, and 75th percentile are indicated (Figures 2, 3, and 4).
Figure 2.
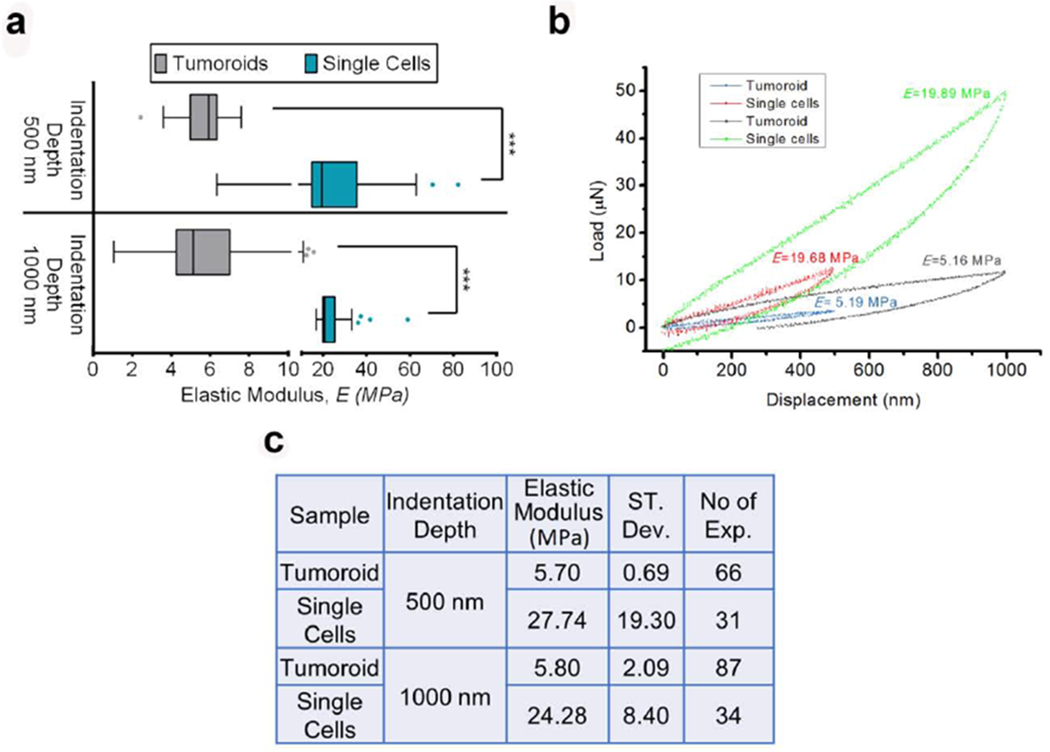
PCa cells become softer when they undergo MET and form tumoroids at the bone microenvironment. (a) The distribution of elastic modulus, E of PCa ‘single cells’ and tumoroid cells at the maximum indentation depths 500 nm and 1000 nm shown by Tukey’s Boxplot. The median, 25th percentile and 75th percentile are indicated. Error bars indicate 5th and 95th percentiles. Whiskers indicate outliers. ***p < 0.001. (b) Representative load-displacement (L-D) curves of PCa ‘single cells’ and tumoroid cells at the maximum indentation depth 500 nm and 1000 nm. Respective elastic modulus calculated from the L-D curves are indicated. (c) The table shows the mean value of the elastic modulus, E of PCa ‘single cells’ and tumoroid cells at the maximum indentation depths 500 nm and 1000 nm. Respective standard deviation and the number of indention performed are also indicated.
Figure 3.
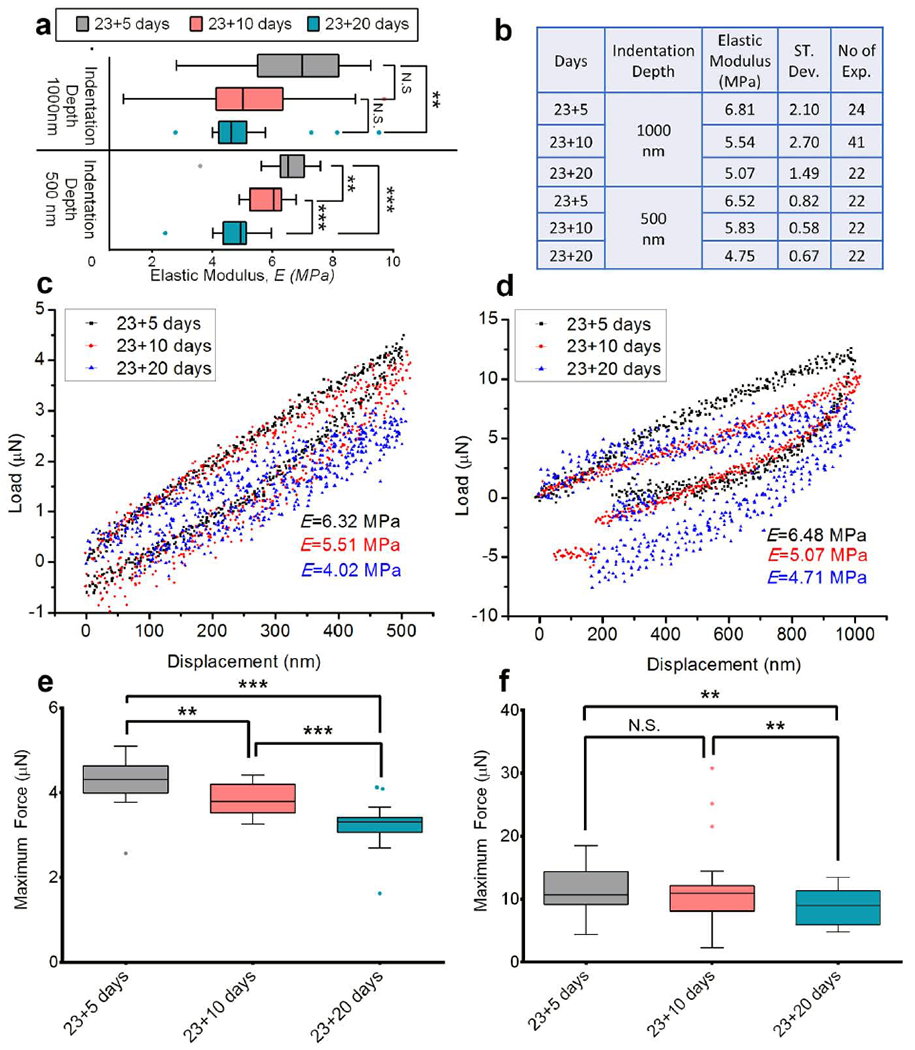
Tumoroid cells become softer with the cancer progression at the metastatic bone site. (a) The distribution of elastic modulus, E of PCa cells in the tumoroids at the maximum indentation depths 500 nm and 1000 nm on day 23+5, day 23+10 and day 23+20 (day 23+X means MSCs cultured for 23 days to form bone tissue and then PCa cells cultured on bone tissue for X days) shown by Tukey’s Boxplot. The median, 25th percentile and 75th percentile are indicated. Error bars indicate 5th and 95th percentiles. Whiskers indicate outliers. ***p < 0.001, **p < 0.005. (b) The table shows the mean value of the elastic modulus, E of PCa cells in the tumoroids at the maximum indentation depths 500 nm and 1000 nm on day 23+5, day 23+10 and day 23+20. Respective standard deviation and the number of indention performed are also indicated. (c) Representative L-D curves obtained from indenting PCa cells in the Tumoroids at maximum indentation depth 500 nm on day 23+5, day 23+10 and day 23+20. (d) Representative L-D curves obtained from indenting PCa cells in the Tumoroids at maximum indentation depth 1000 nm on day 23+5, day 23+10 and day 23+20. (e) The distribution of the maximum force required (maxF) to indent 500 nm for PCa cells in the tumoroids on day 23+5, day 23+10 and day 23+20 shown by Tukey’s Boxplot. The median, 25th percentile and 75th percentile are indicated. Error bars indicate 5th and 95th percentiles. Whiskers indicate outliers. ***p < 0.001, **p < 0.005. (f) The distribution of the maximum force required (maxF) to indent 1000 nm for PCa cells in the tumoroids on day 23+5, day 23+10 and day 23+20 shown by Tukey’s Boxplot. The median, 25th percentile and 75th percentile are indicated. Error bars indicate 5th and 95thpercentiles. Whiskers indicate outliers. **p < 0.005
Figure 4.
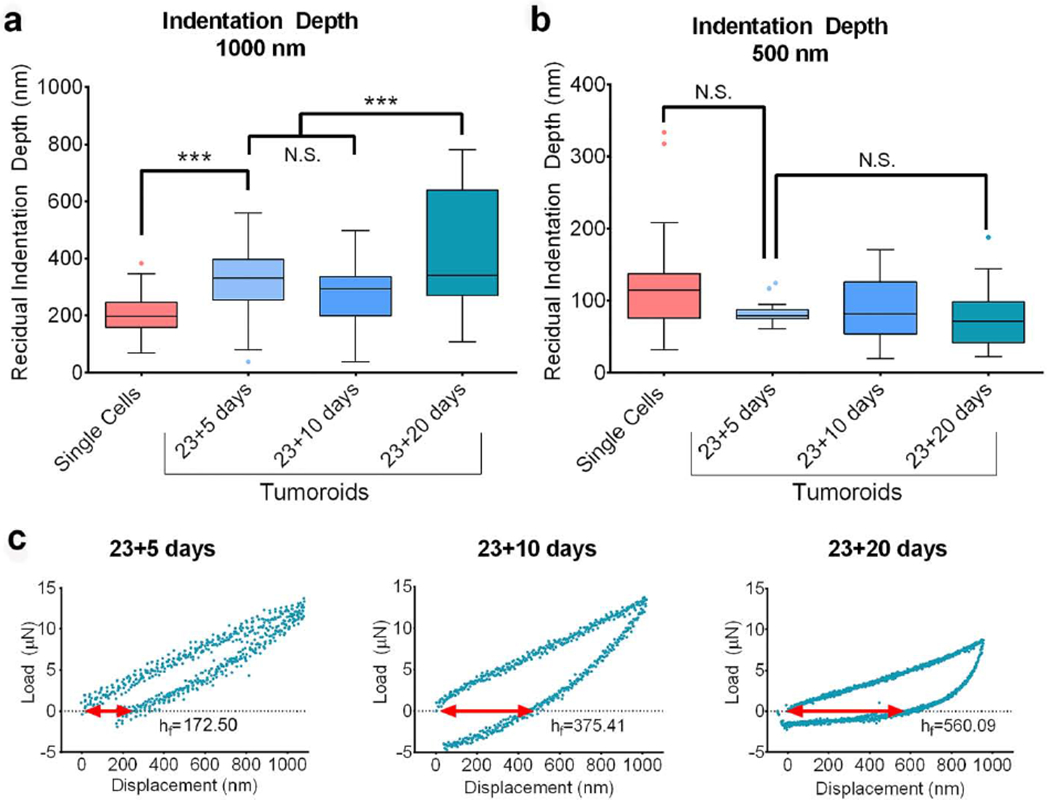
Mechanical plasticity of the PCa cells increases with disease progression at the metastatic site. (a) The distribution of the residual indentation depth (unrecovered deformation) for the maximum indentation depth 1000 nm obtained from indenting PCa ‘single cells’ and PCa cells in the tumoroids on day 23+5, day 23+10 and day 23+20 shown by Tukey’s Boxplot. The median, 25th percentile and 75th percentile are indicated. Error bars indicate 5th and 95th percentiles. Whiskers indicate outliers. ***p < 0.001. (b) The distribution of the residual indentation depth (unrecovered deformation) for the maximum indentation depth 500 nm obtained from indenting PCa ‘single cells’ and PCa cells in the tumoroids on day 23+5, day 23+10 and day 23+20 shown by Tukey’s Boxplot. The median, 25th percentile and 75th percentile are indicated. Error bars indicate 5th and 95th percentiles. (c) Representative L-D curves obtained from indenting PCa cells in the tumoroids at maximum indentation depth 1000 nm on day 23+5, day 23+10 and day 23+20 indicating respective residual indentation depth, hf.
2.5. Immunocytochemistry
Immunocytochemical analysis was performed for F-Actin, Tubulin, and Nuclei of the PCa ‘single-cells’ and Tumoroid cells formed in MSCs+PCa SC (Sequential culture of MSCs with prostate cancer cells). Tumoroid cells were analyzed at day 23+5, 23+10, and 23+20. PCa ‘single-cells’ and Tumoroid samples were fixed with 4% paraformaldehyde (PFA) for 30 minutes and then washed three times with fresh 1X PBS (five minutes). Staining and subsequent imaging methods utilized are described in Appendix II. Volumes of F-actin α-tubulin and nuclei were calculated in Imaris using the developer’s protocol (Supplementary fig. S4). The size of individual cells was measured using the Z-stack images of single and tumoroid cells, and the size distribution is shown in Supplementary fig. S5.
2.6. qRT-PCR and gene expression analysis
The mRNAs were extracted from the PCa ‘single-cells’ and tumoroids using TRI reagent (Sigma) and purified using Direct-zol™ RNA MiniPrep (Zymo Research). Details of the reverse transcription of cDNA and calculation of the target gene expression are shown in Appendix III. Primer sequences and listed in Appendix IV.
2.7. Statistical analysis
Statistical analysis was performed using Student’s t-test to compare two conditions. Differences were considered significant at *P<0.05, **P<0.005, and ***P<001. For the distribution of Elastic modulus, E; maximum force, maxF; and residual indentation depth, hf; Tukey’s box-and-whiskers plots were used to indicate median, 25th percentile, and 75th percentile. All experiments were conducted with a minimum of 3 biological replicates. The column bar data is represented as a mean ±standard deviation(SD).
3. Results
As seen in figure 1, the PCa cells exhibit a grape-cluster morphology with tight cellular junctions and distinguishable cellular boundaries. Prior studies on these tumoroids indicated these cells’ hypoxic conditions as ascertained using expressions of HIF1 and VEGF (Molla, Katti, et al. 2018). On the other hand, PCa cells before seeding to the bone scaffolds (‘single-cells’) are mostly unattached and lack cellular junctions and hypoxic regions.
Figure 1.
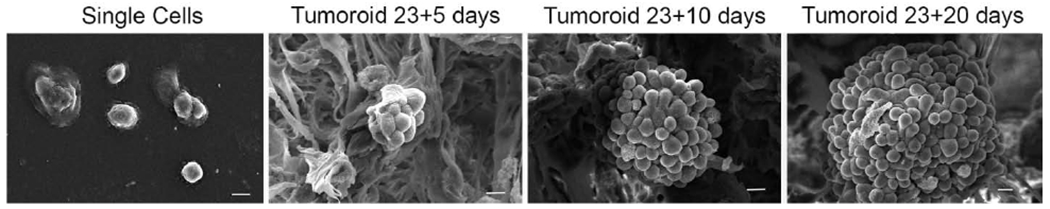
SEM micrographs showing PCa ‘single cells’ and tumoroids formed by PCa cells at day 23+5, 23+10, and day 23+20 (day 23+X implies MSCs cultured for 23 days to form bone tissue and then PCa cells cultured on bone tissue for X days). The length of the micron bar is 10 μm.
3.1. PCa cells soften as they undergo MET and form tumoroids
The box plot in Figure 2a shows the distribution of elastic modulus, E of prostate cancer (PCa) cells before (‘single-cells’) and after (tumoroid cells) undergoing MET at maximum indentation depths of 500 nm and 1000 nm. Based on the relatively small indentor contact area (~20 μm2at 1000nm indentation) compared to the surface area of cells in a tumoroid (~80 μm2), the indentation responses primarily arise from individual cells. Figure 2a indicates that the elastic modulus, E of tumoroid cells, is significantly lower than the elastic modulus of ‘single-cells.’ It also indicates that elastic moduli are independent of indentation depth. At both 500 nm and 1000 nm indentation depths, the tumoroid cells exhibit significantly lower elastic moduli than ‘single-cells.’ In the case of both tumoroid cells and ‘single-cells,’ the elastic modulus values obtained at both indentation depths are similar. Since the cellular sizes are ~10μm, the depths penetrated in all cases enable evaluations of cells’ mechanical behavior without the influence of the substrate. The representative load-displacement (L-D) curves for tumoroid cells and ‘single-cells’ at the indentation depth 500 nm and 1000 nm are shown in figure 2b, and the respective elastic moduli or E values are indicated. Figure 2c shows the mean elastic modulus for ‘single-cells’ and tumoroid cells at indentation depths of 500 nm and 1000 nm. At 500 nm, the elastic modulus of tumoroid cells is 5.7 MPa (SD=0.69), which is 4.8 times lower than the elastic modulus of ‘single-cells’ (E=27.74, SD=19.3). In comparison, at 1000 nm, the elastic modulus of tumoroid cells is 5.8 MPa (SD=2.09), which is ~4.1 times lower than the elastic modulus of ‘single-cells’ (E=24.28 MPa, SD=8.4). The median E values for the ‘single-cells’ at 500 nm and 1000 nm indentation depths are 19.43 MPa and 20.52 MPa. At indentation depth of 500 nm, the median maximum forces required for tumoroid cells and ‘single-cells’ are 3.78 μN and 12.06 μN, respectively, which increases to 10.48 μN and 51.26 μN at 1000 nm indentation depth. For both indentation depths, the maximum force required to indent tumoroid cells is significantly lower than that for the ‘single-cells.’ Figure 2 indicates that prostate cancer cells’ stiffness decreases significantly after MET and tumoroid formation.
3.2. Tumoroids soften with the evolution of cancer over time
We performed nanoindentation experiments at days 5, 10, and 20 after seeding the cancer cells on tissue-engineered bone scaffolds. The distribution of elastic modulus, E for tumoroid cells for indentation depths 500 nm and 1000 nm, is shown in figure 3a by the box plot. In these data, E23+X denotes the elastic modulus of tumoroid cells at day 23+X. As observed, at indentation depth of 1000 nm, the differences between E23+5 and E23+10 are not statistically significant. However, the observed E23+20 is significantly lower than the E23+5. At the indentation depth of 500 nm, E23+10 is observed to be significantly lower than E23+5, and E23+20 is significantly lower than E23+10. Figure 3b indicates that at the indentation depth of 1000 nm, the elastic modulus of tumoroid cells decreases by ~25.55% from day 23+5 to day 23+20. At the indentation depth 500 nm, the elastic modulus of tumoroid cells decreases by ~10.58% from day 23+5 to day 23+10, by ~18.52% from day 23+10 to day 23+20, and by ~27.15% from day 23+5 to day 23+20. Figure 3c and 3d show a decrease in the elastic moduli for tumoroid cells with time progression at both the two indentation depths of 500 nm and 1000 nm. Further, a reduced slope of the L-D curve is also observed during the disease progression from day 23+5 to 23+20. The distribution of the maximum force (maxF) needed for each indent at the indentation depth 500 nm and 1000 nm is shown in figure 3e and f, respectively. At the indentation depth of 1000 nm (figure 3f), the maxF23+20 is significantly lower than maxF23+10 and maxF23+5. Here, maxF23+X denotes the maximum force required to indent tumoroid cells at day 23+X. However, maxF23+5 and maxF23+10 are not significantly different. A gradual decrease in maxF23+X is seen at 500 nm indentation. Thus, a progressive reduction in the stiffness of prostate cancer cells occurs at the bone-metastatic site with the progression of the disease. We also observed a gradual reduction of the nucleus size in the tumoroid cells with the evolution of cancer over time, as shown in Supplementary Figure S1. Alteration in the nucleus’ size has been reported as one of the morphological changes observed with the disease progression (Zink, Fischer, et al. 2004) and associated with the reduced modulus (Zhou, Zheng, et al. 2013).
3.3. Mechanical plasticity of tumoroid cells increases with the disease progression
The L-D curves obtained from indentation suggest incomplete shape recovery owing to the plastic deformation of cellular components (Bonakdar, Gerum, et al. 2016) after each indentation. The distributions of residual indentation depth (unrecovered displacement), hf for the ‘single-cells,’ and tumoroid cells at day 23+5, 23+10, and 23+20 are shown in the figure 4a and b for the indentation depths 1000 nm and 500 nm by the box plots. At the 1000 nm indentation (figure 4a), hf(23+5) is significantly higher than hf(single); hf(23+X) is the residual indentation depth for tumoroid cells at day 23+X, and hf(single) is the residual indentation depth for ‘single-cells’). The difference between hf(23+5) and hf(23+10). At the indentation depth of 500 nm (figure 4b), the difference between hf values is not significant. In figure 4c, the representative L-D curves (indicated by red arrows) show a gradual increase of residual indentation depth for tumoroid cells from day 23+5 to day 23+20. Hence, the mechanical plasticity of tumoroid cells increases with the disease progression at the bone-metastatic site.
3.4. Softening of PCa cells is mediated by actin
Representative micrographs of F-actin (red-stained) and α-tubulin (green-stained) immunostained PCa ‘single-cells’ and tumoroid cells are shown in figure 5a (additional micrographs are provided in Supplementary fig. S1). As seen, F-actin density appears significantly lower in tumoroid cells than ‘single-cells,’ but no significant difference in the density of α-tubulin is observed. Further, we calculated the total volume of F-actin and α–tubulin per cell in the single-cell and tumoroid samples using the methodology described in the materials and methods section. As seen in figure 5b, the volume of F-actin per cell is significantly reduced in the tumoroid cells compared to ‘single-cells.’ At the same time, no significant changes were observed in the amount of α-tubulin. From the micrographs (figure 5a), we observe that α–tubulin exhibits well defined fibrous structure arising from the perinuclear region. The α–tubulins are randomly spread in the cytoplasm, and there are no significant differences in their distribution between ‘single-cells’ and tumoroid cells. In the ‘single-cells,’ F-actin fibers exhibit a diffused distribution in the cytoplasm. F-actin molecules are distributed throughout the ‘single-cells’ cell body. However, in tumoroid cells, F-actin is predominantly concentrated at the cell-junctions. Further, we reconstructed the 3D structure of F-actin, α–tubulin, and nucleus of the cells from the immunostained confocal micrographs using the software IMARIS. Representative 3D reconstructed images are shown in figure 5d (additional images are shown in Supplementary fig. S2). A significant presence of F-actin at the apical region of the ‘single-cells’ and F-actin’s localization at the cellular junctions in the tumoroid cells is observed.
Figure 5.
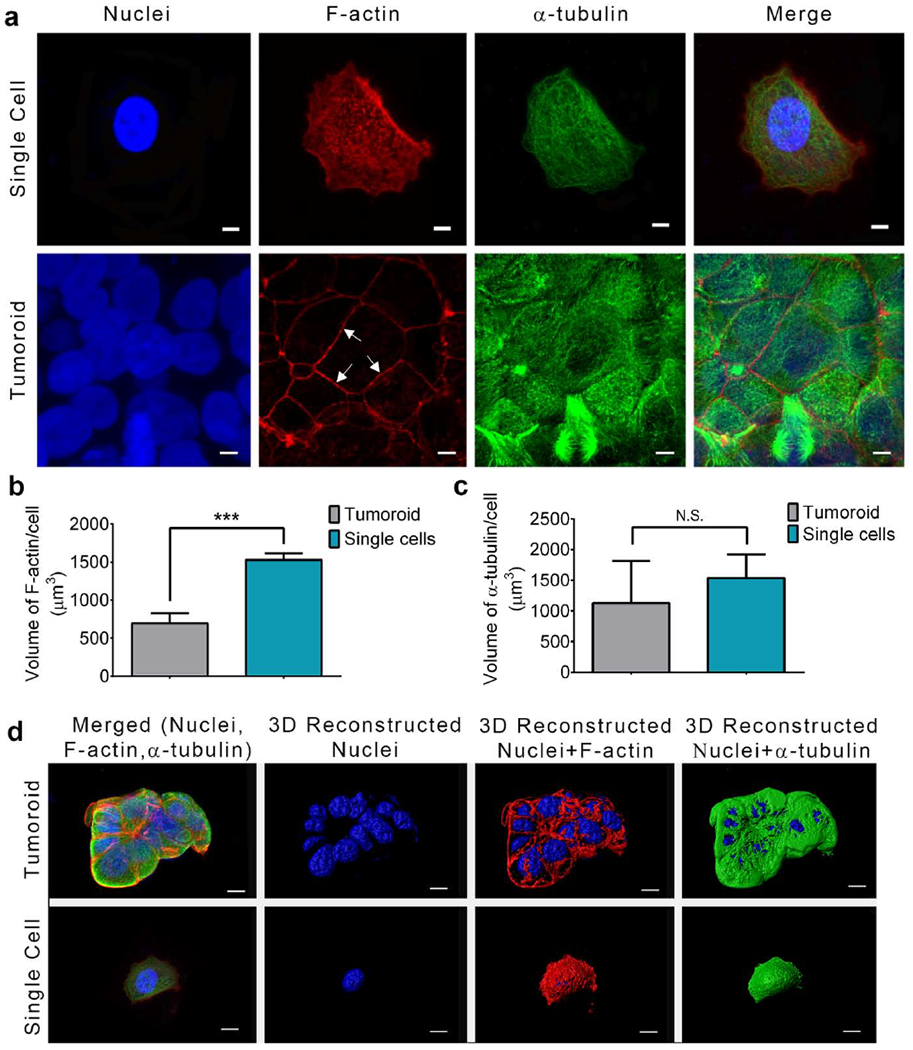
Softening of PCa cells with disease progression is mediated by F-actin. (a) Immunostained confocal micrographs of PCa single cell and PCa cell in the tumoroid stained with Phalloidin (F-actin, red), Anti-α-tubulin (α-tubulin, green), and DAPI (Nucleus, blue). Arrows indicate localization of F-actin at the cellular junctions in the tumoroid. The length of the micron bar is 5 μm. (b) The volume of F-actin/cell in the PCa ‘single cells’ and tumoroids. Data presented as mean±standard deviation. ***p < 0.001. (c) The volume of α-tubulin/cell in the PCa ‘single cells’ and tumoroids. Data presented as mean±standard deviation. (d) 3D reconstructed immunostained confocal micrographs of PCa single cell and PCa cell in the tumoroid stained with Phalloidin (F-actin, red), Anti-α-tubulin (α-tubulin, green), and DAPI (Nucleus, blue). Arrows indicate localization of F-actin at the cellular junctions in the tumoroid. The length of the micron bar is 5 μm.
3.5. Actin-associated genes downregulate with the evolution of cancer over time
We evaluated the expression of genes related to actin dynamics using qRT-PCR experiments. Figure 6a illustrates the role of different actin-associated molecules and expression of the genes N-WASp, Arp2, Arp3, thymosin β4, CDC42, and cortactin in the tumoroid cells observed at day 23+5, 23+10, and 23+20 as seen in Figure 6b. The PCa ‘single-cells’ served as the control, and GAPDH was used as a housekeeping gene is shown in figure 6b. No significant (multifold) changes of N-WASp in the tumoroid cells at day 23+5 and day 23+10 were observed, but N-WASp downregulated ~3 fold at day 23+20 as compared to PCa ‘single-cells’. Arp 2 downregulated ~2 fold at day 23+10 and ~8.5 fold at day 23+20 in the tumoroid cells compared to PCa ‘single-cells’. No significant Arp3 expression changes were observed in the tumoroid cells at day 23+5 and 23+10; however, Arp3 downregulated ~4 fold at day 23+20 compared to PCa ‘single-cells’. Further, Thymosin β4 was significantly downregulated in the tumoroid cells, and fold-change was ~8, ~9, and ~58 at day 23+5, 23+10, and 23+20, respectively, as compared to PCa ‘single-cells’. CDC42 downregulated ~17 fold, ~28 fold, and ~108 fold at day 23+5, 23+10, and 23+20 respectively in the tumoroid cells compared to PCa ‘single-cells’. No significant cortactin changes were observed in the tumoroid cells at day 23+5 and day 23+10, but cortactin was downregulated ~5 fold at day 23+20 compared to PCa ‘single-cells’.
Figure 6.
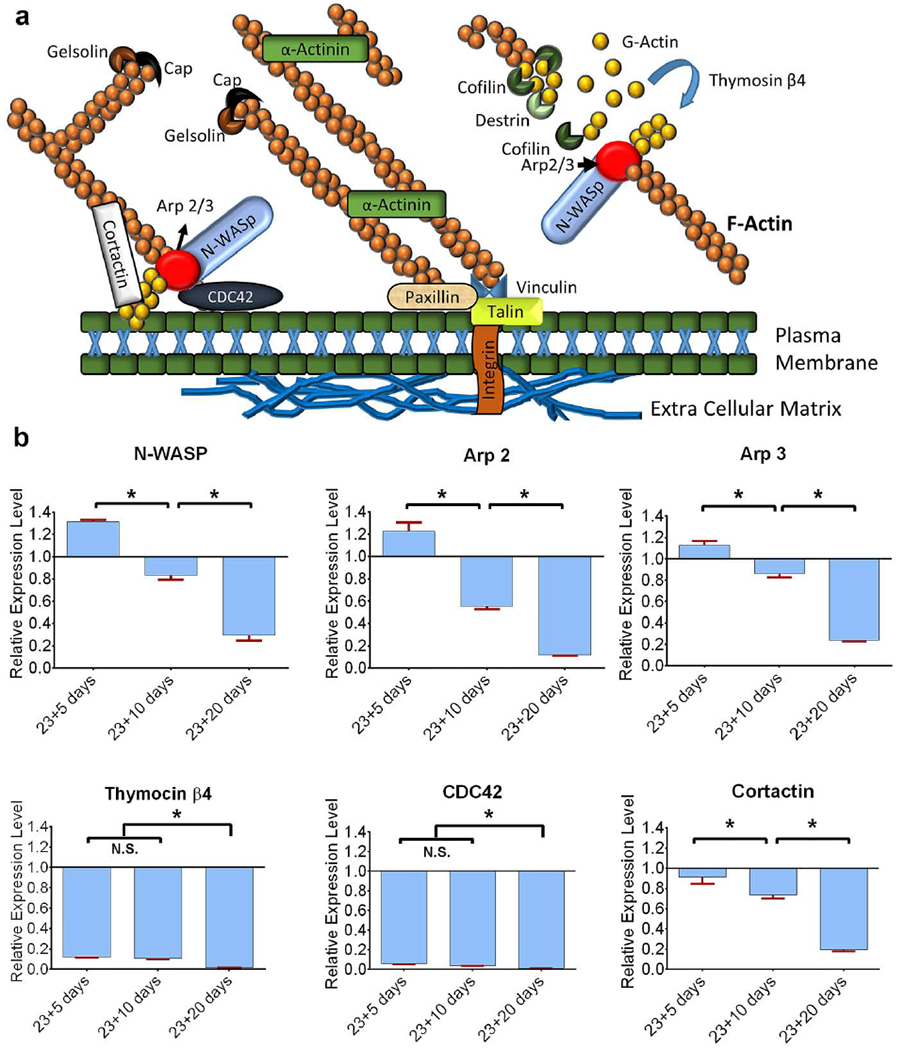
Actin regulatory genes downregulate with the cancer progression at the metastatic site. (a) The schematic diagram shows the role of different proteins in actin dynamics. N-WASp activates Arp2/3 to nucleate new actin filaments. Cortactin recruits Arp2/3 in the cortical region of a cell. CDC42 play role to initiate actin reorganization and localize the N-WASp-Arp2/3 complex to the plasma membrane. Thymosin β4 reorganizes G actin to initiate actin filaments.
Gelsolin and cofilin sever actin filaments. Actinin branches two actin filaments. Paxillin and Talin bind actin to the extracellular matrix. (b) Relative gene expression levels of N-WASp, Arp2/3, thymosin β4, CDC42, and cortactin for PCa tumoroid cells on day 23+5, day 23+10 and day 23+20. Expression levels are normalized to GAPDH, and PCa ‘single cells’ served as a control. Results are shown as a mean ± standard deviation. *p < 0.05.
4. DISCUSSION
In this study, we report changes to nanomechanical properties of MDA PCa2b prostate cancer cells and tumoroids during MET and with the progression of cancer in a tissue-engineered in vitro bone microenvironment of bone metastasis. We applied the Oliver and Pharr analysis method (Oliver and Pharr 1992) to derive the elastic modulus of the PCa cells. Using this method, adhesion between tip indenter and the sample can lead to overestimation of elastic modulus. Some other challenging procedures associated with measuring accurate elastic modulus include precise calibration of the indenter spring constant, the accurate depiction of the indenter geometry, and precise identification of the contact point. In this study, the changes in nanomechanical properties of PCa cells have been described quantitatively by using the relative value of the elastic’s modulus that describes changes to nanomechanical properties with the evolution of cancer over time and hence demonstrate the use of direct nanomechanical measurements to investigate cancer bone metastasis.
Most indentation studies on human cells are performed within an indentation depth range of ~300-500nm (Gavara 2017). The mechanical properties observed at shallow indentation arise primarily from actin filaments, whereas deeper indents (>500nm) probe the overall mechanics of whole cells (Pogoda, Jaczewska, et al. 2012). At shallow indents, the elastic moduli from cancerous and benign cells are not observed to be different. Still, a significant lower elastic modulus of cancer cells was reported compared to their normal counterparts with deeper indentation (Pogoda, Jaczewska, et al. 2012). We used two different indentation depths of 500 nm and 1000 nm for displacement controlled nanoindentation in light of these facts. Since the sizes of PCa cells are ≥10 μm, an indentation depth >1000 nm was not used to avoid substrate effect on the measured elastic moduli (Saha and Nix 2002, Chen and Bull 2009).
In this study, we observed that PCa cells’ stiffness decreases (figures 2 and 3) but mechanical plasticity increases (figure 4) with metastasis, suggesting that PCa cells become softer when they undergo MET and further softer with disease progression.
Our results show that PCa ‘single-cells’ possess a more pronounced F-actin filament network than PCa tumoroid cells. The F-actin amount decreases with a decreased elastic modulus of PCa cells. Still, no significant changes in the amount of α-tubulin were observed, suggesting that F-actin is primarily responsible for cell softening. The specific role of volume content and orientation changes of tubulins during metastasis progression would be investigated in future studies. The quantitative data between ‘single-cells’ and tumoroids does indicate that change in tubulin content is not significant, while a significant change in F-actin content is observed. A reduced amount of F-actin has been known to reduce modulus (Guck, Schinkinger, et al. 2005). An inconsequential role of the microtubules on the modulus is also reported (Charras and Horton 2002). We observed a significant reduction of F-actin on the apical regions of PCa cells in the tumoroids and organization of the F actin at the cellular junctions (figure 5a, indicated by white arrows), unlike that of ‘single-cells.’ Tight cell-cell junction in the tumoroid cells is associated with the overexpression of transmembrane adhesion molecule E-cadherin (Molla, Katti, et al. 2018). It is known that E-cadherin binds to F-actins via β-catenin to stabilize tight junctions (Weis and Nelson 2006), which explains why F-actin assembles at cell junctions. Since phalloidin stains only F-actin and not G-actin, depolymerized actins were not observed on the apical regions of tumoroid cells suggesting radical depolymerization of F-actin is associated with the gradual decrease of stiffness in the tumoroid cells with the disease progression. The dramatic depolymerization of F-actin is also consistent with the observed downregulation of actin regulatory molecules (N-WASp, Arp2/3, Cortactin, and Thymosin β4). The mechanisms of activities of these molecules is shown in Appendix V (Dos Remedios et al. 2003).
In summary, we report changes to MDA-PCa-2b prostate cancer cells’ nanomechanical properties during MET and with the disease progression at the metastatic site. Thus, nanomechanical indentation captures both the mechanics of the material and the evolving cell ‘structure’ as metastasis progresses since deeper indents probe larger volumes of the cancer cells. Our results indicate that the depolymerization of F-actin induces the softening of PCa cells in the tumoroids. This study provides valuable data in understanding the biophysical mechanisms associated with skeletal metastasis of prostate cancer. It demonstrates the use of direct nanomechanical measurements for evaluation of disease progression at metastasis.
Supplementary Material
Table 1:
List of primer sequences used for qRT-PCR experiments.
| Genes | Primers |
|---|---|
| N-WASP | F-5’ -ACTGTTAGACCAGATACGACAGGGT-3’ R-5’-TGCAGGTGTTGGTGGTGTAGA-3’ |
| Arp2 | F: 5’-GGAGTTGGTGTTGCTGAAT-3’ R: 5’-TAGTAGACCCTCCAGAAAGC-3’ |
| Arp 3 | F: 5’-CAATCCTTGGAAACTGCTA-3’ R:5’-CCATTTTGACCCATCTGTA-3’ |
| CDC42 | F: 5’-ATGCAGACAATTAAGTGTGTTGTTGTGGGCGA-3’ R: 5’- TCATAGCAGCACACACCTGCGGCTCTTCTT-3’ |
| Thymosin β4 | F: 5’-GGCCACTGCGCAGACCAGACT-3’ R : 5’-CTTGATCCAACCTCTTTGCATCTTACAA-3’ |
| Cortactin | F: 5’-AAAGCTTCAGCAGGCCAC-3’ R: 5’-TTTGGTCCTGTTTCAAGTTCC-3’ |
Acknowledgments
This work was supported by NDSU “Center for Engineered Cancer Test-Beds.” Support from NIH UND0024344-S7 and NSF OIA NDACES-1946202 is also acknowledged. Dr. Tao Wang, Manager, core biology facility at NDSU, is acknowledged for help with qRT PCR and Dr. Pawel Borowicz, Advanced Imaging and Microscopy (AIM) Core Lab, for confocal imaging. ND EPSCoR is acknowledged for the “Doctoral Dissertation Award” for MSM.
Footnotes
Publisher's Disclaimer: This is a PDF file of an unedited manuscript that has been accepted for publication. As a service to our customers we are providing this early version of the manuscript. The manuscript will undergo copyediting, typesetting, and review of the resulting proof before it is published in its final form. Please note that during the production process errors may be discovered which could affect the content, and all legal disclaimers that apply to the journal pertain.
Declaration of Conflict of Interest
The authors declare that they do not have any conflict of interest.
References
- Ambre A, Katti KS and Katti DR (2011). “In situ mineralized hydroxyapatite on amino acid modified nanoclays as novel bone biomaterials.” Materials Science & Engineering C-Materials for Biological Applications 31(5): 1017–1029. [DOI] [PubMed] [Google Scholar]
- Ambre AH, Katti DR and Katti KS (2013). “Nanoclays mediate stem cell differentiation and mineralized ECM formation on biopolymer scaffolds.” Journal of Biomedical Materials Research Part A 101(9): 2644–2660. [DOI] [PubMed] [Google Scholar]
- Ambre AH, Katti DR and Katti KS (2015). “Biomineralized hydroxyapatite nanoclay composite scaffolds with polycaprolactone for stem cell-based bone tissue engineering.” Journal of Biomedical Materials Research Part A 103(6): 2077–2101. [DOI] [PubMed] [Google Scholar]
- Ambre AH, Katti KS and Katti DR (2010). “Nanoclay Based Composite Scaffolds for Bone Tissue Engineering Applications.” Journal of Nanotechnology in Engineering and Medicine 1(3): 031013–031013. [Google Scholar]
- Angeloni V, Contessi N, De Marco C, Bertoldi S, Tanzi MC, Daidone MG and Fare S (2017). “Polyurethane foam scaffold as in vitro model for breast cancer bone metastasis.” Acta Biomaterialia 63: 306–316. [DOI] [PubMed] [Google Scholar]
- Bao G and Suresh S (2003). “Cell and molecular mechanics of biological materials.” Nature Materials 2(11): 715–725. [DOI] [PubMed] [Google Scholar]
- Berish RB, Ali AN, Telmer PG, Ronald JA and Leong HS (2018). “Translational models of prostate cancer bone metastasis.” Nature Reviews Urology: 1. [DOI] [PubMed] [Google Scholar]
- Bonakdar N, Gerum R, Kuhn M, Spörrer M, Lippert A, Schneider W, Aifantis KE and Fabry B (2016). “Mechanical plasticity of cells.” Nature materials 15(10): 1090. [DOI] [PubMed] [Google Scholar]
- Charras GT and Horton MA (2002). “Single cell mechanotransduction and its modulation analyzed by atomic force microscope indentation.” Biophysical journal 82(6): 2970–2981. [DOI] [PMC free article] [PubMed] [Google Scholar]
- Chen J and Bull SJ (2009). “On the factors affecting the critical indenter penetration for measurement of coating hardness.” Vacuum 83(6): 911–920. [Google Scholar]
- Choudhary S, Ramasundaram P, Dziopa E, Mannion C, Kissin Y, Tricoli L, Albanese C, Lee W and Zilberberg J (2018). “Human ex vivo 3D bone model recapitulates osteocyte response to metastatic prostate cancer.” Scientific Reports 8: 12. [DOI] [PMC free article] [PubMed] [Google Scholar]
- Dhurjati R, Krishnan V, Shuman LA, Mastro AM and Vogler EA (2008). “Metastatic breast cancer cells colonize and degrade three-dimensional osteoblastic tissue in vitro.” Clinical & Experimental Metastasis 25(7): 741–752. [DOI] [PubMed] [Google Scholar]
- Fife CM, McCarroll JA and Kavallaris M (2014). “Movers and shakers: cell cytoskeleton in cancer metastasis.” British journal of pharmacology 171(24): 5507–5523. [DOI] [PMC free article] [PubMed] [Google Scholar]
- Gavara N (2017). “A Beginner’s guide to atomic force microscopy probing for cell mechanics.” Microscopy research and technique 80(1): 75–84. [DOI] [PMC free article] [PubMed] [Google Scholar]
- Girard YK, Wang C, Ravi S, Howell MC, Mallela J, Alibrahim M, Green R, Hellermann G, Mohapatra SS and Mohapatra S (2013). “A 3D fibrous scaffold inducing tumoroids: a platform for anticancer drug development.” PloS one 8(10): e75345. [DOI] [PMC free article] [PubMed] [Google Scholar]
- Griffith LG and Swartz MA (2006). “Capturing complex 3D tissue physiology in vitro.” Nature reviews Molecular cell biology 7(3): 211. [DOI] [PubMed] [Google Scholar]
- Guck J, Schinkinger S, Lincoln B, Wottawah F, Ebert S, Romeyke M, Lenz D, Erickson HM, Ananthakrishnan R and Mitchell D (2005). “Optical deformability as an inherent cell marker for testing malignant transformation and metastatic competence.” Biophysical journal 88(5): 3689–3698. [DOI] [PMC free article] [PubMed] [Google Scholar]
- Guz N, Dokukin M, Kalaparthi V and Sokolov I (2014). “If cell mechanics can be described by elastic modulus: study of different models and probes used in indentation experiments.” Biophysical journal 107(3): 564–575. [DOI] [PMC free article] [PubMed] [Google Scholar]
- Hao SJ, Ha LR, Cheng G, Wan Y, Xia YQ, Sosnoski DM, Mastro AM and Zheng SY (2018). “A Spontaneous 3D Bone-On-a-Chip for Bone Metastasis Study of Breast Cancer Cells.” Small 14(12): 10. [DOI] [PubMed] [Google Scholar]
- He F, Chiou AE, Loh HC, Lynch M, Seo BR, Song YH, Lee MJ, Hoerth R, Bortel EL, Willie BM, Duda GN, Estroff LA, Masic A, Wagermaier W, Fratzl P and Fischbach C (2017). “Multiscale characterization of the mineral phase at skeletal sites of breast cancer metastasis.” Proceedings of the National Academy of Sciences of the United States of America 114(40): 10542–10547. [DOI] [PMC free article] [PubMed] [Google Scholar]
- Herroon MK, Diedrich JD and Podgorski I (2016). “New 3D-Culture Approaches to Study Interactions of Bone Marrow Adipocytes with Metastatic Prostate Cancer Cells.” Frontiers in Endocrinology 7: 15. [DOI] [PMC free article] [PubMed] [Google Scholar]
- Hessler JA, Budor A, Putchakayala K, Mecke A, Rieger D, Holl MMB, Orr BG, Bielinska A, Beals J and Baker J (2005). “Atomic force microscopy study of early morphological changes during apoptosis.” Langmuir 21(20): 9280–9286. [DOI] [PubMed] [Google Scholar]
- Holen I, Nutter F, Wilkinson JM, Evans CA, Avgoustou P and Ottewell PD (2015). “Human breast cancer bone metastasis in vitro and in vivo: a novel 3D model system for studies of tumour cell-bone cell interactions.” Clinical & experimental metastasis 32(7): 689–702. [DOI] [PubMed] [Google Scholar]
- Hoyt K, Castaneda B, Zhang M, Nigwekar P, di Sant’Agnese PA, Joseph JV, Strang J, Rubens DJ and Parker KJ (2008). “Tissue elasticity properties as biomarkers for prostate cancer.” Cancer Biomarkers 4(4-5): 213–225. [DOI] [PMC free article] [PubMed] [Google Scholar]
- Hutmacher DW (2010). “Biomaterials offer cancer research the third dimension.” Nature materials 9(2): 90–93. [DOI] [PubMed] [Google Scholar]
- Iida K, Sakai R, Yokoyama S, Kobayashi N, Togo S, Yoshikawa HY, Rawangkan A, Namiki K and Suganuma M (2017). “Cell softening in malignant progression of human lung cancer cells by activation of receptor tyrosine kinase AXL.” Scientific reports 7(1): 17770. [DOI] [PMC free article] [PubMed] [Google Scholar]
- Kar S, Jasuja H, Katti DR and Katti KS (2020). “Wnt/beta-Catenin Signaling Pathway Regulates Osteogenesis for Breast Cancer Bone Metastasis: Experiments in an In Vitro Nanoclay Scaffold Cancer Testbed.” Acs Biomaterials Science & Engineering 6(5): 2600–2611. [DOI] [PubMed] [Google Scholar]
- Kar S, Katti DR and Katti KS (2019). “Fourier transform infrared spectroscopy based spectral biomarkers of metastasized breast cancer progression.” Spectrochimica Acta Part a-Molecular and Biomolecular Spectroscopy 208: 85–96. [DOI] [PubMed] [Google Scholar]
- Kar S, Katti DR and Katti KS (2020). “Bone interface modulates drug resistance in breast cancer bone metastasis.” Colloids and surfaces. B, Biointerfaces 195: 111224–111224. [DOI] [PubMed] [Google Scholar]
- Kar S, Molla MDS, Katti DR and Katti KS (2019). “Tissue-engineered nanoclay-based 3D in vitro breast cancer model for studying breast cancer metastasis to bone.” Journal of Tissue Engineering and Regenerative Medicine 13(2): 119–130. [DOI] [PubMed] [Google Scholar]
- Katti DR and Katti KS (2017). “Cancer cell mechanics with altered cytoskeletal behavior and substrate effects: A 3D finite element modeling study.” Journal of the mechanical behavior of biomedical materials 76: 125–134. [DOI] [PubMed] [Google Scholar]
- Katti DR, Katti KS, Molla S and Kar S (2019). Biomechanics of Cells as Potential Biomarkers for Diseases: A New Tool in Mechanobiology. Encyclopedia of Biomedical Engineering. Narayan R. Oxford, Elsevier: 1–21. [Google Scholar]
- Katti KS, Ambre AH, Payne S and Katti DR (2015). “Vesicular delivery of crystalline calcium minerals to ECM in biomineralized nanoclay composites.” Materials Research Express 2(4). [Google Scholar]
- Katti KS, Molla MDS, Karandish F, Haidar MK, Mallik S and Katti DR (2016). “Sequential culture on biomimetic nanoclay scaffolds forms three-dimensional tumoroids.” Journal of Biomedical Materials Research Part A 104(7): 1591–1602. [DOI] [PubMed] [Google Scholar]
- Khanna R, Katti KS and Katti DR (2012). “Experiments in Nanomechanical Properties of Live Osteoblast Cells and Cell-Biomaterial Interface.” J Nanotechnol Eng Med 2(4): 041005 (Pages 041013). [Google Scholar]
- Lekka M (2016). “Discrimination Between Normal and Cancerous Cells Using AFM.” Bionanoscience 6(1): 65–80. [DOI] [PMC free article] [PubMed] [Google Scholar]
- Lekka M, Laidler P, Gil D, Lekki J, Stachura Z and Hrynkiewicz AZ (1999). “Elasticity of normal and cancerous human bladder cells studied by scanning force microscopy.” European Biophysics Journal with Biophysics Letters 28(4): 312–316. [DOI] [PubMed] [Google Scholar]
- Liu Z and Vunjak-Novakovic G (2016). “Modeling tumor microenvironments using custom-designed biomaterial scaffolds.” Current Opinion in Chemical Engineering 11: 94–105. [DOI] [PMC free article] [PubMed] [Google Scholar]
- Marlow R and Dontu G (2015). Modeling the Breast Cancer Bone Metastatic Niche in Complex Three-Dimensional Cocultures. Mammary Stem Cells: Methods and Protocols. Vivanco MD. Totowa, Humana Press Inc. 1293: 213–220. [DOI] [PubMed] [Google Scholar]
- Molla MDS, Katti DR and Katti KS (2019). “An in vitro model of prostate cancer bone metastasis for highly metastatic and non-metastatic prostate cancer using nanoclay bone-mimetic scaffolds.” MRS Advances 4(21): 1207–1213. [Google Scholar]
- Molla MS, Katti DR, Iswara J, Venkatesan R, Paulmurugan R and Katti KS (2020). “Prostate Cancer Phenotype Influences Bone Mineralization at Metastasis: A Study Using an In Vitro Prostate Cancer Metastasis Testbed.” JBMR plus 4(2): e10256–e10256. [DOI] [PMC free article] [PubMed] [Google Scholar]
- Molla S, Katti DR and Katti KS (2018). “In vitro design of mesenchymal to epithelial transition of prostate cancer metastasis using 3D nanoclay bone-mimetic scaffolds.” Journal of Tissue Engineering and Regenerative Medicine 12(3): 727–737. [DOI] [PubMed] [Google Scholar]
- Oliver WC and Pharr GM (1992). “An improved technique for determining hardness and elastic modulus using load and displacement sensing indentation experiments.” Journal of materials research 7(06): 1564–1583. [Google Scholar]
- Pathi SP, Lin DDW, Dorvee JR, Estroff LA and Fischbach C (2011). “Hydroxyapatite nanoparticle-containing scaffolds for the study of breast cancer bone metastasis.” Biomaterials 32(22): 5112–5122. [DOI] [PMC free article] [PubMed] [Google Scholar]
- Pogoda K, Jaczewska J, Wiltowska-Zuber J, Klymenko O, Zuber K, Fornal M and Lekka M (2012). “Depth-sensing analysis of cytoskeleton organization based on AFM data.” European Biophysics Journal 41(1): 79–87. [DOI] [PubMed] [Google Scholar]
- Qiao H and Tang T (2018). “Engineering 3D approaches to model the dynamic microenvironments of cancer bone metastasis.” Bone Research 6. [DOI] [PMC free article] [PubMed] [Google Scholar]
- Radmacher M, Fritz M, Kacher CM, Cleveland JP and Hansma PK (1996). “Measuring the viscoelastic properties of human platelets with the atomic force microscope.” Biophys J 70(1): 556–567. [DOI] [PMC free article] [PubMed] [Google Scholar]
- Saha R and Nix WD (2002). “Effects of the substrate on the determination of thin film mechanical properties by nanoindentation.” Acta materialia 50(1): 23–38. [Google Scholar]
- Salamanna F, Contartese D, Maglio M and Fini M (2016). “A systematic review on in vitro 3d bone metastases models. A new horizon to recapitulate the native clinical scenario?” Oncotarget 7(28): 44803–44820. [DOI] [PMC free article] [PubMed] [Google Scholar]
- Sawyers CL (2008). “The cancer biomarker problem.” Nature 452(7187): 548. [DOI] [PubMed] [Google Scholar]
- Sieh S, Lubik AA, Clements JA, Nelson CC and Hutmacher DW (2010). “Interactions between human osteoblasts and prostate cancer cells in a novel 3D in vitro model.” Organogenesis 6(3): 181–188. [DOI] [PMC free article] [PubMed] [Google Scholar]
- Sikdar D, Pradhan SM, Katti DR, Katti KS and Mohanty B (2008). “Altered phase model for polymer clay nanocomposites.” Langmuir 24(10): 5599–5607. [DOI] [PubMed] [Google Scholar]
- Sitarski AM, Fairfield H, Falank C and Reagan MR (2018). “3D Tissue Engineered in Vitro Models of Cancer in Bone.” Acs Biomaterials Science & Engineering 4(2): 324–336. [DOI] [PMC free article] [PubMed] [Google Scholar]
- Song JH, Miermont A, Lim CT and Kamm RD (2018). “A 3D microvascular network model to study the impact of hypoxia on the extravasation potential of breast cell lines.” Scientific Reports 8: 11. [DOI] [PMC free article] [PubMed] [Google Scholar]
- Staunton JR, Doss BL, Lindsay S and Ros R (2016). “Correlating confocal microscopy and atomic force indentation reveals metastatic cancer cells stiffen during invasion into collagen I matrices.” Scientific reports 6: 19686. [DOI] [PMC free article] [PubMed] [Google Scholar]
- Suresh S (2007). “Biomechanics and biophysics of cancer cells.” Acta Materialia 55(12): 3989–4014. [DOI] [PMC free article] [PubMed] [Google Scholar]
- Vinckier A and Semenza G (1998). “Measuring elasticity of biological materials by atomic force microscopy.” FEBS letters 430(1-2): 12–16. [DOI] [PubMed] [Google Scholar]
- Weis WI and Nelson WJ (2006). “Re-solving the cadherin-catenin-actin conundrum.” Journal of biological chemistry 281(47): 35593–35597. [DOI] [PMC free article] [PubMed] [Google Scholar]
- Xu WW, Mezencev R, Kim B, Wang LJ, McDonald J and Sulchek T (2012). “Cell Stiffness Is a Biomarker of the Metastatic Potential of Ovarian Cancer Cells.” Plos One 7(10). [DOI] [PMC free article] [PubMed] [Google Scholar]
- Ye M, Mohanty P and Ghosh G (2014). “Biomimetic apatite-coated porous PVA scaffolds promote the growth of breast cancer cells.” Materials Science & Engineering C-Materials for Biological Applications 44: 310–316. [DOI] [PubMed] [Google Scholar]
- Yilmaz M and Christofori G (2009). “EMT, the cytoskeleton, and cancer cell invasion.” Cancer and Metastasis Reviews 28(1-2): 15–33. [DOI] [PubMed] [Google Scholar]
- Zhou Z, Zheng C, Li S, Zhou X, Liu Z, He Q, Zhang N, Ngan A, Tang B and Wang A (2013). “AFM nanoindentation detection of the elastic modulus of tongue squamous carcinoma cells with different metastatic potentials.” Nanomedicine: Nanotechnology, Biology and Medicine 9(7): 864–874. [DOI] [PubMed] [Google Scholar]
- Zhu W, Wang M, Fu YB, Castro NJ, Fu SW and Zhang LG (2015). “Engineering a biomimetic three-dimensional nanostructured bone model for breast cancer bone metastasis study.” Acta Biomaterialia 14: 164–174. [DOI] [PubMed] [Google Scholar]
Associated Data
This section collects any data citations, data availability statements, or supplementary materials included in this article.