

Abstract
Blood circulating microRNAs (c‐miRs) are potential biomarkers to trace aging and longevity trajectories to identify molecular targets for anti‐aging therapies. Based on a cross‐sectional study, a discovery phase was performed on 12 donors divided into four groups: young, old, healthy, and unhealthy centenarians. The identification of healthy and unhealthy phenotype was based on cognitive performance and capabilities to perform daily activities. Small RNA sequencing identified 79 differentially expressed c‐miRs when comparing young, old, healthy centenarians, and unhealthy centenarians. Two miRs, that is, miR‐19a‐3p and miR‐19b‐3p, were found increased at old age but decreased at extreme age, as confirmed by RT‐qPCR in 49 donors of validation phase. The significant decrease of those miR levels in healthy compared to unhealthy centenarians appears to be due to the presence of isomiRs, not detectable with RT‐qPCR, but only with a high‐resolution technique such as deep sequencing. Bioinformatically, three main common targets of miR‐19a/b‐3p were identified, that is, SMAD4, PTEN, and BCL2L11, converging into the FoxO signaling pathway, known to have a significant role in aging mechanisms. For the first time, this study shows the age‐related increase of plasma miR‐19a/b‐3p in old subjects but a decrease in centenarians. This decrease is more pronounced in healthy centenarians and was confirmed by the modified pattern of isomiRs comparing healthy and unhealthy centenarians. Thus, our study paves the way for functional studies using c‐miRs and isomiRs as additional parameter to track the onset of aging and age‐related diseases using new potential biomarkers.
Keywords: aging, extreme phenotypes, isomiRs, longevity, microRNAs, miR‐19a/b‐3p
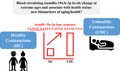
Small RNA deep sequencing on plasma‐derived RNA from 12 donors (young and old subjects, healthy, and unhealthy centenarians) was performed: 79 differentially expressed c‐miRs were identified. MiR‐19a/b‐3p increased at old age but decreased at extreme age, as confirmed by RT‐qPCR in 49 subjects. The decrease was more relevant in healthy centenarians, also confirmed by the modified pattern of isomiRs. Three common targets of miR‐19a/b‐3p were identified converging into the FoxO signaling pathway.
1. INTRODUCTION
Demographic projections report a worldwide increase in human life expectancy over the last few decades. The age‐related stratification of population demography emphasizes the critical importance of identifying new strategies able to counteract or slowdown aging process with the aim of combating the onset of almost all age‐related diseases and geriatric syndromes (ARD‐GS), as suggested by Geroscience (Kennedy et al., 2014). In this perspective, a thorough comprehension of molecular and cellular aspects underlying human aging is of primary importance to improve quality of life and to promote healthy longevity according with WHO (https://www.who.int/ageing/decade‐of‐healthy‐ageing).
As highlighted by our team, aging is not only the major risk factor for ARD‐GS, but it shares the same molecular mechanisms with the above mentioned diseases, as a sort of continuum (Collura et al., 2020; Franceschi et al., 2018; Morsiani et al., 2019). Thus, the study of underpinning mechanisms would favor the discovery of molecular targets for both anti‐aging therapies and for associated pathologies.
In order to follow this strategy, we here chose to study circulating microRNAs (c‐miRs) and their targets as a basis for understanding molecular mechanisms of aging in centenarians. They are an extraordinary model for the study of healthy aging and longevity, since centenarians largely avoid or postpone major age‐related diseases and are characterized by decelerated aging (Giuliani et al., 2017). Moreover, we propose an improved model, considering healthy and unhealthy centenarians with the aim of grasping the differences in terms of blood circulating molecules, as previously published (Teo et al., 2019). Here, the same cross‐sectional study was performed analyzing the four groups composed of young, old, and two cohorts of centenarians divided into healthy and unhealthy individuals. Healthy centenarians have both optimal cognitive and physical status, while unhealthy are in opposite extreme conditions.
This new model allows us to reveal the spreading of aging signals in the blood (Franceschi et al., 2017), including c‐miRs (Olivieri et al., 2017). MiRs are a highly conserved class of small non‐coding RNAs (18–25 nt) and are key regulators of gene expression at post‐transcriptional level. C‐miRs have been shown to impact on various biological processes, such as proliferation, differentiation, and apoptosis. Furthermore, they are recognized as mediators of “inflammaging,” a term used to describe the age‐associated chronic inflammation, and they can be considered as important members of the senescence‐associated secretory phenotype (SASP) (Franceschi et al., 2017; Olivieri et al., 2013a; Terlecki‐Zaniewicz et al., 2018). In fact, some c‐miRs are aberrantly regulated upon aging and during ARD‐GS (Fehlmann et al., 2020; Hackl et al., 2017; Heilmeier et al., 2016; Jung & Suh, 2014; Olivieri et al., 2013b); thus, they are powerful epigenetic biomarkers to trace aging/ARD‐GS and longevity, as recently suggested by our team (Olivieri et al., 2017).
The current study aimed to investigate the differential abundance of c‐miRs in non‐fractionated plasma samples derived from different aged groups by small RNA‐seq and RT‐qPCR in order to identify potential/novel biomarker and regulators of gene expression.
2. RESULTS
2.1. Quality control and normalization of deep sequencing data
The profiling of small RNAs was performed on plasma samples of 12 individuals with different ages and health conditions: 3 young donors, 3 old donors, 3 healthy, and 3 unhealthy centenarians. Summaries of total reads obtained from sequencing and reads mapped on human genome are reported in Table S1 and Figure S1, respectively. Expression counts were defined as Tags Per Million (TPM), and after normalization, 420 miRs were found as commonly expressed in all samples. About 1000 miRs with TPM ≥1 and about 300 with TPM ≥20 were identified as shown in Figure S2. For subsequent analyses, miRs with TPM ≥20 were used.
2.2. Discovery phase: c‐miRs by small RNA‐seq in aging and longevity
In order to identify age‐associated changes, miR abundance analysis was performed according to a classical cross‐sectional study design (young “Y” vs old “O” individuals vs centenarians “C”) for discovery phase. In addition, we compared healthy and unhealthy centenarians (“HC” vs. “UHC”) to identify miRs associated with health status at extreme ages. Applying small RNA‐seq, we obtained 79 miRs differentially expressed among “Y,” “O,” “HC,” and “UHC” groups. The results are shown in Table 1, and TPM values for each group are reported in Table S2. MiR‐19a‐3p and miR‐19b‐3p turned out to be the most highly significant miRs identified comparing healthy and unhealthy centenarians, also having a significant modification through the different age groups. The sequencing data are shown in Figure 1. The miR‐19 family comprises miR‐19a and miR‐19b where the mature miRs differ solely in a single base; thus, we will further use the annotation miR‐19a/b‐3p. Those two miRs were further selected for the validation phase by RT‐qPCR using samples obtained from 49 donors.
TABLE 1.
Seventy‐nine significant miRs comparing the four age groups
| miRNA | Young versus Old | Young versus Healthy Centenarians | Young versus Unhealthy Centenarians | Old versus Healthy Centenarians | Old versus Unhealthy Centenarians | Healthy versus Unhealthy Centenarians | ||||||
|---|---|---|---|---|---|---|---|---|---|---|---|---|
| logFC | p Value | logFC | p Value | logFC | p Value | logFC | p Value | logFC | p Value | logFC | p Value | |
| hsa‐miR‐19b‐3p | −0.45 | 0.44195 | 3.22 | 0.00000 | 0.74 | 0.20705 | 3.67 | 0.00000 | 1.19 | 0.04460 | −2.47 | 0.00007 |
| hsa‐miR‐19a‐3p | −0.61 | 0.32607 | 2.72 | 0.00005 | 0.12 | 0.85258 | 3.32 | 0.00000 | 0.72 | 0.24727 | −2.60 | 0.00010 |
| hsa‐miR‐4433b‐3p | −0.62 | 0.33335 | 0.12 | 0.85214 | −2.10 | 0.00143 | 0.73 | 0.25130 | −1.49 | 0.02113 | −2.22 | 0.00083 |
| hsa‐miR‐145‐5p | −0.36 | 0.53771 | 1.06 | 0.07674 | −0.87 | 0.14561 | 1.42 | 0.01820 | −0.50 | 0.39550 | −1.93 | 0.00168 |
| hsa‐miR‐10b‐5p | −0.23 | 0.67868 | 0.98 | 0.08227 | −0.78 | 0.16622 | 1.21 | 0.03251 | −0.55 | 0.32911 | −1.76 | 0.00225 |
| hsa‐miR‐6503‐3p | 0.04 | 0.96595 | 3.80 | 0.01057 | −0.76 | 0.50871 | 3.76 | 0.01061 | −0.80 | 0.47532 | −4.56 | 0.00318 |
| hsa‐miR‐4485‐3p | −2.65 | 0.00097 | −4.27 | 3.88E−07 | −2.08 | 0.01359 | −1.62 | 0.02325 | 0.57 | 0.44840 | 2.19 | 0.00447 |
| hsa‐miR‐887‐3p | −0.63 | 0.45000 | 1.36 | 0.15532 | −1.37 | 0.12395 | 2.00 | 0.03631 | −0.74 | 0.39679 | −2.73 | 0.00636 |
| hsa‐miR‐598‐3p | 0.48 | 0.48107 | −0.10 | 0.88196 | 1.98 | 0.00975 | −0.58 | 0.39502 | 1.50 | 0.04816 | 2.08 | 0.00679 |
| hsa‐miR‐296‐5p | −0.04 | 0.96455 | 1.85 | 0.04817 | −0.80 | 0.35595 | 1.88 | 0.04359 | −0.77 | 0.37654 | −2.65 | 0.00705 |
| hsa‐miR‐2277‐5p | 1.12 | 0.34804 | −1.25 | 0.30078 | 5.31 | 0.05158 | −2.37 | 0.04967 | 4.19 | 0.14532 | 6.56 | 0.00969 |
| hsa‐miR‐6842‐5p | 2.54 | 0.04601 | −0.89 | 0.44412 | 5.51 | 0.03971 | −3.43 | 0.00821 | 2.97 | 0.33053 | 6.40 | 0.01190 |
| hsa‐miR‐4739 | 2.19 | 0.22166 | 2.19 | 0.37088 | −3.96 | 0.05106 | 0.00 | 1.00000 | −6.14 | 0.00233 | −6.14 | 0.01199 |
| hsa‐miR‐122‐5p | −1.02 | 0.07037 | 0.14 | 0.80639 | 1.52 | 0.00788 | 1.15 | 0.04072 | 2.53 | 0.00002 | 1.38 | 0.01525 |
| hsa‐miR‐31‐5p | −1.88 | 0.02831 | 0.97 | 0.29556 | 6.71 | 0.00185 | 2.84 | 0.00225 | 8.58 | 0.00001 | 5.74 | 0.01571 |
| hsa‐miR‐409‐3p | 0.98 | 0.08592 | −0.61 | 0.28229 | 0.74 | 0.19500 | −1.59 | 0.00602 | −0.24 | 0.66902 | 1.35 | 0.01930 |
| hsa‐miR‐3688‐3p | 0.51 | 0.57958 | 1.91 | 0.06064 | 7.49 | 0.00049 | 1.40 | 0.16211 | 6.98 | 0.00155 | 5.58 | 0.02543 |
| hsa‐miR‐4741 | 1.47 | 0.28966 | −2.17 | 0.21178 | −5.49 | 0.00111 | −3.64 | 0.03514 | −6.96 | 0.00008 | −3.32 | 0.02750 |
| hsa‐miR‐197‐5p | −1.78 | 0.07627 | −0.91 | 0.38254 | −3.09 | 0.00359 | 0.87 | 0.36925 | −1.31 | 0.17164 | −2.18 | 0.03232 |
| hsa‐miR‐4656 | 0.00 | 1.00000 | 0.00 | 1.00000 | −5.38 | 0.01415 | 0.00 | 1.00000 | −5.38 | 0.00918 | −5.38 | 0.03401 |
| hsa‐miR‐539‐5p | 0.88 | 0.23262 | −1.40 | 0.05622 | 0.23 | 0.76622 | −2.28 | 0.00249 | −0.65 | 0.40096 | 1.63 | 0.03479 |
| hsa‐miR‐4669 | −1.18 | 0.23694 | 0.47 | 0.66589 | 5.92 | 0.01592 | 1.65 | 0.12971 | 7.10 | 0.00176 | 5.45 | 0.03707 |
| hsa‐miR‐487b‐3p | 0.81 | 0.20689 | −1.03 | 0.10723 | 0.29 | 0.65768 | −1.84 | 0.00490 | −0.52 | 0.41977 | 1.32 | 0.04349 |
| hsa‐miR‐32‐5p | 1.18 | 0.07970 | 1.40 | 0.04207 | 2.92 | 0.00014 | 0.22 | 0.74798 | 1.73 | 0.02074 | 1.52 | 0.04563 |
| hsa‐miR‐3168 | −1.61 | 0.08382 | −1.52 | 0.11232 | −3.32 | 0.00070 | 0.09 | 0.91904 | −1.71 | 0.05189 | −1.80 | 0.04747 |
| hsa‐miR‐127‐3p | 0.67 | 0.23946 | −0.86 | 0.13218 | 0.27 | 0.63184 | −1.53 | 0.00829 | −0.40 | 0.48431 | 1.13 | 0.04883 |
| hsa‐miR‐3200‐3p | −0.54 | 0.42913 | 0.74 | 0.28573 | 2.30 | 0.00370 | 1.28 | 0.06604 | 2.84 | 0.00036 | 1.56 | 0.05016 |
| hsa‐miR‐1226‐5p | 0.00 | 1.00000 | −2.41 | 0.20171 | −6.16 | 0.00363 | −2.41 | 0.17430 | −6.16 | 0.00200 | −3.75 | 0.05919 |
| hsa‐miR‐431‐5p | 0.88 | 0.15574 | −0.83 | 0.17949 | 0.32 | 0.60413 | −1.72 | 0.00671 | −0.56 | 0.37086 | 1.16 | 0.06627 |
| hsa‐miR‐3176 | 0.39 | 0.64896 | 0.98 | 0.27615 | 3.28 | 0.00720 | 0.59 | 0.50588 | 2.89 | 0.01766 | 2.30 | 0.06791 |
| hsa‐miR‐96‐5p | 0.10 | 0.90504 | 3.08 | 0.00478 | 0.93 | 0.34204 | 2.98 | 0.00600 | 0.82 | 0.39365 | −2.15 | 0.07055 |
| hsa‐miR‐323b‐3p | 1.04 | 0.09867 | −0.96 | 0.12592 | 0.17 | 0.78606 | −2.00 | 0.00186 | −0.87 | 0.16990 | 1.13 | 0.07450 |
| hsa‐miR‐134‐5p | 0.46 | 0.42993 | −1.59 | 0.00792 | −0.54 | 0.36132 | −2.05 | 0.00072 | −1.00 | 0.09112 | 1.05 | 0.07512 |
| hsa‐miR‐6817‐3p | 2.34 | 0.14746 | −0.81 | 0.65359 | −3.91 | 0.02720 | −3.16 | 0.07749 | −6.26 | 0.00112 | −3.10 | 0.07989 |
| hsa‐miR‐3675‐5p | −1.79 | 0.24878 | −5.27 | 0.00953 | 0.00 | 1.00000 | −3.48 | 0.04572 | 1.79 | 0.54421 | 5.27 | 0.08191 |
| hsa‐miR‐101‐5p | −0.26 | 0.71269 | 1.98 | 0.00902 | 3.70 | 0.00011 | 2.24 | 0.00323 | 3.96 | 0.00003 | 1.72 | 0.08236 |
| hsa‐miR‐215‐5p | −0.69 | 0.32213 | 1.32 | 0.07211 | 0.00 | 0.99959 | 2.01 | 0.00655 | 0.69 | 0.34299 | −1.32 | 0.08442 |
| hsa‐miR‐6087 | −0.82 | 0.20554 | 0.94 | 0.15914 | −0.21 | 0.75576 | 1.76 | 0.00870 | 0.62 | 0.34695 | −1.14 | 0.09072 |
| hsa‐miR‐379‐5p | 0.37 | 0.54712 | −1.79 | 0.00436 | −0.78 | 0.20433 | −2.16 | 0.00067 | −1.15 | 0.06316 | 1.01 | 0.10252 |
| hsa‐miR‐186‐3p | −0.27 | 0.70727 | 2.04 | 0.01009 | 0.69 | 0.37896 | 2.31 | 0.00344 | 0.96 | 0.21567 | −1.35 | 0.10372 |
| hsa‐miR‐144‐3p | −0.21 | 0.70470 | 0.53 | 0.33695 | 1.43 | 0.01089 | 0.74 | 0.18196 | 1.64 | 0.00372 | 0.90 | 0.10491 |
| hsa‐miR‐362‐5p | −0.38 | 0.71589 | 1.64 | 0.17067 | 6.14 | 0.01375 | 2.02 | 0.08769 | 6.52 | 0.00701 | 4.50 | 0.11413 |
| hsa‐miR‐382‐5p | 0.20 | 0.73529 | −1.71 | 0.00398 | −0.79 | 0.17501 | −1.91 | 0.00141 | −0.99 | 0.09144 | 0.92 | 0.11452 |
| hsa‐miR‐93‐5p | 0.21 | 0.70737 | 0.74 | 0.17907 | 1.58 | 0.00522 | 0.54 | 0.33068 | 1.37 | 0.01468 | 0.83 | 0.13379 |
| hsa‐miR‐576‐5p | 0.58 | 0.41817 | 1.19 | 0.10990 | 2.42 | 0.00401 | 0.61 | 0.40736 | 1.84 | 0.02733 | 1.23 | 0.14897 |
| hsa‐miR‐654‐5p | 0.05 | 0.93377 | −1.79 | 0.00711 | −0.85 | 0.19904 | −1.85 | 0.00531 | −0.90 | 0.16897 | 0.94 | 0.14940 |
| hsa‐miR‐186‐5p | −0.15 | 0.78205 | 1.58 | 0.00543 | 0.79 | 0.16078 | 1.74 | 0.00239 | 0.94 | 0.09432 | −0.80 | 0.15387 |
| hsa‐miR‐193b‐3p | −0.46 | 0.65282 | 2.39 | 0.05210 | 6.46 | 0.00723 | 2.84 | 0.01896 | 6.91 | 0.00284 | 4.07 | 0.16243 |
| hsa‐miR‐493‐5p | 0.55 | 0.36327 | −1.21 | 0.04985 | −0.40 | 0.51433 | −1.76 | 0.00472 | −0.95 | 0.12077 | 0.81 | 0.18626 |
| hsa‐miR‐183‐5p | −0.13 | 0.82428 | 1.53 | 0.00798 | 0.79 | 0.16261 | 1.66 | 0.00423 | 0.92 | 0.10662 | −0.74 | 0.19450 |
| hsa‐miR‐9‐5p | 0.80 | 0.25104 | −0.69 | 0.32167 | −1.57 | 0.02605 | −1.49 | 0.03314 | −2.37 | 0.00092 | −0.88 | 0.20336 |
| hsa‐miR‐4532 | −0.35 | 0.55131 | 1.75 | 0.00339 | 1.08 | 0.06821 | 2.10 | 0.00052 | 1.42 | 0.01669 | −0.68 | 0.24933 |
| hsa‐miR‐124‐3p | 1.71 | 0.25311 | −0.63 | 0.67105 | −2.34 | 0.11166 | −2.34 | 0.13531 | −4.05 | 0.01000 | −1.71 | 0.24997 |
| hsa‐miR‐20b‐5p | 0.36 | 0.56185 | 1.43 | 0.02227 | 2.16 | 0.00093 | 1.08 | 0.08313 | 1.81 | 0.00518 | 0.73 | 0.25272 |
| hsa‐miR‐144‐5p | 0.64 | 0.29544 | 1.60 | 0.00999 | 2.31 | 0.00035 | 0.97 | 0.11459 | 1.67 | 0.00825 | 0.71 | 0.25844 |
| hsa‐miR‐18b‐5p | 0.09 | 0.91441 | 2.57 | 0.00663 | 1.39 | 0.15476 | 2.49 | 0.00836 | 1.30 | 0.18066 | −1.19 | 0.27704 |
| hsa‐miR‐29c‐3p | −0.32 | 0.59801 | 1.45 | 0.02253 | 0.77 | 0.22160 | 1.77 | 0.00555 | 1.09 | 0.08311 | −0.68 | 0.28407 |
| hsa‐miR‐1908‐3p | −1.32 | 0.16448 | −2.21 | 0.02439 | −3.11 | 0.00195 | −0.88 | 0.31677 | −1.78 | 0.04769 | −0.90 | 0.31923 |
| hsa‐miR‐16‐5p | 0.81 | 0.13559 | 2.23 | 0.00008 | 1.73 | 0.00192 | 1.41 | 0.01047 | 0.92 | 0.09373 | −0.50 | 0.35897 |
| hsa‐miR‐3135b | −1.52 | 0.08229 | −2.56 | 0.00473 | −1.79 | 0.05810 | −1.04 | 0.21765 | −0.27 | 0.76138 | 0.77 | 0.39688 |
| hsa‐miR‐1299 | 2.64 | 0.00043 | 2.40 | 0.00149 | 3.07 | 0.00029 | −0.24 | 0.74745 | 0.43 | 0.61108 | 0.66 | 0.43638 |
| hsa‐miR‐432‐5p | 0.37 | 0.51302 | −1.24 | 0.03080 | −0.83 | 0.14741 | −1.61 | 0.00545 | −1.20 | 0.03706 | 0.41 | 0.46475 |
| hsa‐miR‐4488 | −1.27 | 0.05904 | −2.53 | 0.00028 | −2.05 | 0.00300 | −1.26 | 0.05394 | −0.79 | 0.23068 | 0.48 | 0.46720 |
| hsa‐miR‐550a‐3p | 0.34 | 0.60175 | 1.76 | 0.00992 | 2.23 | 0.00189 | 1.42 | 0.03573 | 1.89 | 0.00792 | 0.47 | 0.51269 |
| hsa‐miR‐106b‐5p | 0.12 | 0.83321 | 1.84 | 0.00226 | 2.20 | 0.00033 | 1.72 | 0.00422 | 2.08 | 0.00066 | 0.37 | 0.53731 |
| hsa‐miR‐15b‐5p | 0.77 | 0.20034 | 1.33 | 0.02926 | 1.69 | 0.00661 | 0.56 | 0.35178 | 0.92 | 0.13351 | 0.35 | 0.56058 |
| hsa‐miR‐194‐5p | 0.46 | 0.48101 | 1.65 | 0.01576 | 2.04 | 0.00437 | 1.18 | 0.07923 | 1.58 | 0.02592 | 0.40 | 0.57754 |
| hsa‐miR‐4466 | −1.86 | 0.03462 | −2.64 | 0.00372 | −3.10 | 0.00092 | −0.78 | 0.33855 | −1.24 | 0.13824 | −0.46 | 0.58416 |
| hsa‐miR‐323a‐3p | 0.73 | 0.24902 | −1.17 | 0.06692 | −0.86 | 0.18003 | −1.90 | 0.00343 | −1.59 | 0.01425 | 0.31 | 0.62297 |
| hsa‐miR‐5189‐3p | −4.27 | 0.00756 | −2.05 | 0.23291 | −2.84 | 0.13676 | 2.22 | 0.12249 | 1.43 | 0.35910 | −0.79 | 0.65950 |
| hsa‐miR‐490‐5p | −0.89 | 0.33800 | −2.97 | 0.00172 | −2.61 | 0.00769 | −2.09 | 0.01553 | −1.72 | 0.05496 | 0.37 | 0.67376 |
| hsa‐miR‐3138 | −0.77 | 0.28981 | −1.74 | 0.01899 | −2.00 | 0.00831 | −0.97 | 0.17370 | −1.23 | 0.09157 | −0.26 | 0.72111 |
| hsa‐miR‐192‐5p | −0.27 | 0.62776 | 1.41 | 0.01426 | 1.27 | 0.02673 | 1.68 | 0.00368 | 1.54 | 0.00750 | −0.14 | 0.80729 |
| hsa‐miR‐185‐5p | −0.35 | 0.53115 | 1.56 | 0.00621 | 1.65 | 0.00391 | 1.91 | 0.00092 | 2.00 | 0.00055 | 0.09 | 0.86978 |
| hsa‐miR‐3200‐5p | 0.18 | 0.79454 | 2.51 | 0.00123 | 2.63 | 0.00161 | 2.33 | 0.00249 | 2.45 | 0.00314 | 0.12 | 0.88698 |
| hsa‐miR‐15a‐5p | 0.65 | 0.24229 | 1.46 | 0.01017 | 1.53 | 0.00692 | 0.80 | 0.14993 | 0.88 | 0.11489 | 0.08 | 0.88829 |
| hsa‐miR‐451a | 0.58 | 0.28405 | 2.56 | 0.00001 | 2.61 | 0.00001 | 1.98 | 0.00043 | 2.03 | 0.00030 | 0.06 | 0.91812 |
| hsa‐miR‐3161 | 2.24 | 0.09828 | 5.79 | 0.00668 | 5.79 | 0.03406 | 3.55 | 0.11453 | 3.55 | 0.25406 | 0.00 | 1.00000 |
| hsa‐miR‐217 | −5.31 | 0.00585 | 0.00 | 1.00000 | 0.00 | 1.00000 | 5.31 | 0.01905 | 5.31 | 0.06827 | 0.00 | 1.00000 |
FIGURE 1.

Expression of miR‐19a/b‐3p by small RNA‐seq. Expression level is reported as TPM counts for miR‐19a‐3p (panel a) and miR‐19b‐3p (panel b). Data are shown as box plots (with median) for each group, that is, 3 young donors (Y), 3 old donors (O), and 6 centenarians (C). Centenarians are also analyzed according to their health status, that is, 3 healthy (HC) and 3 unhealthy centenarians (UHC) as reported on the right. Statistical analysis was assessed applying the glmQLFTest implemented by EdgeR statistical software package in R v3.6.3. In this analysis, both p value thresholds were considered and indicated as follows: **<0.01; *<0.05. Particularly, in panel a for miR‐19a‐3p: Y vs. HC p = 4.79E‐05; O vs. C p = 0.0035; O vs. HC p = 1.16E‐06; HC vs. UHC p = 0.0001. In panel b for miR‐19b‐3p: Y vs. C p = 0.0021; Y vs. HC p = 4.79E‐07; O vs. C p = 6.29E‐05; O vs. HC p = 1.84E‐08; O vs. UHC p = 0.045; HC vs. UHC p = 7.06E‐05
2.3. Validation phase of small RNA‐seq results by RT‐qPCR
MiR‐19a/b‐3p sequencing data were validated by RT‐qPCR in plasma samples obtained from 49 different aged donors, that is, 16 young donors, 16 old donors, 11 healthy centenarians, and 6 unhealthy centenarians, as detailed in methods section.
RT‐qPCR validation results are reported in Figure 2 (panels a and b), showing miR‐19a/b‐3p data in all age groups. In addition, healthy and unhealthy centenarians were compared. Validation analysis confirmed data obtained with small RNA‐seq along with the age groups. MiR‐19a/b‐3p increases in old group and decreases in centenarians. However, the different levels of both miRs in healthy versus unhealthy centenarians were not confirmed by qPCR.
FIGURE 2.

Validation of miR‐19a/b‐3p by RT‐qPCR. RT‐qPCR results of miR‐19a‐3p (panel a) and miR‐19b‐3p (panel b) are shown as box plots (with median) of relative expression for each group, that is, 16 young donors (Y), 16 old donors (O), and 17 centenarians (C). Centenarians are also analyzed according to their health status, that is, 11 healthy (HC) and 6 unhealthy centenarians (UHC) as reported on the right. Statistical analysis was assessed by nonparametric Kruskal–Wallis test, and significant p values are indicated as follows: **<0.01; *<0.05. Particularly, in panel a for miR‐19a‐3p: Y vs. C p = 0.032; O vs. C p = 0.001; Y vs. HC p = 0.029; O vs. HC p = 0.001. In panel b for miR‐19b‐3p: Y vs. C p = 0.009; Y vs. O p < 0.0001; Y vs. HC p = 0.020; O vs. HC p = 0.001; O vs. UHC p = 0.005
Validation data were also analyzed according to sex within the groups when the number of male and females was balanced. In the young group, a significant difference between male and females was found in both miR‐19a/b‐3p, as reported in Figure 3 (panels a and b), being the expression higher in males. Further analysis was performed in all groups considering only females being the number of subjects comparable. The results are shown in Figure 3 (panels c and d), and this stratification highlighted the increase in old compared to young females, showing a greater similarity between young and centenarian females.
FIGURE 3.
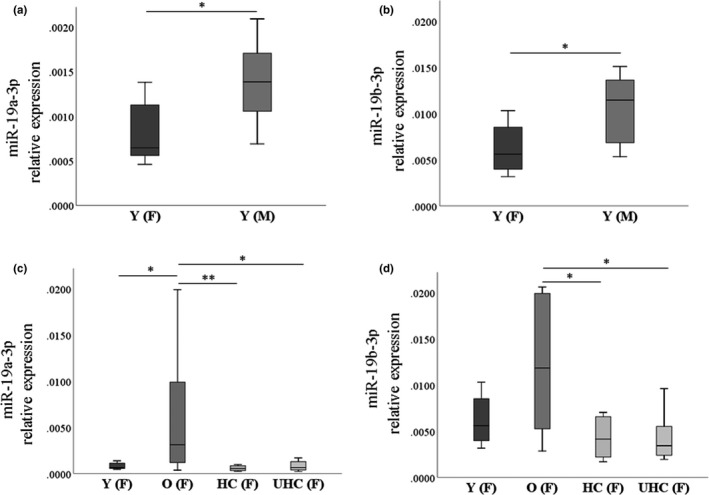
miR‐19a/b‐3p analyzed according to gender in the validation phase cohort. RT‐qPCR data were analyzed in young subjects according to gender, dividing in 8 young female Y (F) and 8 young male Y (M), for miR‐19a‐3p (panel a) and miR‐19b‐3p (panel b). Analysis for female counterpart was applied among 8 young women Y (F), 8 old women O (F), 8 healthy women centenarians HC (F), and 6 unhealthy women centenarians UHC (F). Data are shown as box plots (with median) of relative expression for each group. Statistical analysis was assessed by nonparametric Mann–Whitney and Kruskal–Wallis test. Significant p values are indicated as follows: **<0.01; *<0.05. Particularly, in panel a for miR‐19a‐3p p = 0.015 and in panel b for miR‐19b‐3p p = 0.028. In panel c for miR‐19a‐3p Y vs. O p = 0.050; O vs. HC p = 0.002; O vs. UHC p = 0.032. In panel d for miR‐19b‐3p: O vs. HC p = 0.015; O vs. UHC p = 0.020
RT‐qPCR miR‐19a/b‐3p levels were correlated with hematobiochemical parameters in all centenarians, and the matrix correlation is reported in Figure S3. Seven significant correlations were found as follows: miR‐19a‐3p negatively correlates with creatinine (p = 0.02), while miR‐19b‐3p negatively correlates with RDW‐CV (p = 0.053), with eosinophils (p = 0.032), with creatinine (p = 0.046) and miR‐19b‐3p positively correlates with WBC (p = 0.044), with neutrophils (p = 0.02), and with GPT (p = 0.031). Comparing healthy and unhealthy centenarians, only a few hematobiochemical parameters resulted significant (mean corpuscolar hemoglobin concentration, albumin, and total protein p < 0.05) as shown in Table S4.
2.4. IsomiRs contribution in aging and longevity
The contribution of isomiRs, that is, the variations of the base sequence annotated in miRBase, in the sequencing results were evaluated. Sequencing data show that the most abundant isoform of miR‐19a/b‐3p in plasma is a truncated form at 3′ (iso_3p) lacking the last two nucleotides (Figure S4). Both the annotated base sequences in miRBase and the most abundant sequences of miR‐19a‐3p and miR‐19b‐3p, reported as TPM mean value for each group, are shown in Figure 4. The most abundant sequence of both miRs is significantly decreased in centenarians compared with old donors (panels a and b). Centenarians’ group was further analyzed according to health status; results show an increase of the miRBase sequence in unhealthy compared to healthy centenarians (panels c and d), but only isomiR‐19a‐3p differs significantly.
FIGURE 4.

IsomiRs of miR‐19a‐3p and miR‐19b‐3p in aging and longevity. The base and the most abundant sequences of miR‐19a‐3p (panels a and c) and of miR‐19b‐3p (panels b and d), obtained by small RNA‐seq, are shown as TPM mean value for each group. Panels a and b show data from 3 young donors (Y), 3 old donors (O), and 6 centenarians (C). Panels c and d show centenarians according to their health status, that is, 3 healthy (HC) and 3 unhealthy centenarians (UHC). Statistical analysis was assessed by wilcox.test function implemented in R; p < 0.05 (*)
2.5. Pathway analysis
Target gene network analysis of the differentially expressed miRs was determined via miRTargetLink (https://ccb‐web.cs.uni‐saarland.de/mirtargetlink/), and shared molecular targets between miR‐19a‐3p and miR‐19b‐3p with experimentally validated publications were raised up. In particular, the thirteen most significant common targets of both miRs have been found, as reported in Figure 5.
FIGURE 5.

Target network analysis of miR‐19a/b‐3p. Common validated targets of miR‐19a‐3p and miR‐19b‐3p obtained with experimental strong evidence. Target network interactions have been determined via miRTargetLink
KEGG analysis via mirPath (http://snf‐515788.vm.okeanos.grnet.gr/) was performed considering all validated targets of miR‐19a‐3p and miR‐19b‐3p. Using pathway intersection testing, 28 pathways turned out to be significantly regulated. The most significant pathway (p < 10−325) is related to proteoglycans in cancer, while at 5th position the FoxO signaling pathway was found (p = 3.19 × 10−07). This pathway contains the highest number of shared targets, that is, SMAD4, PTEN, and BCL2L11, among those identified by miRTargetLink analysis. Table S5 shows the list of all the 28 pathways with the related level of significance.
3. DISCUSSION
The work has been performed on plasma c‐miRs by means of deep sequencing technique using a discovery design based on a cross‐sectional study with differently aged individuals. A cohort of 3 donors for each group, that is, young, old, healthy centenarians, and unhealthy centenarians, was investigated. A subsequent validation phase was conducted by RT‐qPCR in plasma samples obtained from 16 young donors, 16 old donors, 11 healthy centenarians, and 6 unhealthy centenarians. This up‐graded model, which takes into account two extreme and very rare phenotypes of centenarians, was recently proposed by our team (Teo et al., 2019). In this respect, healthy centenarians have both optimal cognitive (SMMSE 24–30) and physical status (ADL = 5), while unhealthy are at the opposite condition (bedridden and not able to reply to the interview). Surprisingly, hematobiochemical parameters did not greatly differ between the two groups. In particular, mean corpuscolar hemoglobin concentration, albumin, and total protein resulted decreased in unhealthy compared to healthy centenarians, probably due to anemia and organ disfunction more pronounced in unhealthy status.
Sequencing data analysis was performed comparing young, old, healthy, and unhealthy centenarians, and 79 c‐miRs were found differentially expressed. Among these, there are several miRs with a known role in aging/ARD‐GS. An example is miR‐31, found increased in plasma microvesicles of elderly and patients with osteoporosis, possibly involved in the pathogenesis of age‐related and impaired bone formation (Weilner et al., 2016) and identified as markers of aging in human liver (Capri et al., 2017). In particular, the comparison between healthy and unhealthy centenarians revealed 11 significantly changed miRs, and 8 out of 11 resulted increased in unhealthy centenarians, thus suggesting a general trend of increased miRs upon unhealthy conditions.
Notably, the most significantly different miRs are miR‐19a‐3p and miR‐19b‐3p. These miRs belong to the miR‐17/92 cluster that maps to human chromosome 13 and encodes for six individual miRs, (i.e., miR‐17, miR‐18a, miR‐19a, miR‐20a, miR‐19b‐1, and miR‐92a) (Mendell, 2008). The organization and sequences are highly conserved among vertebrates, and the human genome contains two paralogues, the miR‐106b/25 and the miR‐106a/363 cluster. In addition to miR‐19a/b‐3p, sequencing analysis revealed miR‐106a/b‐5p, miR‐18b‐5p, and miR‐20b‐5p, belonging to these paralogues, significantly modified with age. In particular, miR‐19a‐3p and miR‐19b‐3p share the same seed region (Concepcion et al., 2012) and are involved in many processes such as cell cycle, proliferation, and apoptosis, having as main targets PTEN and BCL2L11 (Mogilyansky & Rigoutsos, 2013). Interestingly, PTEN is also a target of miR‐21, an inflamma‐miR found decreased in centenarians when compared with old group (Olivieri et al., 2012) as miR‐19a/b‐3p.
Currently, limited data are available on the age‐related changes of c‐miRs and/or at human extreme ages (Dluzen et al., 2017; Olivieri et al., 2017). Unifying conclusions are difficult due to the presence of several variables, such as biological sample, method, and normalization procedure. Some studies have already explored various components of peripheral blood for different analyses, such as the genome‐wide miR screening performed in whole blood of centenarians and nonagenarians versus younger individuals (ElSharawy et al., 2012); the miR‐profile obtained from B cells of individuals aged 50–90 and centenarians (Gombar et al., 2012); and the analysis of miR‐expressions achieved in mononuclear cells from centenarians, octogenarians, and young individuals (Serna et al., 2012). As far as plasma is concerned, only two studies explore c‐miRs. A recent paper showed a significant decrease of three miRs, that is, miR‐425‐5p, miR‐21, and miR‐212 in centenarians compared with controls aged from 30 to 50 years (Balzano et al., 2017). However, authors did not explore miRs level with a profiling technique, but a priori selection applying RT‐qPCR was performed. Olivieri et al. (2012) investigated miR‐profiling in individuals aged from 20 to 100 years and among the significantly increased miRs in octogenarians compared to centenarians, two resulted in common with our data, that is, miR‐19b‐3p and miR‐186‐5p. In this perspective, the current data extend the significant increase of miR‐19b‐3p and miR‐186‐5p also in the 70‐year‐old group compared to centenarians.
As far as miR‐19a‐3p is concerned, we previously showed an up‐regulation in the adipose tissue obtained by postmenopausal in comparison with premenopausal younger women (Kangas et al., 2017). We did not find changes of miR‐19a‐3p in the plasma, but the current results suggest an age‐related increase in the plasma detectable at older ages than previously investigated.
Serum miR‐19a/b‐3p were described to be significant discriminators of patients with idiopathic and postmenopausal osteoporotic low‐traumatic fractures (Kocijan et al., 2016), and miR‐19b‐3p was confirmed significantly up‐regulated in older women with osteoporotic vertebral fractures (Zarecki et al., 2020), showing their potential to be marker of age‐related conditions.
MiR‐19b‐3p was previously described as a pivotal player in human aging. MiR profiling of four different cell types in replicative senescence and three different types of ex vivo tissue was achieved (Hackl et al., 2010). Thereby, a common down‐regulation of miR‐17, miR‐19b, miR‐20a, and miR‐106a was found. The decrease in these miRs correlated with the increased transcript levels of cdk inhibitor p21/CDKN1A. In a recent study, the changes of circulating miRs after resistance exercise were investigated (Margolis et al., 2017). The analysis performed at the baseline of the study showed that serum miR expression profiles were significantly predictive of chronological aging through a stepwise discriminant analysis, based on miR‐19b‐3p, miR‐206, and miR‐486 able to correctly classify the participants by age. Serna et al. found downregulated miR‐19b‐3p in blood peripheral mononuclear cells from octogenarians in respect to both young donors and centenarians (Serna et al., 2012). It is reasonable that the level of intracellular expression of these miRs may be different from the level found in circulation, and it would be interesting to evaluate the expression of miRs and their targets in the various blood cells and cell tissue, even if quite complex in humans, aiming at deepening the contribution of expression and function of those miRs.
The impact of the age‐related changes of miR‐19a/b‐3p may be explored in their molecular targets. Figure 5 shows the most significant common targets of miR‐19a‐3p and miR‐19b‐3p, backed up by powerful experimental methods as resulted from the miRTargetLink analysis. All of them are involved in crucial processes, such as PTEN described as promoter of longevity (Ortega‐Molina & Serrano, 2013). SMAD4 is a mediator of TGF‐β signal transduction, a pathway important in senescence and aging (Tominaga & Suzuki, 2019). BCL2L11 belongs to the BCL‐2 protein family with apoptotic regulator function (Tower, 2015). SOCS1, known as suppressor of cytokine signaling, acts via the JAK/STAT pathway inhibiting JAK directly, and senescence‐associated secretory phenotype (SASP) can be suppressed by inhibiting the JAK pathway in senescent cells (Xu et al., 2015). Noteworthy, both miR‐19a/b‐3p and their targets, that is, SMAD4, PTEN, and BCL2L11, converge on FoxO signaling pathway and are also relevant for IGF‐mTOR (Hay, 2011), thus two well‐known pathways associated with aging and longevity.
MiR‐19a/b‐3p resulted differentially expressed when young donors were stratified according to sex, being increased in young male compared to female subjects. Analyzing all groups and considering only women, differences emerged highlighting the increase of miR‐19a‐3p in old compared to young subjects, suggesting a specific, inhibitory, and likely estrogen‐dependent effect in old women. In fact, miR‐19a/b‐3p are also common regulator of ESR1 and are in turn controlled by estrogen levels in a regulatory circuit with a negative feedback and is thus proposed to be sexually dimorphic miRs (Dai & Ahmed, 2014). MiR‐19b‐3p has a precursor in the miR‐106a/363 cluster located on the X chromosome, even if this cluster is normally expressed at lower levels (Mogilyansky & Rigoutsos, 2013) and highlights possible gender differences in human aging (Kangas et al., 2017; Matarrese et al., 2019). Thus, the unexpected decrease of miR‐19a/b‐3p at extreme ages could also be considered a biomarker associated with female longevity.
The validation phase, performed by RT‐qPCR, did not confirm the differences of miR‐19a/b‐3p between the healthy and unhealthy centenarians obtained by sequencing data. MiR‐19a/b‐3p resulted correlated with WBC, RDW‐CV, neutrophils, eosinophils, creatinine, and GPT in all centenarians, suggesting their possible involvement in the regulation of health status parameters and immune system.
To better disentangle the unexpected results obtained by RT‐qPCR, we investigated the presence of isomiRs‐19a/b‐3p in sequencing data. IsomiRs are not rare and were estimated to contribute to half of the miRs profile in human cells (Zhao, 2020). They are classified into 5′, 3′, or polymorphic (internal) isomiRs, depending on the site of variation, and can be derived from alternative Drosha or Dicer processing, RNA editing, or non‐templated nucleotide addition (Gebert & MacRae, 2019). IsomiRs also showed gender or race specific expression patterns (Guo et al., 2016), and some specific isoforms have been found useful in distinguishing different types of cancer representing potential biomarkers (Telonis et al., 2017; Zhao, 2020). However, up to date, the function and biological significance of the majority of these isomiRs remain unclear.
Our first evidence is that the two selected miRs, ‐19a/b‐3p and ‐19b‐3p, reveal a variety of isoforms, up to 38 and 76, respectively, and the most abundant sequence does not correspond to the current miRBase reference sequence, as already described from the first annotation of isomiRs (Morin et al., 2008). PCR based assays, microarrays, and northern blots do not normally discriminate among highly similar sequences, and they are constructed on the base sequence annotated on miRBase. As isomiRs are at least as prevalent as their canonical sequences or even more abundant, this suggest that miR detection studies published using these assays may have based their conclusions on partial data (Karlsen et al., 2019). Furthermore, this could be the reason why we were unable to validate small RNA‐seq results by RT‐qPCR comparing healthy and unhealthy centenarians. In fact, comparing healthy and unhealthy centenarians, results suggest the increase of the base sequence of miR‐19a‐3p in unhealthy condition and similarly, a trend is observed for miR‐19b‐3p. Moreover, the most abundant sequences of both miRs were significantly decreased in centenarians compared to old donors. These crucial findings open new questions and pave the way for a new perspective on the role and function of the different isomiRs‐19a/b‐3p on health conditions and aging. IsomiRs have not yet a recognized biological function, but early data from literature suggest an impact on gene expression regulation and a cytokine‐mediated increase of isomiR patterns (Haseeb et al., 2017). In this respect, specific 3’ isomiRs having a shorter length, as well as those identified here, were found not able to control molecular pathways as the base sequence does (Yu et al., 2017) and their expression was modulated by Interferon type I (Nejad et al., 2018). These findings may be considered as a general effect of 3′ short length isomiRs with a powerful potential for gene expression regulation, but further studies are needed to confirm this hypothesis.
One limitation of the current study is the lack of information on miRs‐19a/b‐3p expression level during the whole life of centenarians. The model used in this study was a cross‐sectional, being not feasible a longitudinal study until extreme human ages.
Overall, miR‐19a/b‐3p were found decreased at blood/systemic level in centenarians compared with old subjects, and a different pattern of isomiRs‐19a‐3p was associated with aging process and with health status at extreme age. In this perspective, the functional role of isomiRs on aging mechanisms deserves additional studies with the aim of identifying new levels of regulation, such as those abrogating miR inhibitory effects, as valuable key factors for aging and age‐related diseases onset.
4. EXPERIMENTAL PROCEDURES
4.1. Experimental design and study participants
Twelve donors were included in the discovery phase for the small RNA sequencing, divided in 4 groups of study as follows: 3 young donors with 25 year‐old ±0.5 (SD) (Y), 3 old donors with 71 year old ±1.6 (O), 3 healthy centenarians (HC), and 3 unhealthy centenarians (UHC) being 101.8 year old ±1.1. In all groups, the F:M ratio was 2:1, except for unhealthy centenarians that consisted of all females. All subjects included in the study were recruited in Bologna, the Ethical Committee of Sant’ Orsola‐Malpighi Hospital (Bologna, Italy) approved the protocol (EM/26/2014/U with reference to 22/2007/U/Tess). A detailed questionnaire describing their lifestyle, physical, and cognitive status was administrated to centenarians. The healthy centenarians were defined by good cognitive performance, that is, MMSE (Mini‐Mental State Examination), ability to walk and a high ADL (Activities of Daily Living) score. The unhealthy centenarians were demented without the possibility to perform the MMSE and bedridden. Young and old subjects are representative of the general population and realistic aging. Hematobiochemical parameters are reported in Table S3. These twelve subjects were previously investigated in terms of circulating cell‐free DNA by our team and described in details for health conditions and drugs therapies (Teo et al., 2019).
Validation phase was conducted on 49 volunteers, including those previously selected for discovery phase, divided as follows (average age ± standard deviation): (i) 16 young donors, 8 females and 8 males (30.1 ± 3.4); (ii) 16 old donors, 8 females and 8 males (70.8 ± 1.9); (iii) 17 centenarians, that is, 11 healthy centenarians, 8 females and 3 males, and 6 unhealthy centenarians, only females (101.4 ± 1.3).
Hematobiochemical parameters were collected from all subjects recruited for the validation phase (Table S3). Differences between healthy and unhealthy centenarians were considered (Table S4). Nonparametric Kruskal–Wallis and Mann–Whitney tests were applied using IBM SPSS Statistics, version 26 (IBM Corp., Armonk, NY, USA).
4.2. Sample processing for sequencing
Total RNA was isolated from 2 ml of plasma samples with the miRNeasy Mini kit (Qiagen), and the protocol was adapted for the extraction from plasma. As circulating RNA is present in very low amount, RNA quantification was not possible; therefore, exogenous controls, that is, UniSp2, UniSp4, and UniSp5 (RNA Spike‐In, Qiagen), were introduced at the beginning of RNA extraction and their recovery was used as indicator of RNA isolation quality.
4.3. cDNA library preparation
For cDNA library preparation, CleanTag Ligation Kit (TriLink BioTechnologies) was used. Each sample was associated with a different Index Primer (Primers #1‐12) from the Set 1 for Illumina technology (TriLink BioTechnologies) to run for the sequencing all 12 samples in one lane. A purification step after PCR reaction was performed using QIAquick PCR Purification Kit (Qiagen) to remove primers, nucleotides, enzymes, mineral oil, salts, and other impurities from DNA samples. cDNA libraries were quantified by Agilent DNA 1000 Kit using Agilent 2100 Bioanalyzer (Agilent). A gel purification step is required to run amplified cDNA library and select only miRs library according to the size, cutting the corresponding miR band (~130–140 bp). cDNA library was quantified again after the purification by Agilent DNA 1000 chip.
4.4. Sequencing data analysis
The sequencing was completed by Exiqon A/S Company on the NextSeq500 Illumina platform, using single‐end read and 50 nt as number of sequencing cycles.
Data preparation and analysis was based on Cap‐miRSeq pipeline (Sun et al., 2014) following these steps: (i) FASTQC and Cutadapt were applied to verify the quality of the data before and after the adapters’ trimming. The samples showed overall good data quality with the vast majority of the data obtained, presenting higher Q‐score than Q30, when a score of 30 equals an accuracy of 99.9% for the base‐calling (Cock et al., 2010); (ii) miRDeep2 was used to identify miR expression profiling where the sequencing reads were mapped to the reference human genome in miRBase v.21; (iii) normalization process was performed by Tags Per Million (TPM) method according to the total tag count in each sample. Data were filtered for count threshold, ≥20 TPM to achieve a robust validation using a different technique as RT‐qPCR; (iv) differential expression analysis was implemented by EdgeR statistical software package in R v3.6.3, applying the glmQLFTest and data were considered significant with a p value <0.01.
4.5. Validation and statistics
Total RNA was isolated from 100 μl of plasma using the Total RNA purification kit (Norgen Biotek Corporation). The protocol was modified adding 20 fmol of cel‐miR‐39 (Qiagen) at the lysis step as spike‐in control to monitor RNA isolation. RT‐qPCR was performed through TaqMan technologies (Thermo Fisher Scientific) following the manufacturer's protocol.
Data were normalized to cel‐mir‐39 measured in each sample, and relative expression was calculated with the delta Ct method. Nonparametric tests were used to perform statistic evaluation, using SPSS software, and p value < 0.05 was considered statistically significant.
Validation data were correlated with hematobiochemical parameters in centenarians by Spearman's correlation test performed with GraphPad Prism software v.9, and p value ≤0.05 was considered significant.
4.6. Pathway analysis
Identification of common target genes was determined via miRTargetLink, a tool for automating analysis on human miR‐mRNA interactions in the form of interaction networks (Hamberg et al., 2016). Targets with strong experimental evidence, like reporter gene assay, were selected and filtered only those in common between the two selected miRs. The identification of the pathways was determined via Kyoto encyclopedia of genes and genomes (KEGG) with p values < 0.05, using the mirPath software on DIANA tools (Vlachos et al., 2015).
4.7. IsomiRs analysis
On the selected miRs, isoform sequences and their abundances were investigated with IsomiR‐SEA v.1.6 (Urgese et al., 2016). This tool performs reads alignment based on miRs databases by considering the miRNA:mRNA interaction pairing aspects. Statistical analysis was performed using the wilcox.test function implemented in R (using default parameters and setting continuity correction to false) and considering a p value < 0.05.
CONFLICT OF INTEREST
M.H. and J.G. are co‐founders of TAmiRNA GmbH. J.G. is co‐founder of Evercyte GmbH.
AUTHOR CONTRIBUTIONS
C.M., L.TZ., and S. Sk. performed the experiments; C.M. and MG.B. completed the bioinformatical analysis; C.M., S.C., M.C., and F.S. elaborated data and drafted the manuscript; M.H., J.G., C.F., and M.C conceived and designed the study; L.TZ., P.G., S. Sa., M.H., J.G., C.F., and M.C. critically revised the manuscript.
Supporting information
Fig S1
Fig S2
Fig S3
Fig S4
Supplementary Material
ACKNOWLEDGMENTS
This work was supported by FARB2‐2014—Alma Mater Studiorum, University of Bologna—to M.C; by the European Union’s H2020 Project to C.F. and P.G. (grant number 634821, PROPAG‐AGEING); by JPco‐fuND to C.F. (ADAGE). We would like to acknowledge Marco Marani for his help in bioinformatical analyses and Giustina Palmas for her contribution in enrolling the study participants.
Morsiani, C. , Terlecki‐Zaniewicz, L. , Skalicky, S. , Bacalini, M. G. , Collura, S. , Conte, M. , Sevini, F. , Garagnani, P. , Salvioli, S. , Hackl, M. , Grillari, J. , Franceschi, C. , & Capri, M. (2021). Circulating miR‐19a‐3p and miR‐19b‐3p characterize the human aging process and their isomiRs associate with healthy status at extreme ages. Aging Cell, 20, e13409. 10.1111/acel.13409
Matthias Hackl, Johannes Grillari, Claudio Franceschi, and Miriam Capri shares co‐senior authorship.
DATA AVAILABILITY STATEMENT
The data that support the findings of this study are available from the corresponding author upon request.
REFERENCES
- Balzano, F. , Deiana, M. , Dei Giudici, S. , Oggiano, A. , Pasella, S. , Pinna, S. , Mannu, A. , Deiana, N. , Porcu, B. , Masala, A. G. E. , Pileri, P. V. , Scognamillo, F. , Pala, C. , Zinellu, A. , Carru, C. , & Deiana, L. (2017). MicroRNA expression analysis of centenarians and rheumatoid arthritis patients reveals a common expression pattern. International Journal of Medical Sciences, 14, 622–628. 10.7150/ijms.18972 [DOI] [PMC free article] [PubMed] [Google Scholar]
- Capri, M. , Olivieri, F. , Lanzarini, C. , Remondini, D. , Borelli, V. , Lazzarini, R. , Graciotti, L. , Albertini, M. C. , Bellavista, E. , Santoro, A. , Biondi, F. , Tagliafico, E. , Tenedini, E. , Morsiani, C. , Pizza, G. , Vasuri, F. , D’Errico, A. , Dazzi, A. , Pellegrini, S. , … Grazi, G. L. (2017). Identification of miR‐31‐5p, miR‐141‐3p, miR‐200c‐3p, and GLT1 as human liver aging markers sensitive to donor–recipient age‐mismatch in transplants. Aging Cell, 16, 262–272. 10.1111/acel.12549 [DOI] [PMC free article] [PubMed] [Google Scholar]
- Cock, P. J. A. , Fields, C. J. , Goto, N. , Heuer, M. L. , & Rice, P. M. (2010). The Sanger FASTQ file format for sequences with quality scores, and the Solexa/Illumina FASTQ variants. Nucleic Acids Research, 38, 1767–1771. 10.1093/nar/gkp1137 [DOI] [PMC free article] [PubMed] [Google Scholar]
- Collura, S. , Morsiani, C. , Vacirca, A. , Fronterrè, S. , Ciavarella, C. , Vasuri, F. , D’Errico, A. , Franceschi, C. , Pasquinelli, G. , Gargiulo, M. , & Capri, M. (2020). The carotid plaque as paradigmatic case of site‐specific acceleration of aging process: The microRNAs and the inflammaging contribution. Ageing Research Reviews, 61, 101090. 10.1016/j.arr.2020.101090 [DOI] [PubMed] [Google Scholar]
- Concepcion, C. P. , Bonetti, C. , & Ventura, A. (2012). The miR‐17‐92 family of microRNA clusters in development and disease. Cancer Journal (Sudbury, Mass.), 18, 262–267. 10.1097/PPO.0b013e318258b60a [DOI] [PMC free article] [PubMed] [Google Scholar]
- Dai, R. , & Ahmed, S. A. (2014). Sexual dimorphism of miRNA expression: A new perspective in understanding the sex bias of autoimmune diseases. Therapeutics and Clinical Risk Management, 10, 151–163. 10.2147/TCRM.S33517 [DOI] [PMC free article] [PubMed] [Google Scholar]
- Dluzen, D. F. , Noren Hooten, N. , & Evans, M. K. (2017). Extracellular RNA in aging. Wiley Interdisciplinary Reviews: RNA, 8(2), e1385. 10.1002/wrna.1385 [DOI] [PMC free article] [PubMed] [Google Scholar]
- ElSharawy, A. , Keller, A. , Flachsbart, F. , Wendschlag, A. , Jacobs, G. , Kefer, N. , Brefort, T. , Leidinger, P. , Backes, C. , Meese, E. , Schreiber, S. , Rosenstiel, P. , Franke, A. , & Nebel, A. (2012). Genome‐wide miRNA signatures of human longevity. Aging Cell, 11, 607–616. 10.1111/j.1474-9726.2012.00824.x [DOI] [PubMed] [Google Scholar]
- Fehlmann, T. , Lehallier, B. , Schaum, N. , Hahn, O. , Kahraman, M. , Li, Y. , Grammes, N. , Geffers, L. , Backes, C. , Balling, R. , Kern, F. , Krüger, R. , Lammert, F. , Ludwig, N. , Meder, B. , Fromm, B. , Maetzler, W. , Berg, D. , Brockmann, K. , … Keller, A. (2020). Common diseases alter the physiological age‐related blood microRNA profile. Nature Communications, 11, 5958. 10.1038/s41467-020-19665-1 [DOI] [PMC free article] [PubMed] [Google Scholar]
- Franceschi, C. , Garagnani, P. , Morsiani, C. , Conte, M. , Santoro, A. , Grignolio, A. , Monti, D. , Capri, M. , & Salvioli, S. (2018). The continuum of aging and age‐related diseases: Common mechanisms but different rates. Frontiers in Medicine, 5, 61. 10.3389/fmed.2018.00061 [DOI] [PMC free article] [PubMed] [Google Scholar]
- Franceschi, C. , Garagnani, P. , Vitale, G. , Capri, M. , & Salvioli, S. (2017). Inflammaging and “Garb‐aging”. Trends in Endocrinology & Metabolism, 28, 199–212. 10.1016/j.tem.2016.09.005 [DOI] [PubMed] [Google Scholar]
- Gebert, L. F. R. , & MacRae, I. J. (2019). Regulation of microRNA function in animals. Nature Reviews Molecular Cell Biology, 20, 21–37. 10.1038/s41580-018-0045-7 [DOI] [PMC free article] [PubMed] [Google Scholar]
- Giuliani, C. , Pirazzini, C. , Delledonne, M. , Xumerle, L. , Descombes, P. , Marquis, J. , Mengozzi, G. , Monti, D. , Bellizzi, D. , Passarino, G. , Luiselli, D. , Franceschi, C. , & Garagnani, P. (2017). Centenarians as extreme phenotypes: An ecological perspective to get insight into the relationship between the genetics of longevity and age‐associated diseases. Mechanisms of Ageing and Development, 165, 195–201. 10.1016/j.mad.2017.02.007 [DOI] [PubMed] [Google Scholar]
- Gombar, S. , Jung, H. J. , Dong, F. , Calder, B. , Atzmon, G. , Barzilai, N. , Tian, X.‐L. , Pothof, J. , Hoeijmakers, J. H. , Campisi, J. , Vijg, J. , & Suh, Y. (2012). Comprehensive microRNA profiling in B‐cells of human centenarians by massively parallel sequencing. BMC Genomics, 13, 353. 10.1186/1471-2164-13-353 [DOI] [PMC free article] [PubMed] [Google Scholar]
- Guo, L. , Liang, T. , Yu, J. , & Zou, Q. (2016). A comprehensive analysis of miRNA/isomiR expression with gender difference. PLoS One, 11(5), e0154955. 10.1371/journal.pone.0154955 [DOI] [PMC free article] [PubMed] [Google Scholar]
- Hackl, M. , Brunner, S. , Fortschegger, K. , Schreiner, C. , Micutkova, L. , Mück, C. , Laschober, G. T. , Lepperdinger, G. , Sampson, N. , Berger, P. , Herndler‐Brandstetter, D. , Wieser, M. , Kühnel, H. , Strasser, A. , Rinnerthaler, M. , Breitenbach, M. , Mildner, M. , Eckhart, L. , Tschachler, E. , … Grillari, J. (2010). miR‐17, miR‐19b, miR‐20a, and miR‐106a are down‐regulated in human aging. Aging Cell, 9, 291–296. 10.1111/j.1474-9726.2010.00549.x [DOI] [PMC free article] [PubMed] [Google Scholar]
- Hackl, M. , Suh, Y. , & Grillari, J. (2017). Editorial: Non‐coding RNA in aging and age‐associated diseases – From intracellular regulators to hormone like actions. Mechanisms of Ageing and Development, 168, 1–2. 10.1016/j.mad.2017.11.014 [DOI] [PubMed] [Google Scholar]
- Hamberg, M. , Backes, C. , Fehlmann, T. , Hart, M. , Meder, B. , Meese, E. , & Keller, A. (2016). miRTargetLink—miRNAs, genes and interaction networks. International Journal of Molecular Sciences, 17, 564. 10.3390/ijms17040564 [DOI] [PMC free article] [PubMed] [Google Scholar]
- Haseeb, A. , Makki, M. S. , Khan, N. M. , Ahmad, I. , & Haqqi, T. M. (2017). Deep sequencing and analyses of miRNAs, isomiRs and miRNA induced silencing complex (miRISC)‐associated miRNome in primary human chondrocytes. Scientific Reports, 7, 15178. 10.1038/s41598-017-15388-4 [DOI] [PMC free article] [PubMed] [Google Scholar]
- Hay, N. (2011). Interplay between FOXO, TOR, and Akt. Biochimica Et Biophysica Acta (BBA) – Molecular Cell Research, 1813(11), 1965–1970. 10.1016/j.bbamcr.2011.03.013 [DOI] [PMC free article] [PubMed] [Google Scholar]
- Heilmeier, U. , Hackl, M. , Skalicky, S. , Weilner, S. , Schroeder, F. , Vierlinger, K. , Patsch, J. M. , Baum, T. , Oberbauer, E. , Lobach, I. , Burghardt, A. J. , Schwartz, A. V. , Grillari, J. , & Link, T. M. (2016). Serum miRNA signatures are indicative of skeletal fractures in postmenopausal women with and without type 2 diabetes and influence osteogenic and adipogenic differentiation of adipose tissue‐derived mesenchymal stem cells in vitro. Journal of Bone and Mineral Research, 31(12), 2173–2192. 10.1002/jbmr.2897 [DOI] [PubMed] [Google Scholar]
- Jung, H. J. , & Suh, Y. (2014). Circulating miRNAs in ageing and ageing‐related diseases. Journal of Genetics and Genomics, 41, 465–472. 10.1016/j.jgg.2014.07.003 [DOI] [PMC free article] [PubMed] [Google Scholar]
- Kangas, R. , Morsiani, C. , Pizza, G. , Lanzarini, C. , Aukee, P. , Kaprio, J. , Sipilä, S. , Franceschi, C. , Kovanen, V. , Laakkonen, E. K. , & Capri, M. (2017). Menopause and adipose tissue: miR‐19a‐3p is sensitive to hormonal replacement. Oncotarget, 9, 2279–2294. 10.18632/oncotarget.23406 [DOI] [PMC free article] [PubMed] [Google Scholar]
- Karlsen, T. A. , Aae, T. F. , & Brinchmann, J. E. (2019). Robust profiling of microRNAs and isomiRs in human plasma exosomes across 46 individuals. Scientific Reports, 9, 19999. 10.1038/s41598-019-56593-7 [DOI] [PMC free article] [PubMed] [Google Scholar]
- Kennedy, B. K. , Berger, S. L. , Brunet, A. , Campisi, J. , Cuervo, A. M. , Epel, E. S. , Franceschi, C. , Lithgow, G. J. , Morimoto, R. I. , Pessin, J. E. , Rando, T. A. , Richardson, A. , Schadt, E. E. , Wyss‐Coray, T. , & Sierra, F. (2014). Geroscience: Linking aging to chronic disease. Cell, 159, 709–713. 10.1016/j.cell.2014.10.039 [DOI] [PMC free article] [PubMed] [Google Scholar]
- Kocijan, R. , Muschitz, C. , Geiger, E. , Skalicky, S. , Baierl, A. , Dormann, R. , Plachel, F. , Feichtinger, X. , Heimel, P. , Fahrleitner‐Pammer, A. , Grillari, J. , Redl, H. , Resch, H. , & Hackl, M. (2016). Circulating microRNA signatures in patients with idiopathic and postmenopausal osteoporosis and fragility fractures. Journal of Clinical Endocrinology and Metabolism, 101, 4125–4134. 10.1210/jc.2016-2365 [DOI] [PubMed] [Google Scholar]
- Margolis, L. M. , Lessard, S. J. , Ezzyat, Y. , Fielding, R. A. , & Rivas, D. A. (2017). Circulating MicroRNA Are predictive of aging and acute adaptive response to resistance exercise in men. The Journals of Gerontology Series A, 72, 1319–1326. 10.1093/gerona/glw243 [DOI] [PMC free article] [PubMed] [Google Scholar]
- Matarrese, P. , Tieri, P. , Anticoli, S. , Ascione, B. , Conte, M. , Franceschi, C. , Malorni, W. , Salvioli, S. , & Ruggieri, A. (2019). X‐chromosome‐linked miR548am‐5p is a key regulator of sex disparity in the susceptibility to mitochondria‐mediated apoptosis. Cell Death & Disease, 10, 673. 10.1038/s41419-019-1888-3 [DOI] [PMC free article] [PubMed] [Google Scholar]
- Mendell, J. T. (2008). miRiad roles for the miR‐17‐92 cluster in development and disease. Cell, 133, 217–222. 10.1016/j.cell.2008.04.001 [DOI] [PMC free article] [PubMed] [Google Scholar]
- Mogilyansky, E. , & Rigoutsos, I. (2013). The miR‐17/92 cluster: A comprehensive update on its genomics, genetics, functions and increasingly important and numerous roles in health and disease. Cell Death and Differentiation, 20, 1603–1614. 10.1038/cdd.2013.125 [DOI] [PMC free article] [PubMed] [Google Scholar]
- Morin, R. D. , O’Connor, M. D. , Griffith, M. , Kuchenbauer, F. , Delaney, A. , Prabhu, A.‐L. , Zhao, Y. , McDonald, H. , Zeng, T. , Hirst, M. , Eaves, C. J. , & Marra, M. A. (2008). Application of massively parallel sequencing to microRNA profiling and discovery in human embryonic stem cells. Genome Research, 18, 610–621. 10.1101/gr.7179508 [DOI] [PMC free article] [PubMed] [Google Scholar]
- Morsiani, C. , Bacalini, M. G. , Santoro, A. , Garagnani, P. , Collura, S. , D’Errico, A. , de Eguileor, M. , Grazi, G. L. , Cescon, M. , Franceschi, C. , & Capri, M. (2019). The peculiar aging of human liver: A geroscience perspective within transplant context. Ageing Research Reviews, 51, 24–34. 10.1016/j.arr.2019.02.002 [DOI] [PubMed] [Google Scholar]
- Nejad, C. , Pillman, K. A. , Siddle, K. J. , Pépin, G. , Änkö, M.‐L. , McCoy, C. E. , Beilharz, T. H. , Quintana‐Murci, L. , Goodall, G. J. , Bracken, C. P. , & Gantier, M. P. (2018). miR‐222 isoforms are differentially regulated by type‐I interferon. RNA, 24, 332–341. 10.1261/rna.064550.117 [DOI] [PMC free article] [PubMed] [Google Scholar]
- Olivieri, F. , Capri, M. , Bonafè, M. , Morsiani, C. , Jung, H. J. , Spazzafumo, L. , Viña, J. , & Suh, Y. (2017). Circulating miRNAs and miRNA shuttles as biomarkers: Perspective trajectories of healthy and unhealthy aging. Mechanisms of Ageing and Development, 165, 162–170. 10.1016/j.mad.2016.12.004 [DOI] [PMC free article] [PubMed] [Google Scholar]
- Olivieri, F. , Rippo, M. R. , Monsurrò, V. , Salvioli, S. , Capri, M. , Procopio, A. D. , & Franceschi, C. (2013a). MicroRNAs linking inflamm‐aging, cellular senescence and cancer. Ageing Research Reviews, 12, 1056–1068. 10.1016/j.arr.2013.05.001 [DOI] [PubMed] [Google Scholar]
- Olivieri, F. , Rippo, M. R. , Procopio, A. D. , & Fazioli, F. (2013b). Circulating inflamma‐miRs in aging and age‐related diseases. Frontiers in Genetics, 4, 121. 10.3389/fgene.2013.00121 [DOI] [PMC free article] [PubMed] [Google Scholar]
- Olivieri, F. , Spazzafumo, L. , Santini, G. , Lazzarini, R. , Albertini, M. C. , Rippo, M. R. , Galeazzi, R. , Abbatecola, A. M. , Marcheselli, F. , Monti, D. , Ostan, R. , Cevenini, E. , Antonicelli, R. , Franceschi, C. , & Procopio, A. D. (2012). Age‐related differences in the expression of circulating microRNAs: miR‐21 as a new circulating marker of inflammaging. Mechanisms of Ageing and Development, 133, 675–685. 10.1016/j.mad.2012.09.004 [DOI] [PubMed] [Google Scholar]
- Ortega‐Molina, A. , & Serrano, M. (2013). PTEN in cancer, metabolism and aging. Trends in Endocrinology & Metabolism, 24(4), 184–189. 10.1016/j.tem.2012.11.002 [DOI] [PMC free article] [PubMed] [Google Scholar]
- Serna, E. , Gambini, J. , Borras, C. , Abdelaziz, K. M. , Belenguer, A. , Sanchis, P. , Avellana, J. A. , Rodriguez‐Mañas, L. , & Viña, J. (2012). Centenarians, but not octogenarians, up‐regulate the expression of microRNAs. Scientific Reports, 2, 961. 10.1038/srep00961 [DOI] [PMC free article] [PubMed] [Google Scholar]
- Sun, Z. , Evans, J. , Bhagwate, A. , Middha, S. , Bockol, M. , Yan, H. , & Kocher, J.‐P. (2014). CAP‐miRSeq: a comprehensive analysis pipeline for microRNA sequencing data. BMC Genomics, 15, 423. 10.1186/1471-2164-15-423 [DOI] [PMC free article] [PubMed] [Google Scholar]
- Telonis, A. G. , Magee, R. , Loher, P. , Chervoneva, I. , Londin, E. , & Rigoutsos, I. (2017). Knowledge about the presence or absence of miRNA isoforms (isomiRs) can successfully discriminate amongst 32 TCGA cancer types. Nucleic Acids Research, 45, 2973–2985. 10.1093/nar/gkx082 [DOI] [PMC free article] [PubMed] [Google Scholar]
- Teo, Y. V. , Capri, M. , Morsiani, C. , Pizza, G. , Faria, A. M. C. , Franceschi, C. , & Neretti, N. (2019). Cell‐free DNA as a biomarker of aging. Aging Cell, 18(1), e12890. 10.1111/acel.12890 [DOI] [PMC free article] [PubMed] [Google Scholar]
- Terlecki‐Zaniewicz, L. , Lämmermann, I. , Latreille, J. , Bobbili, M. R. , Pils, V. , Schosserer, M. , Weinmüllner, R. , Dellago, H. , Skalicky, S. , Pum, D. , Almaraz, J. C. H. , Scheideler, M. , Morizot, F. , Hackl, M. , Gruber, F. , & Grillari, J. (2018). Small extracellular vesicles and their miRNA cargo are anti‐apoptotic members of the senescence‐associated secretory phenotype. Aging, 10, 1103–1132. 10.18632/aging.101452 [DOI] [PMC free article] [PubMed] [Google Scholar]
- Tominaga, K. , & Suzuki, H. I. (2019). TGF‐β signaling in cellular senescence and aging‐related pathology. International Journal of Molecular Sciences, 20(20), 5002. 10.3390/ijms20205002 [DOI] [PMC free article] [PubMed] [Google Scholar]
- Tower, J. (2015). Programmed cell death in aging. Ageing Research Reviews, 23, 90–100. 10.1016/j.arr.2015.04.002 [DOI] [PMC free article] [PubMed] [Google Scholar]
- Urgese, G. , Paciello, G. , Acquaviva, A. , & Ficarra, E. (2016). isomiR‐SEA: An RNA‐Seq analysis tool for miRNAs/isomiRs expression level profiling and miRNA‐mRNA interaction sites evaluation. BMC Bioinformatics, 17, 148. 10.1186/s12859-016-0958-0 [DOI] [PMC free article] [PubMed] [Google Scholar]
- Vlachos, I. S. , Zagganas, K. , Paraskevopoulou, M. D. , Georgakilas, G. , Karagkouni, D. , Vergoulis, T. , Dalamagas, T. , & Hatzigeorgiou, A. G. (2015). DIANA‐miRPath v3.0: Deciphering microRNA function with experimental support. Nucleic Acids Research, 43, W460–W466. 10.1093/nar/gkv403 [DOI] [PMC free article] [PubMed] [Google Scholar]
- Weilner, S. , Schraml, E. , Wieser, M. , Messner, P. , Schneider, K. , Wassermann, K. , Micutkova, L. , Fortschegger, K. , Maier, A. B. , Westendorp, R. , Resch, H. , Wolbank, S. , Redl, H. , Jansen‐Dürr, P. , Pietschmann, P. , Grillari‐Voglauer, R. , & Grillari, J. (2016). Secreted microvesicular miR‐31 inhibits osteogenic differentiation of mesenchymal stem cells. Aging Cell, 15, 744–754. 10.1111/acel.12484 [DOI] [PMC free article] [PubMed] [Google Scholar]
- Xu, M. , Tchkonia, T. , Ding, H. , Ogrodnik, M. , Lubbers, E. R. , Pirtskhalava, T. , White, T. A. , Johnson, K. O. , Stout, M. B. , Mezera, V. , Giorgadze, N. , Jensen, M. D. , LeBrasseur, N. K. , & Kirkland, J. L. (2015). JAK inhibition alleviates the cellular senescence‐associated secretory phenotype and frailty in old age. Proceedings of the National Academy of Sciences of the United States of America, 112, E6301–E6310. 10.1073/pnas.1515386112 [DOI] [PMC free article] [PubMed] [Google Scholar]
- Yu, F. , Pillman, K. A. , Neilsen, C. T. , Toubia, J. , Lawrence, D. M. , Tsykin, A. , Gantier, M. P. , Callen, D. F. , Goodall, G. J. , & Bracken, C. P. (2017). Naturally existing isoforms of miR‐222 have distinct functions. Nucleic Acids Research, 45, 11371–11385. 10.1093/nar/gkx788 [DOI] [PMC free article] [PubMed] [Google Scholar]
- Zarecki, P. , Hackl, M. , Grillari, J. , Debono, M. , & Eastell, R. (2020). Serum microRNAs as novel biomarkers for osteoporotic vertebral fractures. Bone, 130, 115105. 10.1016/j.bone.2019.115105 [DOI] [PubMed] [Google Scholar]
- Zhao, D. (2020). Single nucleotide alterations in MicroRNAs and human cancer‐A not fully explored field. Non‐coding RNA Research, 5, 27–31. 10.1016/j.ncrna.2020.02.003 [DOI] [PMC free article] [PubMed] [Google Scholar]
Associated Data
This section collects any data citations, data availability statements, or supplementary materials included in this article.
Supplementary Materials
Fig S1
Fig S2
Fig S3
Fig S4
Supplementary Material
Data Availability Statement
The data that support the findings of this study are available from the corresponding author upon request.