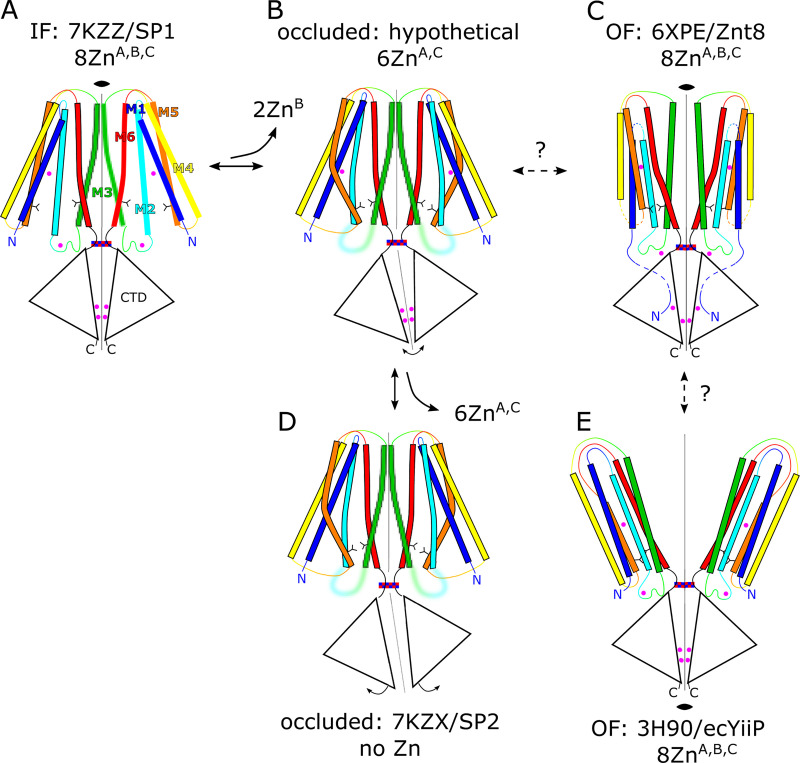
Lopez-Redondo et al. use cryo-EM and molecular dynamics to evaluate the effects of Zn2+ binding on the conformation and dynamics of the zinc/proton antiporter YiiP. Removal of Zn2+ leads to enhanced conformational dynamics and causes a transition to an intermediate state in the transport cycle.
Abstract
YiiP is a secondary transporter that couples Zn2+ transport to the proton motive force. Structural studies of YiiP from prokaryotes and Znt8 from humans have revealed three different Zn2+ sites and a conserved homodimeric architecture. These structures define the inward-facing and outward-facing states that characterize the archetypal alternating access mechanism of transport. To study the effects of Zn2+ binding on the conformational transition, we use cryo-EM together with molecular dynamics simulation to compare structures of YiiP from Shewanella oneidensis in the presence and absence of Zn2+. To enable single-particle cryo-EM, we used a phage-display library to develop a Fab antibody fragment with high affinity for YiiP, thus producing a YiiP/Fab complex. To perform MD simulations, we developed a nonbonded dummy model for Zn2+ and validated its performance with known Zn2+-binding proteins. Using these tools, we find that, in the presence of Zn2+, YiiP adopts an inward-facing conformation consistent with that previously seen in tubular crystals. After removal of Zn2+ with high-affinity chelators, YiiP exhibits enhanced flexibility and adopts a novel conformation that appears to be intermediate between inward-facing and outward-facing states. This conformation involves closure of a hydrophobic gate that has been postulated to control access to the primary transport site. Comparison of several independent cryo-EM maps suggests that the transition from the inward-facing state is controlled by occupancy of a secondary Zn2+ site at the cytoplasmic membrane interface. This work enhances our understanding of individual Zn2+ binding sites and their role in the conformational dynamics that govern the transport cycle.
Introduction
YiiP is a Zn2+ transporter from bacteria belonging to the family of cation diffusion facilitators (CDFs), also known as SLC30, with representatives in all kingdoms of life. YiiP functions as a Zn2+/H+ antiporter and is capable of using the proton motive force to remove Zn2+ from the cytoplasm (Cotrim et al., 2019). Although Zn2+ is a prevalent substrate for other family members, there is evidence for transport of other transition metal ions, such as Mn2+, Co2+, Fe2+, Ni2+, and Cd2+ (Montanini et al., 2007; Cubillas et al., 2013). Human homologues include a group of 10 transporters named Znt1–10, which are largely responsible for loading various organelles with Zn2+ (Kambe, 2012). There is increasing appreciation for the physiological roles played by Zn2+ in a number of biological processes, including synaptic transmission, oocyte fertilization, and insulin secretion (Liang et al., 2016). It has been estimated that 10% of the mammalian proteome is bound to Zn2+, either as a cofactor for enzymatic reactions or as a structural element stabilizing a protein fold (Andreini et al., 2006). Insufficient Zn2+ in the diet has significant health consequences, including chronic inflammation, diarrhea, and growth retardation (Prasad, 2013), and genetic defects in Zn2+ transporters have been associated with diabetes and Alzheimer’s disease (Lovell et al., 2005; Sladek et al., 2007). Despite relatively high concentrations of total Zn (millimolar) in cells, levels of free Zn2+ are in the picomolar range (Maret, 2013) due to the high binding capacity of the proteome, inducible expression of metallothionein, and complexation with free amino acids, such as cysteine and histidine (Costello et al., 2011; Kimura and Kambe, 2016). Given these unique physiological considerations, a coordinated network of transporters, which also includes ZIP family transporters (SLC39A), P-type ATPase (ZntA), and ABC transporters (Cotrim et al., 2019; Neupane et al., 2019), is required to maintain homeostasis of the organism.
CDF transporters share a common architecture presumed to underlie a common mechanism of transport. X-ray structures of YiiP from Escherichia coli (ecYiiP; Lu and Fu, 2007; Lu et al., 2009) revealed a homodimeric assembly in which each protomer is divided into a transmembrane domain (TMD) composed of six helices and a C-terminal domain (CTD) with a fold resembling a metallochaperone. Conserved metal ion binding sites are seen in the TMD (site A), which is thought to function as the transport site, as well as in the CTD (site C). YiiP also has a nonconserved site in the M2-M3 intracellular loop (site B) and a second metal ion bound by nonconserved residues at site C making a total of four Zn2+ ions bound per protomer. Although other CDF family members conform to this overall architecture, many include a His-rich intracellular loop between M4 and M5 that has been postulated to play a role in delivering Zn2+ to the transport sites (Podar et al., 2012). Several x-ray structures have been determined for isolated CTDs from various species showing that it dimerizes on its own and undergoes a scissor-like conformational change upon binding Zn2+ (Cotrim et al., 2019). Cryo-EM structures of the intact YiiP dimer from Shewanella oneidensis (soYiiP) were determined from ordered arrays in a lipid membrane, which confirmed the overall architecture of the E. coli protein, but revealed major conformational changes (Coudray et al., 2013; Lopez-Redondo et al., 2018). Specifically, accessibility of transport sites indicated that the x-ray structure was in an outward-facing state, whereas the cryo-EM structure was in an inward-facing state. In addition, the comparison highlighted a large, scissor-like displacement of the TMD from each protomer that was initially implicated in transport; however, disulfide cross-links engineered to prevent these movements had no effect on transport function, suggesting that more subtle conformational changes may be at play (Lopez-Redondo et al., 2018). Hydroxyl radical labeling was used to identify hydrophobic residues at the cytoplasmic side of M5 and M6 that were postulated to gate access to the transport sites (site A). This result implies a rocking of the outer membrane helices (M1, -2, -4, -5) relative to the inner membrane helices (M3 and -6) that mediate the dimer interface (Gupta et al., 2014). Recent MD simulations using a composite model for YiiP and cryo-EM structures of the mammalian transporter Znt8 provide additional support for these motions and for the ability of the hydrophobic gate to control access (Sala et al., 2019; Xue et al., 2020). In addition, the Znt8 structures revealed two unexpected Zn binding sites: although amino acid sequence is not conserved, these two new sites appear in similar locations to site B and site C on YiiP, and the former was proposed to play an active role in recruiting ions for transport.
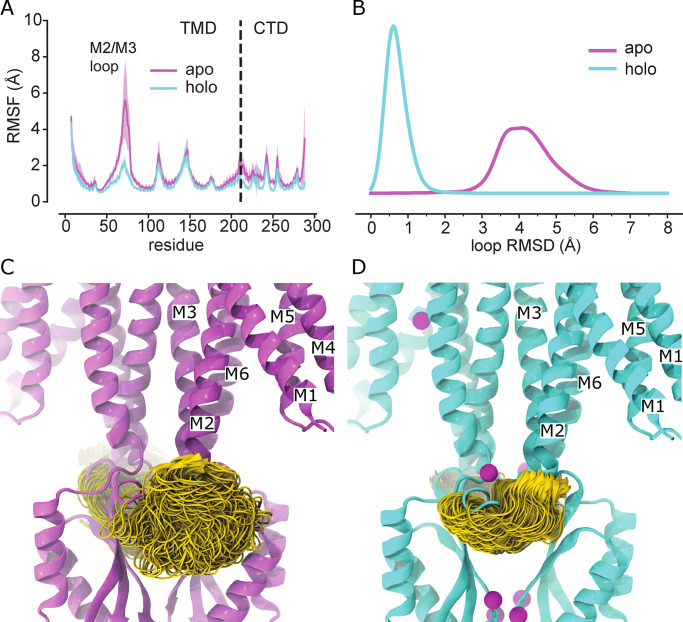
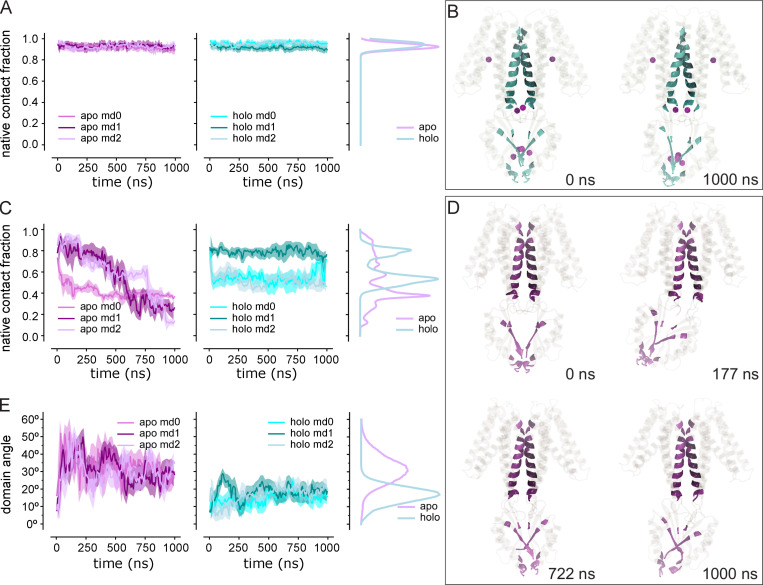
For the current study, we explored the effects of Zn2+ binding on the conformational dynamics of soYiiP using cryo-EM and MD simulation. To facilitate the cryo-EM analysis, we used a phage display screen to develop an antibody Fab fragment recognizing the CTD. After using an in vitro transport assay to ensure that the Fab did not interfere with function, we generated several cryo-EM structures before and after chelation of Zn2+ ions. 3-D classification and 3-D variability analysis of cryo-EM datasets revealed conformational variability within individual samples, which appear to correlate with Zn2+ binding to the site on the TM2-TM3 loop (site B). Two discrete structures revealed distinct conformations corresponding to holo and apo states, whereas 3-D variability analysis elucidated the transition between these states. The refined structures at 3.4 and 4.0 Å resolution, respectively, revealed a disordering of the TM2-TM3 loop and Zn site B, as well as a concomitant closing of the hydrophobic gate when Zn2+ was removed. For MD simulation, we developed a nonbonded dummy model for Zn2+ ions and validated it against known Zn2+-binding proteins. MD simulations of the apo and holo states of YiiP revealed enhanced dynamics in the absence of Zn2+ that were well correlated with the cryo-EM structures. In particular, enhanced movements were observed for the M2/M3 loop and for the CTD relative to the TMD in the absence of Zn2+. Despite the enhanced flexibility and gate closure, dimer interfaces within the TMD and the CTD were preserved in both the cryo-EM structures and MD simulations.
Materials and methods
Protein expression and purification
WT YiiP was expressed in E. coli BL21-AI cells (Life Technologies) from a modified pET vector with an N-terminal decahistidine tag. Cells were grown in LB media supplemented with 30 µg/ml kanamycin at 37°C until they reached an A600 of 0.8, at which point they were cooled to 18°C. Expression was induced by addition of 0.1 mM isopropyl-β-D-thiogalactoside (IPTG) followed by overnight incubation at 18°C. Cells were harvested by centrifugation at 4,000 g for 1 h, resuspended in lysis buffer (20 mM HEPES, pH 7.5, 100 mM NaCl, 10% glycerol, and 250 µM tris(2-carboxyethyl)phosphine [TCEP]) and then lysed with a high-pressure homogenizer (Emulsiflex-C3; Avestin). The membrane fraction was collected by centrifugation at 100,000 g and then solubilized by addition of 0.375 g n-dodecyl-β-D-maltoside (DDM; Anatrace) per gram of membrane pellet for 2 h at 4°C in lysis buffer. Insoluble material was removed by centrifugation at 100,000 g for 40 min. The supernatant was loaded onto a Ni-NTA affinity column pre-equilibrated in buffer A (20 mM HEPES, pH 7.5, 100 mM NaCl, 10% glycerol, and 0.05% DDM). The column was washed by addition of buffer A supplemented with 20 mM imidazole and protein was then eluted using a gradient of imidazole ranging from 20 to 500 mM. Peak fractions were combined, supplemented with tobacco etch virus (TEV) protease (1:10 weight ratio of TEV:YiiP) to cleave the decahistidine tag, and dialyzed overnight at 4°C against buffer A. TEV protease was removed by loading the dialysate onto an Ni-NTA column and collecting the flow-through fractions. After concentration, a final purification was done with a Superdex 200 size-exclusion chromatography (SEC) column (GE Healthcare) equilibrated with SEC buffer (20 mM HEPES, pH 7.5, 150 mM NaCl, 0.2% n-decyl-β-D-maltoside, and 1 mM TCEP).
Transport assay
A fluorometric assay was used to measure transport, as described previously (Lopez-Redondo et al., 2018). For this assay, YiiP was reconstituted by mixing 25 µg of purified YiiP in reconstitution buffer (20 mM HEPES, pH 6.5, and 200 mM K2SO4) with 1.5 mg Triton X-100 and 2.5 mg of E. coli polar lipids (Avanti Polar Lipids) in a volume of 250 µl. This protein/lipid/detergent mixture was incubated at room temperature for 30 min and then SM2 BioBeads (BioRad) were added in three steps: 7.5 mg BioBeads followed by 1.5 h incubation at room temperature, 15 mg BioBeads followed by overnight incubation at 4°C, and 15 mg BioBeads for 1 h at 4°C. The resulting proteoliposomes were collected and stored at −80°C.
Prior to the transport assay, proteoliposomes were loaded with 200 µM of FluoZin-1 (Thermo Fisher Scientific). After adding dye, proteoliposomes were subjected to five cycles of freeze-thaw using LN2 and were then extruded 13 times through 0.4-µm polycarbonate membranes (Whatman Nucleopore; Millipore Sigma) pre-equilibrated with reconstitution buffer. Excess FluoZin-1 dye was then removed by passing the sample through a PD-10 desalting column (GE Healthcare) pre-equilibrated with reconstitution buffer.
For the transport assay, proteoliposomes were introduced into a fluorimeter (Fluoromax-4; Horiba Scientific) using a stopped-flow apparatus (STA-20 Rapid Kinetic Accessory; Hi-Tech Scientific). This apparatus mixed the proteoliposome solution with an equal volume of reconstitution buffer supplemented with various concentrations of ZnCl2 (0.125–64 mM in reconstitution buffer) and has a dead time of ∼50 ms. Fluorescence was excited at 490 nm and monitored at 525 nm. To normalize the fluorescence signal, maximal fluorescence from each individual preparation was determined after mixing 4% β-octyl-D-glucoside and 64 mM ZnCl2 with an equal volume of proteoliposomes. In addition, a protein-free preparation of liposomes was used to determine a baseline leakage of Zn. From these data, the transport rate was quantified by plotting FP/FPmax − FL/FLmax versus time, where FP and FL are the signals from proteoliposomes and protein-free liposomes, respectively, and FPmax and FLmax are the corresponding normalization signals in the presence of β-octyl-D-glucoside. The initial rates from each run were then fitted with the Hill equation to determine K0.5, n, and Vmax (Lopez-Redondo et al., 2018).
Fab selection, expression, and mutagenesis
Synthetic antibodies with an Fab architecture were selected from a phage-display library (Miller et al., 2012; Sauer et al., 2020). For this selection, purified YiiP retaining the His tag was reconstituted into biotinylated nanodiscs (Ritchie et al., 2009). We used a construct of the membrane scaffolding protein based on MSP1E3D1 (Sigma-Aldrich) with a Cys residue engineered into the C terminus (a gift from Dr. John F. Hunt, Columbia University, New York, NY). Prior to reconstitution, this Cys residue was labeled with biotin by incubation of membrane scaffolding protein with a 20-fold molar excess of maleimide-PEG11-biotin (Thermo Fisher Scientific) overnight at 4°C. For reconstitution of nanodiscs, E. coli polar lipids was solubilized in DDM (1:2 weight ratio) and added to YiiP at a molar lipid-to-protein ratio of 277:1 in nanodisc buffer (20 mM Tris, pH 7.4, 100 mM NaCl, 0.5 mM EDTA, and 0.5 mM TCEP). After incubation on ice for 10 min, biotinylated membrane scaffolding protein was added at an eightfold molar excess to produce 500 µl of a solution containing 2.5 mM E. coli polar lipids, 72 µM membrane scaffolding protein, 9 µM YiiP, and 7.2 mM DDM. After incubation at 4°C for 1 h, BioBeads were added in three steps (300 mg for 1 h, 200 mg for 30 min, and 100 mg overnight) while the solution was gently stirred at 4°C. Nanodiscs containing YiiP were then separated from empty nanodiscs by incubating the solution with 0.5 ml Ni-NTA beads pre-equilibrated with nanodisc buffer for 30 min at 4°C. These beads were packed into a column, washed with 1 ml nanodisc buffer, and nanodisc-reconstituted YiiP was then eluted with 2 ml nanodisc buffer supplemented with 0.3 M imidazole. Peak elution fractions were pooled and concentrated with an Amicon concentrator (cutoff 50 kD). The concentrated sample was fractionated on Superdex 200 10/300 GL size-exclusion column pre-equilibrated and eluted with nanodisc buffer.
For the phage display selection, biotinylated nanodiscs were immobilized on streptavidin-coated magnetic beads and library sorting was performed as published previously (Miller et al., 2012; Dominik and Kossiakoff, 2015; Sauer et al., 2020). The process comprised four rounds of binding, washing, and amplification of the bound phages in E. coli. In later rounds, enriched phage pools were reapplied either to reconstituted YiiP to improve the selection or to empty nanodiscs to perform a negative selection. Clones were analyzed using phage ELISA. The Fab genes of selected clones were subcloned into the Ptac-Fab-accept vector that was constructed from the RH2.2IPTG vector (a gift of Dr. Sachdev Sidhu, University of Toronto, Toronto, ON, Canada) for large scale expression. After selecting a particular Fab molecule for cryo-EM analysis (see below), a mutation was made in the hinge between the two domains of the Fab heavy chain in an attempt to produce a more rigid molecule. Specifically, the sequence 130SSASTKG136, which is an invariate part of the Fab scaffold, was changed to 130FNQIKG135 (Bailey et al., 2018).
For expression of Fab, E. coli strain 55244 was transformed with the Fab expression vector. These cells were then cultured in 1 liter of media composed of 12 g/liter tryptone, 24 g/liter yeast extract, 12.5 g/liter K2HPO4, 2.3 g/liter KH2PO4, and 0.8% glycerol for ∼24 h at 30°C. Although this plasmid carries a T4 promoter, Fab expression was achieved without the addition of IPTG. Cells were harvested by centrifugation at 8,000 g for 1 h and the cell pellet was typically stored at −80°C. For purification, the cell pellet was thawed and resuspended in 20 mM Na3PO4 (pH 7), with 1 mg/ml hen egg lysozyme, 1 mM PMSF, and 1 µg/ml DNaseI/MgCl2. This cell suspension was incubated at room temperature for 1 h followed by 15 min on ice and was then passed through a high-pressure homogenizer (Emulsiflex-C3; Avestin). The lysate was centrifuged at 34,000 g for 1 h at 4°C and the supernatant passed through a 0.22-µm filter. This solution was loaded onto a 5-ml HiTrap Protein G HP column (GE Healthcare) equilibrated with 20 mM Na3PO4 (pH 7.0) and eluted with 0.1 M glycine-HCl (pH 2.7). Fractions of 2 ml were collected in tubes containing 200 µl of 2 M Tris-HCl (pH 8). Pooled fractions were dialyzed against 1 liter of 50 mM NaCH3CO2 (pH 5.0) overnight at 4°C. Finally, this dialysate was loaded onto a Resource-S cation exchange column (GE Healthcare) equilibrated in 50 mM NaCH3CO2 (pH 5.0) and eluted with a 0 to 50% gradient of elution buffer (50 mM NaCH3CO2, pH 5, and 0.5 M NaCl). Fractions containing pure Fab were pooled and dialyzed against YiiP SEC buffer.
Cryo-EM sample preparation and data analysis
A complex between YiiP and Fab was produced by incubating a mixture of the two proteins at a 1:1 molar ratio for 1 h at 20°C with a total protein concentration of ∼17 µM. For initial characterization of the complex, the sample was run on a Shodex KW-803 size-exclusion column (Showa Denko America) that was equilibrated with 20 mM HEPES (pH 7.5), 150 mM NaCl, 0.2% n-decyl-β-D-maltoside, and 1 mM N,N,N′,N′-tetrakis(2-pyridinylmethyl)-1,2-ethanediamine (TPEN) using an HPLC (Waters Corp) with a flow rate of 0.5 ml/min. The complex was then purified on a Superdex 200 size-exclusion column equilibrated with SEC buffer using fast protein liquid chromatography (AKTA; GE Healthcare). Some of the samples were treated with either EDTA or TPEN to chelate metal ions (Table 1). In those cases, the complex was incubated with 0.5 mM EDTA or with a combination of 0.5 mM EDTA and 0.5 mM TPEN for 16 h at 4°C, and in most cases those chelators were also added to the SEC buffer during final purification. Peak elution fractions were pooled and concentrated to 3–4 mg/ml and used immediately for preparation of cryo-EM samples. For this process, 3–4 µl of solution were added to glow-discharged grids (C-Flat 1.2/1.3-4Cu-50; Protochips) that were blotted under 100% humidity at 4°C and plunge frozen into liquid ethane using a Vitrobot (FEI Corp).
Table 1. Samples used for cryo-EM analysis.
| Sample | Complex | Pretreatment | SEC | Grid preparation | Images/particles | Resolution, symmetry, structure ID |
|---|---|---|---|---|---|---|
| 2DX | YiiP helical crystals | 5 mM EDTA 10 min | No EDTA | Dialysis/reconstitution | 1,732 imgs | |
| 152,728 ptcls | 4.2 Å, D3, 2DX | |||||
| 213,454 ptcls | 4.2 Å D1, 2DX | |||||
| SP1 | YiiP + Fab2 | No EDTA | No EDTA | Concentration | 4,312 imgs | |
| 102,390 ptcls | 3.8 Å, C2, SP1 | |||||
| SP2 | YiiP + Fab2r | 0.5 mM EDTA o/n | 0.5 mM EDTA | Concentration | 1,945 imgs | |
| 140,465 ptcls | 4.0 Å, C1, SP2 | |||||
| SP3 | YiiP + Fab2r | 0.5 mM EDTA o/n | No EDTA | Concentration, filter | 2,898 imgs | |
| 151,898 ptcls | 3.4 Å, C2, SP3sym | |||||
| 85,207 ptcls | 4.2 Å C1, SP3bent | |||||
| SP4 | YiiP + Fab2r | 0.5 mM EDTA, 0.5 mM TPEN o/n | 0.5 mM EDTA, 0.5 mM TPEN | Concentration, filter | 8,234 imgs | |
| 287,608 ptcls | 3.5 Å, C2, SP4sym | |||||
| 140,971 ptcls | 4.7 Å, C1, SP4bent |
o/n, overnight incubation; imgs, images; ptcls, particles.
For tubular crystals, we followed procedures described in previous publications (Coudray et al., 2013; Lopez-Redondo et al., 2018). In brief, purified protein containing 0.9 mg/ml YiiP and 0.2% n-decyl-β-D-maltoside was mixed with a solution of 2 mg/ml dioleoylphosphatidylglycerol solubilized with 4 mg/ml DDM to achieve a lipid-to-protein weight ratio of 0.5. After incubation for 1 h, this solution was dialyzed for 14 d at 4°C against a buffer composed of 20 mM N-[tris(hydroxymethyl)methyl]- 2-aminoethanesulfonic acid (TES), pH 7, 100 mM NaCl, 5 mM MgCl2, and 5 mM NaN3. The presence of tubular crystals was confirmed by viewing negatively stained samples. For cryo-EM analysis, samples were diluted 30-fold and applied to grids covered with home-made lacey carbon films. These grids were then blotted from the back side of the grid and plunge frozen in liquid ethane using a Leica EMGP (Leica Microsystems).
Samples of tubular crystals were imaged with a Talos Arctica 200-kV EM (FEI Corp) with a K2 Summit detector (Gatan), and samples of the YiiP/Fab complex were imaged with a Titan Krios G3i 300-kV EM (FEI Corp) equipped a Bioquantum energy filter with K2 or K3 direct electron detector (Gatan). Pixel size was ∼1 Å/pix with a total dose of 50–80 electrons/Å2. After selecting micrographs free from excessive contamination, crystalline ice, or imaging artifacts, images of the YiiP/Fab complex were evaluated using cryoSPARC v2.15 (Punjani et al., 2017). Templates for particle picking were initially produced by manually picking ∼1,000 particles. 2-D class averages were then used to select particles from all micrographs. The initial set of particles were subjected to 2-D classification followed by successive rounds of ab initio reconstruction using C1 symmetry, two classes, and a resolution cutoff of 12 Å to select a homogenous population. These particles were binned twofold and used for heterogeneous refinement against two or three reference structures derived from the ab initio jobs. A final selection of unbinned particles was then used for nonuniform refinement with either C1 or C2 symmetry. Postprocessing steps included calculation of local resolution and evaluation of 3-D variability (Punjani and Fleet, 2021). Images of the tubular crystals were analyzed using Relion (Scheres, 2012) according to protocols previously described (Lopez-Redondo et al., 2018).
For model building, we started with deposited Protein Data Bank (PDB) models for YiiP (accession no. 5VRF) and a related Fab molecule (accession no. 4JQI). For Fab, we used MODELLER (Webb and Sali, 2014) to produce a homology model for Fab2. After rigid-body docking of these starting models to the map from SP1, we used Namdinator (Kidmose et al., 2019) to apply the Molecular Dynamics Flexible Fitting (MDFF) method (Trabuco et al., 2008) followed by standard real-space refinement with PHENIX (Adams et al., 2010). For SP1, SP2, and SP3sym datasets, we also used Coot (Emsley et al., 2010) to manually adjust the models to resolve errors or delete disordered loops followed by real-space refinement with PHENIX. This refinement process was iterated until acceptable metrics were obtained (Table 2). The model for the SP1 dataset was used as the starting point for model building into the SP2 dataset, which required manually adjusting the membrane domain to match the density map. Lower resolution in this region made it difficult to define the structures for some loops and membrane helices. For these regions, we used Namdinator models that were generated from the 3-D variability analyses. In particular, we used the 3-D variability job in cryoSPARC with a resolution of 5.5 Å to generate three principle components of variance in the dataset. We then used the simple mode for a 3-D variability display job to produce 20 maps representing the extent of variability along each component. Next, the model from SP3sym was fitted to the 10th map using Namdinator. The resulting model was then fitted to the ninth map using Namdinator, and that model was fitted to the eighth map, and so on. This stepwise process of Namdinator fitting was repeated for maps 11 to 20. This procedure represents an objective approach to model building and resulted in the bent conformation characterized by bends in M2 and M5 as well as a plausible structure for the disordered M2/M3 loop. This Namdinator model was then docked to the SP2 map and refined through several rounds of Coot modeling and PHENIX real-space refinement.
Table 2. Cryo-EM data collection and model statistics.
| Dataset | SP1 untreated | SP2 EDTA treated | SP3sym EDTA treated | SP3bent EDTA treated | SP4sym EDTA/TPEN treated | SP4bent EDTA/TPEN treated |
|---|---|---|---|---|---|---|
| Deposition | N/A | N/A | N/A | N/A | ||
| PDB | 7KZX | 7KZZ | ||||
| EMDB | EMD-23092 | EMD-23093 | ||||
| Data collection and processing | ||||||
| Magnification | 81,000 | 81,000 | 81,000 | 81,000 | 81,000 | 81,000 |
| Voltage (kV) | 300 | 300 | 300 | 300 | 300 | 300 |
| Electron exposure (e–/Å2) | 83 | 77 | 65 | 65 | 50 | 50 |
| Defocus range (μm) | 1.0-3.0 | 1.5-3.0 | 1-2.5 | 1-2.5 | 1-2.5 | 1-2.5 |
| Pixel size (Å) | 1.035 | 1.035 | 1.048 | 1.048 | 1.079 | 1.079 |
| Symmetry imposed | C2 | C1 | C2 | C1 | C2 | C1 |
| Initial particle images (no.) | 473,960 | 848,576 | 1,448,191 | 1,448,191 | 1,685,559 | 1,685,559 |
| Final particle images (no.) | 102,390 | 140,565 | 151,898 | 85,207 | 287,608 | 140,971 |
| Map resolution (Å) | 3.83 | 4.00 | 3.42 | 4.18 | 3.52 | 4.66 |
| FSC threshold | 0.143 | 0.143 | 0.143 | 0.143 | 0.143 | 0.143 |
| Model refinement | MDFFa | MDFFa | MDFFa | |||
| Model composition | ||||||
| Nonhydrogen atoms | 10416 | 10446 | 10470 | 10446 | 10468 | 10446 |
| Protein residues | 1362 | 1361 | 1364 | 1361 | 1364 | 1361 |
| Ligands | 8 | 0 | 8 | 0 | 0 | 0 |
| RMS deviations | ||||||
| Bond lengths (Å) | 0.004 | 0.011 | 0.014 | 0.012 | 0.012 | 0.009 |
| Bond angles (°) | 0.884 | 1.103 | 2.397 | 1.275 | 1.238 | 1.119 |
| Validation | ||||||
| MolProbity score | 2.39 | 2.31 | 2.13 | 2.73 | 2.41 | 2.65 |
| Clashscore | 20.96 | 19.88 | 2.30 | 40.62 | 21.56 | 34.86 |
| Rotamer outliers (%) | 0.00 | 0.00 | 4.11 | 0.00 | 0.00 | 0.00 |
| CaBLAM outliers (%) | 3.88 | 4.72 | 5.70 | 6.02 | 5.02 | 4.42 |
| Ramachandran plot | ||||||
| Favored (%) | 89.16 | 91.10 | 85.00 | 86.16 | 88.66 | 86.84 |
| Allowed (%) | 10.84 | 8.60 | 11.57 | 13.61 | 11.04 | 13.16 |
| Disallowed (%) | 0.00 | 0.30 | 3.43 | 0.22 | 0.30 | 0.00 |
| Model vs. data CC (mask) | 0.78 | 0.81 | 0.78 | 0.78 | 0.81 | 0.82 |
FSC, forward scatter.
Models created by Namdinator, which removes Zn ligands during its fitting process.
Model for MD simulations
The cryo-EM structure of the zinc transporter YiiP from helical crystals (PDB accession no. 5VRF) was used as the initial structure for all-atom MD simulations. All ionizable residues were set to their default protonation states. For histidines in the binding sites, protonation states were based on their orientation relative to Zn ions in the cryo-EM structure: H73 and H155 were modeled with the neutral HSE tautomer (proton on the Nε), while all other histidines were modeled with the neutral HSD tautomer (proton on Nδ). As the cryo-EM structure contained zinc ions in its binding sites, it was directly used as the initial Zn2+-bound (holo) model. For the apo state, the initial model was generated by simply removing the Zn ions from PDB accession no. 5VRF.
MD simulations
All-atom YiiP membrane-protein systems were built up in a 4:1 palmitoyloleoylphosphatidylethanolamine:palmitoyloleoylphosphatidylglycerol (POPE:POPG) bilayer, which approximates the composition of the plasma membrane from E. coli (Raetz, 1986), with a free NaCl concentration of 100 mM. We used CHARMM-GUI v1.7 (Jo et al., 2008; Jo et al., 2009; Lee et al., 2016) with the CHARMM36 force field, the CMAP correction for proteins (MacKerell et al., 1998; Mackerell et al., 2004) and lipids (Klauda et al., 2010), and the CHARMM TIP3P water model. The size of apo systems was 117,394 atoms in hexagonal simulation cells (a = 101 Å, c = 135 Å) and that of holo systems was 115,068 atoms in hexagonal simulation cells (101 Å × 101 Å × 135 Å). Three repeats of 1-µs simulations were run for apo and holo states, starting from the same initial system conformation but with different initial velocities.
Simulations were performed using GROMACS 2019.6 (Abraham et al., 2015) on GPUs. Before the production equilibrium MD simulations, the systems underwent energy minimization and a 3.75-ns six-stage equilibration procedure with position restraints on protein and lipids, following the CHARMM-GUI protocol (Jo et al., 2008). All simulations were performed under periodic boundary conditions at constant temperature (T = 303.15 K) and pressure (P = 1 bar). A velocity rescaling thermostat (Bussi et al., 2007) was used with a time constant of 1 ps, and protein, lipids, and solvent were defined as three separate temperature-coupling groups. A Parrinello-Rahman barostat (Parrinello and Rahman, 1981) with time constant 5 ps and compressibility 4.6 × 10⁻⁵ bar–1 was used for semi-isotropic pressure coupling. The Verlet neighbor list was updated every 20 steps with a cutoff of 1.2 nm and a buffer tolerance of 0.005 kJ/mol/ps. Coulomb interactions under periodic boundary conditions were evaluated by using the smooth particle mesh Ewald method (Essmann et al., 1995) under tinfoil boundary conditions with a real-space cutoff of 1.2 nm, and interactions beyond the cutoff were calculated in reciprocal space with a fast-Fourier transform on a grid with 0.12-nm spacing and fourth-order spline interpolation. The Lennard–Jones forces were switched smoothly to 0 between 1.0 and 1.2 nm and the potential was shifted over the whole range and reduced to 0 at the cutoff. GROMACS was set to dynamically optimize neighborlist updates and Coulomb real-space cutoff during the simulation. Bonds to hydrogen atoms were constrained with the P-LINCS algorithm (Hess, 2008) with an expansion order of four and two LINCS iterations or with SETTLE (Miyamoto and Kollman, 1992) for water molecules. The classical equations of motions were integrated with the leapfrog algorithm with a time step of 2 fs.
Analysis of MD simulations
Simulation trajectories were analyzed with Python scripts based on MDAnalysis (Gowers et al., 2016). Probability densities of time series data were calculated as kernel density estimate (KDE) using sklearn.neighbors.KernelDensity in the scikit-learn package (Pedregosa et al., 2011) with a bandwidth of 0.2. RMSDs were calculated using the qcprot algorithm (Liu et al., 2010) as implemented in MDAnalysis; the calculation considered Cα atoms of the whole protein, TMD, and CTD after optimally superimposing the atoms on the same Cα atoms of the cryo-EM structure. Root mean square fluctuation (RMSF) of all Cα atoms were calculated by superimposing the protein either on all, on only TMD, or on only CTD Cα atoms. To quantify the flexibility of the M2/M3 loop in apo and holo states, we also calculated the Cα RMSDs of the loop when the whole protein was superimposed on itself or when just the loop was fitted on itself. To quantify the relative motion between the two domains, we performed a CTD-TMD rotation angle analysis. The whole protein was first superimposed on the TMD domain of a reference structure—here, we used the experimental holo structure (PDB accession no. 5VRF) as reference—and the rotation angle that minimized the RMSD of the CTD was calculated from the rotation matrix. To study the influence of Zn ions on the rigidity of the binding sites, RMSDs for the side chains of the binding residues were calculated. The opening of the hydrophobic gates in the TMD was assessed using two collective variables—the distance between Cα atoms of Ala41 and Ala183 as the periplasmic gate and the distance between Cα atoms of Leu154 and Leu199 for the cytosolic gate. Native contacts analysis was used to describe the stability of dimeric interfaces in the TMD and CTD. The reference native contacts were defined as pairs of atoms in the TMD—primarily located in M3 and M6—or in the CTD between protomer A and protomer B, whose pair distance was shorter than 4.5 Å in the cryo-EM structure (PDB accession no. 5VRF). A soft cutoff (Best et al., 2013) with a softness parameter of 5 Å−1 and a reference distance tolerance of 1.8 was used for the native contacts calculation, as implemented in MDAnalysis. Additionally, the RMSD time series of the native contact atoms were calculated. The distance between Cα atoms of R237 and E281 was used as another collective variable to describe the CTD dimeric interface.
Trajectories from the holo and apo simulations were quantitatively compared with the experimental SP2 and SP3sym cryo-EM maps. For this comparison, we used the EMMI module (Bonomi et al., 2018; Bonomi et al., 2019) in PLUMED (PLUMED consortium, 2019) using a modified version based on version 2.7.0 at https://github.com/plumed/plumed2/tree/isdb. To prepare the cryo-EM maps for this comparison, we masked the density corresponding to YiiP in the cryo-EM maps to remove density for the Fab molecules, which were not included in the simulations. This mask was generated based on the PDB coordinates for the respective structures and using the molmap feature of Chimera (Pettersen et al., 2004), specifying a resolution of 15 Å and cosine padding of 2 Å. We then followed the workflow described in steps 2A–2D by Bonomi et al. (2019). The masked maps were fitted by Gaussian Mixture Models, and the simulation trajectories were aligned to the Cα atoms of M3 and M6 in the PDB structures generated from the density maps. The cross-correlations were calculated for every 1,000th frame from the trajectories by the EMMI module using the Gaussian Mixture Models and aligned trajectories as input.
Classical force field model for Zn(II) ions
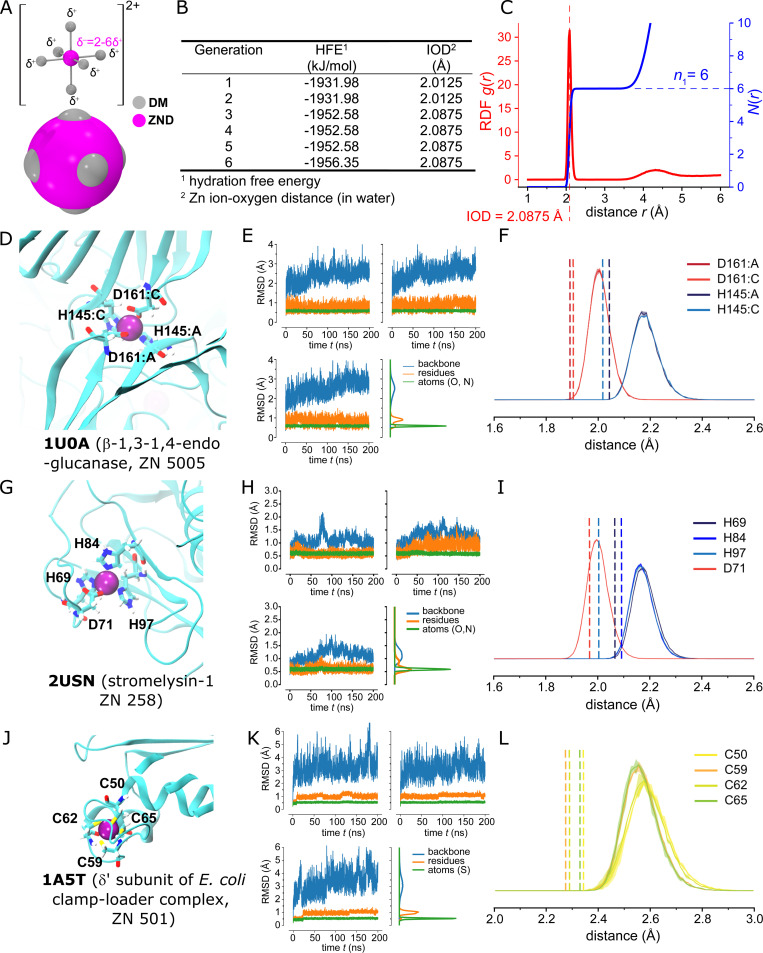
Divalent ions are challenging to simulate with classical force fields, especially when ions need to be able to transition between solution and binding sites, as for the transport site A and potentially also for the B site in YiiP. Because only a simple nonbonded soft-sphere model for zinc was available in the CHARMM forcefield, we developed a six-site nonbonded dummy model (Åqvist and Warshel, 1990; Duarte et al., 2014) for the Zn(II) ion in combination with the CHARMM TIP3P water model. Following the previous study (Duarte et al., 2014), the number of dummy sites (n = 6) was selected based on the experimental coordination number of Zn ions in water (Marcus, 1988), and the model was optimized by reproducing the hydration free energy (HFE) of −1,955 kJ/mol (Marcus, 1991) and an ion-oxygen distance (IOD) of 2.08 Å (Marcus, 1988) in simulations with the CHARMM TIP3P water model (Fig. S2). Each of the dummy sites (DM) was assigned a mass of 3 u and a partial charge of δ = +0.35e, while the central site (ZND) was assigned a mass of 47.39 u and charge of –0.1e for a total charge of +2e, where e is the absolute value of the electron charge and u the atomic mass unit. Dummy atoms were constrained to be located at a fixed distance of 0.9 Å from the central atom. Overall arrangement of dummy atoms at the corners of an octahedron was maintained by harmonic restraints between dummy atoms (force constant 334,720 kJ/[mol nm2]) and angle restraints (force constant 1,046 kJ/[mol rad2]). A genetic algorithm (Eiben et al., 1994) was used to optimize the Lennard-Jones parameters, which model van der Waals interactions, of both atom types. We first randomly generated eight sets of parameters. These sets were ranked based on the computed HFEs and IODs. HFEs were calculated via stratified all-atom alchemical free energy perturbation MD simulations (Klimovich et al., 2015; Fan et al., 2020), and a finite size correction (Reif and Hünenberger, 2011) was applied to the simulated free energy values. In particular, a total correction of –150.1 kJ/mol—consisting of a type C1 correction of –149.8 kJ/mol for the use of a Ewald method to evaluate electrostatics, a type C2 correction of –1.3 kJ/mol to correct for the artifactual constraint of vanishing average potential in the Ewald method, and a type D (PBC/LS) correction of +1.0 kJ/mol to adjust for the difference in the dielectric permittivity between the water model and real water—was added to obtain final HFE that could be compared with the experimental value. IODs were calculated from 15-ns equilibrium MD simulations in the NPT ensemble at standard conditions as the position of the first peak of the radial distribution function (RDF) between Zn ions and the oxygen atoms of all water molecules. The best four sets of parameters were kept in the next generation. Four new sets were generated by taking a random weighted average of the parameters of two sets from the previous generation. Together with another four randomly generated parameter sets, a new generation with 12 candidates was again simulated and ranked by HFEs and IODs. After repeating these steps, we obtained a converged set of van der Waals parameters in the sixth generation that reproduced the experimental coordination number in water (n = 6), IOD (model: 2.088 Å; experiment: 2.08 Å), and HFE (model: –1,956 kJ/mol; experiment: –1,955 kJ/mol; Fig. S2 A). The optimal Lennard-Jones parameters for the dummy sites (DM) were ε = 4.541995 × 10⁻⁴ kJ/mol, σ = 4.99926 × 10⁻² nm; and ε = 21.2999497535 kJ/mol, σ = 1.30117 × 10⁻¹ nm for the central ZND site. The final parameters were deposited in the Ligandbook repository (https://ligandbook.org/; Domański et al., 2017) with package ID 2934 as input files for GROMACS.
Figure S2.
Parametrization and validation of the nonbonded dummy model for Zn2+.(A) Geometry of the nonbonded dummy model. The central ZND site (magenta) is surrounded by six dummy sites DM (gray) forming a rigid octahedral shell. ZND-DM distances were maintained at 0.9 Å. Each DM particle carries a charge of δ+ = +0.35e and the central ZND particle carries −0.10e for a total charge of +2e. ZND and DM particles participate in van der Waals interactions. The approximate van der Waals radii of the ZND and DM particles are shown in the space-filling representation. (B) Results from the genetic algorithm parameter search. The Lennard-Jones parameters for the van der Waals interactions of the ZND and DM particles were optimized using a genetic algorithm to reproduce the Zn2+ HFE at standard conditions of −1,955 kJ/mol and the IOD of 2.08 Å in simulations with water. The optimization ran through six iterations, at which point it reproduced the experimental values within 1% and 0.3%, respectively. (C) Zn dummy model in water. The RDF for the Zn (ZND)-water oxygen distance, g(r), and its integral, N(r), show the first peak at the target IOD and the experimental number of water molecules in the first hydration shell, n1 = 6. (D) Validation with MD simulations of β-1,3-1,4-endoglucanase (PDB accession no. 1U0A, resolution 1.64 Å). The Zn binding site (with ZN 5005) is located in a dimer interface between chains A and C and formed by HHDD residues. (E) Binding site RMSDs of the three repeat simulations of 1U0A as time series and distribution over all repeat simulations (computed as a KDE) where the trajectory frames were superimposed on the same residues that the RMSDs was calculated for: backbone of the protein (N, C, Cα, and O atoms for all protein residues in blue), backbone and side chain heavy atoms of the coordinating residues (Asp161, His145 on chains A and C, orange and labeled residues), and coordinating atoms only (Oδ1/Oδ2 for Asp161, Nε or Nδ for His145 on chains A and C in green and labeled atoms). (F) Radial distribution of the distances of coordinating atoms (O and N) in 1U0A to the Zn ion (measured to the ZND center). Distributions were computed for each simulation repeat separately and averaged. The solid line shows the mean with bands, which are barely visible, indicating the SD. The dashed vertical lines mark the distances in the crystal structure. (G) Validation with MD simulations of stromelysin-1 (PDB accession no. 2USN, resolution 2.2 Å). The Zn binding site (with ZN 258) is formed by HHHD residues. (H) Binding site RMSDs of the three repeat simulations of 2USN, as in E: specifically, backbone and side chain atoms for His69, His84, His97, and Asp71; or Nε or Nδ for the three His residues and Oδ1/Oδ2 for Asp71. (I) Radial distribution of the distances of coordinating O and N atoms in 2USN, as in F. (J) Validation with MD simulations of δ' subunit of E. coli clamp-loader complex (PDB accession no. 1A5T, resolution 2.2 Å). The Zn binding site (with ZN 501) is formed by CCCC residues. (K) Binding site RMSDs of the three repeat simulations of 1A5T, as in E: specifically, backbone and side chain atoms for Cys50, Cys59, Cys62, and Cys65; or the Cγ of these four Cys residues. (L) Radial distribution of the distances of coordinating S atoms in 1A5T, otherwise as in F.
As discussed in Results, our CHARMM Zn(II) nonbonded dummy model was validated with MD simulations using experimental crystal structures for β-1,3-1,4-endo-glucanase (PDB accession no. 1U0A, resolution 1.64 Å), stromelysin-1 (PDB accession no. 2USN, resolution 2.20 Å), and the δ’ subunit of E. coli clamp-loader complex (PDB accession no. 1A5T, resolution 2.20 Å). Three independent repeats of 200-ns simulations were performed for each structure. The simulation systems were built with CHARMM-GUI v1.7 and the simulations were run with GROMACS 2019.6. Simulation settings were the same as for the YiiP simulations, except that we used isotropic pressure coupling and two separate temperature-coupling groups: protein and solvent. RMSDs of backbone atoms, all binding site residues, and ligand atoms were calculated to assess the stability of the Zn-bound structures. RDFs between the zinc ion and binding site ligand atoms were compared with the distances from crystal structures using RDF.InterRDF_s in Parallel MDAnalysis (Fan et al., 2019).
Online supplemental material
Supplemental figures show details of image processing used for structure determination, the process for generating the Zn dummy model used for MD simulations, as well as data discussed in the manuscript that extend or complement the main figures. Fig. S1 shows steps in structure determination of tubular crystals grown from EDTA-treated YiiP. Fig. S2 shows the parametrization and validation of the nonbonded dummy model for Zn2+. Fig. S3 shows steps in structure determination of the untreated YiiP/Fab complex from the SP1 dataset. Fig. S4 shows the stability of Zn binding sites in MD simulations of YiiP. Fig. S5 shows the RMSD plot for the remaining two MD simulations (md0 and md2) of the holo state. Fig. S6 shows steps in structure determination of the EDTA-treated YiiP/Fab complex from the SP2 dataset. Fig. S7 shows steps in structure determination of the EDTA-treated YiiP/Fab complex from the SP3 dataset. Fig. S8 shows steps in structure determination of the YiiP/Fab complex treated with both EDTA and TPEN from the SP4 dataset. Fig. S9 shows RMSD plots for the remaining two MD simulations (md0 and md2) of the apo state. Fig. S10 shows the quantitation of M2/M3 loop movements during the MD simulations showing greatly enhanced dynamics in the apo state. Fig. S11 shows the quantitative comparison of cryo-EM density maps and conformations from the MD simulation. Fig. S12 shows that dynamics of the CTD are influenced by Zn binding. Fig. S13 shows 3-D variability in the SP4 dataset.
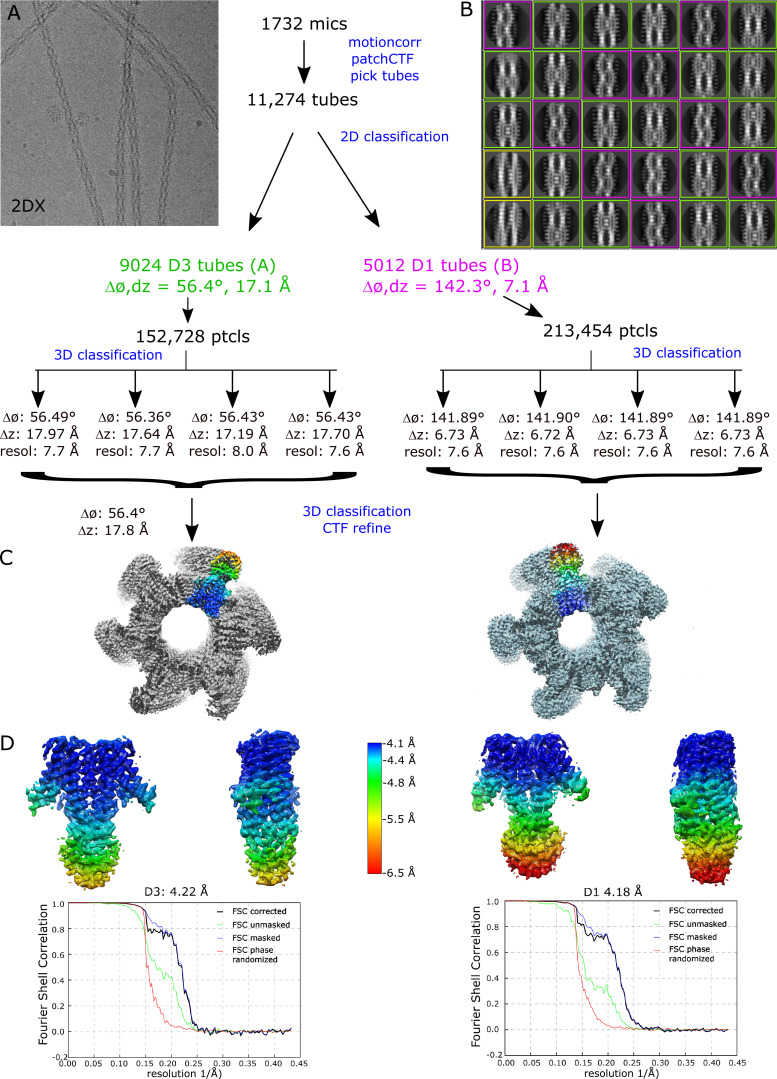
Figure S1.
Steps in structure determination of tubular crystals grown from EDTA-treated YiiP.(A) Representative micrograph. (B) Selection of 2-D class averages showing different helical symmetries: purple outline for tubes with D1 symmetry, green outline for tubes with D3 symmetry, and yellow outline for other, uncharacterized symmetries. (C) Helical reconstructions of tubular crystals with D1 and D3 symmetry. One dimer from the helical array has been colored. (D) Masked dimers from each of the reconstructions colored according to the local resolution ranging from 4.1 to 6.5 Å. The Fourier shell correlation (FSC) plot for each reconstruction is also shown, indicating an overall resolution of 4.2 Å.
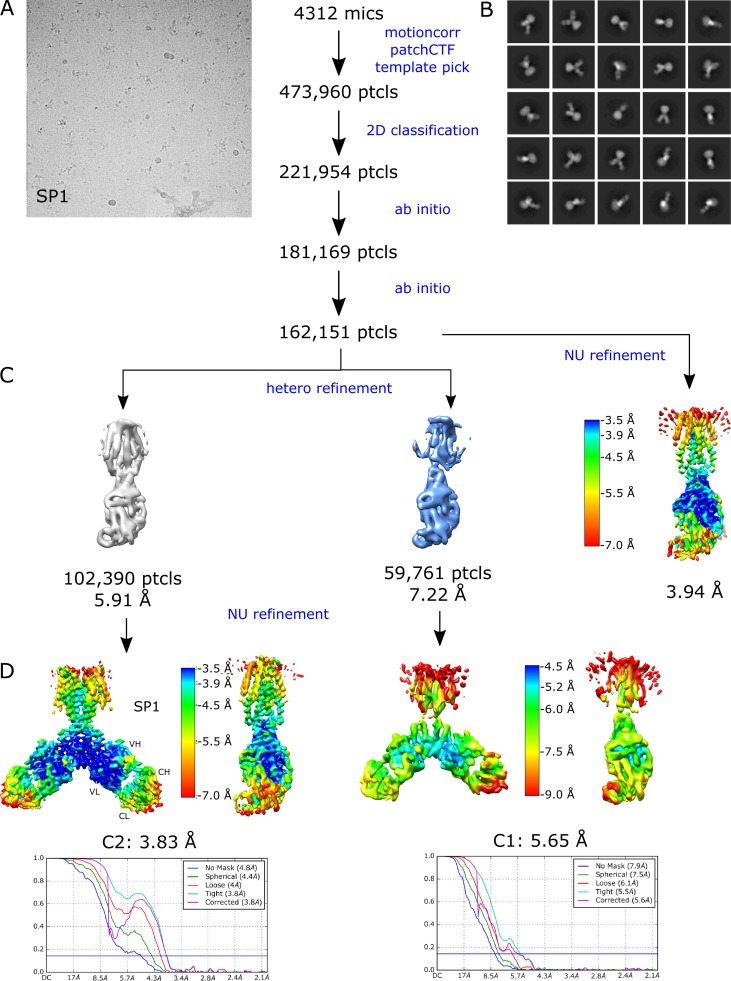
Figure S3.
Steps in structure determination of the untreated YiiP/Fab complex from the SP1 dataset.(A) Representative micrograph. (B) Selection of 2-D class averages showing multiple views of the complex. (C) Heterogeneous refinement job in cryoSPARC was used to look for multiple conformations and to select a homogeneous subset of particles for high-resolution refinement. (D) Nonuniform refinement job in cryoSPARC colored according to local resolution, which ranged from 3.5 to 7.0 Å for the best class. Fourier shell correlation (FSC) plot indicates an overall resolution of 3.8 Å when C2 symmetry was imposed.
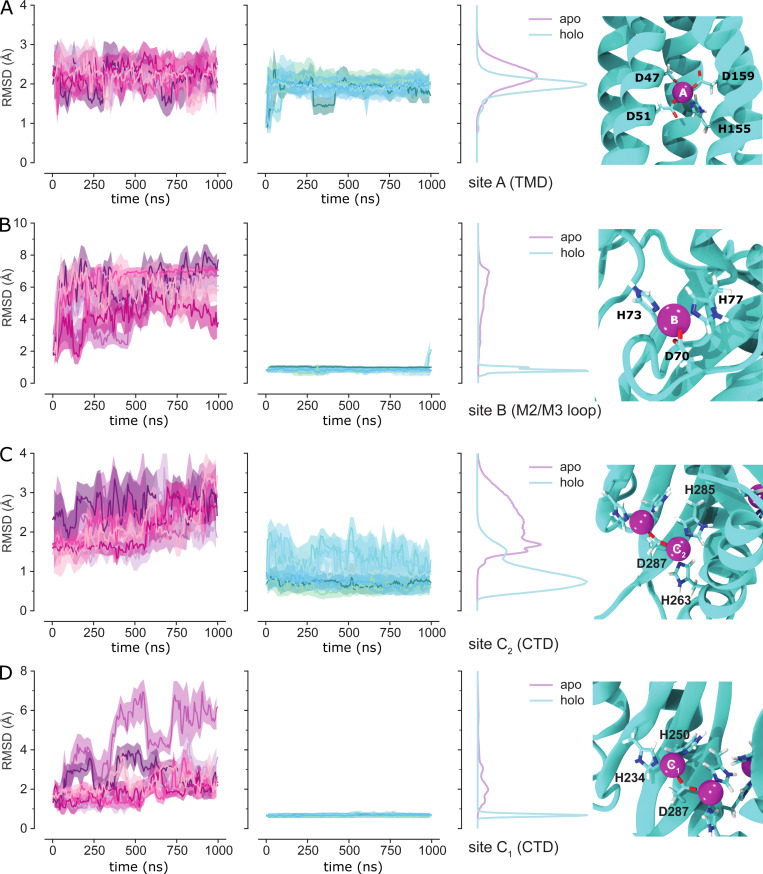
Figure S4.
Stability of Zn binding sites in MD simulations of YiiP. The RMSD of binding site residues, represented by their nonhydrogen atoms in the backbone and side chain, was calculated after optimal superposition of each protomer for apo and holo simulations and each simulation repeat (md0–md2), shown in shades of purple and cyan, respectively. To improve readability, the time series was averaged over blocks of 20 ns with the solid line showing the mean and the error band containing 95% of the data. RMSD distributions generated by a KDE are shown to the right of the time series. On the far right, each binding site in the SP3sym structure is shown with the Zn ion (magenta sphere) and the coordinating residues (licorice representation). (A) Site A in the TMD. (B) Site B in the M2/M3 loop of the TMD. (C) Site C2 in the CTD. (D) Site C1 in the CTD.
Figure S5.
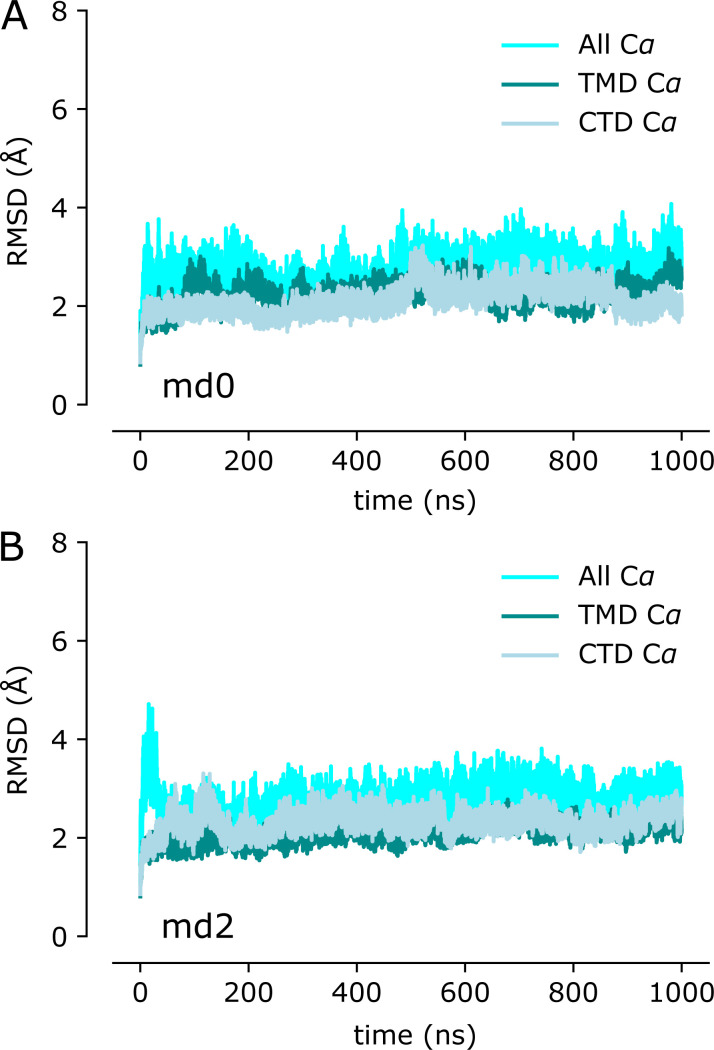
RMSD plot for the remaining two MD simulations (md0 and md2) of the holo state. The three traces correspond to the different alignment schemes relative to the starting model (5VRF) as described in Fig. 3.
Figure S6.
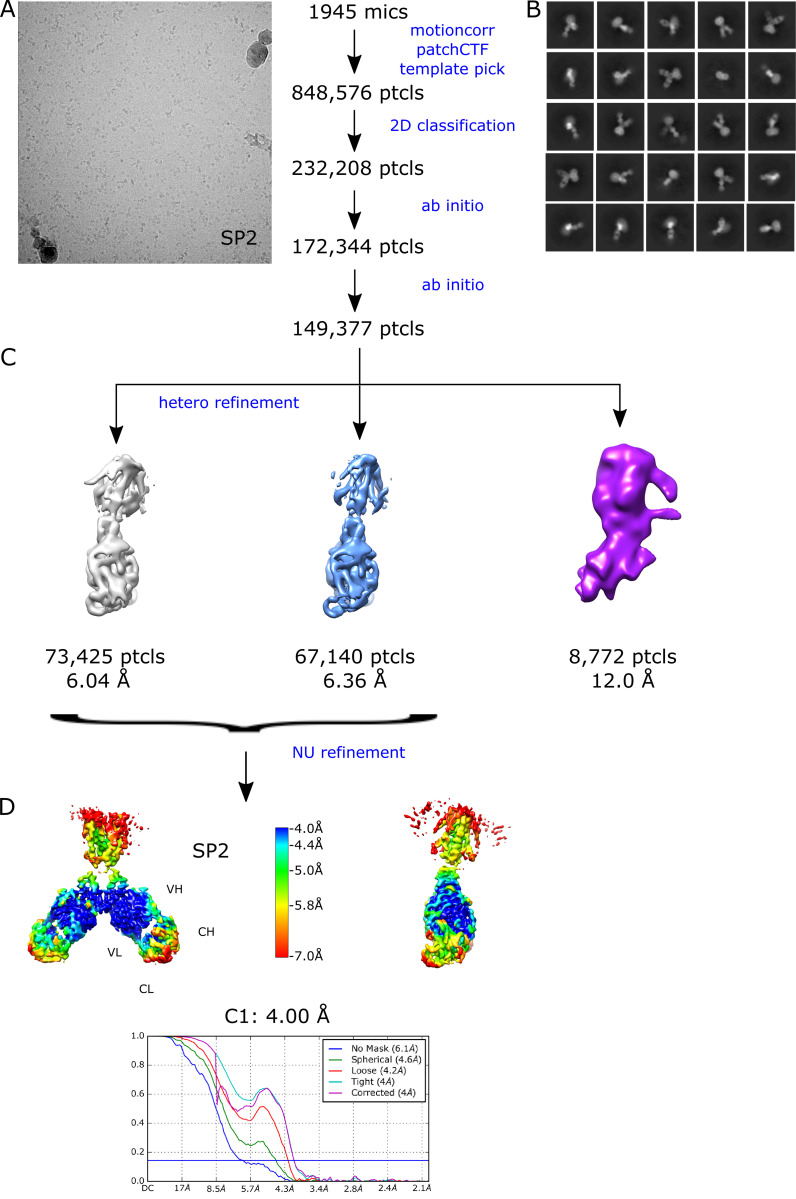
Steps in structure determination of the EDTA-treated YiiP/Fab complex from the SP2 dataset.(A) Representative micrograph. (B) Selection of 2-D class averages showing multiple views of the complex. (C) Heterogeneous refinement job in cryoSPARC was used to look for multiple conformations and to select a homogeneous subset of particles for high-resolution refinement. (D) Nonuniform refinement job in cryoSPARC colored according to local resolution, which ranged from 4.0 to 7.0 Å for the best class. Fourier shell correlation (FSC) plot indicates an overall resolution of 4.0 Å, which was determined without imposition of symmetry. VL, variable light chain.
Figure S7.
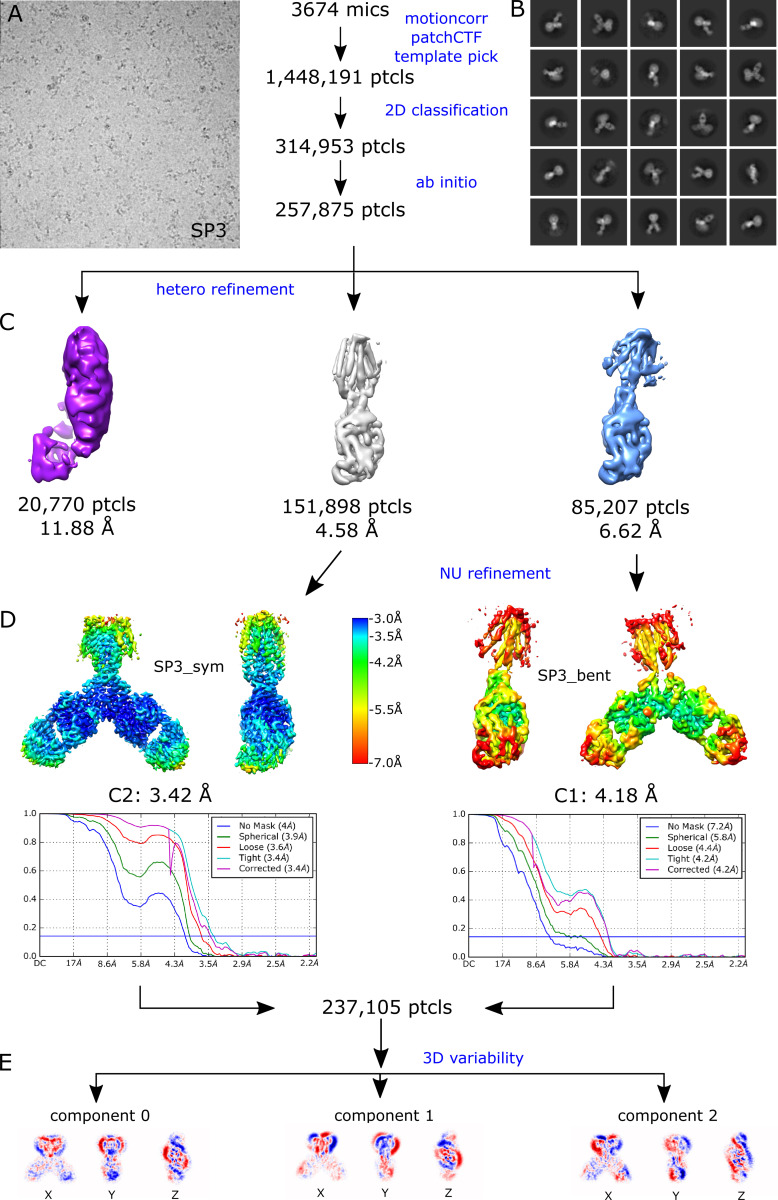
Steps in structure determination of the EDTA-treated YiiP/Fab complex from the SP3 dataset.(A) Representative micrograph. (B) Selection of 2-D class averages showing multiple views of the complex. (C) Heterogeneous refinement job in cryoSPARC revealed the presence of two distinct conformations, which were individually used for high-resolution refinement. (D) Nonuniform refinement jobs for each class in cryoSPARC colored according to local resolution, which ranged from 3.0 to 7.0 Å. Fourier shell correlation (FSC) plots indicate an overall resolution of 3.4 and 4.2 Å for the symmetric conformation and the bent conformation, respectively. (E) Three principle components derived from 3-D variability analysis of the combined particles from both classes.
Figure S8.
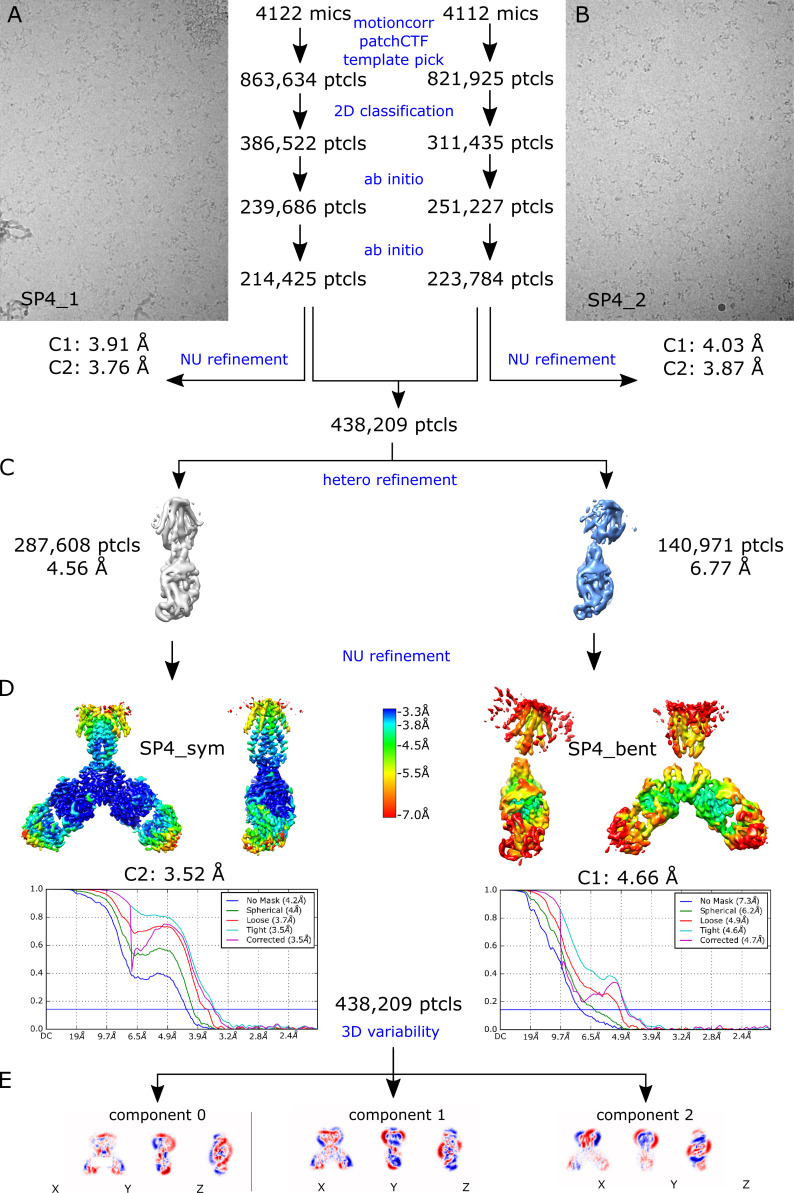
Steps in structure determination of the YiiP/Fab complex treated with both EDTA and TPEN from the SP4 dataset. (A and B) Representative micrographs from two different imaging sessions. (C) Heterogeneous refinement job in cryoSPARC revealed the presence of two distinct conformations, which were individually used for high-resolution refinement. (D) Nonuniform refinement job in cryoSPARC colored according to local resolution, which ranged from 3.3 to 7.0 Å. Fourier shell correlation (FSC) plots indicate an overall resolution of 3.5 and 4.7 Å for the symmetric conformation and the bent conformation, respectively. (E) Three principal components derived from 3-D variability analysis of the combined particles from both classes.
Figure S9.
RMSD plots for the remaining two MD simulations (md0 and md2) of the apo state. The three traces correspond to the different alignment schemes relative to the starting model (5VRF) as described in Fig. 4.
Figure S10.
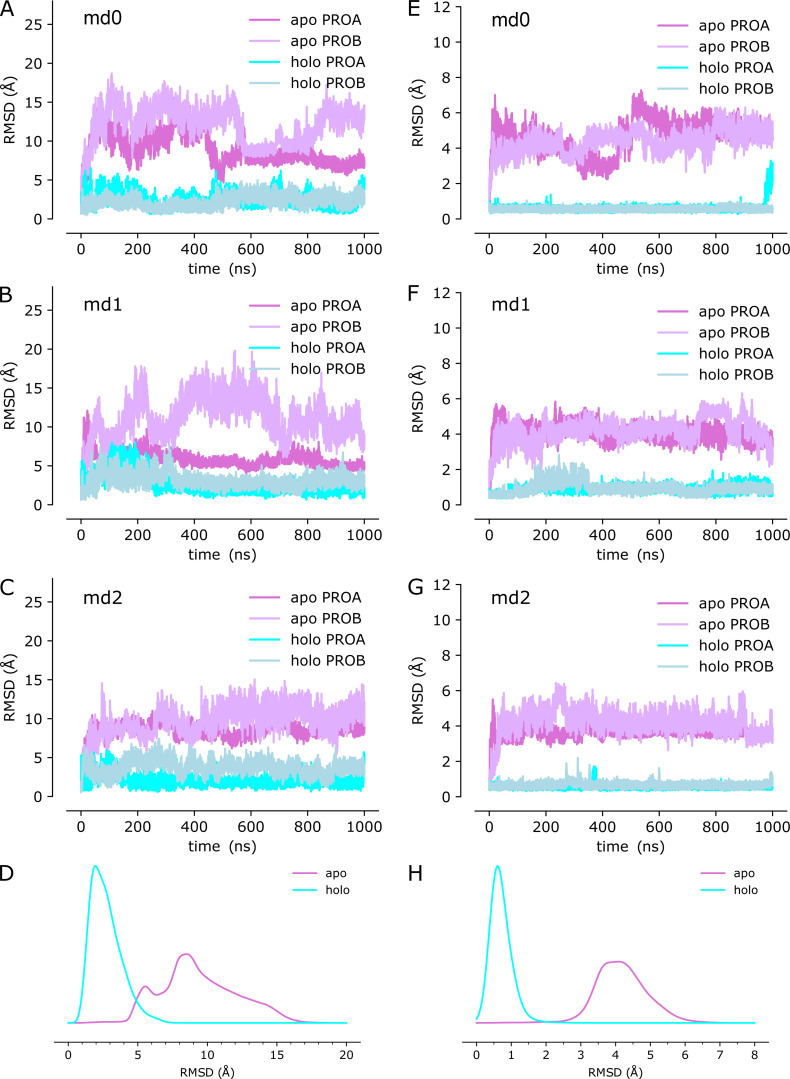
Quantitation of M2/M3 loop movements during the MD simulations showing greatly enhanced dynamics in the apo state. (A–C) Cα RMSD for each protomer from the individual simulations (md0-md2) after alignment of the TMD relative to the starting structure (PDB accession no. 5VRF). (D) Cα RMSD distributions for loop motion relative to the TMD, representing all the simulations as calculated by KDE. (E–G) Cα RMSD for each protomer after alignment of the loop relative to the starting structure. (H) Cα RMSD distributions for the intrinsic loop motion, representing all the simulations in the apo and holo states (repeated from Fig. 5 B to aid comparison).
Figure S11.
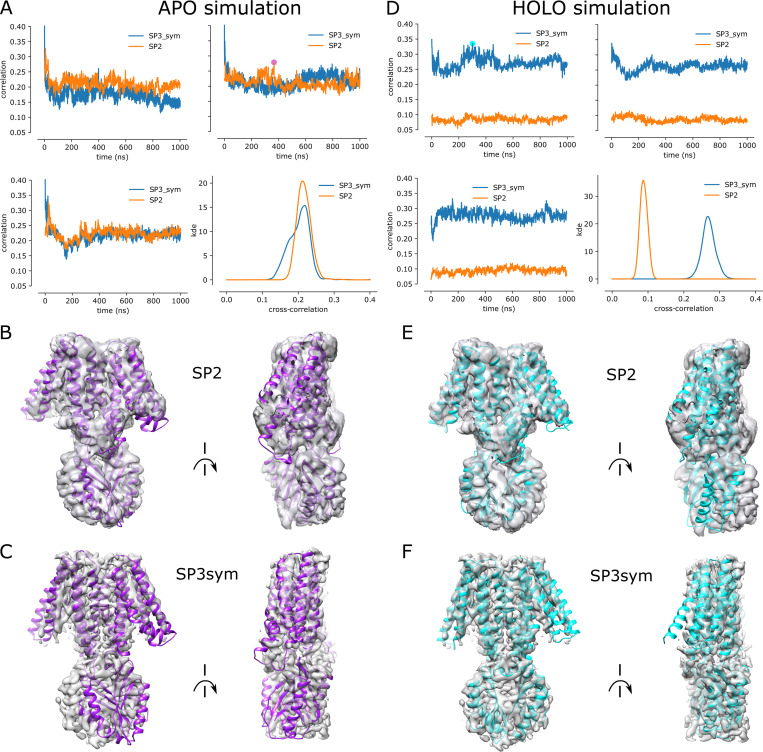
Quantitative comparison of cryo-EM density maps and conformations from the MD simulation.(A) Time series of the cross-correlation (CC) between protein conformations in the apo simulations md0–md2 and the experimental density maps SP3sym (corresponding to the fully Zn-bound structure, blue line) and SP2 (apo structure, orange line), together with the distribution of the CC, drawn as KDEs. (B) Comparison of best-fit conformation from the apo MD simulations (ignoring the initial 100 ns during which the system relaxes) to the SP2 density at a contour level of 0.32 (6 σ): snapshot from apo md1 at 369 ns with CC = 0.28, shown as a magenta dot in A. Two views are shown at 90° orientations. (C) Comparison of the same apo MD snapshot to the SP3sym density at a contour level of 0.6 (6 σ). (D) CC time series of the holo simulations md0-md2 to SP3sym (blue) and SP2 (orange) density maps. (E) Comparison of best-fit conformation from the holo MD simulations (ignoring the initial 100 ns during which the system relaxes) to the SP2 density: snapshot from holo md0 at 301 ns with CC = 0.34, shown as a cyan dot in D. (F) Comparison of the same holo MD snapshot to the SP3sym density.
Figure S12.
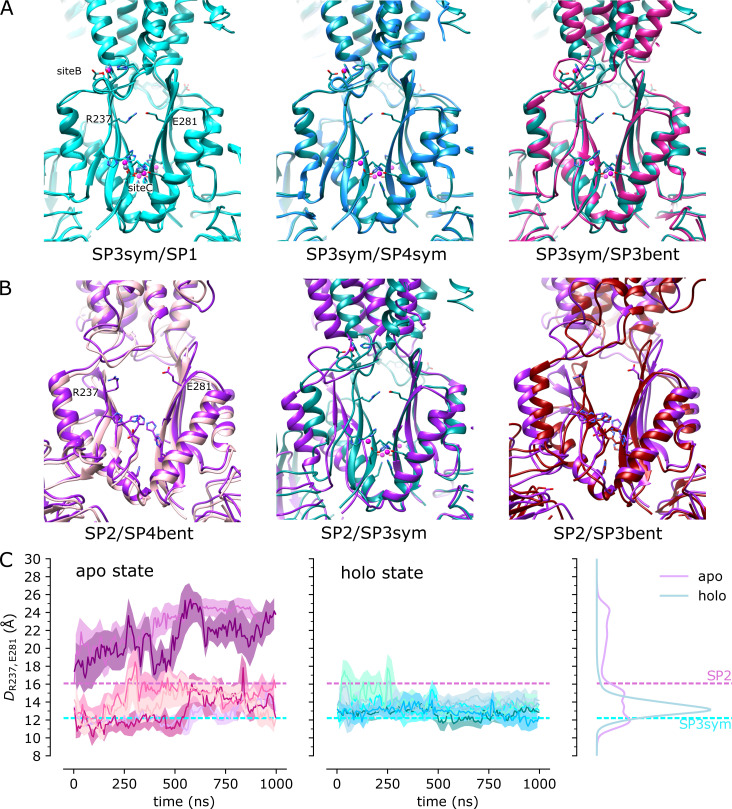
Dynamics of the CTD are influenced by Zn binding.(A) Overlay of CTDs from the indicated cryo-EM structures showing close overlap of secondary structural elements from the symmetric, holo structures: SP1, SP3sym, and SP4sym. The CTD from SP3bent also matches the configuration from the holo state, which correlates with the presence of density at Zn site C (c.f., Fig. 7 G). (B) CTDs from SP2 and SP4bent (apo) are farther apart (14.5–16 Å between Cα atoms of Arg237 and Glu281) than those from SP3sym (12.2 Å) and SP3bent (11.1 Å), suggesting that Zn binding at site C has a stabilizing influence on this domain. (C) The distance between Cα atoms from Arg237 and Glu281 was used as a collective variable to monitor CTD dynamics during the MD simulations. Data from all three simulations are plotted for apo and holo states with distributions from KDE calculations shown on the right. Time series were averaged over 20-ns intervals, with the solid line showing the average and the error bands contain 95% of the data. These data indicate that there are larger fluctuations in the CTD for the apo state.
Figure S13.
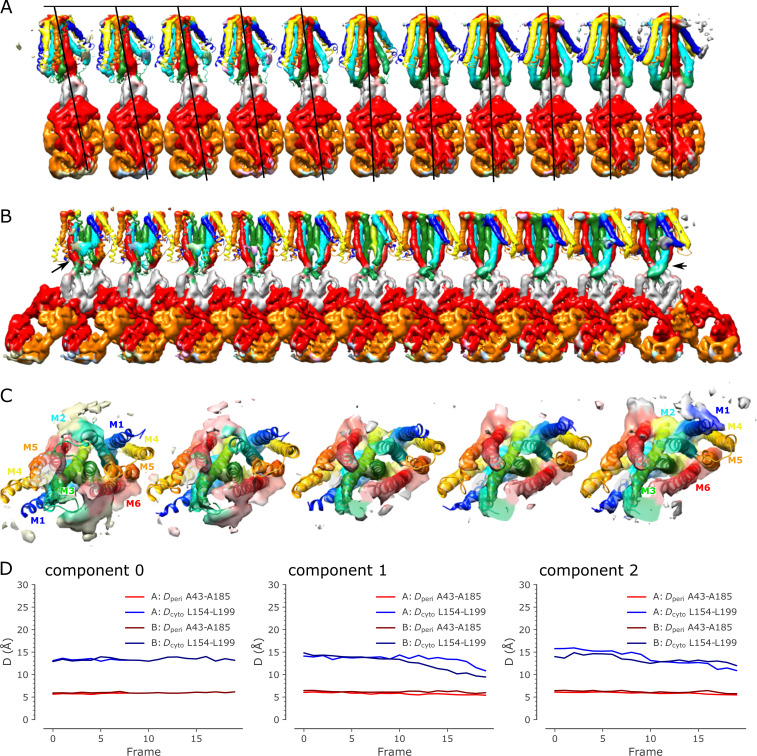
Display of 3-D variability in the SP4 dataset.(A) Side view of 11 (from a total of 20) structures generated from one of the principal components from the 3-D variability analysis. This series captures the conformational transition from the C2 symmetric conformation to the asymmetric conformation with a bent TMD. CTDs from each structure have been aligned. Helices in the TMD are rainbow colored from blue to red, the CTD is gray, and the Fab chains are orange and red. (B) Front view of the same 11 structures showing the bending of the M2 helix (cyan indicated by arrow) during the conformational transition. (C) View from the cytoplasm toward Zn site A for a subset of five structures from the 3-D variability analysis illustrating the bending of M2 (cyan) and M5 (orange) during the conformational transition. (D) Plots of distances between Cα atoms from Leu154 and Leu199 on the cytoplasmic side of the TMD and between Ala43 and Ala185 on the periplasmic side for each of the components derived from 3-D variability analysis of the SP4 dataset. These plots are analogous to those in Fig. 8. Evidence of TM gate closure can be seen in components 1 and 2.
Results
Zn2+ is required for formation of tubular crystals
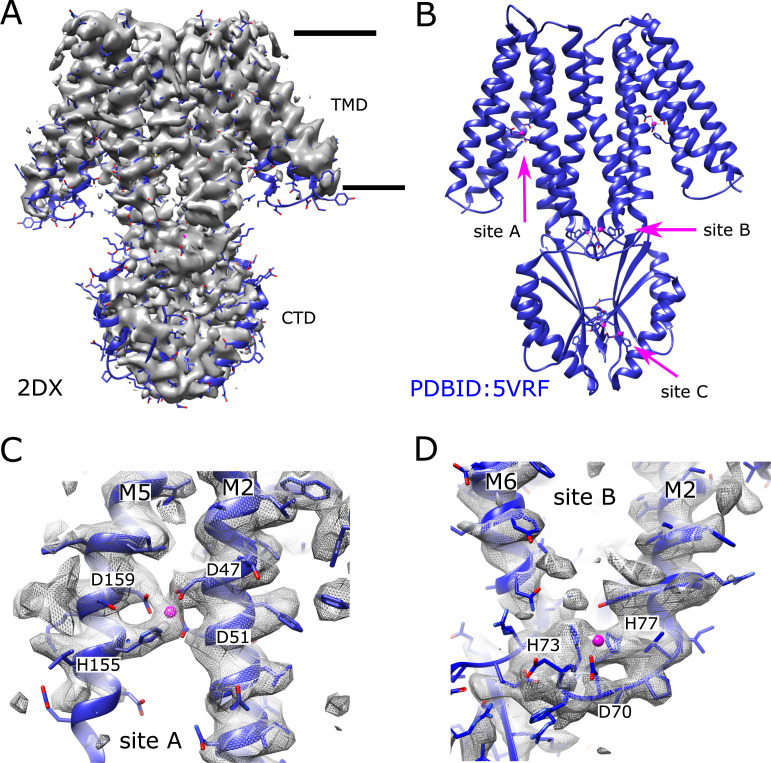
In previous work, we employed an automated screening pipeline to produce tubular crystals of YiiP within reconstituted bilayers (Kim et al., 2010). Cryo-EM and helical reconstruction were then used to generate structures of the twofold symmetric homodimer in a membrane environment (Coudray et al., 2013; Lopez-Redondo et al., 2018). Although Zn2+ was not added during purification or crystallization, a high resolution structure revealed strong densities at each of the four metal ion binding sites (Lopez-Redondo et al., 2018), suggesting that metal ions either copurified with the protein or were scavenged from buffers used for purification and crystallization. As a first attempt to evaluate the structural effects of removing metal ions, we treated samples with 5 mM EDTA for 10 min before reconstitution and crystallization (Table 1). After EDTA treatment, tubular crystals readily formed under standard conditions, which involved two weeks of dialysis in buffers lacking both Zn2+ and EDTA (Fig. S1). After imaging these samples by cryo-EM, 2-D classification revealed two prevalent helical morphologies characterized by D1 and D3 symmetries, as has been previously described (Lopez-Redondo et al., 2018). The global resolution of these structures (referred to as 2DX) was 4.2 Å resolution though, as previously observed, the resolution in the TMD was considerably better than the CTD. Docking our previous model from tubular crystals (PDB accession no. 5VRF) to these new density maps illustrated that the conformation was unaffected by the EDTA treatment (Fig. 1). Furthermore, strong density is visible at Zn sites A and B, suggesting that metal ions remained at these sites; the lower resolution of the CTD made site C difficult to evaluate. This observation suggests either that the off rate for metal ions is extremely low or that the affinity is high enough to scavenge trace metal ions from the dialysis buffers used to produce the tubular crystals. The addition of 0.5 mM EDTA to the dialysis buffer prevented crystal formation, suggesting that effective removal of Zn2+ may produce a conformational change.
Figure 1.
Cryo-EM structure (2DX) of EDTA-treated YiiP from tubular crystals.(A) Density map at 4.2-Å resolution of an isolated YiiP dimer masked from 3-D reconstruction of tubular crystals from EDTA-treated WT YiiP. The previous structure from untreated tubular crystals (PDB accession no. 5VRF) is docked as a rigid body, illustrating the similarity in the conformation. Horizontal lines indicate the membrane boundary. (B) The previous structure (5VRF) derived from tubular crystals showing the overall architecture of the dimer and the location of the three Zn binding sites. Zn ions are shown as pink spheres. (C) Detailed view of Zn binding site A at which the map from EDTA-treated YiiP reveals strong density, indicating that a metal ion is bound at this site. (D) Detailed view of Zn binding site B showing an ordered loop between M2 and M3 and density associated with the metal ion and coordinating residues. Side chains do not perfectly match the density, because 5VRF was only fitted as a rigid body and was not explicitly refined to this map.
Development of an antibody fragment for cryo-EM analysis
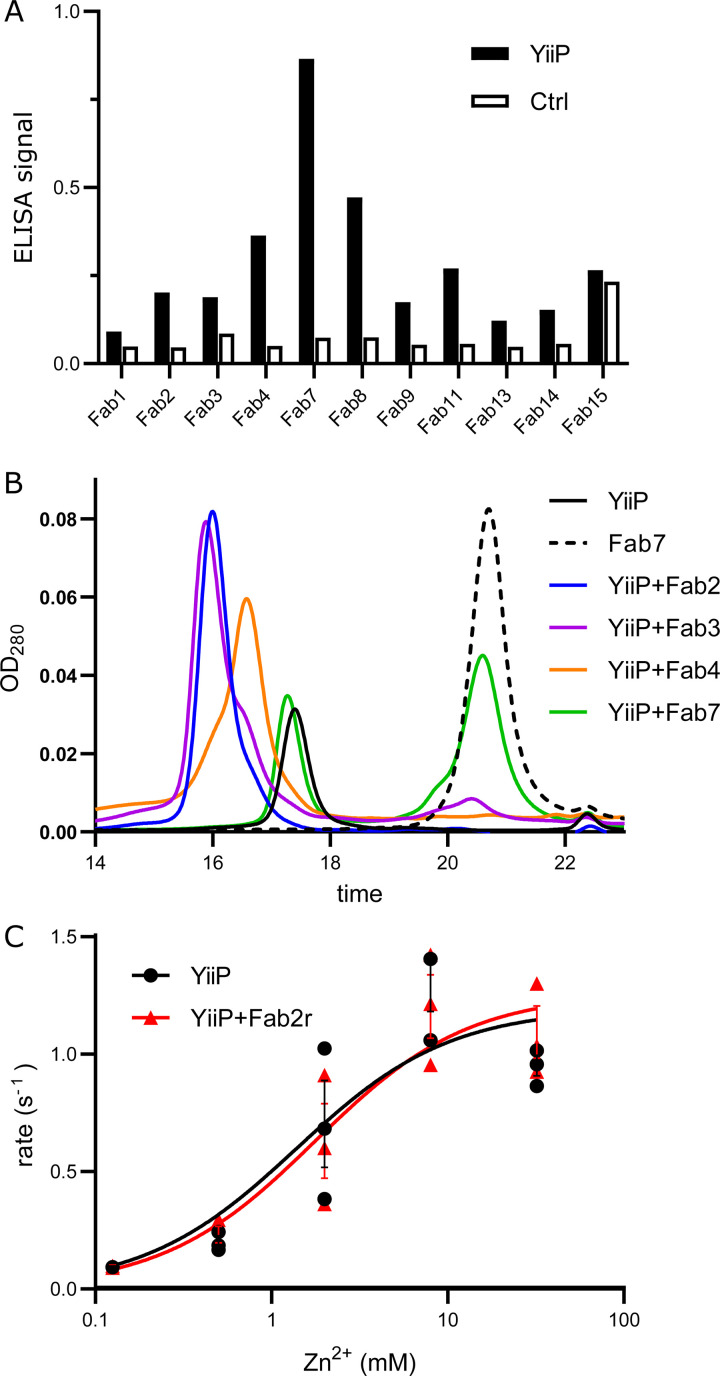
Single-particle cryo-EM is an alternative approach for structure determination, in which buffer conditions can be manipulated without the physical or chemical constraints of crystallization; however, the small size of the YiiP dimer (65 kD) represents a challenge that we overcame by making a complex with Fab molecules. To identify high-affinity Fab clones, we screened a phage-display library containing ∼1011 unique Fab fragments (Miller et al., 2012; Sauer et al., 2020) using YiiP reconstituted into biotinylated nanodiscs (Dominik and Kossiakoff, 2015). The various candidate Fabs were initially evaluated by ELISA (Fig. 2 A) and those demonstrating specific binding were sequenced and cloned into a vector for expression in E. coli. In this way, we identified four Fab clones that were purified in large quantities suitable for biophysical evaluation. Specifically, formation of a stable complex was examined using SEC, where a shift in the elution volume indicated the presence of a stable complex (Fig. 2 B). Fab2 and Fab3 showed single, uniform SEC peaks consistent with a 2:2 complex (Fab:YiiP). Fab7 produced two discrete peaks superimposed with isolated YiiP and isolated Fab, indicating a lack of complex formation. Fab4 produced an asymmetric peak, suggesting a heterogeneous preparation composed of 2:2 and 1:2 complexes (Fab:YiiP). We selected Fab2 for our cryo-EM work. Although initial complexes were formed using the 4D5 Fab framework employed for the phage-display library (Miller et al., 2012), we later introduced mutations into the hinge between variable and constant domains in the heavy chain (VH and CH, respectively) in an attempt to increase rigidity and thus the resolution of cryo-EM structures (Bailey et al., 2018). In particular, we substituted the SSAST sequence in the heavy chain with FNQI to generate a construct denoted Fab2r. SEC profiles and cryo-EM analysis discussed below indicated that this substitution had no negative effect on complex formation with YiiP.
Figure 2.
Development of antibody fragments that recognize YiiP.(A) Screening was based on phage display of a large library of Fab constructs against YiiP reconstituted in nanodiscs. Results from ELISA assay for several candidates show preferential binding to YiiP embedded in nanodiscs compared with empty nanodiscs, labeled as control. Data represent a single replicate, as is typical for a screen. (B) Formation of a stable complex between detergent-solubilized YiiP and purified Fab candidates was evaluated by SEC. A distinct shift in elution time and a symmetric peak for Fab2 (blue) and Fab3 (purple) is consistent with a stoichiometric complex with YiiP. In contrast, Fab7 (green) produced distinct peaks corresponding to dimeric YiiP and to free Fab, indicating that it did not produce a complex at all. Fab4 (orange) produced smaller shift with an asymmetric peak, probably indicating a nonstoichiometric complex with the YiiP dimer. Profiles for uncomplexed, dimeric YiiP (black), and free Fab (dotted black) are provided for comparison. (C) Transport assays in the presence and absence of Fab2r revealed that complex formation does not affect transport activity of WT YiiP. Fitting of the data (recorded from a single biological preparation in triplicate) with the Michaelis-Menton equation yielded KM = 1.4 (95% confidence limits, 0.58–3.08) and 1.8 mM (95% confidence limits, 0.83–3.58), Vmax = 1.2 (95% confidence limits, 0.95–1.47) and 1.3 (95% confidence limits, 1.04–1.52) s−1 for YiiP and the YiiP/Fab2R complex, respectively. Error bars correspond to SEM. These differences were well within the 95% confidence interval and therefore not statistically significant.
Prior to structural studies, a transport assay was used to ensure that Fab binding did not interfere with the functionality of YiiP and, hence, its ability to undergo conformational changes associated with transport. For this assay, the complex was formed by incubation at a 2:1 molar excess (Fab2:YiiP) followed by reconstitution into proteoliposomes using established procedures (Lopez-Redondo et al., 2018). The results (Fig. 2 C) show that the Fab had no apparent effect on either KM or Vmax, suggesting that Fab binding did not interfere with conformational changes associated with the transport process.
Development of a Zn model for MD simulation
To complement cryo-EM studies, we used MD simulation to assess the effect of Zn2+ on the structural dynamics of YiiP. To start, we developed a representation of metal ions that freely exchange between binding sites and the aqueous solvent, which has proved challenging for classical force fields (Li and Merz, 2017). Similar to previous work (Duarte et al., 2014), we parametrized a nonbonded dummy atom model for the CHARMM force field consisting of a central Zn atom surrounded by an octahedral configuration of six dummy atoms (Fig. S2 A). A genetic algorithm (Eiben et al., 1994) was used to adjust the van der Waals parameters of the atoms to reproduce a hydration energy of Zn2+ ions in water of −1,955 kJ/mol (Marcus, 1991) and an ion-water oxygen distance of 2.08 Å (Marcus, 1988). After six cycles of optimization, the algorithm converged to within 1% and 0.3% of the target values, respectively (Fig. S2 B) and produced the experimentally observed coordination of six oxygen atoms in water (Marcus, 1988; Fig. S2 C). The model was then validated by performing 200-ns all-atom simulations in water (three repeats each) using the x-ray crystal structures for β-1,3-1,4-endoglucanase (PDB accession no. 1U0A), stromelysin-1 (PDB accession no. 2USN), and the δ' subunit of E. coli clamp-loader complex (PDB accession no. 1A5T). These structures were chosen for their high resolution—1.6, 2.2, and 2.2 Å, respectively—and for the diversity in their coordinating residues, namely HHDD, HHHD, and CCCC. His (H) and Asp (D) residues are most relevant given their presence in the binding sites of YiiP; the Cys (C) site was included for completeness. In all three cases, the Zn ion remained stably bound, despite movements of protein elements around the site. RDFs for the Zn ion bound by His and Asp residues showed that distances to coordinating oxygen or nitrogen atoms were only very slightly longer than in the x-ray structures (0.1 and 0.2 Å, respectively), indicating that the dummy model was highly suitable for these sites (Fig. S2, D–I). The excellent performance for oxygen is expected due to reliance on Zn-oxygen interactions for the parametrization process, and the very good performance for N is probably due to the overall good balance of the force field. On the other hand, Zn bound by Cys residues displayed somewhat larger distance disparities (0.25–0.3 Å; Fig. S2, J–L), indicating that further improvements for sulfur-based sites may be warranted, for example by including sulfur compounds in the parametrization process. Nevertheless, the exclusive presence of His and Asp residues in the Zn2+ binding sites of YiiP means that the current version of our CHARMM Zn nonbonded dummy model is well suited for our simulations.
Structure of the YiiP/Fab complex in the holo state
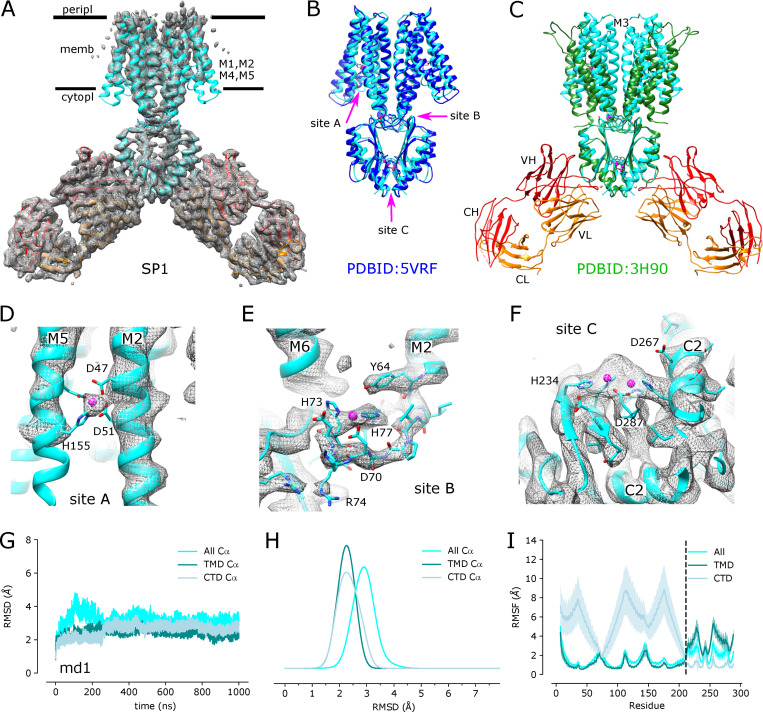
Single-particle cryo-EM was used to generate a structure of the YiiP/Fab2 complex at 3.8-Å resolution (Fig. S3). The resulting density map, denoted SP1, reveals a homodimer of YiiP with Fab molecules, composed of a heavy and a light chain, bound to each CTD (Fig. 3). Although initial steps of image processing were performed without symmetry, application of C2 symmetry during the final refinement improved the resolution from 4.0 to 3.8 Å, indicating that the twofold symmetry observed in both the x-ray structure and the cryo-EM structure from tubular crystals was preserved in these isolated particles. An initial atomic model was built using the structure of YiiP from tubular crystals (PDB accession no. 5VRF) and a homology model for the Fab, which was fitted to the experimental density by Namdinator (Kidmose et al., 2019) followed by several rounds of real-space refinement by PHENIX (Adams et al., 2010) and manual building with COOT (Emsley et al., 2010; Table 2). The resulting structure shows a long complementarity-determining region 3 (CDR3) of the Fab heavy chain making extensive contact with the C terminus of YiiP. CDR1 and CDR2 of the heavy chain and CDR3 from the light chain also interact with the first CTD helix of YiiP and with the succeeding loop (residues 219–231 of YiiP). All of these interactions are at the periphery of the CTD and do not appear to interfere with Zn2+ binding to site C, which is buried at the dimeric interface of the CTDs. The resolution is higher in this region of the map (3.5 Å), suggesting that interactions between Fabs and CTDs have a stabilizing influence (Fig. S3 D). Unsurprisingly, the distal, constant domains of the Fabs (CH and CL) have lower resolution (4.5 Å), reflecting flexibility in the hinges between the variable and constant domains. Within the TMD of YiiP, the dimer interface mediated by M3 and M6 is reasonably well ordered (3.9 Å), but the bundle of peripheral helices (M1, M2, M4, and M5) is more flexible, making side chains difficult to identify in this region. Accordingly, the distribution of resolution from single particles differs markedly from tubular crystals (Fig. S1 D), which is likely influenced by crystal packing interactions and physical constraints of the membrane environment.
Figure 3.
Cryo-EM structure of the untreated YiiP/Fab complex (SP1).(A) Density map at 3.8 Å overlaid with a refined atomic model with YiiP (cyan) and Fab molecules (orange and red for the light chain and heavy chain, respectively). (B) Superposition of the refined atomic model from SP1 (cyan) with the previous atomic model for YiiP (PDB accession no. 5VRF, dark blue) showing that both models represent the same inward-facing conformation (RMSD for Cα atoms is 1.5 Å; Table 3). Locations of the individual Zn sites (A, B, and C) are indicated by arrows. (C) Superposition of the SP1 model (cyan, orange, and red) with the x-ray model of YiiP from E. coli (PDB accession no. 3H90, green). Substantial conformational differences in the TMD are evident and reflected in the high RMSD for Cα atoms of 10.3 Å (Table 3). (D–F) Close-up views of density at the individual Zn sites in the SP1 structure. Metal ions are displayed as pink spheres. (G) Cα RMSD plots for one of the three MD simulations (md1) of the holo state shows relatively little change in the dimer over the course of the simulation. The three traces correspond to the different alignment schemes relative to the starting model (5VRF): “All” indicates global alignment based on the entire molecule, “TMD” indicates alignment based on the TMD only, and “CTD” indicates alignment based on CTD only. Analogous plots for md0 and md2 simulations are shown in Fig. S5. (H) Distributions of RMSD derived from all three simulations using the alignment schemes indicated in the legend. These RMSD distributions, as well as those shown in other figures, were generated with a KDE. (I) RMSF plotted for each residue based on the different alignment schemes. RMSF profiles were averaged over both protomers and all three simulations, with the mean shown as the solid line and the error band indicating the SD over these six profiles. The dashed line represents the boundary between TMD and CTD.
Comparison of this detergent-solubilized SP1 complex with the membrane-bound structure from tubular crystals (2DX) indicates that the YiiP dimer adopts a comparable inward-facing conformation, despite the differing conditions. Rigid-body docking of the structure from tubular crystals (PDB accession no. 5VRF) matched the map densities very well with a cross-correlation of 0.82. Furthermore, comparison of 5VRF with the atomic model refined to the SP1 map generated a low RMSD for Cα atoms of 1.53 Å for the entire YiiP dimer (Table 3). When individual monomers were compared, the RMSD decreased slightly to 1.2 Å, indicating slight flexibility in the angle between the monomers. Conversely, this conformation differs substantially from x-ray structures of detergent-solubilized YiiP from E. coli (PDB accession no. 3H90), which show a scissor-like displacement of TMDs that disrupts the interaction between M3 helices (Fig. 3 C). Although the CTDs are virtually identical (RMSD = 0.97 Å), the TMDs are quite different (RMSD = 10.3 Å) due not only to the scissor-like displacement, but also to the rocking of the four-helix bundle (M1, M2, M4, and M5) to produce the outward-facing state, as has been previously described (Lopez-Redondo et al., 2018).
Table 3. RMSDs between atomic models.
| 3H90a | 5VRFa | SP1a | SP3syma | SP4syma | SP2b | SP3bentb | SP4bentb | |
|---|---|---|---|---|---|---|---|---|
| 3H90 | ||||||||
| 5VRF | 8.3 | |||||||
| SP1 | 10.3 | 1.5 | ||||||
| SP3sym | 8.7 | 1.6 | 1.2 | |||||
| SP4sym | 8.6 | 1.8 | 1.4 | 1.2 | ||||
| SP2 | 14.3 | 4.4 | 4.4 | 4.4 | 4.1 | |||
| SP3bent | 14.2 | 4.2 | 4.0 | 3.9 | 3.8 | 1.5 | ||
| SP4bent | 15.0 | 4.6 | 4.5 | 4.5 | 4.2 | 1.5 | 1.8 |
Values in the table correspond to RMSD for all Cα atoms in Å.
These structures all display C2 symmetry.
Although twofold symmetry is preserved in the CTD and TMD, the overall C2 symmetry of the complex is disrupted due to a ∼25° bend between the two domains. As a result, the structures were determined without imposing any symmetry (C1).
Like the structure from tubular crystals, the SP1 complex appears to have metal ions bound at each of the Zn2+ binding sites. Strong densities are visible at each of these sites, encompassing both the ion sites themselves and the coordinating residues (Fig. 3, D–F). Furthermore, the local resolution is enhanced at these sites relative to the neighboring regions of the protein (Fig. S3 D). This effect is particularly notable at site A within the TMD (Fig. 3 D), where flexibility of the peripheral membrane helices generally precluded side chain densities in this region. Thus, like the structure from tubular crystals, the SP1 complex appears to represent the Zn2+-bound holo state, despite the lack of exogenous Zn2+ in the buffers used for purification and sample preparation.
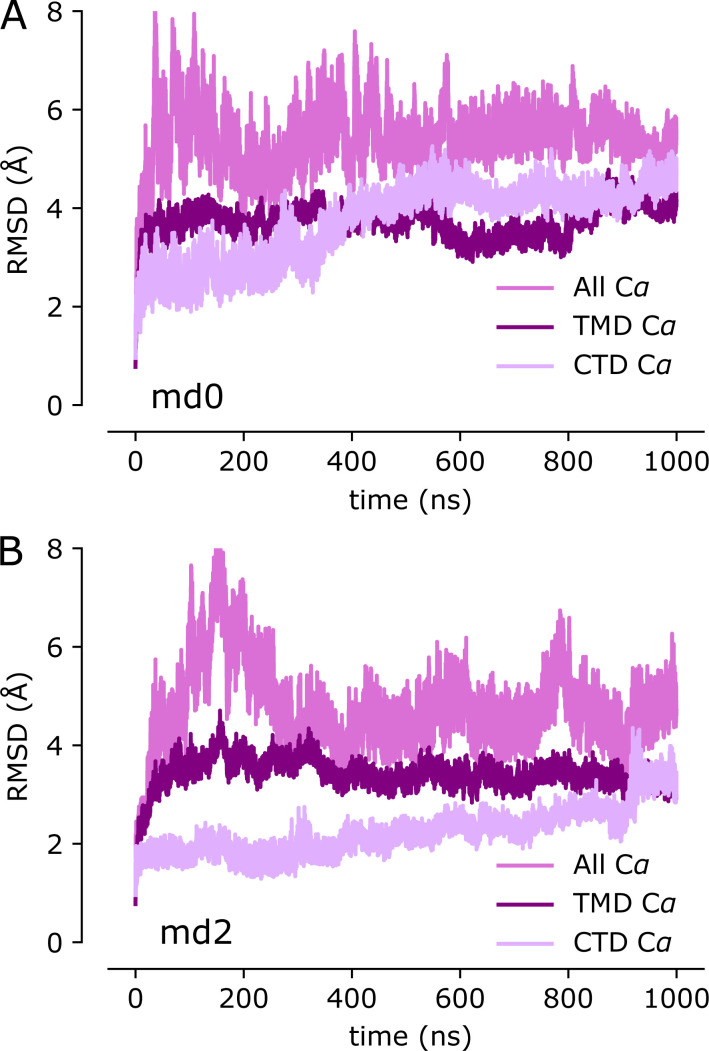
To complement this experimental approach, we used MD simulations to characterize the dynamics of YiiP in the holo state. We used 5VRF as the starting model with a Zn ion—parametrized with the nonbonded dummy model—placed at each of the eight sites in the homodimer and equilibrated this structure in a membrane composed of POPE and POPG lipids in a 4:1 ratio, approximating a typical E. coli plasma membrane (Raetz, 1986). Three independent simulations were run for 1 µs each, during which Zn2+ remained stably bound at all of the binding sites (Fig. S4). RMSDs for Cα atoms in the TMD, the CTD, and the whole dimer were calculated for all frames relative to the starting model. Data from all three simulations (md0–md2) were similar, with values ranging from 2 to 3.5 Å (Fig. 3 G and Fig. S5). As can be seen in the distribution of RMSDs (Fig. 3 H), the average displacements were consistently higher for the whole dimer relative to values for individual domains, which is indicative of inter-domain movements. Per-residue RMSFs were calculated after structurally superimposing frames on either the whole dimer, the TMD, or the CTD (Fig. 3 I) and provide more robust evidence of inter-domain movements. In particular, profiles generated after alignment of CTDs show two to four times higher RMSF values for the TMDs with peaks associated with M1-M2 and M4-M5 helix pairs. Despite these inter-domain movements, the dimer interface within each of these domains remains intact, as discussed below.
Structure of the YiiP/Fab complex in the apo state
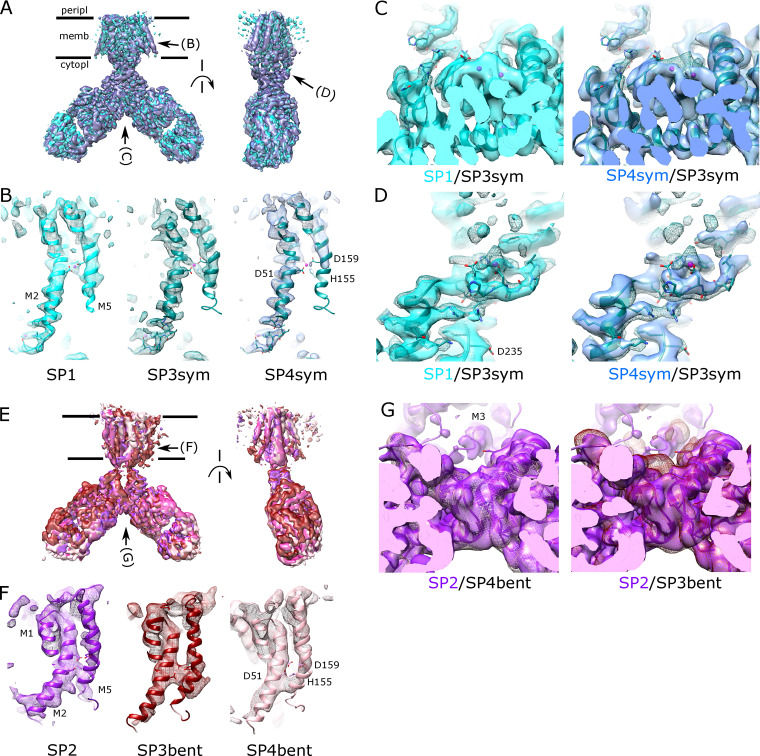
Given the high avidity of YiiP for Zn2+ and possibly other transition metal ions, we explored various protocols for generating the Zn2+-free apo state of the YiiP/Fab complex for cryo-EM. In particular, the complex was incubated in 0.5 mM EDTA or in combination 0.5 mM EDTA and 0.5 mM TPEN, which bind a wide range of divalent cations with high affinity and are thus expected to strip any such ions from binding sites of YiiP. For this complex, we used the rigidified Fab2r construct, and three independent datasets were collected from samples prepared under slightly different conditions, as summarized in Table 1. The most successful procedure involved incubating the complex overnight in 0.5 mM EDTA and then purifying it in this same EDTA-containing buffer. This sample, referred to as SP2, produced a reasonably homogeneous dataset and a refined structure at 4.0-Å resolution (Fig. S6 and Table 2). This density map revealed a distinct bend between the CTD and TMD, which disrupted the previously observed C2 symmetry. Two additional datasets, denoted SP3 and SP4, were collected after incubation with EDTA and/or TPEN in an attempt to improve the resolution of this structure; however, these datasets were markedly heterogeneous and each produced two distinct structures resembling the C2 symmetric SP1 structure and the asymmetric SP2 structure, respectively (Figs. S7 and S8). In this way, SP3 and SP4 datasets generated four additional structures: SP3sym, SP3bent, SP4sym, and SP4bent (Table 2). Due to an increased number of particles and perhaps because of the use of the rigidified Fab2r construct, the resolutions of symmetric structures were improved (3.4 Å and 3.5 Å for SP3sym and SP4sym, respectively). In contrast, resolutions of the asymmetric structures were not improved relative to SP2 (4.2 Å and 4.7 Å for SP3bent and SP4bent, respectively). Atomic models were generated for all of these density maps, and pairwise comparisons indicated that there was a high degree of consistency between the C2 symmetric and asymmetric structures, respectively (RMSDs of 1–1.5 Å; Table 3).
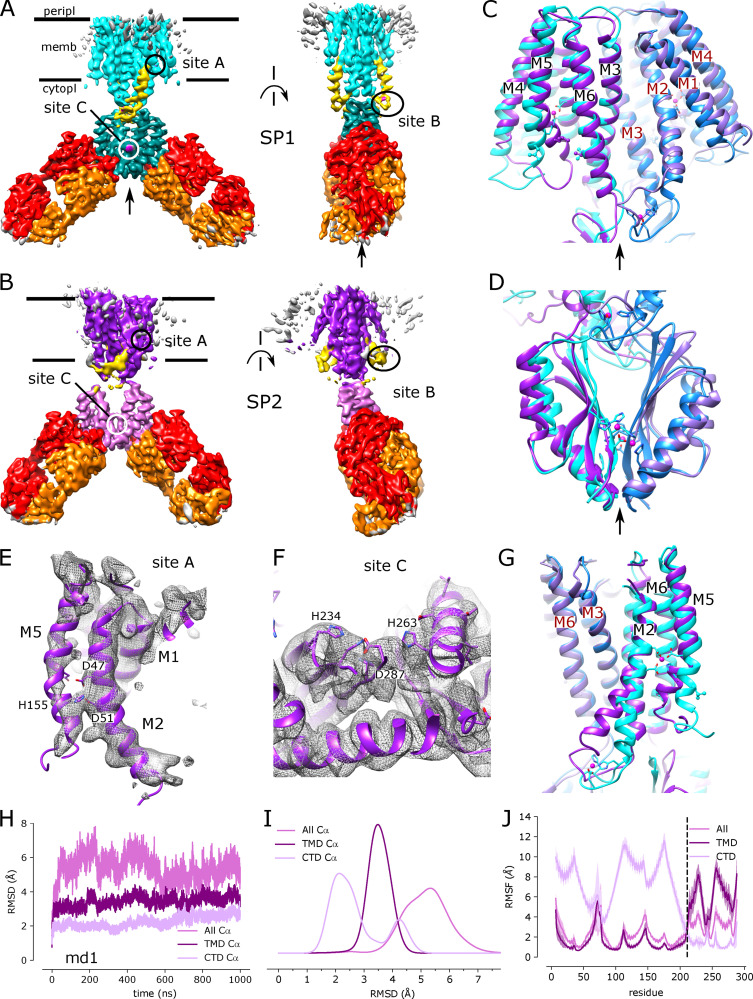
Juxtaposition of the two conformations reveals a ∼25° bend between the CTD of YiiP and the membrane domain (Fig. 4 A versus Fig. 4 B). This bend is responsible for disrupting the C2 symmetry that characterized the holo state, even though the dimeric interfaces in the CTD and TMD remain intact and local twofold symmetry within these domains is preserved (Fig. 4, C and D). Indeed, the overall architecture of the TMD is well preserved, especially at the dimer interface where M3 and M6 can be superimposed with an RMSD of 0.7 Å for Cα. Similarly, the CTD is relatively unchanged (RMSD = 1.99 Å) and recognition by the Fabs was not affected by chelation of metal ions. As before, the vicinity of the CTD/Fab interface generated the highest resolution in the map with side chains clearly visible in both molecules. Despite the use of the rigidified Fab2r molecule, the local resolution of the distal, constant domains (CH and CL) remained significantly lower than that of the proximal domains (VH and variable light chain; Figs. S6, S7, and S8 D), suggesting that the mutation did not completely eliminate flexibility of the hinge. The resolution in the TMD was also significantly lower than that of the holo structure, indicating increased flexibility and ultimately representing the limiting factor in our cryo-EM analysis.
Figure 4.
Cryo-EM structure of EDTA-treated YiiP/Fab complex (SP2) and comparison with the untreated complex (SP1).(A) SP1 structure of untreated complex showing C2 symmetry (rotation axis indicated by arrow) with colors highlighting the following features: light cyan for the TMD, dark cyan for the CTD, yellow for the TM2/TM3 loop, orange for the Fab light chain, and red for the Fab heavy chain. The location of Zn sites A, B, and C are indicated by circles. (B) Comparable views of the SP2 structure for the EDTA-treated complex with the following colors: dark purple for the TMD, light purple for the CTD, and yellow for the TM2/TM3 loop. The twofold symmetry is disrupted by the bend between the CTD and TMD. (C) Alignment of TMDs for the two structures (cyan for SP1 and purple for SP2) shows preservation of the overall architecture of this domain including the dimer interface and twofold symmetry (arrow). Individual protomers are shown in different shades. (D) Alignment of the CTDs for the two structures shows preservation of the dimer interface and twofold symmetry (arrow), with a modest increase in separation in the apo state. (E) Close-up of Zn site A in the TMD from the SP2 structure showing a lack of density at the ion binding site and a bend in the M2 helix near Asp51. (F) Close-up view of Zn site C in the CTD with lack of density indicating an absence of ions at this site. (G) Comparison of M2 and M5 in apo and holo states shows bends originating at Zn site A. (H) Cα RMSD plots for one of the three MD simulations (md1) of the apo state (traces for md0 and md2 are shown in Fig. S9). The three traces correspond to the different alignment schemes as indicated in the legend and described in Fig. 3. (I) Distributions of RMSDs derived from all three simulations using the three alignment schemes. (J) RMSF profiles averaged over both protomers from all three simulations based on the different alignment schemes. Error bands indicate the SD over these six profiles. The dashed line represents the boundary between TMD and CTD.
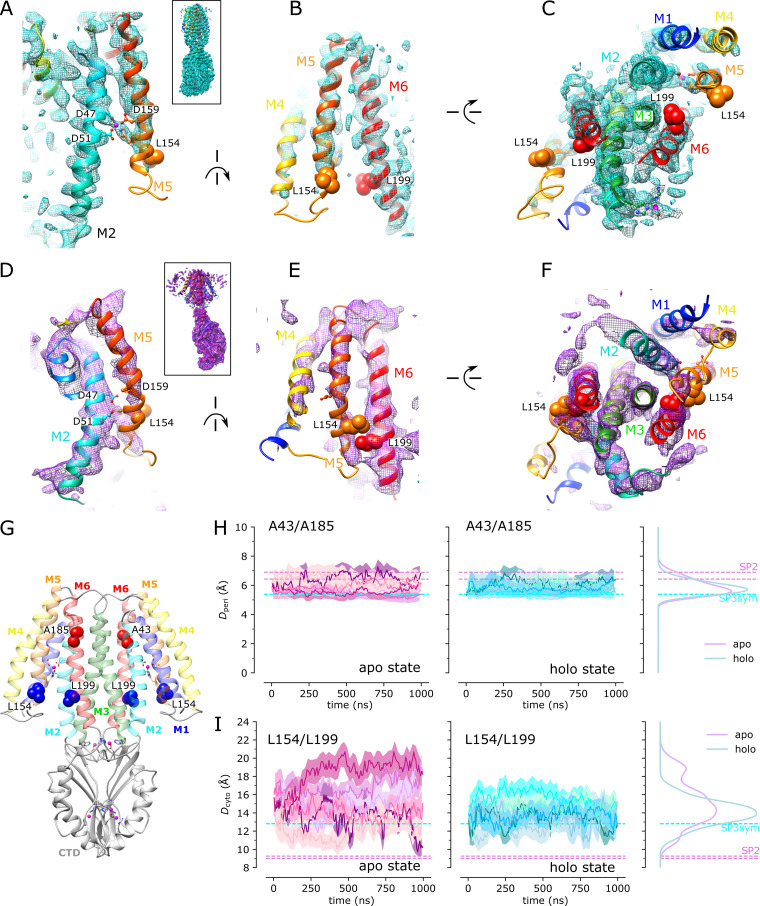
Despite the lower resolution, the transmembrane helices are clearly visible in the map and the overall architecture of the TMD is consistent with the inward-facing conformation seen in 2DX and SP1 structures; however, there is a substantial change in the M2 helix, which undergoes a distinct bend toward its cytoplasmic end (Fig. 4, E and G). This change is accompanied by a complete disordering of the M2/M3 loop, which normally carries a Zn2+ binding site (site B). In addition, the cytoplasmic end of M5 is bent such that it interacts with M6 (Fig. 4 G). The bends in M2 and M5 both originate near residues that form Zn site A: Asp51 and His155. No densities are observed at Zn2+ binding sites within the membrane (site A) or in the CTD (site C; Fig. 4, E and F), indicating that EDTA treatment was indeed effective in stripping metal ions from these sites. The lack of density for the M2/M3 loop made it impossible to evaluate whether Zn2+ was bound at site B, but the disordering of coordinating residues within this loop is a very plausible result of removing the metal ions from this site. Thus, we believe that this structure represents the apo state of the YiiP.
MD simulations were used to evaluate the dynamics of the apo state. Similar to the holo state, we used 5VRF as a starting model for three independent microsecond-long simulations, in which Zn ions were removed from all of the binding sites. As with the holo structure, RMSDs and RMSFs were lower for individual domains relative to the whole dimer (Fig. 4, H–J; and Fig. S9). The RMSD values were approximately twofold higher for the apo state compared with the holo state, with the exception of CTD, which displayed a lesser increase. To compare holo and apo simulations more directly, we plotted RMSF values for aligned TMDs and aligned CTDs for each monomer (Fig. 5 A). As might be expected, these plots show distinct peaks for loops connecting secondary structure elements in both TMD and CTD. It is notable that the M2/M3 loop undergoes a dramatic increase in flexibility in the apo state, which correlates with the disordering of this loop in the cryo-EM structures. Increased flexibility in the apo simulations is also evident from the increased RMSD for Cα atoms in the loop, from <1 Å for the holo state to ∼4 Å in the absence of a stabilizing ion (Fig. 5 B and Fig. S10). The differing mobility is depicted in Fig. 5, C and D, which shows the range of conformations sampled by the M2/M3 loop in the two simulations. We also quantified stability of the dimer interface and angles between TMD and CTD during the simulations (Fig. 6). Like the cryo-EM structures, dimeric interfaces in the simulations remained largely intact, especially in the TMD where the fraction of residues maintaining native contacts is close to 1 (Fig. 6 A). Contacts within the CTD are somewhat less stable and deteriorate in the apo state, although the overall architecture of the dimer remains intact (Fig. 6, B and D). The hinge between the TMD and CTD, which governs the overall C2 symmetry of the dimer, displays enhanced flexibility in the apo state with a mean angle of ∼30° compared with ∼15° for the holo state (Fig. 6 E).
Figure 5.
MD simulations show greater flexibility of the M2/M3 loop in the apo state. (A) RMSFs calculated for each YiiP monomer for all of the MD simulations in apo state (purple) and the holo state (cyan). RMSFs for residues in the TMD or CTD, indicated by the dashed line, were calculated after superposition on the corresponding domain. RMSF profiles were averaged over the two protomers and over the three independent simulations, with the error bands indicating the SD for these six profiles. (B) Cα RMSD distributions (KDE) for the M2/M3 loop residues after superposition on the loop from the starting model (PDB accession no. 5VRF). (C) M2/M3 loop (gold) conformations for the apo simulation md1, protomer B. The image depicts 1,000 frames from the trajectory taken at 1-ns intervals with individual frames superimposed on the Cα atoms of the TMD. The Zn-free 5VRF structure is shown in purple. (D) M2/M3 loop (gold) conformations for the holo simulation md1, protomer B (as in C); 5VRF starting conformation shown in cyan with Zn ions in magenta.
Figure 6.
Stability of the dimer interface in MD simulations.(A) Dimeric interactions in the TMD quantified as the fraction of native contacts (from PDB accession no. 5VRF) retained over the course of the simulations for apo (purple) and holo (cyan) states. Time series for all three repeats were averaged over 20-ns intervals (solid line) with 95% confidence intervals shown as transparent bands. Distributions (KDEs) from all data are shown on the right. (B) Snapshots from a holo MD simulation (md1) at the indicated times showing the TMD native contact residues (K79, L83, L86, A87, A90, F91, M93, G94, S95, F97, L98, L99, Y102, E105, L207, and L208) and CTD native contact residues (R237, G255, L257, S258, L259, N260, H263, E281, I283, I284, H285, Q286, D287, and P288) in cyan. Magenta spheres represent Zn ions. The membrane, water, and other ions are omitted for clarity. (C) Dimeric interactions in the CTD as in A. (D) Snapshots from an apo simulation (md1) at the indicated times showing that dimeric interactions remain intact despite large interdomain movements. (E) Change in the angle between TMD and CTD from MD simulations. The angle corresponds to that required for optimal superimposition of the Cα atoms from the CTD to the reference structure (5VRF) at each time point in the MD trajectory. This angle was determined after aligning the TMD with the starting structure.
In addition, we performed a direct comparison between conformations sampled during the simulation and the experimental structure obtained by cryo-EM (Fig. S11). We used Gaussian mixture models as described by Bonomi et al. (2018, 2019) to produce cross-correlation coefficients for individual frames from the apo and holo simulations relative to the SP2 and SP3sym density maps. For the holo simulation, much higher correlations were obtained for the SP3sym map relative to the SP2 map; however, for the apo simulation, correlations were low without any distinction between the two maps. This result indicates that, even with the distinct dynamic properties seen in the apo simulation, the 1-µs time scale of the simulation was not sufficient to sample the stable conformation seen by cryo-EM.
Structural heterogeneity induced by metal ion chelation
Comparison of the various density maps for the C2 symmetric and asymmetric, bent conformations revealed subtle differences at the ion binding sites (Fig. 7). For the C2 symmetric maps, SP1 and SP3sym maps have clear densities at all three Zn2+ binding sites, whereas SP4sym lacks density at site A in the membrane (Fig. 7 B) and at site C in the CTD (Fig. 7 C). In contrast, the M2/M3 loop is well ordered in all three maps with density visible at site B (Fig. 7 D). This observation suggests that occupancy of site B may be the key to maintaining this symmetric conformation, whereas occupancy of sites A and C is secondary. A similar comparison of the asymmetric maps (SP2, SP3bent, and SP4bent) indicates that they all lack density at Zn2+ site A and have bent M2 helices (Fig. 7 F). Furthermore, the asymmetric maps all have disordered M2/M3 loops, indicating that Zn2+ site B is completely disrupted. However, comparison of the CTDs (Fig. 7 G) shows a lack of density for metal ions at site C in SP2 and SP4bent maps, but at least partial density in SP3bent. In the corresponding atomic models, a more compact CTD is correlated with the presence of Zn at site C. This difference is evident from the structure overlays in Fig. 4 D and Fig. S12 as well as from the smaller distance between Cα atoms of Arg237 and Glu281 in C2 symmetric maps (average of 12.3 Å) compared with SP2 and SP4bent (average of 15.2 Å). The smaller distance of 11.1 Å measured for SP3bent is thus consistent with the presence of Zn in this structure. An influence of Zn2+ at site C is consistent with our MD simulations in which dimeric contacts in the CTD are gradually lost in the apo state (Fig. 6 C) and the distance between Arg237 and Glu281 is considerably more variable (Fig. S12 C).
Figure 7.
Comparison of apo and holo states derived from the various independent datasets.(A) Overlay of density maps from C2 symmetric conformations from SP1, SP3sym, and SP4sym datasets. There is a 90° rotation between the two views and viewing angles in B, C, and D are indicated by arrows. (B) Close-up view of Zn binding site A from the three datasets. Density is visible at the site in SP1 and SP3sym maps but absent from the SP4sym map. (C) Comparison of site C in the CTD shows that extra density is present at site C in maps from SP1 (solid cyan surface) and SP3sym (mesh surface), consistent with the presence of metal ions; however, these densities are much weaker in the SP4sym map (solid blue surface). (D) Comparison of site B in the TM2/TM3 loop shows that the loop is ordered and that density associated with a metal ion is present in all three maps. (E) Overlay of density maps from the asymmetric conformations from SP2, SP3bent, and SP4bent datasets. There is a 90° rotation between the two views and viewing angles of F and G are indicated by arrows. (F) Close-up view of Zn binding site A from the three datasets. All density maps show a lack of density at the Zn site A. (G) Comparison of site C in the CTD shows a lack of density associated with metal ions in SP2 (solid purple surface) and SP4bent datasets (plum mesh); however, extra density is seen at this site in the map from SP3bent dataset (dark red mesh). Density for the TM2/TM3 loop and Zn site B is not shown because it is completely absent in these maps.
The heterogeneity present in the SP3 and SP4 datasets provides an opportunity to visualize the structural transition between holo and apo states of YiiP. We used the 3-D variability analysis in cryoSPARC (Punjani and Fleet, 2021) to visualize the heterogeneity and ultimately to map the transition between the two states. This analysis produces a series of maps that represent the principal axes of variability within the population of particles. If conformational variability is present, it has the potential to map the conformational transition. We generated animations for the first three components of variability—representing the highest variance—for both SP3 and SP4 datasets (Video 1 and Video 2). Although each component shows unique aspects of heterogeneity, such as the pivoting of the distal Fab domain and disordering of the TMD, the movements seen in component 1 from SP4 appear to capture the transition between the holo and apo states. Over the course of this animation (Video 2 and Fig. S13), a bend develops between the CTD and the TMD that is accompanied by disordering of the M2/M3 loop. Also of interest is component 0 from this SP4 dataset (Video 2) with movements of the CTD that reflect flexibility of the CTD dimer interface discussed above. Component 2 from the SP3 dataset (Video 1) shows the membrane domain swinging from side to side as the TM2/TM3 loops transition between order and disorder. This behavior is consistent with the idea that movements of the TMD relative to the CTD are coupled to Zn binding at site B. To evaluate these structural changes more objectively and compare them with the holo and apo state conformations, we generated a series of models representing the 3-D variability. Although the accuracy of these models is limited due to the low resolution of maps produced by 3-D variability analysis (5.5 Å), the trajectory based on component 1 from SP4 clearly illustrates the molecular transition from the symmetrical holo state to the asymmetrical apo state structures (Fig. S13 and Video 3). Given that these models were generated in an automated fashion by MD flexible fitting (see Materials and methods), they serve as objective validation of the conformational transition represented by SP1 and SP2 datasets, featuring bending of M2 and M5 as well as disordering of the M2/M3 loop.
Video 1.
Animation showing each of the three components of 3-D variability for the SP3 dataset. Each frame represents one of the 20 structures derived from this analysis. Text at the lower left indicates which of the three components is being displayed.
Video 2.
Animation showing each of the three components of 3-D variability for the SP4 dataset. Each frame represents one of the 20 structures derived from this analysis. Text at the lower left indicates which of the three components is being displayed.
Video 3.
Animation showing a morph of the atomic models produced by Namdinator for component 1 from the 3-D variability analysis of the SP4 dataset. Related to Fig. S13. These objectively built structures show the transition from the symmetric holo state to the asymmetric apo state, including bending of the CTD relative to the TMD and bending of M2 and M5 helices. Residues surrounding Zn site A (Asp47, Asp51, His155, and Asp159) are shown as simple sticks with elemental coloring; L154 and L199 representing the hydrophobic gate are shown in ball and stick representation in light and dark green colors, respectively.
Zn2+ binding controls a hydrophobic gate
Comparison of structures representing apo and holo states as well as the 3-D variability analysis suggest that a hydrophobic gate on the cytoplasmic side of M5 and M6 is controlled by Zn binding. Specifically, Leu154 on M5 and Leu199 on M6 are homologous to residues previously identified by x-ray–mediated hydroxyl radical labeling of YiiP from E. coli and have been proposed to control access to the transport sites (Gupta et al., 2014). In our structures, these residues are brought together during the transition from holo to apo state (Fig. 8). Although full closure occurs only on one protomer in the 3-D variability analysis of SP4 (Fig. S13 and Video 2), the homogeneous datasets of the apo state (SP2, SP3bent, and SP4bent) show closure of this gate on both protomers, with distances of 9.0–9.3 Å between Cα atoms from the two Leu residues—side chain atoms are considerably closer—compared with 12.8 Å in the SP3sym structure of the holo state. This distance is plotted for the series of models from 3-D variability analysis, together with the distance between Ala43 and Ala185, which appear to form a gate on the periplasmic side of the membrane (Fig. S13 D). Although these plots support the closure of the hydrophobic gate on the cytoplasmic side of the membrane, there is no change in the periplasmic gate, indicating that the molecule does not transition to the outward-facing conformation.
Figure 8.
Zn binding controls a hydrophobic gate on the cytoplasmic side of the TMD. (A–C) Three orthogonal views of the cryo-EM structure of the symmetric holo state (SP3sym) showing clear separation between Leu154 and Leu199. (B) 90° rotation about the vertical axis relative to A. (C) 90° rotation about the horizontal axis relative to B. Helices in the TMD have rainbow colors ranging from blue for M1 to red for M6. (D–F) Analogous views of the cryo-EM structure from the asymmetric apo state (SP2) showing how bending of M5 brings Leu154 and Leu199 close together. (G) Overview of the YiiP dimer showing the locations of residues used as collective variables: Leu154 and Leu199 are blue, whereas Ala43 and Ala185 on the periplasmic side of the membrane are red. Membrane helices have the same rainbow colors. (H) Distances between Cα atoms of Ala43 and Ala185 (Dperi) for each protomer during the three simulations in the apo (purple) and holo (cyan) states. Distributions calculated as KDEs are shown on the right. The corresponding values of Dperi from the SP3sym and SP2 structures are shown as dashed horizontal lines; asymmetry in SP2 produces different values for each monomer. (I) Distances between Cα atoms of Leu154 and Leu199 (Dcyto) for simulations of the apo and holo states with distributions shown on the right. Dcyto from the SP3sym and SP2 structures are shown as horizontal dashed lines.
To look for comparable movements in MD simulations, we followed collective variables representing both cytoplasmic and periplasmic gates. Like the cryo-EM structures, the periplasmic gate—distance between Ala43 and Ala185—was invariant in simulations of both apo and holo states (Fig. 8 H). The cytoplasmic gate was considerably more dynamic, especially in the apo state. Although a stable closure did not occur, the distance between L154 and L199 dipped below 10 Å at several points during one of the simulations, ending at a value close to 9 Å (dark purple trace in Fig. 8 I). This movement was only observed in one molecule, indicating that cooperativity between the monomers was weak. Thus, although the endpoint represented by cryo-EM structures was not reached over the 1-µs time scale of the simulations, there was clearly a difference in the dynamics of these helices associated with Zn binding.
Discussion
In this study, we have examined the effect of Zn binding on the conformation and dynamics of YiiP from S. oneidensis. Like previous work with tubular crystals, we found metal ions bound to soYiiP despite their absence in buffers used for cell growth and protein purification. Metal ions remained bound even after transient treatment with chelator before 2-D crystallization. These results indicate that soYiiP has high innate binding affinity and that ion binding is a prerequisite for the formation of tubular crystals. To facilitate single-particle cryo-EM studies, an Fab was selected from a phage-display library and structures of the YiiP/Fab complex were resolved before and after treatment with the metal ion chelators. Although these datasets contained heterogeneous populations of molecules, we were able to generate structures of YiiP in holo, apo, and partially bound states. Comparison of these structures revealed large-scale conformational changes associated with the removal of metal ions. These changes included an ∼25° bend of the TMD relative to the CTD, which broke the twofold symmetry seen in previous structures (Lu and Fu, 2007; Lu et al., 2009; Coudray et al., 2013; Lopez-Redondo et al., 2018), and bending of two key membrane helices and disordering of the M2/M3 loop, which harbors one of the Zn binding sites. Despite these dramatic changes, dimer interfaces in both the TMD and CTD remained intact, together with the local twofold symmetry in these domains. Comparisons of refined structures, as well as 3-D variability analysis, suggest that Zn binding at site B within the M2/M3 loop serves as a sensor that triggers this conformational change. Within the TMD, bending of M2 and M5 bring two hydrophobic residues together that have previously been postulated to form a hydrophobic gate.
The hydrophobic gate was initially identified using hydroxyl radical footprinting to probe conformational changes of ecYiiP (Gupta et al., 2014). For this approach, EDTA-treated ecYiiP was exposed to an intense x-ray source to induce nonspecific labeling of exposed residues that were then identified by mass spectrometry. Addition of Zn to the buffer reduced labeling of residues that coordinate Zn at site A, as expected. In addition, the authors observed a significant decrease in labeling of Leu152 and Met197 (ecYiiP sequence), which reside on the cytoplasmic ends of M5 and M6, respectively. Based on this result, the authors postulated that Zn binding triggered the closure of this gate to produce an occluded state before the transport step. This report did not address the status of other Zn sites (B and C), nor did it address the starting conformation of ecYiiP before the addition of Zn. Although the current study confirms an interaction between these same hydrophobic residues (L154 and L199 in soYiiP), it suggests that the conformational dynamics are more complex. In particular, whereas hydroxy radical footprinting indicated that Zn closes the hydrophobic gate in ecYiiP, our cryo-EM study showed that the gate remained open in the holo state and that closure was elicited by removal of Zn. This discrepancy could reflect differing conformational equilibria of the two homologues, in which ecYiiP preferentially adopts the outward-facing state seen in x-ray structures (Lu and Fu, 2007; Lu et al., 2009), whereas soYiiP prefers the inward-facing state seen in cryo-EM structures, both from membrane-embedded tubular crystals and from detergent solubilized YiiP/Fab complexes. It is plausible that Zn binding has different structural effects on these two states. Alternatively, the unwinding of TM helices and the splaying of TMDs seen in the x-ray structures (Lopez-Redondo et al., 2018) may reflect an instability in the TMD of ecYiiP such that the environment—lipid bilayer versus detergent micelle—may play an important role in determining the conformational effects of Zn binding. Although closure of the hydrophobic gate was initially described as a mechanism for occlusion, the transport sites are still accessible in our cryo-EM structure of the apo state, suggesting that this is just one step in a multistep process involving first occlusion and then transition to the outward-facing conformation. Fig. 9 summarizes these various conformational transitions in cartoon form.
Figure 9.
Conformational changes in CDF transporters. The dimer is depicted schematically with transmembrane helices in rainbow colors from blue to red and the CTD shown as a triangle. Zn ions are pink spheres and residues composing the hydrophobic gate (Leu154 and Leu199) as bifurcated sticks. The checkered blue/red rectangle symbolizes a conserved salt-bridge between the protomers. Twofold symmetry axes are indicated as gray lines as well as the operator symbol for those dimers that retain overall symmetry. (A) Inward-facing (IF) conformation obtained for soYiiP, both from tubular crystals and from the YiiP:Fab complex. Zn ions are bound at all three sites, the hydrophobic gate is open, and the structure retains twofold symmetry. (B) Removal of Zn from site B causes disordering of the M2-M3 loop of soYiiP and bending of M2 and M5 helices, thus closing the hydrophobic gate. This hypothetical conformation may correspond to an occluded state and thus an intermediate in the transport pathway. A bend between the TMD and CTD breaks the overall twofold symmetry of the complex, though local twofold symmetry within each domain is preserved. (C) Architecture of the outward-facing (OF) state as seen in the cryo-EM structure of Znt8 (Xue et al., 2020). All the Zn sites are occupied, though they are formed by different structural elements in this homologue; overall twofold symmetry is retained. (D) Full removal of Zn from soYiiP leads to a loosening of interactions in the CTD. (E) The x-ray structure of ecYiiP shows splaying of TMDs and unwinding of several transmembrane helices on the extracellular side of the membrane. Nevertheless, the general architecture of the TMD is consistent with an outward-facing conformation and the overall twofold symmetry of the dimer is intact.
Comparison of the various structures produced from the heterogeneous datasets SP3 and SP4 suggest that Zn site B is the trigger for the structural transition between apo and holo states. More specifically, the symmetric structures from the SP1 and SP3sym datasets show density at site A, but the SP4sym dataset does not (Fig. 7 B). Asymmetric structures from the SP2 and SP4bent datasets show a lack of density at site C, but the SP3bent dataset appears to have retained ions at this site (Fig. 7 G). Furthermore, the SP3bent structure retains the compact CTD dimer interface that characterizes the holo state (Fig. S12). Thus, the status of site B is the only consistent difference between symmetric and bent conformations. Specifically, the M2/M3 loop is ordered with density visible at the binding sites in all symmetric structures, whereas the loop is consistently disordered in bent structures. Although this disorder makes it impossible to evaluate the presence of an ion, it seems unlikely that the coordinating residues (D70, H73, and H77) would be able to form a site in the disordered state. MD simulations are also consistent with these experimental observations, showing that the absence of Zn abolishes the binding site (Fig. S4 B) and greatly enhances the dynamics of this loop as well as movements of the CTD relative to the TMD (Figs. 5 and 6). This hypothetical state in which Zn dissociates at site B to produce an occluded state is depicted in Fig. 9 B.
In earlier reports, a role for site B in transport by YiiP has been largely overlooked due to its lack of conservation among the family of CDF transporters (Kolaj-Robin et al., 2015); however, recent structural work on the mammalian homologue Znt8 revealed an unexpected Zn binding site that involves His137 in the M2/M3 loop (Xue et al., 2020). This site was readily titratable and the authors suggested that it might play a role in funneling ions into the cavity leading to the transport site. For ecYiiP, isothermal calorimetry indicated the presence of a low-affinity site (Kd ≈ 100 µM) that was distinct from the transport site (Wei and Fu, 2005). It seems plausible that this binding isotherm might correspond to site B. More generally, His-rich cytoplasmic loops are a common feature of CDF transporters, though they often appear in other locations in the primary structure (Cotrim et al., 2019). In particular, the M4/M5 loop is highly enriched in His and Asp residues in a number of transporters from plants and yeast (Kawachi et al., 2008; Podar et al., 2012). The M4/M5 loop from AtMTP1 was shown to bind Zn, and physiological studies of truncation mutants suggested that it functioned as a Zn sensor in a cellular context (Tanaka et al., 2015).
On the other hand, there is little evidence supporting a role for the binuclear Zn site C in transport. In our study, cryo-EM structures and MD simulations indicate that removal of Zn from this site enhances the flexibility of the dimer interface between the CTDs. The resulting movements, however, are modest and the overall architecture of this domain remains unchanged. In the CTD of Znt8, one of the Zn ions is coordinated by conserved residues His234, His250, and Asp287 (site C1; Fig. S4 D). Although residues coordinating the second ion bound by the CTD of YiiP (site C2, Asp287, His263, and His285) are not conserved (Parsons et al., 2018), the CTD of Znt8 unexpectedly bound a second ion via a unique CHC motif in a nonconserved N-terminal extension. Like our studies of YiiP, ions were observed bound to the CTD of Znt8 even when Zn2+ was not present in purification buffers, indicating high affinity and poorly exchangeable sites. Constitutive binding is also consistent with an unresolved, high-affinity site detected in ITC binding studies with ecYiiP (Chao and Fu, 2004). In contrast, a structural study of isolated CTDs from CzrB showed that ions were readily exchangeable and that binding was associated with a dramatic conformational change (Cherezov et al., 2008); however, the CTD construct used for this study lacked a conserved salt bridge between protomers at the membrane surface (red and blue checkered rectangle in Fig. 9) and the entire TMD, which likely serve as powerful constraints on CTD conformation and thus on the innate affinity of site C.
Although our refined structures of apo and holo states show both protomers in equivalent conformations, 3-D variability analysis and MD simulations both suggest that each protomer can function independently. In particular, component 1 from the SP4 dataset shows conformational changes in M2, M5, and the M2/M3 loop in only one protomer. Similarly, collective variables from MD simulations show that one protomer can close the hydrophobic gate at the cytoplasmic side of the TMD independently of its partner. This noncooperative behavior is consistent with the structural results from Znt8, which revealed a dimer with alternate conformations for WT protein prepared in the presence of Zn2+ (Xue et al., 2020). Although this structure was at lower resolution, it clearly showed movements of M1, M2, M4, and M5 that convert the outward-facing state to the inward-facing state in one protomer. Interestingly, the dimer interface mediated by M3 and M6 was unaffected by these movements, supporting results from cross-linking of cysteine residues placed along M3 that also implied a static interface during transport (Lopez-Redondo et al., 2018). In Znt8, residues governing the hydrophobic gate are V219 in M5 and I266 in M6, which are in close apposition in the outward-facing state, but not in the inward-facing state. Using this structure as a template for the endpoints of the transport cycle, one could imagine that the apo conformation that we have observed is a first step in the process, which involves bending the cytoplasmic ends of M2 and M5. A second step involving tilting of M1 and M4 and straightening of the periplasmic ends of M2 and M5 would be required to complete the transition (c.f., Fig. 9). Clearly the individual transporters have different conformational energy landscapes that are likely to reflect the different physiological environments in which they function. In future studies, effects of the environment used to preserve the membrane domain (e.g., lipid bilayer versus detergent micelle) should be explored as they may hold the key to a better understanding of the conformational changes that govern the transport cycle.
Acknowledgments
Joseph A. Mindell served as editor.
EM was performed at the Cryo-EM Core Facility at New York University Langone Health, with the assistance of William J. Rice and Bing Wang. The authors acknowledge Research Computing at Arizona State University for providing HPC and storage resources that have contributed to the research results reported within this paper, and thank M. Bonomi for assistance in implementing software for comparing MD simulations and cryo-EM maps.
Funding for this work was provided by National Institutes of Health grant 1R01GM125081 (D.L. Stokes) and by Aarhus Institute for Advanced Studies which is supported by the European Union’s 2020 research and innovation programme under the Marie Sklodowska-Curie grant agreement No. 754513 and the Aarhus University Research Foundation (D.L. Stokes). Additional EM was performed at the Pacific Northwest Center for Cryo-EM at Oregon Health Sciences University, which was supported by National Institutes of Health grant U24GM129547 and accessed through EMSL (grid.436923.9), a Department of Energy Office of Science User Facility sponsored by the Office of Biological and Environmental Research. MD simulations were performed using PSC Bridges at the Pittsburgh Supercomputing Center (allocation TG-MCB130177), a resource of the Extreme Science and Engineering Discovery Environment, which is supported by National Science Foundation grant number ACI-1548562.
The authors declare no competing financial interests.
Author contributions: M. Lopez-Redondo: Conceptualization, methodology, investigation, formal analysis, data curation, writing-review & editing; S. Fan: Conceptualization, methodology, investigation, formal analysis, software, data curation, visualization, writing-review & editing; A. Koide: Methodology, investigation, formal analysis, validation; S. Koide: Methodology, resources, supervision, writing-review & editing, funding acquisition; O. Beckstein: Conceptualization, methodology, investigation, formal analysis, software, data curation, visualization, validation, resources, supervision, writing-review & editing, project administration, funding acquisition; and D.L. Stokes: Conceptualization, methodology, investigation, formal analysis, data curation, visualization, validation, resources, supervision, writing - original draft, writing - review & editing, project administration, funding acquisition.
References
- Abraham, M.J., Murtola T., Schulz R., Páll S., Smith J.C., Hess B., and Lindahl E.. 2015. GROMACS: High performance molecular simulations through multi-level parallelism from laptops to supercomputers. SoftwareX. 1–2:19–25. 10.1016/j.softx.2015.06.001 [DOI] [Google Scholar]
- Adams, P.D., Afonine P.V., Bunkóczi G., Chen V.B., Davis I.W., Echols N., Headd J.J., Hung L.W., Kapral G.J., Grosse-Kunstleve R.W., et al. 2010. PHENIX: a comprehensive Python-based system for macromolecular structure solution. Acta Crystallogr. D Biol. Crystallogr. 66:213–221. 10.1107/S0907444909052925 [DOI] [PMC free article] [PubMed] [Google Scholar]
- Andreini, C., Banci L., Bertini I., and Rosato A.. 2006. Counting the zinc-proteins encoded in the human genome. J. Proteome Res. 5:196–201. 10.1021/pr050361j [DOI] [PubMed] [Google Scholar]
- Åqvist, J., and Warshel A.. 1990. Free-energy relationships in metalloenzyme-catalyzed reactions - calculations of the effects of metal-ion substitutions in staphylococcal nuclease. J. Am. Chem. Soc. 112:2860–2868. 10.1021/ja00164a003 [DOI] [Google Scholar]
- Bailey, L.J., Sheehy K.M., Dominik P.K., Liang W.G., Rui H., Clark M., Jaskolowski M., Kim Y., Deneka D., Tang W.J., and Kossiakoff A.A.. 2018. Locking the elbow: Improved antibody Fab fragments as chaperones for structure determination. J. Mol. Biol. 430:337–347. 10.1016/j.jmb.2017.12.012 [DOI] [PMC free article] [PubMed] [Google Scholar]
- Best, R.B., Hummer G., and Eaton W.A.. 2013. Native contacts determine protein folding mechanisms in atomistic simulations. Proc. Natl. Acad. Sci. USA. 110:17874–17879. 10.1073/pnas.1311599110 [DOI] [PMC free article] [PubMed] [Google Scholar]
- Bonomi, M., Pellarin R., and Vendruscolo M.. 2018. Simultaneous determination of protein structure and dynamics using cryo-electron microscopy. Biophys. J. 114:1604–1613. 10.1016/j.bpj.2018.02.028 [DOI] [PMC free article] [PubMed] [Google Scholar]
- Bonomi, M., Hanot S., Greenberg C.H., Sali A., Nilges M., Vendruscolo M., and Pellarin R.. 2019. Bayesian weighing of electron cryo-microscopy data for integrative structural modeling. Structure. 27:175–188.e6. 10.1016/j.str.2018.09.011 [DOI] [PMC free article] [PubMed] [Google Scholar]
- Bussi, G., Donadio D., and Parrinello M.. 2007. Canonical sampling through velocity rescaling. J. Chem. Phys. 126:014101. 10.1063/1.2408420 [DOI] [PubMed] [Google Scholar]
- Chao, Y., and Fu D.. 2004. Thermodynamic studies of the mechanism of metal binding to the Escherichia coli zinc transporter YiiP. J. Biol. Chem. 279:17173–17180. 10.1074/jbc.M400208200 [DOI] [PubMed] [Google Scholar]
- Cherezov, V., Höfer N., Szebenyi D.M., Kolaj O., Wall J.G., Gillilan R., Srinivasan V., Jaroniec C.P., and Caffrey M.. 2008. Insights into the mode of action of a putative zinc transporter CzrB in Thermus thermophilus. Structure. 16:1378–1388. 10.1016/j.str.2008.05.014 [DOI] [PMC free article] [PubMed] [Google Scholar]
- Costello, L.C., Fenselau C.C., and Franklin R.B.. 2011. Evidence for operation of the direct zinc ligand exchange mechanism for trafficking, transport, and reactivity of zinc in mammalian cells. J. Inorg. Biochem. 105:589–599. 10.1016/j.jinorgbio.2011.02.002 [DOI] [PMC free article] [PubMed] [Google Scholar]
- Cotrim, C.A., Jarrott R.J., Martin J.L., and Drew D.. 2019. A structural overview of the zinc transporters in the cation diffusion facilitator family. Acta Crystallogr. D Struct. Biol. 75:357–367. 10.1107/S2059798319003814 [DOI] [PMC free article] [PubMed] [Google Scholar]
- Coudray, N., Valvo S., Hu M., Lasala R., Kim C., Vink M., Zhou M., Provasi D., Filizola M., Tao J., et al. 2013. Inward-facing conformation of the zinc transporter YiiP revealed by cryoelectron microscopy. Proc. Natl. Acad. Sci. USA. 110:2140–2145. 10.1073/pnas.1215455110 [DOI] [PMC free article] [PubMed] [Google Scholar]
- Cubillas, C., Vinuesa P., Tabche M.L., and García-de los Santos A.. 2013. Phylogenomic analysis of Cation Diffusion Facilitator proteins uncovers Ni2+/Co2+ transporters. Metallomics. 5:1634–1643. 10.1039/c3mt00204g [DOI] [PubMed] [Google Scholar]
- Domański, J., Beckstein O., and Iorga B.I.. 2017. Ligandbook: an online repository for small and drug-like molecule force field parameters. Bioinformatics. 33:1747–1749. 10.1093/bioinformatics/btx037 [DOI] [PMC free article] [PubMed] [Google Scholar]
- Dominik, P.K., and Kossiakoff A.A.. 2015. Phage display selections for affinity reagents to membrane proteins in nanodiscs. Methods Enzymol. 557:219–245. 10.1016/bs.mie.2014.12.032 [DOI] [PubMed] [Google Scholar]
- Duarte, F., Bauer P., Barrozo A., Amrein B.A., Purg M., Aqvist J., and Kamerlin S.C.L.. 2014. Force field independent metal parameters using a nonbonded dummy model. J. Phys. Chem. B. 118:4351–4362. 10.1021/jp501737x [DOI] [PMC free article] [PubMed] [Google Scholar]
- Eiben, A.E., Raue P.E., and Ruttkay Z.. 1994. Genetic algorithms with multi-parent recombination. Lect. Notes Comput. Sci. 866:78–87. 10.1007/3-540-58484-6_252 [DOI] [Google Scholar]
- Emsley, P., Lohkamp B., Scott W.G., and Cowtan K.. 2010. Features and development of Coot. Acta Crystallogr. D Biol. Crystallogr. 66:486–501. 10.1107/S0907444910007493 [DOI] [PMC free article] [PubMed] [Google Scholar]
- Essmann, U., Perela L., Berkowitz M.L., Darden T., Lee H., and Pedersen L.G.. 1995. A smooth particle mesh Ewald method. J. Chem. Phys. 103:8577–8592. 10.1063/1.470117 [DOI] [Google Scholar]
- Fan, S., Linke M., Paraskevakos I., Gowers R.J., Gecht M., and Beckstein O.. 2019. PMDA - Parallel Molecular Dynamics Analysis. Proceedings of the 18th Python in Science Conference. 2019:134–142. [Google Scholar]
- Fan, S., Iorga B.I., and Beckstein O.. 2020. Prediction of octanol-water partition coefficients for the SAMPL6-[Formula: see text] molecules using molecular dynamics simulations with OPLS-AA, AMBER and CHARMM force fields. J. Comput. Aided Mol. Des. 34:543–560. 10.1007/s10822-019-00267-z [DOI] [PMC free article] [PubMed] [Google Scholar]
- Gowers, R.J., Linke M., Barnoud J., Reddy T.J.E., Melo M.N., Seyler S.L., Dotson D.L., Domański J., Buchoux S., Kenney I.M., and Beckstein O.. 2016. MDAnalysis: A Python package for the rapid analysis of molecular dynamics simulations. Proceedings of the 15th Python in Science Conference. 2016:98–105. [Google Scholar]
- Gupta, S., Chai J., Cheng J., D’Mello R., Chance M.R., and Fu D.. 2014. Visualizing the kinetic power stroke that drives proton-coupled zinc(II) transport. Nature. 512:101–104. 10.1038/nature13382 [DOI] [PMC free article] [PubMed] [Google Scholar]
- Hess, B.2008. P-LINCS: A Parallel Linear Constraint Solver for Molecular Simulation. J. Chem. Theory Comput. 4:116–122. 10.1021/ct700200b [DOI] [PubMed] [Google Scholar]
- Jo, S., Kim T., Iyer V.G., and Im W.. 2008. CHARMM-GUI: a web-based graphical user interface for CHARMM. J. Comput. Chem. 29:1859–1865. 10.1002/jcc.20945 [DOI] [PubMed] [Google Scholar]
- Jo, S., Lim J.B., Klauda J.B., and Im W.. 2009. CHARMM-GUI Membrane Builder for mixed bilayers and its application to yeast membranes. Biophys. J. 97:50–58. 10.1016/j.bpj.2009.04.013 [DOI] [PMC free article] [PubMed] [Google Scholar]
- Kambe, T.2012. Molecular architecture and function of ZnT transporters. Curr. Top. Membr. 69:199–220. 10.1016/B978-0-12-394390-3.00008-2 [DOI] [PubMed] [Google Scholar]
- Kawachi, M., Kobae Y., Mimura T., and Maeshima M.. 2008. Deletion of a histidine-rich loop of AtMTP1, a vacuolar Zn2+/H+ antiporter of Arabidopsis thaliana, stimulates the transport activity. J. Biol. Chem. 283:8374–8383. 10.1074/jbc.M707646200 [DOI] [PMC free article] [PubMed] [Google Scholar]
- Kidmose, R.T., Juhl J., Nissen P., Boesen T., Karlsen J.L., and Pedersen B.P.. 2019. Namdinator - automatic molecular dynamics flexible fitting of structural models into cryo-EM and crystallography experimental maps. IUCrJ. 6:526–531. 10.1107/S2052252519007619 [DOI] [PMC free article] [PubMed] [Google Scholar]
- Kim, C., Vink M., Hu M., Love J., Stokes D.L., and Ubarretxena-Belandia I.. 2010. An automated pipeline to screen membrane protein 2D crystallization. J. Struct. Funct. Genomics. 11:155–166. 10.1007/s10969-010-9088-5 [DOI] [PMC free article] [PubMed] [Google Scholar]
- Kimura, T., and Kambe T.. 2016. The Functions of Metallothionein and ZIP and ZnT Transporters: An Overview and Perspective. Int. J. Mol. Sci. 17:336. 10.3390/ijms17030336 [DOI] [PMC free article] [PubMed] [Google Scholar]
- Klauda, J.B., Venable R.M., Freites J.A., O’Connor J.W., Tobias D.J., Mondragon-Ramirez C., Vorobyov I., MacKerell A.D. Jr., and Pastor R.W.. 2010. Update of the CHARMM all-atom additive force field for lipids: validation on six lipid types. J. Phys. Chem. B. 114:7830–7843. 10.1021/jp101759q [DOI] [PMC free article] [PubMed] [Google Scholar]
- Klimovich, P.V., Shirts M.R., and Mobley D.L.. 2015. Guidelines for the analysis of free energy calculations. J. Comput. Aided Mol. Des. 29:397–411. 10.1007/s10822-015-9840-9 [DOI] [PMC free article] [PubMed] [Google Scholar]
- Kolaj-Robin, O., Russell D., Hayes K.A., Pembroke J.T., and Soulimane T.. 2015. Cation Diffusion Facilitator family: Structure and function. FEBS Lett. 589:1283–1295. 10.1016/j.febslet.2015.04.007 [DOI] [PubMed] [Google Scholar]
- Lee, J., Cheng X., Swails J.M., Yeom M.S., Eastman P.K., Lemkul J.A., Wei S., Buckner J., Jeong J.C., Qi Y., et al. 2016. CHARMM-GUI Input Generator for NAMD, GROMACS, AMBER, OpenMM, and CHARMM/OpenMM Simulations Using the CHARMM36 Additive Force Field. J. Chem. Theory Comput. 12:405–413. 10.1021/acs.jctc.5b00935 [DOI] [PMC free article] [PubMed] [Google Scholar]
- Li, P., and Merz K.M. Jr. 2017. Metal Ion Modeling Using Classical Mechanics. Chem. Rev. 117:1564–1686. 10.1021/acs.chemrev.6b00440 [DOI] [PMC free article] [PubMed] [Google Scholar]
- Liang, X., Dempski R.E., and Burdette S.C.. 2016. Zn2+ at a cellular crossroads. Curr. Opin. Chem. Biol. 31:120–125. 10.1016/j.cbpa.2016.02.008 [DOI] [PMC free article] [PubMed] [Google Scholar]
- Liu, P., Agrafiotis D.K., and Theobald D.L.. 2010. Fast determination of the optimal rotational matrix for macromolecular superpositions. J. Comput. Chem. 31:1561–1563. 10.1002/jcc.21439 [DOI] [PMC free article] [PubMed] [Google Scholar]
- Lopez-Redondo, M.L., Coudray N., Zhang Z., Alexopoulos J., and Stokes D.L.. 2018. Structural basis for the alternating access mechanism of the cation diffusion facilitator YiiP. Proc. Natl. Acad. Sci. USA. 115:3042–3047. 10.1073/pnas.1715051115 [DOI] [PMC free article] [PubMed] [Google Scholar]
- Lovell, M.A., Smith J.L., Xiong S., and Markesbery W.R.. 2005. Alterations in zinc transporter protein-1 (ZnT-1) in the brain of subjects with mild cognitive impairment, early, and late-stage Alzheimer’s disease. Neurotox. Res. 7:265–271. 10.1007/BF03033884 [DOI] [PubMed] [Google Scholar]
- Lu, M., and Fu D.. 2007. Structure of the zinc transporter YiiP. Science. 317:1746–1748. 10.1126/science.1143748 [DOI] [PubMed] [Google Scholar]
- Lu, M., Chai J., and Fu D.. 2009. Structural basis for autoregulation of the zinc transporter YiiP. Nat. Struct. Mol. Biol. 16:1063–1067. 10.1038/nsmb.1662 [DOI] [PMC free article] [PubMed] [Google Scholar]
- MacKerell, A.D., Bashford D., Bellott M., Dunbrack R.L., Evanseck J.D., Field M.J., Fischer S., Gao J., Guo H., Ha S., et al. 1998. All-atom empirical potential for molecular modeling and dynamics studies of proteins. J. Phys. Chem. B. 102:3586–3616. 10.1021/jp973084f [DOI] [PubMed] [Google Scholar]
- Mackerell, A.D.Jr., Feig M., and Brooks C.L. III. 2004. Extending the treatment of backbone energetics in protein force fields: limitations of gas-phase quantum mechanics in reproducing protein conformational distributions in molecular dynamics simulations. J. Comput. Chem. 25:1400–1415. 10.1002/jcc.20065 [DOI] [PubMed] [Google Scholar]
- Marcus, Y.1988. Ionic-Radii in Aqueous-Solutions. Chem. Rev. 88:1475–1498. 10.1021/cr00090a003 [DOI] [Google Scholar]
- Marcus, Y.1991. Thermodynamics of Solvation of Ions. 5. Gibbs Free-Energy of Hydration at 298.15-K. J. Chem. Soc., Faraday Trans. 87:2995–2999. 10.1039/FT9918702995 [DOI] [Google Scholar]
- Maret, W.2013. Zinc biochemistry: from a single zinc enzyme to a key element of life. Adv. Nutr. 4:82–91. 10.3945/an.112.003038 [DOI] [PMC free article] [PubMed] [Google Scholar]
- Miller, K.R., Koide A., Leung B., Fitzsimmons J., Yoder B., Yuan H., Jay M., Sidhu S.S., Koide S., and Collins E.J.. 2012. T cell receptor-like recognition of tumor in vivo by synthetic antibody fragment. PLoS One. 7:e43746. 10.1371/journal.pone.0043746 [DOI] [PMC free article] [PubMed] [Google Scholar]
- Miyamoto, S., and Kollman P.A.. 1992. Settle: an Analytical Version of the Shake and Rattle Algorithm for Rigid Water Models. J. Comput. Chem. 13:952–962. 10.1002/jcc.540130805 [DOI] [Google Scholar]
- Montanini, B., Blaudez D., Jeandroz S., Sanders D., and Chalot M.. 2007. Phylogenetic and functional analysis of the Cation Diffusion Facilitator (CDF) family: improved signature and prediction of substrate specificity. BMC Genomics. 8:107. 10.1186/1471-2164-8-107 [DOI] [PMC free article] [PubMed] [Google Scholar]
- Neupane, D.P., Kumar S., and Yukl E.T.. 2019. Two ABC Transporters and a Periplasmic Metallochaperone Participate in Zinc Acquisition in Paracoccus denitrificans. Biochemistry. 58:126–136. 10.1021/acs.biochem.8b00854 [DOI] [PMC free article] [PubMed] [Google Scholar]
- Parrinello, M., and Rahman A.. 1981. Polymorphic transitions in single crystals: A new molecular dynamics method. J. Appl. Phys. 52:7182–7190. 10.1063/1.328693 [DOI] [Google Scholar]
- Parsons, D.S., Hogstrand C., and Maret W.. 2018. The C-terminal cytosolic domain of the human zinc transporter ZnT8 and its diabetes risk variant. FEBS J. 285:1237–1250. 10.1111/febs.14402 [DOI] [PMC free article] [PubMed] [Google Scholar]
- Pedregosa, F., Varoquaux G., Gramfort A., Michel V., Thirion B., Grisel O., Blondel M., Prettenhofer P., Weiss R., Dubourg V., et al. 2011. Scikit-learn: Machine Learning in Python. J. Mach. Learn. Res. 12:2825–2830. [Google Scholar]
- Pettersen, E.F., Goddard T.D., Huang C.C., Couch G.S., Greenblatt D.M., Meng E.C., and Ferrin T.E.. 2004. UCSF Chimera--a visualization system for exploratory research and analysis. J. Comput. Chem. 25:1605–1612. 10.1002/jcc.20084 [DOI] [PubMed] [Google Scholar]
- PLUMED consortium . 2019. Promoting transparency and reproducibility in enhanced molecular simulations. Nat. Methods. 16:670–673. 10.1038/s41592-019-0506-8 [DOI] [PubMed] [Google Scholar]
- Podar, D., Scherer J., Noordally Z., Herzyk P., Nies D., and Sanders D.. 2012. Metal selectivity determinants in a family of transition metal transporters. J. Biol. Chem. 287:3185–3196. 10.1074/jbc.M111.305649 [DOI] [PMC free article] [PubMed] [Google Scholar]
- Prasad, A.S.2013. Discovery of human zinc deficiency: its impact on human health and disease. Adv. Nutr. 4:176–190. 10.3945/an.112.003210 [DOI] [PMC free article] [PubMed] [Google Scholar]
- Punjani, A., and Fleet D.J.. 2021. 3D variability analysis: Resolving continuous flexibility and discrete heterogeneity from single particle cryo-EM. J. Struct. Biol. 213:107702. 10.1016/j.jsb.2021.107702 [DOI] [PubMed] [Google Scholar]
- Punjani, A., Rubinstein J.L., Fleet D.J., and Brubaker M.A.. 2017. cryoSPARC: algorithms for rapid unsupervised cryo-EM structure determination. Nat. Methods. 14:290–296. 10.1038/nmeth.4169 [DOI] [PubMed] [Google Scholar]
- Raetz, C.R.1986. Molecular genetics of membrane phospholipid synthesis. Annu. Rev. Genet. 20:253–295. 10.1146/annurev.ge.20.120186.001345 [DOI] [PubMed] [Google Scholar]
- Reif, M.M., and Hünenberger P.H.. 2011. Computation of methodology-independent single-ion solvation properties from molecular simulations. III. Correction terms for the solvation free energies, enthalpies, entropies, heat capacities, volumes, compressibilities, and expansivities of solvated ions. J. Chem. Phys. 134:144103. 10.1063/1.3567020 [DOI] [PubMed] [Google Scholar]
- Ritchie, T.K., Grinkova Y.V., Bayburt T.H., Denisov I.G., Zolnerciks J.K., Atkins W.M., and Sligar S.G.. 2009. Chapter 11 - Reconstitution of membrane proteins in phospholipid bilayer nanodiscs. Methods Enzymol. 464:211–231. 10.1016/S0076-6879(09)64011-8 [DOI] [PMC free article] [PubMed] [Google Scholar]
- Sala, D., Giachetti A., and Rosato A.. 2019. An atomistic view of the YiiP structural changes upon zinc(II) binding. Biochim. Biophys. Acta, Gen. Subj. 1863:1560–1567. 10.1016/j.bbagen.2019.06.001 [DOI] [PubMed] [Google Scholar]
- Sauer, D.B., Trebesch N., Marden J.J., Cocco N., Song J., Koide A., Koide S., Tajkhorshid E., and Wang D.N.. 2020. Structural basis for the reaction cycle of DASS dicarboxylate transporters. eLife. 9:e61350. 10.7554/eLife.61350 [DOI] [PMC free article] [PubMed] [Google Scholar]
- Scheres, S.H.2012. RELION: implementation of a Bayesian approach to cryo-EM structure determination. J. Struct. Biol. 180:519–530. 10.1016/j.jsb.2012.09.006 [DOI] [PMC free article] [PubMed] [Google Scholar]
- Sladek, R., Rocheleau G., Rung J., Dina C., Shen L., Serre D., Boutin P., Vincent D., Belisle A., Hadjadj S., et al. 2007. A genome-wide association study identifies novel risk loci for type 2 diabetes. Nature. 445:881–885. 10.1038/nature05616 [DOI] [PubMed] [Google Scholar]
- Tanaka, N., Fujiwara T., Tomioka R., Krämer U., Kawachi M., and Maeshima M.. 2015. Characterization of the histidine-rich loop of Arabidopsis vacuolar membrane zinc transporter AtMTP1 as a sensor of zinc level in the cytosol. Plant Cell Physiol. 56:510–519. 10.1093/pcp/pcu194 [DOI] [PubMed] [Google Scholar]
- Trabuco, L.G., Villa E., Mitra K., Frank J., and Schulten K.. 2008. Flexible fitting of atomic structures into electron microscopy maps using molecular dynamics. Structure. 16:673–683. 10.1016/j.str.2008.03.005 [DOI] [PMC free article] [PubMed] [Google Scholar]
- Webb, B., and Sali A.. 2014. Protein structure modeling with MODELLER. Methods Mol. Biol. 1137:1–15. 10.1007/978-1-4939-0366-5_1 [DOI] [PubMed] [Google Scholar]
- Wei, Y., and Fu D.. 2005. Selective metal binding to a membrane-embedded aspartate in the Escherichia coli metal transporter YiiP (FieF). J. Biol. Chem. 280:33716–33724. 10.1074/jbc.M506107200 [DOI] [PubMed] [Google Scholar]
- Xue, J., Xie T., Zeng W., Jiang Y., and Bai X.C.. 2020. Cryo-EM structures of human ZnT8 in both outward- and inward-facing conformations. eLife. 9:e58823. 10.7554/eLife.58823 [DOI] [PMC free article] [PubMed] [Google Scholar]


