. 2021 Jun 30;10:e64507. doi: 10.7554/eLife.64507

Figure 9. In vivo assessment of ERp57 inhibition.

(A) 4- to 8-week-old NOD-FRG mice were engrafted with primary human hepatocytes (PHH). After approximately 2–3 months, the animals displaying human serum albumin (HSA) levels >15 mg/ml were randomly split into four different groups (N = 3 to N = 5 animals, see Table in the inset) that were infected with hepatitis B virus (HBV) (108 genome equivalent (GE)/mouse), using the displayed nitazoxanide (NTZ) treatment schedule. (B) At different time points post-infection, blood samples (50 µl) were collected and the viremia in sera was monitored by quantitative PCR (qPCR) (GE/ml of serum). The graphs show the results of viremia (means ± SD) of HBV. See results of individual mice in Figure 9—figure supplement 1.

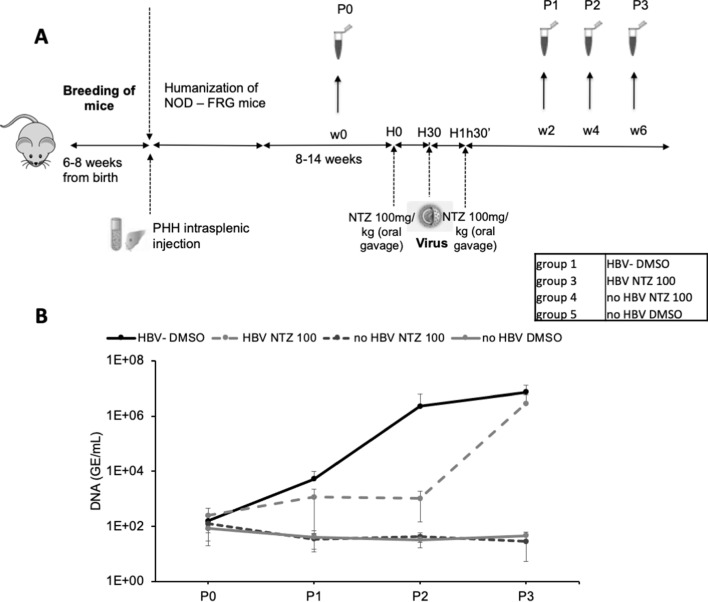
Figure 9—source data 1. In vivo assessment of ERp57 inhibition.
The values correspond to the data expressed in the graphs displayed in Figure 9B.

Figure 9.

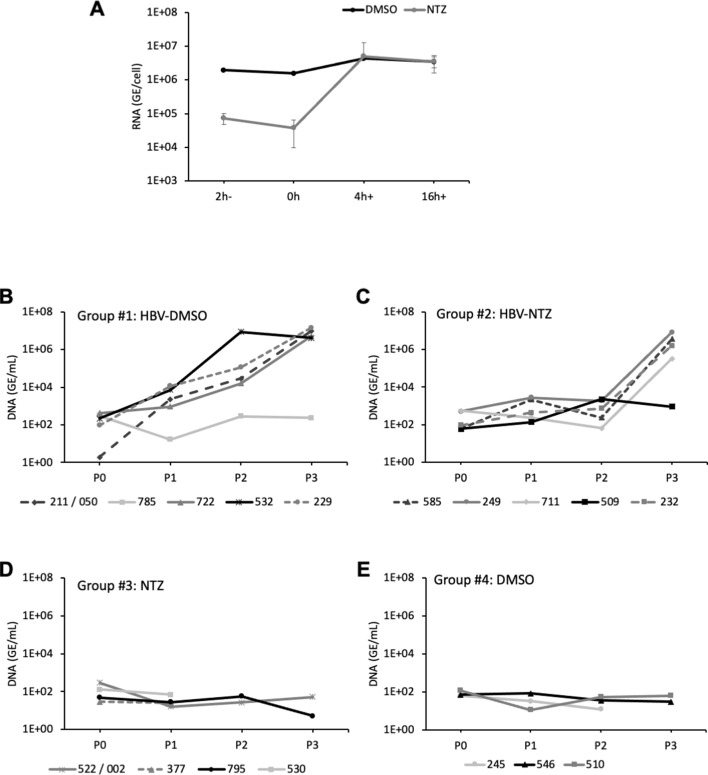
Figure 9—figure supplement 1. In vivo assessment of ERp57 inhibition.

Figure 9—figure supplement 1.

(A) Nitazoxanide (NTZ) at 30 µg/ml was added to the cell supernatant 2 hr before infection (2h-) vs at the onset of infection (0 hr), at 4 hr (4h+) or at 16 hr (16h+) post-infection. Dimethyl sulfoxide (DMSO) was used as the control vehicle. At 7 days post-infection, hepatitis delta virus (HDV) RNAs were extracted from cells and quantified by quantitative reverse transcription PCR (RTqPCR). The results are expressed after normalization with glyceraldehyde 3-phosphate dehydrogenase (GAPDH) RNAs as means ± SD (N = 4) per ml of cell lysates containing 106 cells. (B–E) Study of NTZ effect in hepatitis B virus (HBV) in vivo. 4- to 8-week-old NOD-FRG mice were engrafted with primary human hepatocytes (PHH). After approximately 2–3 months, the animals displaying human serum albumin (HSA) levels >15 mg/ml were split into four groups that were infected with HBV (108 genome equivalent (GE)/mouse) with or without NTZ. See schedule in Figure 9A. At different time points post-infection, blood samples (50 µl) were collected and the viremia in sera was monitored by quantitative PCR (qPCR) on the HBV genome (GE/ml of serum). The graphs show the results of viremia for individual mice within each group. (B) Group #1: mice were infected and inoculated with DMSO, (C) Group #2: mice were infected and inoculated with NTZ (100 mg/kg), (D) Group #3: mice were only inoculated with NTZ (100 mg/kg), and (E) Group #4: mice were only inoculated with DMSO (used as the control vehicle of NTZ).