

Summary
Across species, hematopoietic stem and progenitor cells (HSPCs) arise during embryogenesis from a specialized arterial population, termed hemogenic endothelium. Here, we describe a mechanistic role for the epigenetic regulator, Enhancer of zeste homolog-1 (Ezh1), in vertebrate HSPC production via regulation of hemogenic commitment. Loss of ezh1 in zebrafish embryos favored acquisition of hemogenic (gata2b) and HSPC (runx1) fate at the expense of the arterial program (ephrinb2a, dll4). In contrast, ezh1 overexpression blocked hematopoietic progression via maintenance of arterial gene expression. The related Polycomb group subunit, Ezh2, functioned in a non-redundant, sequential manner, whereby inhibition had no impact on arterial identity, but was capable of blocking ezh1-knockdown-associated HSPC expansion. Single-cell RNA sequencing across ezh1 genotypes revealed a dropout of ezh1+/− cells among arterial endothelium associated with positive regulation of gene transcription. Exploitation of Ezh1/2 modulation has potential functional relevance for improving in vitro HSPC differentiation from induced pluripotent stem cell sources.
Keywords: hematopoietic stem/progenitor cell (HSPC), Ezh1, Ezh2, endothelial-to-hematopoietic transition (EHT), hemogenic endothelium (HE), hematopoiesis, zebrafish
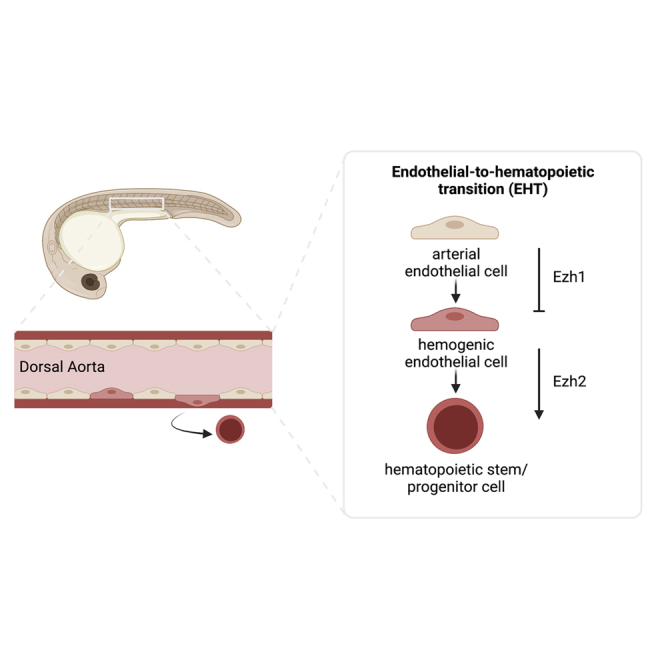
Graphical abstract
Highlights
-
•
ezh1 loss increases HSPC and lymphoid progenitor formation during embryogenesis
-
•
ezh1 loss promotes a developmental shift from arterial to hemogenic fate in the DA
-
•
Ezh2 functions downstream of Ezh1-regulated arterial identity in HSPC commitment
-
•
scRNA-seq confirms ezh1 loss modifies distinct arterial associated gene programs
Here, North and colleagues reveal Ezh1 as a key regulator of the developmental shift from arterial fate toward hemogenic potential and subsequent HSPC formation in the embryonic dorsal aorta. Significantly, the related PRC2 subunit, Ezh2, which is upregulated in response to Ezh1 loss, has no impact on arterial state, but is required downstream of Ezh1 to regulate HSPC production.
Introduction
The ability to derive patient-specific hematopoietic stem and progenitor cells (HSPCs) from mesodermal precursors capable of sustaining long-term self-renewal and multipotency has immense therapeutic potential. Despite continuing efforts to identify gene-regulatory networks that guide HSPC ontogeny in vivo, current in vitro differentiation protocols largely fail to efficiently produce long-lived multilineage progenitors from human pluripotent stem cell (PSC) sources (Slukvin and Uenishi, 2019), indicative of an incomplete understanding of the stage-specific regulators governing HSPC emergence and, in particular, the timing and targets of diverse gene regulation.
Many biological aspects of developmental hematopoiesis are highly conserved across vertebrate species, including successive waves of restricted progenitor production at discrete sites within the embryo (Rowe et al., 2016), followed by formation of multilineage HSPCs (Yzaguirre et al., 2017). HSPCs emerge in select arterial niches from a transient specialized subset of Runx1+ endothelium, termed hemogenic endothelium (HE) (Kissa and Herbomel 2010; Slukvin and Uenishi, 2019). This fate transition occurs most notably within the ventral floor of the dorsal aorta (DA) via a remodeling process termed endothelial-to-hematopoietic transition (EHT), occurring between ∼24 to 48 hours post fertilization (hpf) in the zebrafish embryo, and from around embryonic day 10.5 (E10.5) to E12.5 in mice (Bertrand et al., 2010; Boisset et al., 2010; Kissa and Herbomel, 2010). Current in vitro and in vivo evidence indicates that activation of the arterial program permits subsequent acquisition of definitive HE properties (Bonkhofer et al., 2019; Slukvin and Uenishi, 2019). While many transcriptional regulators of embryonic hematopoiesis are known, the method by which a subset of arterial-fated endothelium is selected to acquire hemogenic capability and HSPC fate remains elusive.
Prior to HSPC emergence, immature endothelial cells undergo distinct transition steps allowing them to acquire arterial, venous, or lymphatic cell fate within the embryo (Dejana et al., 2017). Vascular endothelial growth factor (VEGF) and its cognate receptor VEGFR2 (Flk-1/Kdrl) are critical regulators of developmental vasculogenesis (Dejana et al., 2017). Likewise, Hedgehog and Wnt/β-Catenin signaling pathways converge to control arterial-venous fate decisions, resulting in arterial-specific activation of Notch signaling via EphrinB2 and Dll4 (Butko et al., 2016). Suppression of artery formation by Notch inhibition in zebrafish embryos elicits ectopic expression of venous markers flt4 and rtk5, demonstrating a role in repressing venous cell fate (Lawson et al., 2001). Notably, Notch signaling is also implicated in HE specification and subsequent HSPC emergence (Burns et al., 2005; Butko et al., 2016; Slukvin and Uenishi, 2019). In the zebrafish embryo, Notch ligands and receptors function sequentially during hematovascular development: dll4 and dlc are important for arterial endothelium specification as early as the 5-somite stage (Lawson et al., 2001; Quillien et al., 2014), while jag1a is dispensable for artery formation but required for later HSPC production (Espín-Palazón et al., 2014; Monteiro et al., 2016). Critically, the regulatory mechanism influencing iterative uses of Notch activity to establish endothelial cell fate is undefined.
Genomic profiling of gene-regulatory networks that govern blood formation have revealed dynamic chromatin and transcriptional changes during HSPC specification and differentiation (Gao et al., 2020; Goode et al., 2016). It is increasingly appreciated that alterations in developmental differentiation can be attributed to epigenetic dynamics, facilitating the progressive silencing or activation of alternative lineages (Allis and Jenuwein, 2016). Classically, the histone methyltransferase subunits of Polycomb Repressive Complex 2 (PRC2), EZH1 and EZH2, repress gene transcription via trimethylation of lysine 27 on histone 3 (H3K27me3) (Margueron and Reinberg, 2011). Emerging evidence supports additional non-canonical function for PRC2-EZH1, including the ability to mediate gene activation (Chen et al., 2020; Mousavi et al., 2012; Xu et al., 2015). We previously demonstrated that knockdown of EZH1 promoted emergence of HSPCs with multipotentiality, including lymphoid fate, from more lineage-restricted induced PSC (iPSC)-derived progenitors in vitro (Vo et al., 2018). However, the mechanism(s) by which Ezh1 regulates de novo HSPC production, including the cellular identity and/or signaling pathway alterations mediating this process, remains undetermined.
Here, as demonstrated by epistasis and overexpression studies, we elucidate the role of Ezh1-mediated maintenance of arterial fate in the DA of zebrafish embryos, whereby loss of ezh1 allows transition to hemogenic fate and subsequent Ezh2-associated induction of HSPC formation. Mechanistically, differential expression of the arterial Notch ligand, dll4, was observed with ezh1 loss compared with wild-type (WT) siblings, while the hematopoietic ligand and receptor pair, jag1a and notch1a, showed opposing regulation. Ultimately, our collective understanding of the complex gene-regulatory transitions required during vertebrate embryonic hematopoiesis in vivo may aid in the directed engineering of functional HSPCs from iPSC sources.
Results
ezh1 loss in zebrafish increases HSPC output and lymphoid potential in vivo
We previously observed increased engraftment of embryonic Ezh1+/− hematopoietic stem cells into adult mouse recipients (Vo et al., 2018); however, the mechanism by which Ezh1 mediated this effect was not identified. To determine whether ezh1 elicited similar phenotypic effects in vivo using the zebrafish model, we employed functional knockdown techniques using an ezh1 splice-blocking morpholino (ezh1-MO) (Huang et al., 2013) that promoted nonsense-mediated mRNA decay (Figure S1A). Whole-mount in situ hybridization (WISH) of ezh1 morphants showed increased expression of the conserved HSPC markers runx1 and cmyb in the DA at 36 hpf (Figures 1A and 1B); a significant increase in runx1 expression was confirmed by qPCR (Figure 1C). Similar results were found using a lineage-specific Tg(-6.0itga2b:egfp)la2 reporter: fluorescence microscopy showed significantly more CD41+ HSPCs in the caudal hematopoietic tissue (CHT) of ezh1 morphants at 72 hpf (Figures 1D and 1E). This effect was sustained throughout development, as CD41+/Gata1− HSPCs were also significantly increased by fluorescence-activated cell sorting (FACS) at 120 hpf with ezh1-MO (Figure 1F). Intriguingly, ezh1+/− (Yette et al., 2021) catalytically dead mutant embryos phenocopied the morphant data, with increased runx1 and cmyb expression, whereas ezh1−/− embryos displayed levels comparable with those of ezh1+/+ embryos by WISH and qPCR (Figures 1G, 1H, and S1B), suggestive of a potential dosage or compensatory response, consistent with our prior observations (Vo et al., 2018).
Figure 1.

ezh1 loss increases the definitive hematopoietic program
(A) WISH for runx1/cmyb in the DA of control and ezh1 morphants at 36 hpf. Scale bar, 100 μm.
(B) Qualitative phenotypic distribution plot of embryos in (A) (n ≥ 49 embryos/condition; ∗p < 0.05).
(C) Whole-embryo runx1 qPCR on control and ezh1 morphants at 36 hpf relative to 18s (n ≥ 25 embryos/sample × 4 replicate clutches; two-tailed unpaired Student's t test, ∗∗p < 0.01. Mean ± SEM).
(D) In vivo imaging of CD41:GFP+ cells in the CHT at 72 hpf in control and ezh1 morphants. Scale bar, 200 μm.
(E) Quantification of fluorescent images in (D) (n = 9 embryos/condition; two-tailed unpaired Student's t test, ∗p < 0.05. Error bars indicate SD).
(F) Flow cytometry (FC) for CD41:GFP+/Gata1:dsRed− gated on percentage of live cells at 120 hpf in control and ezh1 morphants (n = 5 embryos/sample × 5 biological replicates; two-tailed unpaired Student's t test, ∗∗∗∗p < 0.0001. Error bars indicate SD).
(G) WISH for runx1/cmyb in ezh1+/+, ezh1+/−, ezh1−/− embryos at 36 hpf. Scale bar, 100 μm.
(H) Qualitative phenotypic distribution plot of embryos in (G) (n ≥ 74 embryos/genotype; ∗∗∗∗p < 0.0001).
(I) WISH for rag1 expression in the thymus of control and ezh1 morphants at 120 hpf. Scale bar, 100 μm.
(J) Quantification of thymic area in (I) (n = 7 embryos/condition; two-tailed unpaired Student's t test, ∗∗p < 0.01. Error bars indicate SD).
(K) Flow cytometry (FC) for Rag2:GFP+ gated on percentage live cells at 120 hpf in control and ezh1 morphants (n = 5 embryos/sample × 5 biological replicates; two-tailed unpaired Student's t test, ∗p < 0.05. Error bars indicate SD).
As lymphoid potential was enhanced following EZH1 knockdown in vitro (Vo et al., 2018), we evaluated the lymphoid compartment in vivo. WISH for lymphoid progenitors showed enhanced rag1 expression with ezh1-MO (Figure 1I), which was reflected by increased total thymic area at 120 hpf (Figure 1J). FACS using the Tg(rag2:gfp) reporter line confirmed a significant increase in Rag2+ lymphoid progenitors in ezh1 morphants at 120 hpf (Figure 1K). Collectively, these data position zebrafish as an ideal system to study the mechanism of HSPC expansion following ezh1 knockdown.
ezh1 knockdown increases HSPCs via enhanced commitment to hemogenic fate
Given the increase in HSPCs with ezh1-MO, we examined whether this effect occurred at the expense of earlier non-HSPC-derived blood cell lineages. By WISH and FACS, we found similar levels of primitive erythroid and myeloid cells in ezh1 morphants compared with controls at 30 hpf (Figures S2A–S2C). Definitive hematopoiesis initiates with production of lineage-restricted erythromyeloid progenitors (EMPs) (Frame et al., 2013), which arise in the posterior blood island (PBI) of zebrafish as early as 24 hpf (Bertrand et al., 2007). By confocal imaging and FACS analysis with a Tg(lmo2:EGFP); Tg(gata1a:dsRed) reporter line, Lmo2+Gata1+ EMPs (Bertrand et al., 2007) were enumerated in the PBI at 30 hpf, showing similar numbers and distribution in ezh1 morphants and control siblings (Figures 2A and 2B). Likewise, FACS analysis of Kit+CD41+CD16/32+ EMPs in the E9.5 murine yolk sac (McGrath et al., 2015) indicated that non-HSPC-derived fate-restricted progenitors appeared in equivalent numbers (Figure 2C). Together, these data suggest that Ezh1 loss does not affect HSPC production at the expense of earlier waves of blood cell development.
Figure 2.

ezh1 knockdown promotes early commitment to HSPC fate and increased HE potential
(A) Confocal imaging of Lmo2:GFP+/Gata1:dsRed+ in the PBI at 30 hpf in control and ezh1 morphants. Scale bar, 50 μm.
(B) Flow cytometry (FC) for Lmo2:GFP+/Gata1:dsRed+ gated on percentage of live cells at 30 hpf in control and ezh1 morphants (n = 5 embryos/sample × 6 biological replicates; two-tailed unpaired Student's t test, not significant. Error bars indicate SD).
(C) Flow cytometry (FC) for Kit+CD41+CD16/32+ gated on 10,000 live cells derived from E9.5 yolk sacs (YS) from Ezh1+/+, Ezh1+/−, Ezh1−/− mouse embryos (n ≥ 6 yolk sacs/genotype; one-way ANOVA, not significant. Error bars indicate SD).
(D) WISH for runx1/cmyb at 24 and 30 hpf in control and ezh1 morphants. Scale bar, 100 μm.
(E) Qualitative phenotypic distribution plot of embryos in (D) (n ≥ 60 embryos/condition; ∗∗∗p < 0.001, ∗∗∗∗p < 0.0001).
(F) WISH for gata2b at 24 hpf in control and ezh1 morphants. Scale bar, 100 μm.
(G) Qualitative phenotypic distribution plot of embryos in (F) (n = 35 control, 33 ezh1 morphants; ∗p < 0.05).
(H) Whole-embryo gata2b qPCR on control and ezh1 morphants at 24 hpf relative to 18s (n ≥ 25 embryos/sample × 4 replicate clutches; two-tailed unpaired Student's t test, ∗p < 0.05. Mean ± SEM).
(I) Flow cytometry (FC) on Scl:GFP+/Kdrl:mCherry+ gated on percentage of live cells at 24 hpf in control and ezh1 morphants (n = 5 embryos/sample × 6 biological replicates; two-tailed unpaired Student's t test, ∗∗∗p < 0.001. Error bars indicate SD).
(J) WISH for gata2b in ezh1+/+, ezh1+/−, ezh1−/− embryos at 30 hpf. Scale bar, 100 μm.
(K) Qualitative phenotypic distribution plot of embryos in (J) (n ≥ 40 embryos/genotype; ∗∗∗∗p < 0.0001).
We next determined whether the observed enhancement in HSPC numbers was indicative of alterations in commitment to HSPC fate. By WISH, we noted a greater fraction of ezh1 morphants with high levels of runx1 and cmyb as early as 24 hpf (Figures 2D and 2E). To determine whether loss of ezh1 modulates HE specification, we assessed the conserved transcriptional regulator Gata2 (Butko et al., 2015), which acts downstream of Notch signaling to promote HSPC formation via expression of Runx1 (Gao et al., 2013; Nottingham et al., 2007; Robert-Moreno et al., 2005). In zebrafish, a partial genome duplication resulted in two Gata2 paralogs (Butko et al., 2015): Gata2a was previously revealed to act as an upstream regulator of gata2b and runx1 expression (Dobrzycki et al., 2020). By qPCR at 24 hpf, we saw a significant upregulation in gata2a expression with ezh1-MO (Figure S2D); likewise, expression of the HE-specific marker, gata2b, was also significantly increased by WISH and qPCR at 24 hpf (Figures 2F–2H). Enhanced HE specification with ezh1-MO was independently confirmed by FACS at 24 hpf in Tg(-6tal1:egfp);Tg(kdrl:Has.HRAS-mCherry)s916 double-lineage reporter embryos (Carroll et al., 2014) (Figure 2I). A similar increase in gata2b expression was seen in ezh1+/− embryos, whereas ezh1−/− embryos had gata2b levels comparable with that of ezh1+/+ siblings by WISH and qPCR (Figures 2J, 2K, and S2E). This effect on HE formation did not significantly influence proliferative expansion of Kdrl+ cells in the DA, as there was no difference in 5-ethynyl-2′-deoxyuridine (EdU) incorporation between ezh1 morphants and controls at 36 hpf (Figures S2F and S2G). Together, these data indicate that HSPC expansion occurs via enhanced HE specification following ezh1 knockdown.
HE specification increases at the expense of arterial endothelial maintenance in ezh1 morphants
Studies of both mouse and zebrafish embryos indicate that HE is derived from arterial endothelium (AE) (Lizama et al., 2015; Bonkhofer et al., 2019). To explore whether ezh1 loss affected the fate switch by which select AE acquires hemogenic competence, we further assessed vascular development. Gross vessel morphology appeared phenotypically normal between ezh1 morphants and controls by WISH for flk1 and confocal microscopy with the Tg(kdrl:GFP)la116 reporter line at 24 hpf (Figures S3A–S3C). In contrast to the differential HE and HSPC phenotypes observed in haploinsufficient versus null embryos, there was a dramatic dose-dependent decrease in arterial ephrinb2a expression in ezh1+/− and ezh1−/− embryos by WISH and qPCR (Figures 3A, 3B, and S3D); this state could be rescued to WT levels in ezh1−/− embryos by overexpression of dll4 mRNA (Figures S3E and S3F). By qPCR and WISH at 24 hpf, similar reductions were found for Notch-dependent arterial markers ephrinb2a, dlc, and dll4 (Figures 3C–3E) and Notch-independent tbx20 (Lawson et al., 2001) in ezh1 morphants (Figure 3C). To determine whether reduced arterial expression resulted in a shift toward venous differentiation, as previously observed for loss of Notch signaling (Lawson et al., 2001; Carroll et al., 2014), we assessed flt4 expression by WISH and found it to be unaffected in ezh1 morphants or mutants at 24 hpf (Figures S3G–S3I). Significantly, no impact on ephrinb2a expression was seen at 18 hpf (Figures S3J–S3L), suggesting that Ezh1 influences maintenance, not initiation, of AE fate. Confocal microscopy with an Ephrin-B2 antibody revealed disrupted endothelial patterning in ezh1 morphants at 24 hpf (Figure 3F), with more Ephrin-B2neg cells along the aortic floor exhibiting a rounded morphology than controls. Analysis of Tg(kdrl:Has.HRAS-mCherry)s916;Tg(cmyb:EGFP)zf169 ezh1 morphants confirmed that these “budding” cells corresponded to increased numbers of double-positive HSPCs at 36 hpf (Figures 3G and 3H). These studies indicate that ezh1 loss is correlated with altered developmental fate of the DA endothelium, including increased EHT.
Figure 3.

Hemogenic endothelial specification is increased at the expense of arterial endothelial maintenance following ezh1 loss
(A) WISH for ephrinb2a in ezh1+/+, ezh1+/−, ezh1−/− embryos at 24 hpf. Scale bar, 100 μm.
(B) Qualitative phenotypic distribution plot of embryos in (A) (n ≥ 31 embryos/genotype; ∗∗p < 0.01, ∗∗∗∗p < 0.0001).
(C) Whole-embryo ephrinb2a, dlc, dll4, and tbx20 qPCR on control and ezh1 morphants at 24 hpf relative to 18s (n ≥ 25 embryos/sample × 4 replicate clutches; two-tailed unpaired Student's t test, ∗∗p < 0.01, ∗p < 0.05, ∗∗∗∗p < 0.0001. Mean ± SEM).
(D) WISH for arterial markers ephrinb2a, dlc, and dll4 in control and ezh1 morphants at 24 hpf. Scale bar, 100 μm.
(E) Qualitative phenotypic distribution plot of embryos in (D) (n ≥ 42 embryos/condition; ∗∗p < 0.01, ∗∗∗∗p < 0.0001).
(F) Confocal imaging of the DA from 24 hpf control and ezh1 morphant embryos. DAPI+ nuclei shown in magenta, Ephrin-B2+ cells shown in green. Scale bar, 100 μm.
(G) Confocal imaging of Kdrl:mCherry+/cMyb:GFP+ budding HSPC cells in control and ezh1 morphants at 36 hpf in the DA. Scale bar, 100 μm.
(H) Quantification of confocal images in (G) (n = 12 control, 13 ezh1 morphants; two-tailed unpaired Student's t test, ∗p < 0.05. Error bars indicate SD).
Ezh2 inhibition blocks ezh1-knockdown-mediated HSPC expansion
PRC2-associated histone methyltransferases EZH1 and EZH2 often exhibit differential cellular localization (Margueron et al., 2008), influencing their regulatory action. Consistent with prior reports (Völkel et al., 2019), we observed global non-specific ezh1 expression at 24 hpf by WISH compared with the sense control (Figure S4A). As ezh1 modulation affects hematovascular fate, we next profiled defined endothelial fractions for ezh1 and ezh2 expression by qPCR following FACS isolation. Using Tg(kdrl:GFP)la116, Tg(-0.8flt1:tdTomato), TgBAC(gata2b:KalTA4)sd32;Tg(UAS:lifeact-GFP)mu271, and Tg(cmyb:EGFP)zf169 reporter lines, we segregated bulk Flk1−/Flt1− non-endothelial cells (NECs), Flk1+/Flt1− non-arterial endothelial cells (NAECs), Flk1+/Flt1+ AE (Figure S4B), Gata2b+ HE, and Flk1+/cMyb+ HSPCs. While qPCR for ezh1 showed ubiquitous, albeit low, expression across all fractions, ezh2 was more dynamic, with notably lower expression in AECs compared with NECs or HSPCs (Figure 4A).
Figure 4.

Ezh2 function is required downstream for ezh1-knockdown-mediated HSPC expansion
(A) Sorted cell qPCR at 30 and 48 hpf for ezh1 and ezh2 expression on bulk Flk1−/Flt1− non-endothelial cells (NEC), Flk1+/Flt1− non-arterial endothelial cells (NAEC), Flk1+/Flt1+ arterial endothelium (AE), Gata2b+ hemogenic endothelial cells (HE), and Flk1+/cMyb+ hematopoietic stem and progenitor cells (HSPC). Reference gene: 18s (n ≥ 20 embryos/sample × ≥3 replicate clutches; two-way ANOVA, ∗∗p < 0.01, ∗∗∗∗p < 0.0001. Mean ± SEM).
(B) Whole-embryo ezh2 qPCR on control and ezh1 morphants at 24 and 36 hpf relative to 18s (n ≥ 25 embryos/sample × 3 replicate clutches; two-tailed unpaired Student's t test, ∗p < 0.05. Mean ± SEM).
(C) In vivo imaging of CD41:GFP+ cells in the CHT in control and ezh1 morphants ± dimethyl sulfoxide (DMSO)/1 μM GSK126 treatment from 12 to 72 hpf. Scale bar, 200 μm.
(D) Quantification of fluorescent images in (C) (n = 7 embryos/condition; one-way ANOVA, ∗p < 0.05, ∗∗∗∗p < 0.0001. Error bars indicate SD).
(E) Whole-embryo ephrinb2a, dll4, dlc, and tbx20 qPCR on DMSO and 1 μM GSK126-treated embryos from 12 to 24 hpf relative to 18s (n ≥ 25 embryos/sample × ≥3 replicate clutches; two-tailed unpaired Student's t test, ∗∗∗∗p < 0.0001. Mean ± SEM).
(F) Whole-embryo ephrinb2a, dll4, dlc, and tbx20 qPCR on control and ezh2 mRNA-injected embryos at 24 hpf relative to 18s (n ≥ 25 embryos/sample × 3 replicate clutches; two-tailed unpaired Student's t test, not significant. Mean ± SEM).
(G) WISH for gata2b on DMSO and 1 μM GSK126-treated embryos from 12 to 30 hpf. Scale bar, 100 μm.
(H) Qualitative phenotypic distribution plot of embryos in (G) (n = 33 DMSO, 38 GSK126-treated embryos).
(I) Whole-embryo gata2b qPCR on DMSO and 1 μM GSK126-treated embryos from 12 to 24 hpf relative to 18s (n ≥ 25 embryos/sample × 4 replicate clutches; two-tailed unpaired Student's t test, not significant. Mean ± SEM).
Interestingly, with ezh1-MO, we observed upregulation of ezh2 expression during the window of HSPC emergence by qPCR (Figure 4B). As complete loss of Ezh2 function is lethal (Dupret et al., 2017; O'Carroll et al., 2001; San et al., 2016; San et al., 2018), to investigate a role for Ezh2 in Ezh1-mediated regulation of HSPC production we used pharmacological inhibition of Ezh2 by exposure to GSK126 (Dupret et al., 2017). In contrast to ezh1 loss, GSK126-treated embryos showed a significant decrease in CD41+ HSPCs (Figures 4C and 4D). Furthermore, epistasis analyses showed that Ezh2 inhibition blocked the positive effect of ezh1-MO on HSPC production, resulting in fewer CD41+ cells at 72 hpf (Figures 4C and 4D). A similar reduction was seen in GSK126-treated embryos for runx1 and cmyb expression by WISH and runx1 expression by qPCR, with or without ezh1 loss (Figures S4C–S4E). In contrast, ezh2 mRNA overexpression increased HSPC marker expression by WISH and qPCR (Figures S4F–S4H). These findings indicate that increased HSPC number in the setting of ezh1 loss requires Ezh2 function.
Despite potent effects on HSPC formation seen with Ezh2 modulation, embryos treated with GSK126 from 12 to 24 hpf did not exhibit a reduction in expression of ephrinb2a, dll4, dlc, and tbx20 by qPCR (Figure 4E); likewise, expression of arterial markers was unaltered by ezh2 mRNA overexpression (Figure 4F). In addition to proper arterial identity, GSK126-treated embryos had normal venous flt4 expression by WISH (Figures S4I and S4J). Furthermore, gata2b HE specification was unperturbed by Ezh2 inhibition by WISH and qPCR (Figures 4G–4I). Collectively, these data indicate that Ezh1 and Ezh2 play sequential, non-redundant regulatory roles in HSPC generation from endothelial precursors in the embryonic DA.
scRNA-seq analysis of ezh1 loss-of-function embryos confirms altered arterial fate
To identify molecular changes in the endothelium reflecting PRC2-regulated hematovascular commitment, we performed single-cell RNA sequencing (scRNA-seq) of sorted GFP+ cells from stage-matched ezh1+/+;Tg(kdrl:EGFP)s843, ezh1+/−;Tg(kdrl:EGFP)s843, and ezh1−/−;Tg(kdrl:EGFP)s843 embryos at 30 hpf. Using the 10X Genomics Chromium platform, we obtained transcriptomes of 4,033, 3,850, and 2,970 cells from ezh1+/+, ezh1+/−, and ezh1−/− embryos, respectively. Graph-based clustering on all cells resulted in 18 distinct clusters (Figure 5A), which were annotated for cell type based on differentially expressed marker genes (Tables S1 and S2; Figure S5A): Erythroid 1-5 (cluster 0, 1, 5, 6, 13); Epithelium 1-3 (cluster 3, 16, 17); Nervous System 1-4 (cluster 4, 9, 10, 11); Macrophage (cluster 8); Neutrophil 1-2 (cluster 7, 14); Endothelium 1-2 (cluster 2, 12); and Cardiovascular (cluster 15). A subset of clusters was identified that prominently expressed GFP, concordant with high kdrl expression (Figure 5B). Furthermore, within the GFPhi fraction, two clusters displayed cdh5, lmo2, etv2, and fli1b expression (Figure S5B), and were classified as endothelial cells.
Figure 5.

Single-cell RNA-seq analysis of sorted endothelial cells across ezh1 genotypes
(A) UMAP plot and cell-clustering analysis, with 18 distinct clusters identified. NS, nervous system; EP, epithelium.
(B) UMAP plots showing GFP and kdrl expression across sorted cell types.
(C) Proportion of ezh1+/+ (WT), ezh1+/− (HET), and ezh1−/− (KO) cells in EC1 and EC2.
(D) Volcano plot displaying the pattern of gene expression values for EC2 relative to EC1. Selected genes are indicated based on significance.
(E) GO enrichment for Biological Process (upper) and Functions (lower) associated with upregulated genes in EC2.
(F) GO enrichment analysis for ezh1+/− EC2 versus ezh1+/+ EC2 sorted endothelial cells.
(G) UMAP plot and reclustering analysis on EC clusters, with eight distinct clusters identified. AE, arterial endothelium.
(H) UMAP plots showing localization of arterial markers efnb2a, dll4, dlc, and flt1, as well as the venous marker flt4 and pan-endothelial marker pecam1 in AE1 and AE2.
(I) Proportion of ezh1+/+, ezh1+/−, and ezh1−/− cells in AE1 and AE2.
(J) Dot plot of differentially expressed vascular genes for each genotype.
(K) GSEA of day 28 CD34+CD38− HSPCs 5F plus shEZH1 compared with 5F plus shLUC cells from Vo et al. (2018) (n = 10 shEZH1, 8 shLUC samples).
We further interrogated the two endothelial cell (EC1 and EC2) clusters across genotypes, and observed a reduced proportion of ezh1+/− cells in EC2 compared with ezh1+/+ cells (Figure 5C); this effect was observed across several independent single-cell libraries of ezh1+/− cells, reflective of biological differences and not technical dropout of single cells (Figure S5C). We next performed differential gene expression analysis to identify transcriptional differences between EC1 and EC2. EC2 was enriched in various Hox genes known to affect hematopoiesis (Alharbi et al., 2013)—hoxa9a, hoxa9b, hoxb7a, hoxb9a, and hoxd9a—as well as Notch arterial associated genes hey1, hey2, and dll4 (Figure 5D). Positively enriched genes within EC2 compared with EC1 were utilized in gene ontology (GO) enrichment analysis using GOrilla (Eden et al., 2009) (Figure 5E). Interestingly, enriched Hox genes were associated with the biological function “DNA-binding transcription factor activity, RNA polymerase II specific” (Figure 5E). Therefore, we next examined which biological processes are affected following ezh1 loss, whereby GO analysis revealed that ezh1+/− endothelial cells downregulate genes related to RNA maturation processes such as sf3a2, srsf9, srsf2a, and ybx1 (Figure 5F). Prior reports describe a distinct PRC2 complex composed of SUZ12 and EZH1 that promotes gene transcription through RNA polymerase II elongation, in particular via activation of DLL4 expression in cultured endothelial cells (Chen et al., 2020; Mousavi et al., 2012; Xu et al., 2015), together supportive of a potential regulatory impact on arterial versus hemogenic fate.
Select cells within EC1 and EC2 significantly expressed markers associated with arterial identity including efnb2a, dll4, and flt1 (Figure S5D). This observation prompted reclustering of the EC populations, identifying eight distinct subclusters, including two representing AE (AE1 and AE2) (Figure 5G) based on marker gene enrichment (Figure 5H). Significantly, we observed a reduced proportion of ezh1+/− cells in AE1 compared with ezh1+/+ cells (Figures 5I and S5E), consistent with our heterozygote and morphant arterial phenotype. Importantly, loss of ezh1+/− cells in AE1 correlated with decreased expression of arterial markers efnb2a and dll4 (Figure 5J), reflective of a failure to maintain arterial identity and potential transition to HE fate in heterozygotes. To evaluate whether a similar transition may be relevant to our prior in vitro observations, we performed gene set enrichment analysis (GSEA) on our RNA-seq dataset collected from day-28 CD34+CD38− 5F control versus EZH1-knockdown HSPCs (Vo et al., 2018). This analysis showed enrichment in signaling pathways needed to establish AE and HSPC emergence in vivo (Figures 5K and S5F), suggesting that in defined endothelial subpopulations during hemogenic commitment Ezh1 acts as an arterial transcriptional activator.
Ezh1 blocks hematopoietic fate via pro-arterial regulation
Dynamic chromatin modifications and associated transcriptional changes are necessary during development to achieve lineage specificity via activation or repression of gene expression. To determine whether progression of HSPC formation from AE is regulated by Ezh1 function, we overexpressed zebrafish ezh1 by mRNA injection, which negatively affected runx1 and cmyb WISH at 36 hpf (Figures 6A and 6B). ezh1-OE also significantly reduced CD41+/Gata1− HSPCs (Figure 6C) and Rag2+ lymphoid progenitors (Figure 6D) at 120 hpf by FACS, indicating that Ezh1 normally acts to restrict progression to the hematopoietic program.
Figure 6.

Ezh1 promotes the arterial program thereby restricting hematopoietic commitment
(A) WISH for runx1/cmyb at 36 hpf in control and ezh1 mRNA-injected embryos. Scale bar, 100 μm.
(B) Qualitative phenotypic distribution plot of embryos in (A) (n = 51 control, 44 ezh1 mRNA-injected embryos; ∗∗∗∗p < 0.0001).
(C) Flow cytometry (FC) on CD41:GFP+/Gata1:dsRed− gated on percentage of live cells at 120 hpf in control and ezh1 mRNA-injected embryos (n = 5 embryos/sample × 4 biological replicates; two-tailed unpaired Student's t test, ∗p < 0.05. Error bars indicate SD).
(D) Flow cytometry (FC) for Rag2:GFP+ gated on percentage of live cells at 120 hpf in control and ezh1 mRNA-injected embryos (n = 5 embryos/sample × 6 biological replicates; two-tailed unpaired Student's t test, ∗∗p < 0.01. Error bars indicate SD).
(E) WISH for runx1 at 36 hpf in control and ezh1 mRNA-injected Hsp70:NICD embryos ± heat shock at 30 hpf. Scale bar, 100 μm.
(F) Qualitative phenotypic distribution plot of embryos in (E) (n ≥ 47 embryos/condition; ∗∗p < 0.01, ∗∗∗∗p < 0.0001).
(G) Whole-embryo gata2b qPCR on control and ezh1 mRNA-injected embryos at 24 hpf relative to 18s (n ≥ 25 embryos/sample × 3 replicate clutches; two-tailed unpaired Student's t test, ∗∗∗p < 0.001. Mean ± SEM).
(H) WISH for ephrinb2a and dll4 at 24 hpf in control and ezh1 mRNA-injected embryos. Scale bar, 100 μm.
(I) Qualitative phenotypic distribution plot of embryos in (H) (n ≥ 33 embryos/condition; ∗∗p < 0.01, ∗∗∗∗p < 0.0001).
(J) Whole-embryo ephrinb2a and dll4 qPCR on control and ezh1 mRNA-injected embryos at 24 hpf relative to 18s (n ≥ 25 embryos/sample × 3 replicate clutches; two-tailed unpaired Student's t test, ∗p < 0.05, ∗∗p < 0.01. Mean ± SEM).
Given that loss of ezh1 alters arterial and HSPC balance in the DA, we hypothesized that modulations in Notch signaling could be a relevant mechanism. Abrogation of Notch activity by exposure (12–36 hpf) to the γ-secretase inhibitor N-[N-(3,5-difluorophenacetyl)-L-alanyl]-S-phenylglycine t-butyl ester (DAPT) (Geling et al., 2002) abolished ezh1-MO-associated HSPC expansion by WISH (Figures S6A and S6B), consistent with an essential sequential role for Notch in both arterial and HE specification (Butko et al., 2016). To determine whether Notch activity was affected following ezh1 loss, we performed time-course qPCR analysis, which revealed gradual decreases in arterial dll4 in expression in ezh1 morphants mirrored by an upregulation of the Notch hematopoietic ligand, jag1a, and receptor, notch1a (Figure S6C). Intriguingly, WISH on Tg(EPV:Tp1-MmuHbb:EGFP) (Notch:GFP+) reporter embryos showed decreased expression in neural tissue and arterial-derived intersomitic vessels in ezh1 morphant embryos, while GFP was enhanced in the ventral wall of the DA at 36 hpf (Figures S6D and S6E). Likewise, jag1a and notch1a expression remained significantly increased by qPCR in ezh1 morphants during HSPC formation (Figure S6F). The relative increase in Notch activity in the DA was specific to ezh1-MO, as chemical inhibition of Ezh2 abolished GFP globally by WISH (Figures S6G and S6H), as well as expression of Notch pathway components by qPCR at 36 hpf (Figure S6I). This effect was specific to the window of HSPC emergence, as both Notch activity and gene expression were unperturbed by Ezh2 inhibition at 24 hpf by WISH and qPCR (Figures S6J and S6K), reflective of phenotypically normal arterial and HE development.
Decreased HSPC formation as a result of Notch signaling perturbation can be rescued by induction of the notch1a intracellular domain (NICD) (Burns et al., 2005). Interestingly, despite indications that Ezh1/2 influence Notch ligand and receptor expression dynamics to regulate HSPC formation, temporal induction of ligand-independent Notch activation at 30 hpf in Tg(hsp70l:1xMYC-notch1a-intra)fb12 embryos (Zhao et al., 2014) was unable to overcome the effect of ezh1-OE as determined by runx1 WISH at 36 hpf (Figures 6E and 6F). This failure appeared to reflect depletion of the specified HE population following ezh1-OE (Figures 6G, S6L, and S6M). PRC2-EZH1 was recently implicated in positive regulation of pro-angiogenic factors, such as DLL4, in cultured endothelial cells upon VEGFA stimulation in vitro (Chen et al., 2020). To determine whether the overall decrease in HSPC and HE formation observed with ezh1-OE resulted from forced retention of the arterial program, we profiled ephrinb2a and dll4 expression, whereby ezh1-OE embryos showed a significant increase in arterial marker expression by WISH and qPCR (Figures 6H–6J). Altogether, our data indicate that Ezh1-associated positive regulation of arterial cell fate in the DA serves to antagonize subsequent hemogenic commitment, such that targeted knockdown allows for enhanced HSPC production.
Discussion
While critical regulators of HSPC formation are increasingly known across vertebrate species, the molecular mechanisms that broadly regulate the switch to HE specification from arterial-fated endothelium remain largely undefined. Here, we have elucidated the mechanistic role by which ezh1 functions to restrict hematopoietic fate acquisition via maintenance of arterial identity. The endothelium itself serves as the cellular precursor to HSPC emergence, with derivation of multilineage hematopoietic progenitors from HE restricted to arterial vessels (Zovein et al., 2008; Bertrand et al., 2010; Boisset et al., 2010; Kissa and Herbomel, 2010; Bonkhofer et al., 2019). Despite in vitro studies postulating that HE and HSPC formation may be uncoupled from AE specification (Ditadi et al., 2015), our data reinforce the concept that arterial identity is a functional prerequisite to HSPC formation in vivo (Bonkhofer et al., 2019; Chen et al., 2016; Gering and Patient, 2005; Lizama et al., 2015) and further indicates that targeted repression of previously specified arterial fate, via ezh1 loss, favors the transition to hematopoietic commitment.
Our prior work proposed that HSPC multipotency was restricted in embryonic murine and human systems by canonical EZH1-PRC2 occupancy at poised bivalent HSPC- and lymphoid-specific loci. We also noted enrichment of non-canonical EZH1 regulation of immune gene targets (Vo et al., 2018). Here, in the zebrafish model, we demonstrate that upon knockdown of ezh1 there is an increase in phenotypic HSPCs as a result of enhanced HE commitment, occurring at the expense of AE maintenance in the ventral wall of the DA. Consistent with recently published data (Chen et al., 2020) and GREAT (Genomic Regions Enrichment of Annotations Tool) analysis of ATAC (Assay for Transposase-Accessible Chromatin) peaks in mouse Ezh1+/− and Ezh1−/− compared with WT AGM (Vo et al., 2018), we postulate that ezh1 promotes arterial identity by positively regulating expression of the Notch ligand dll4, which in turn restricts HE and subsequent HSPC fate. This is reminiscent of murine data where Dll4+ aortic ECs negatively regulate HE recruitment to hematopoietic clusters (Porcheri et al., 2020). In support of this notion, upon ezh1-MO we find downregulation of the arterial marker, dll4, and upregulation of hematopoietic jag1a, which presumably interacts with Notch1a to govern HSPC formation (Espín-Palazón et al., 2014). Compelling reports by the Bigas group suggest that high Notch signal strength via Dll4 confers endothelial identity, and that silencing of the endothelial program—in favor of hematopoietic fate—is mediated by low Notch signal strength via Jag1 (Gama-Norton et al., 2015). Whether Ezh1 directly or indirectly controls Notch gene regulation remains to be investigated, however, we propose Ezh1 function is normally essential to actively block commitment of AE toward hemogenic fate by maintaining arterial gene expression. Precisely how Ezh1 expression is controlled within select cells of the aortic endothelial niche will be of significant interest for further exploration.
In the context of red blood cell (RBC) differentiation from HSPCs, EZH1 expression is significantly upregulated as EZH2 expression is diminished at the control of a GATA2-to-GATA1 switch (Xu et al., 2015). Upon RBC differentiation, non-canonical PRC2 is composed of EZH1-SUZ12 to activate lineage-specific gene transcription (Xu et al., 2015). While PRC2 function has been explored in HSPC maintenance and differentiation, we propose alternative functions of Ezh1 and Ezh2 in HSPC specification from AE in vivo: pharmacological inhibition of Ezh2 did not affect arterial maintenance or HE specification, whereas ezh1 loss impaired arterial identity. Interestingly, despite the increasing number of HE cells transitioning from arterial-fated endothelium associated with ezh1 loss, Ezh2 function was subsequently required for increased HSPC formation. This indicates that Ezh1 and Ezh2 do not play redundant or antagonistic roles in HE specification/HSPC formation, but rather “hand off” regulatory activity in this context. In addition to observing a marked downregulation in ezh2 expression in AE cells compared with the non-endothelial and HSPC fractions, we noted an unexpected increase in ezh2 expression with loss of ezh1, similar to that described in a recent study (Völkel et al., 2019). Whether this is due to direct regulation of the ezh2 loci by Ezh1 or simply reflective of increased HSPCs has not been fully explored, but will be an important area of future study.
While not investigated here, our in vitro bioinformatics analysis also revealed an intriguing role for inflammatory signaling in HSPC formation in the context of EZH1 knockdown (Figure S5F). Our laboratory and others have shown that sterile inflammatory signaling regulates HSPC formation and expansion during development (Espín-Palazón et al., 2014; Frame et al., 2020). Here, we saw an enrichment in inflammatory pathways, including interferon-α (IFNα), IFNγ, and tumor necrosis factor α (TNFα) following knockdown of EZH1; whether this is due to active EZH1 repression or simply reflective of an increase in committed HSPCs remains to be elucidated. Alternatively, inflammatory signaling may be directly antagonizing ezh1 expression and/or function to promote the transition to HE and, later, HSPC fate. TNFα has previously been implicated in regulating HSPC number in fish, in part, by activation of the Notch pathway through jag1a (Espín-Palazón et al., 2014). It will be interesting to determine whether overexpression of inflammatory components is sufficient to antagonize or block the ability of Ezh1 to maintain arterial fate or regulate Ezh2 expression.
Understanding how HSPCs are specified from mesodermal precursors is essential to the goal of generating patient-specific HSPCs capable of multipotent long-term function. Our study highlights the role of the epigenetic factor, Ezh1, in regulating the ability of AE to acquire hematopoietic competence. Furthermore, our data have demonstrated a need to not only downregulate ezh1 but to additionally ensure Ezh2 function in order to promote the definitive hematopoietic program. Further characterization of upstream regulators of Ezh1 and Ezh2, as well as investigation of the positive and negative regulatory regions each occupies, will be informative for further optimizing current differentiation platforms aimed at producing patient-specific HSPCs for curative purposes.
Experimental procedures
Animal models
Zebrafish (see supplemental experimental procedures) were utilized in accordance with approvals from the Beth Israel Deaconess Medical Center and Boston Children's Hospital Institutional Animal Care and Use Committees. Mice (see supplemental experimental procedures) were used in accordance with regulations of the Boston Children's Hospital Institutional Animal Care and Use Committee. Overnight mating generated timed pregnancies.
Zebrafish chemical exposures, WISH, and imaging
Stage-matched embryos were exposed to chemical modulators in 6-well plates containing 5 mL of E3 fish water at the time points indicated. The following compounds (dose, source) were used: GSK126 (1 μM, Selleck Chemicals) and DAPT (100 μM, Selleck Chemicals). For WISH, embryos were fixed in 4% paraformaldehyde overnight at 4°C, and processed with established protocols and published probes for runx1, cmyb, rag1, gata2b, flk1, ephrinb2a, dll4, dlc, gata1, pu.1, flt4, and GFP (http://zfin.org/ZFIN/Methods/ThisseProtocol.html). An ezh1 probe was generated by amplifying 690 bp of coding sequence from cDNA in a pExpress-1 plasmid (Horizon Discovery) using PCR primers flanked with T7 sequence (see supplemental experimental procedures) followed by antisense/sense probe generation by in vitro transcription. Phenotypic variation (n ≥ 20 embryos/condition, n ≥ 3 replicate clutches) was qualitatively analyzed and graphically depicted as percent of total scored exhibiting high (increased)/ medium (normal)/ low (decreased) expression compared with the median of sibling controls. Heat shock was induced by incubation in a 38°C circulating water bath for 45 min at ∼30 hpf; NICD embryos were segregated by blue eyes. WISH images were acquired by a Zeiss Axio Imager A1/Axio Cam MRC using Axiovision LE software. Thymic area was quantified using Fiji software (NIH).
Fluorescence microscopy
Live embryos were imaged using a Zeiss Discovery V8 microscope with Axiovision LE software; CD41:GFP+ cells were counted manually using Fiji software. For confocal microscopy, embryos were treated with 0.003% phenylthiourea in E3 and imaged on a Zeiss laser scanning LSM880 inverted confocal microscope after mounting in 3% methylcellulose using the 20 × 0.8 M27 Plan-Apochromat (Zeiss) objective. Image analysis was performed with ImageJ, Fiji, and/or Zen (Zeiss) programs.
Zebrafish morpholino and mRNA injections
Splice-blocking ezh1-MO (GeneTools; see supplemental experimental procedures) was injected (1-2 nL of 300 μM MO) at the 1-cell stage in indicated reporter or AB line, as previously detailed (Cortes et al., 2016). Capped ezh1, dll4, and ezh2 mRNA was synthesized from commercially available constructs, linearized or PCR amplified with the SP6 promoter sequence (Horizon Discovery; see supplemental experimental procedures) using the mMessage mMachine SP6 Kit (Invitrogen) and injected (300 ng/μL) at the 1-cell stage. Injected embryos were stage-matched to control siblings.
RNA isolation, cDNA synthesis, and qPCR
RNA was isolated from whole pooled embryos (n ≥ 25 embryos/condition) using the RNAqueous Total RNA Isolation Kit (Invitrogen) and DNase-treated using the TURBO DNA-free Kit (Invitrogen). cDNA was synthesized from 1 μg of total RNA using SuperScript III First-Strand Synthesis SuperMix for qPCR (Invitrogen). For sorted cells, RNA was isolated using a RNeasy Micro Kit (Qiagen) with DNase applied directly on the column in accordance with the manufacturer's instructions. cDNA was synthesized using a SuperScript VILO cDNA Synthesis Kit (Invitrogen). Quantitative real-time PCR was performed with SYBR Green PCR Master Mix (Applied Biosystems) on an ABI7900 (Applied Biosystems); triplicate samples from n ≥ 3 clutches were run using published primers (see supplemental experimental procedures).
Zebrafish embryo dissociation and flow cytometry
Pools of embryos/larvae were dissociated by Liberase (Sigma) treatment (75 μg/mL in 1× PBS/1 mM EDTA) in a 34°C circulating water bath and resuspended in 1× PBS/1 mM EDTA. FACS was performed on an LSRFortessa (BD) with five fish per data point. Flk1−/Flt1−, Flk1+/Flt1−, Flk1+/Flt1+, Gata2b+, and Flk1+/cMyb+ cells were sorted (n ≥ 20 embryos/sample across n ≥ 3 replicate sorts) on a FACSAria II (BD) into 1× PBS containing 2% fetal bovine serum. Prior to analysis, cells were labeled with 5 nM SYTOX Red dead cell stain (Thermo Fisher Scientific), as described by Cortes et al. (2016). Data were analyzed using FlowJo X Software (BD).
Mouse yolk sac dissociation and flow cytometry
Individual yolk sacs were incubated in 100 μL of 0.125% Type I collagenase (Sigma) at 37°C for 15 min, diluted and pipetted 20× with 250 μL of 1× PBS/1 mM EDTA, and digested an additional 15 min. Samples were pipetted 20–30×, diluted with 250 μL of 1× PBS/1 mM EDTA, and filtered to single-cell suspension. Cells were blocked with 10% normal rat serum (15 min) and incubated with CD117 APC-eFluor 780 (eBioscience), CD41a PE-Cy7 (eBioscience), CD16/32 PE (eBioscience), and Ter119 APC (BD) antibodies (1:100) for 20 min on ice. Cells were washed, stained with 4,6-diamidino-2-phenylindole (DAPI; 5 μg/mL), and analyzed with an LSRII cytometer (BD). Data were analyzed using FlowJo X Software (BD).
scRNA-seq and data analysis
Single-cell collection and scRNA-seq were performed according to manufacturers' protocols, using established platforms and custom analysis tools (see supplemental experimental procedures for additional details).
Quantification and statistical analysis
Statistical analyses were performed using GraphPad Prism 8 using mean ± SEM values unless otherwise stated. Two-tailed unpaired Student's t test was used for pairwise comparisons, ANOVA for group analyses, chi-squared analysis for significance of WISH distributions (denoted as ∗p < 0.05, ∗∗p < 0.01, ∗∗∗p < 0.001, ∗∗∗∗p < 0.0001 in figures).
Data and code availability
The accession number for the scRNA-seq data reported in this paper is Gene Expression Omnibus (GEO): GSE173972.
Author contributions
R.A.S. conceived the study. M.A.T.N. carried out scRNA-seq library preparation and data analysis on sorted endothelial cells across ezh1 genotypes. M.H. performed EdU labeling and confocal imaging/analysis, and generated capped mRNA for injections. J.M.F. performed cell sorting followed by qPCR for ezh expression profiling and Ezh1 mutant mice work. G.A.Y. and K.S. generated and validated the zebrafish ezh1 mutant. E.L.d.R. analyzed in vitro RNA-seq data for GSEA. R.A.S. performed all other zebrafish experiments. T.E.N. and G.Q.D. gave experimental guidance and reviewed all data. R.A.S. and T.E.N. wrote and edited the manuscript.
Conflicts of interest
G.Q.D. holds equity interest in True North Therapeutics and 28/7 Therapeutics.
Acknowledgments
The authors would like to thank the following: BIDMC confocal imaging core; R. Mathieu and M. Paktinat at the BCH flow cytometry core; Broad Institute Walk-up Sequencing service; R. Monteiro for providing the dll4, dlc, and gata2b in situ probes; A. Siekmann for providing the Tg(-0.8flt1:tdTomato); N. Budrow for zebrafish husbandry; T.L. Long and S. Freeburg for technical assistance; T. Jenuwein for providing the Ezh1 mouse mutant line; and L. Vo, W. Goessling, C.E. Burns, V. Sankaran, I. Drummond, and D. Bauer for experimental guidance and thoughtful discussion. This work was supported by a Leukemia and Lymphoma Society Scholar award (T.E.N.), and the National Institutes of Health: F31AR071283 (G.A.Y.), R01HL152636 (T.E.N.), U01HL134812 (G.Q.D., T.E.N.), R01DK098241 (T.E.N.), R24DK092760 (G.Q.D., T.E.N.) and RC2DK120535 (G.Q.D., T.E.N.). The graphical abstract was created using Biorender.com.
Published: June 17, 2021
Footnotes
Supplemental information can be found online at https://doi.org/10.1016/j.stemcr.2021.05.014.
Supplemental information
References
- Alharbi R.A., Petterngell R., Pandha H.S., Morgan R. The role of HOX genes in normal hematopoiesis and acute leukemia. Leukemia. 2013;27:1000–1008. doi: 10.1038/leu.2012.356. [DOI] [PubMed] [Google Scholar]
- Allis C.D., Jenuwein T. The molecular hallmarks of epigenetic control. Nat. Rev. Genet. 2016;17:487–500. doi: 10.1038/nrg.2016.59. [DOI] [PubMed] [Google Scholar]
- Bertrand J.Y., Kim A.D., Violette E.P., Stachura D.L., Cisson J.L., Traver D. Definitive hematopoiesis initiates through a committed erythromyeloid progenitor in the zebrafish embryo. Development. 2007;134:4147–4156. doi: 10.1242/dev.012385. [DOI] [PMC free article] [PubMed] [Google Scholar]
- Bertrand J.Y., Chi N.C., Santoso B., Teng S., Stainer D.Y., Traver D. Haematopoietic stem cells derive directly from aortic endothelium during development. Nature. 2010;464:108–111. doi: 10.1038/nature08738. [DOI] [PMC free article] [PubMed] [Google Scholar]
- Boisset J.C., van Cappellen W., Andrieu-Soler C., Galjart N., Dzierzak E., Robin C. In vivo imaging of haematopoietic cells emerging from the mouse aortic endothelium. Nature. 2010;464:116–120. doi: 10.1038/nature08764. [DOI] [PubMed] [Google Scholar]
- Bonkhofer F., Rispoli R., Pinheiro P., Krecsmarik M., Schneider-Swales J., Tsang I.H.C., de Bruijn M., Monteiro R., Peterkin T., Patient R. Blood stem cell-forming haemogenic endothelium in zebrafish derives from arterial endothelium. Nat. Commun. 2019;10:3577. doi: 10.1038/s41467-019-11423-2. [DOI] [PMC free article] [PubMed] [Google Scholar]
- Burns C.E., Traver D., Mayhall E., Shepard J.L., Zon L.I. Hematopoietic stem cell fate is established by the Notch-Runx pathway. Genes Dev. 2005;19:2331–2342. doi: 10.1101/gad.1337005. [DOI] [PMC free article] [PubMed] [Google Scholar]
- Butko E., Distel M., Pouget C., Weijts B., Kobayashi I., Ng K., Mosimann C., Poulain F.E., McPherson A., Ni C.W. Gata2b is a restricted early regulator of hemogenic endothelium in the zebrafish embryo. Development. 2015;142:1050–1061. doi: 10.1242/dev.119180. [DOI] [PMC free article] [PubMed] [Google Scholar]
- Butko E., Pouget C., Traver D. Complex regulation of HSC emergence by the Notch signaling pathway. Dev. Biol. 2016;409:129–138. doi: 10.1016/j.ydbio.2015.11.008. [DOI] [PMC free article] [PubMed] [Google Scholar]
- Carroll K.J., Esain V., Garnaas M.K., Cortes M., Dovey M.C., Nissim S., Frechette G.M., Liu S.Y., Kwan W., Cutting C.C. Estrogen defines the dorsal ventral limit of VEGF regulation to specify the location of the hemogenic endothelial nNiche. Dev. Cell. 2014;29:437–453. doi: 10.1016/j.devcel.2014.04.012. [DOI] [PMC free article] [PubMed] [Google Scholar]
- Chen I.I., Caprioli A., Ohnuki H., Kwak H., Porcher C., Tosato G. EphrinB2 regulates the emergence of a hemogenic endothelium from the aorta. Sci. Rep. 2016;6:27195. doi: 10.1038/srep27195. [DOI] [PMC free article] [PubMed] [Google Scholar]
- Chen J., Liang X., Zhang S., Wang S., Garcia S.P., Yan P., Yu H., Li Z., Liu L., Zhang F. Two faces of bivalent domain regulate VEGFA responsiveness and angiogenesis. Cell Death Dis. 2020;11:75. doi: 10.1038/s41419-020-2228-3. [DOI] [PMC free article] [PubMed] [Google Scholar]
- Cortes M., Chen M.J., Stachura D.L., Liu S.Y., Kwan W., Wright F., Vo L.T., Theodore L.N., Esain V., Frost I.M. Developmental vitamin D availability impacts hematopoietic stem cell production. Cell Rep. 2016;17:458–468. doi: 10.1016/j.celrep.2016.09.012. [DOI] [PMC free article] [PubMed] [Google Scholar]
- Dejana E., Hirschi K.K., Simons M. The molecular basis of endothelial cell plasticity. Nat. Commun. 2017;8:14361. doi: 10.1038/ncomms14361. [DOI] [PMC free article] [PubMed] [Google Scholar]
- Ditadi A., Sturgeon C.M., Tober J., Awong G., Kennedy M., Yzaguirre A.D., Azzola L., Ng E.S., Stanley E.G., French D.L. Human definitive haemogenic endothelium and arterial vascular endothelium represent distinct lineages. Nat. Cell Biol. 2015;17:580–591. doi: 10.1038/ncb3161. [DOI] [PMC free article] [PubMed] [Google Scholar]
- Dobrzycki T., Mahony C.B., Krecsmarik M., Koyunlar C., Rispoli R., Peulen-Zink J., Gussinklo K., Fedlaoui B., de Pater E., Patient R. Deletion of a conserved Gata2 enhancer impairs haemogenic endothelium programming and adult zebrafish haematopoiesis. Commun. Biol. 2020;3:71. doi: 10.1038/s42003-020-0798-3. [DOI] [PMC free article] [PubMed] [Google Scholar]
- Dupret B., Völkel P., Vennin C., Toillon R.-A., Bourhis X.L., Angrand P.-O. The histone lysine methyltransferase Ezh2 is required for maintenance of the intestine integrity and for caudal fin regeneration in zebrafish. Biochim. Biophys. Acta. 2017;1860:1079–1093. doi: 10.1016/j.bbagrm.2017.08.011. [DOI] [PubMed] [Google Scholar]
- Eden E., Navon R., Steinfeld I., Lipson D., Yakhini Z. GOrilla: a tool for discovery and visualization of enriched GO terms in ranked gene lists. BMC Bioinformatics. 2009;10:48. doi: 10.1186/1471-2105-10-48. [DOI] [PMC free article] [PubMed] [Google Scholar]
- Espín-Palazón R., Stachura D.L., Campbell C.A., García-Moreno D., Del Cid N., Kim A.D., Candel S., Meseguer J., Mulero V., Traver D. Proinflammatory signaling regulates hematopoietic stem cell emergence. Cell. 2014;159:1070–1085. doi: 10.1016/j.cell.2014.10.031. [DOI] [PMC free article] [PubMed] [Google Scholar]
- Frame J.M., McGrath K.E., Palis J. Erythro-myeloid progenitors: “definitive” hematopoiesis in the conceptus prior to the emergence of hematopoietic stem cells. Blood Cells Mol. Dis. 2013;51:220–225. doi: 10.1016/j.bcmd.2013.09.006. [DOI] [PMC free article] [PubMed] [Google Scholar]
- Frame J.M., Kubaczka C., Long T.L., Esain V., Soto R.A., Hachimi M., Jing R., Shwartz A., Goessling W., Daley G.Q. Metabolic regulation of inflammasome activity controls embryonic hematopoietic stem and progenitor cell production. Dev. Cell. 2020;55:133–149. doi: 10.1016/j.devcel.2020.07.015. [DOI] [PMC free article] [PubMed] [Google Scholar]
- Gama-Norton L., Ferrando E., Ruiz-Herguido C., Liu Z., Guiu J., Islam A.B., Lee S.-U., Yan M., Guidos C.J., López-Bigas N. Notch signal strength controls cell fate in the haemogenic endothelium. Nat. Comm. 2015;6:8510. doi: 10.1038/ncomms9510. [DOI] [PMC free article] [PubMed] [Google Scholar]
- Gao X., Johnson K.D., Chang Y.-I., Boyer M.E., Dewey C.N., Zhang J., Bresnick E.H. Gata2 cis-element is required for hematopoietic stem cell generation in the mammalian embryo. J. Exp. Med. 2013;210:2833–2842. doi: 10.1084/jem.20130733. [DOI] [PMC free article] [PubMed] [Google Scholar]
- Gao P., Chen C., Howell E.D., Li Y., Tober J., Uzun Y., He B., Gao L., Zhu Q., Siekmann A.K. Transcriptional regulatory networks controlling the ontogeny of hematopoietic stem cells. Genes Dev. 2020;34:950–964. doi: 10.1101/gad.338202.120. [DOI] [PMC free article] [PubMed] [Google Scholar]
- Geling A., Steiner H., Willem M., Bally-Cuif L., Haass C. A gamma-secretase inhibitor blocks Notch signaling in vivo and causes a severe neurogenic phenotype in zebrafish. EMBO Rep. 2002;3:688–694. doi: 10.1093/embo-reports/kvf124. [DOI] [PMC free article] [PubMed] [Google Scholar]
- Gering M., Patient R. Hedgehog signaling is required for adult blood stem cell formation in zebrafish embryos. Dev. Cell. 2005;8:389–400. doi: 10.1016/j.devcel.2005.01.010. [DOI] [PubMed] [Google Scholar]
- Goode D.K., Obier N., Vijayabaskar M.S., Lie-A-Ling M., Lilly A.J., Hannah R., Lichtinger M., Batta K., Florkowska M., Patel R. Dynamic gene regulatory networks drive hematopoietic specification and differentiation. Dev. Cell. 2016;36:572–587. doi: 10.1016/j.devcel.2016.01.024. [DOI] [PMC free article] [PubMed] [Google Scholar]
- Huang H.T., Kathrein K.L., Barton A., Gitlin Z., Huang Y.H., Ward T.P., Hofmann O., Dibiase A., Song A., Tyekucheva S. A network of epigenetic regulators guides developmental haematopoiesis in vivo. Nat. Cell Biol. 2013;15:1516–1525. doi: 10.1038/ncb2870. [DOI] [PMC free article] [PubMed] [Google Scholar]
- Kissa K., Herbomel P. Blood stem cells emerge from aortic endothelium by a novel type of cell transition. Nature. 2010;464:112–115. doi: 10.1038/nature08761. [DOI] [PubMed] [Google Scholar]
- Lawson N.D., Scheer N., Pham V.N., Kim C.-H., Chitnis A.B., Campos-Ortega J.A., Weinstein B.A. Notch signaling is required for arterial-venous differentiation during embryonic vascular development. Development. 2001;128:3675–3683. doi: 10.1242/dev.128.19.3675. [DOI] [PubMed] [Google Scholar]
- Lizama C.O., Hawkins J.S., Schmitt C.E., Bos F.L., Zape J.P., Cautivo K.M., Borges Pinto H., Rhyner A.M., Yu H., Donohoe M.E. Repression of arterial genes in hemogenic endothelium is sufficient for haematopoietic fate acquisition. Nat. Commun. 2015;6:7739. doi: 10.1038/ncomms8739. [DOI] [PMC free article] [PubMed] [Google Scholar]
- Margueron R., Reinberg D. The Polycomb complex PRC2 and its mark in life. Nature. 2011;469:343–349. doi: 10.1038/nature09784. [DOI] [PMC free article] [PubMed] [Google Scholar]
- Margueron R., Li G., Sarma K., Blais A., Zavadil J., Woodcock C.L., Dynlacht B.D., Reinberg D. Ezh1 and Ezh2 maintain repressive chromatin through different mechanisms. Mol. Cell. 2008;32:503–518. doi: 10.1016/j.molcel.2008.11.004. [DOI] [PMC free article] [PubMed] [Google Scholar]
- McGrath K.E., Frame J.M., Fegan K.H., Bowen J.R., Conway S.J., Catherman S.C., Kingsley P.D., Koniski A.D., Palis J. Distinct sources of hematopoietic progenitors emerge before HSCs and provide functional blood cells in the mammalian embryo. Cell Rep. 2015;11:1892–1904. doi: 10.1016/j.celrep.2015.05.036. [DOI] [PMC free article] [PubMed] [Google Scholar]
- Monteiro R., Pinheiro P., Joseph N., Peterkin T., Koth J., Repapi E., Bonkhofer F., Kirmizitas A., Patient R. Transforming growth factor b drives hemogenic endothelium programming and the transition to hematopoietic stem cells. Dev. Cell. 2016;38:358–370. doi: 10.1016/j.devcel.2016.06.024. [DOI] [PMC free article] [PubMed] [Google Scholar]
- Mousavi K., Zare H., Wang A.H., Sartorelli V. Polycomb protein Ezh1 promotes RNA polymerase II elongation. Mol. Cell. 2012;45:255–262. doi: 10.1016/j.molcel.2011.11.019. [DOI] [PMC free article] [PubMed] [Google Scholar]
- Nottingham W.T., Jarratt A., Burgess M., Speck C.L., Cheng J.-F., Prabhakar S., Rubin E.M., Li P.-S., Sloane-Stanley J., Kong-A-San J. Runx1-mediated hematopoietic stem-cell emergence is controlled by a Gata/Ets/SCL-regulated enhancer. Blood. 2007;110:4188–4197. doi: 10.1182/blood-2007-07-100883. [DOI] [PMC free article] [PubMed] [Google Scholar]
- O’Carroll D., Erhardt S., Pagani M., Barton S.C., Surani M.A., Jenuwein T. The polycomb-group gene Ezh2 is required for early mouse development. Mol. Cell. Biol. 2001;21:4330–4336. doi: 10.1128/MCB.21.13.4330-4336.2001. [DOI] [PMC free article] [PubMed] [Google Scholar]
- Porcheri C., Golan O., Calero-Nieto F.J., Thambyrajah R., Ruiz-Herguido C., Wang X., Catto F., Guillén Y., Sinha R., González J. Notch ligand Dll4 impairs cell recruitment to aortic clusters and limits blood stem cell generation. EMBO J. 2020;39:e104270. doi: 10.15252/embj.2019104270. [DOI] [PMC free article] [PubMed] [Google Scholar]
- Quillien A., Moore J.C., Shin M., Siekmann A.F., Smith T., Pan L., Moens C.B., Parsons M.J., Lawson N.D. Distinct Notch signaling outputs patterns the developing arterial system. Development. 2014;141:1544–1552. doi: 10.1242/dev.099986. [DOI] [PMC free article] [PubMed] [Google Scholar]
- Robert-Moreno A., Espinosa L., de la Pompa J.L., Bigas A. RBPjkappa-dependent Notch function regulates Gata2 and is essential for the formation of intra-embryonic hematopoietic cells. Development. 2005;132:1117–1126. doi: 10.1242/dev.01660. [DOI] [PubMed] [Google Scholar]
- Rowe R.G., Mandelbaum J., Zon L.I., Daley G.Q. Engineering hematopoietic stem cells: lessons from development. Cell Stem Cell. 2016;18:707–720. doi: 10.1016/j.stem.2016.05.016. [DOI] [PMC free article] [PubMed] [Google Scholar]
- San B., Chrispijn N.D., Wittkopp N., van Heeringen S.J., Lagendijk A.K., Aben M., Bakkers J., Ketting R.F., Kamminga L.M. Normal formation of a vertebrate body plan and loss of tissue maintenance in the absence of ezh2. Sci. Rep. 2016;6:24658. doi: 10.1038/srep24658. [DOI] [PMC free article] [PubMed] [Google Scholar]
- San B., Aben M., Elurbe D.M., Voeltzke K., Den Broeder M.J., Rougeot J., Legler J., Kamminga L.M. Genetic and epigenetic regulation of zebrafish intestinal development. Epigenomes. 2018;2:19. [Google Scholar]
- Slukvin I.I., Uenishi G.I. Arterial identity of hemogenic endothelium: a key to unlock definitive hematopoietic commitment in human pluripotent stem cell cultures. Exp. Hematol. 2019;71:3–12. doi: 10.1016/j.exphem.2018.11.007. [DOI] [PMC free article] [PubMed] [Google Scholar]
- Vo L.T., Kinney M.A., Liu X., Zhang Y., Barragan J., Sousa P.M., Jha D.K., Han A., Cesana M., Shao Z. Regulation of embryonic haematopoietic multipotency by EZH1. Nature. 2018;553:506–510. doi: 10.1038/nature25435. [DOI] [PMC free article] [PubMed] [Google Scholar]
- Völkel P., Bary A., Raby L., Chapart A., Dupret B., Bourhis X.L., Angrand P.-O. Ezh1 arises from Ezh2 gene duplication but its function is not required for zebrafish development. Sci. Rep. 2019;9:4319. doi: 10.1038/s41598-019-40738-9. [DOI] [PMC free article] [PubMed] [Google Scholar]
- Xu J., Shao Z., Li D., Xie H., Kim W., Huang J., Taylor J.E., Pinello L., Glass K., Jaffe J.D. Developmental control of Polycomb subunit composition by GATA factors mediates a switch to non-canonical functions. Mol. Cell. 2015;57:304–316. doi: 10.1016/j.molcel.2014.12.009. [DOI] [PMC free article] [PubMed] [Google Scholar]
- Yette G.A., Stewart S., Stankunas K. Zebrafish Polycomb repressive complex-2 critical roles are largely Ezh2- over Ezh1-driven and concentrate during early embryogenesis. BioRxiv. 2021 doi: 10.1101/2020.12.31.424918. [DOI] [Google Scholar]
- Yzaguirre A.D., de Bruijn M.F.T.R., Speck N.A. The role of Runx1 in embryonic blood cell formation. Adv. Exp. Med. Biol. 2017;962:47–64. doi: 10.1007/978-981-10-3233-2_4. [DOI] [PMC free article] [PubMed] [Google Scholar]
- Zhao L., Borikova A.L., Ben-Yair R., Guner-Ataman B., MacRae C.A., Lee R.T., Burns C.G., Burns C.E. Notch signaling regulates cardiomyocyte proliferation during zebrafish heart regeneration. PNAS. 2014:1403–1408. doi: 10.1073/pnas.1311705111. [DOI] [PMC free article] [PubMed] [Google Scholar]
- Zovein A.C., Hofmann J.J., Lynch M., French W.J., Turlo K.A., Yang Y., Becker M.S., Zanetta L., Dejana E., Gasson J.C. Fate tracing reveals the endothelial origin of hematopoietic stem cells. Cell Stem Cell. 2008;3:625–636. doi: 10.1016/j.stem.2008.09.018. [DOI] [PMC free article] [PubMed] [Google Scholar]
Associated Data
This section collects any data citations, data availability statements, or supplementary materials included in this article.
Supplementary Materials
Data Availability Statement
The accession number for the scRNA-seq data reported in this paper is Gene Expression Omnibus (GEO): GSE173972.