

Abstract
Soluble HLA-G (sHLA-G) molecules are considered potent immunomodulators, and their dysregulated expression has been implicated in several pathological conditions, including coronavirus disease 19 (COVID-19). Therefore, a case-control study (103 COVID-19 patients and 105 controls) was performed to determine sHLA-G role in severity of COVID-19. Results revealed that median levels of sHLA-G were significantly increased in serum of patients compared to controls (19.3 vs. 12.7 ng/mL; p <0.001). When patients and controls were stratified by age group, gender, body mass index, chronic disease, or ABO and Rh blood groups, the sHLA-G level did not show a significant difference in each stratum. Logistic regression analysis demonstrated that the up-regulated expression of sHLA-G was associated with an elevated risk of developing COVID-19. Receiver operating characteristic curve analysis showed that sHLA-G was a very good predictor of COVID-19, and at a cut-off value of 15.4 ng/mL, the sensitivity and specificity of sHLA-G were 79.6 and 79.0%, respectively. Spearman rank correlation analysis revealed that sHLA-G was positively correlated with age, erythrocyte sedimentation rate, white blood cell count, and random blood glucose, while a negative correlation was recorded with vitamin D. In conclusion, up-regulated expression of sHLA-G was indicated in patients with severe COVID-19.
Keywords: Coronavirus disease 19, Soluble HLA-G, Vitamin D, Severity, Receiver operating characteristic
1. Introduction
During the past two decades, the world's populations have experienced three outbreaks of severe acute respiratory syndrome (SARS); SARS in Asia in 2002 [1], Middle East coronavirus (MERS – CoV) in Saudi Arabia in 2012 [2], and SARS-CoV-2 in China in late 2019 [3]. The latter is perhaps the most progressive SARS and has spread to 222 countries affecting millions of people worldwide, and as of June 23, 2021, there were 180,142,412 confirmed cases with 3,902,294 deaths [4]. On 11 February 2020, the World Health Organization (WHO) declared SARS-CoV-2 infection to be a pandemic public health threat with the official name coronavirus disease 19 (COVID-19) [5]. The COVID-19 can either be controlled or it can progress to a more severe disease with worsening pulmonary symptoms leading to pneumonia and acute respiratory distress syndrome with increased morbidity and mortality [6]. There are a large number of risk factors that have been identified to predispose people to COVID-19 and the severity of disease; for instance, age, gender, blood groups, obesity, chronic diseases and vitamin D status [7]. In addition, COVID-19 patients are presented with dysregulated immune responses manifested in hyper-inflammation and a cytokine storm, which are proposed to mediate the immunopathogenesis of COVID-19 and associated morbidity and mortality [8]. Therefore, understanding the immune function is fundamental to identifying the mediators that cause dysregulated immune responses and hyper- inflammation in patients with COVID-19.
The immune response against pathogens is controlled by some genetic factors associated with susceptibility or resistance to viral, bacterial, fungal and parasitic infections, in particular, those encoded by genes of the human leukocyte antigen (HLA) system, which are mapped to the short arm of human chromosome 6 [9]. The HLA genes are organized into three classes (I, II and III), and their products perform integral functions in innate and adaptive immune responses. The classical class I (A, B and C) and class II (DR, DQ and DP) HLA molecules are involved in mediating antigen presentation of intracellular and extracellular peptides, respectively [10]. Non-classical class I HLA molecules (E, F, and G) are other important products encoded by genes in the HLA region, and constitute the core molecules involved in controlling the immune response to infectious agents, as well as inflammatory reactions [11].
HLA-G antigens are among the non-classical class I HLA glycoproteins that were first distinguished by their expression at the maternal-fetal interface to protect the fetus from the maternal immune system [12]. Seven isoforms of HLA-G have been recognized, including four membrane-bound antigens (HLA-G1, -G2, -G3 and -G4) and three soluble molecules (sHLA-G5, -G6 and -G7) [13]. These molecules are considered potent immunomodulators, and their dysregulated expression has been implicated in several pathological conditions [14]. In viral infection, two hypotheses have been proposed to explain the role of HLA-G in virus immunopathogenesis. HLA-G may enhance immune escape of the virus, and this is supported by HLA-G's immunosuppressive properties. Conversely, HLA-G expression and/or secretion may reflect a robust response to inflammatory reactions that occur during viral infections [15]. In the context of COVID-19, the role of HLA-G in immunopathology of disease has not been well investigated. However, there have been some suggestions that HLA-G molecules may have immune-regulating effects in COVID-19 [16], [17], [18], [19]. Therefore, this study sought to explore the role of sHLA-G in immunopathogenesis of COVID-19 in severely-ill patients.
2. Materials and methods
2.1. Patients and controls
A total sample of 208 subjects was included in a case-control study (103 COVID-19 patients and 105 healthy controls). The patients were admitted to three hospitals in Baghdad (Dar Al-Salam Field Hospital, Al-Karkh General Hospital and Al-Furat General Hospital) during the period from September to December 2020, and they showed signs and symptoms of COVID-19. Laboratory diagnosis of COVID-19 was performed on nasopharyngeal swabs using the RealLine SARS-CoV-2 kit (Bioron Diagnostics GmbH). In addition, a chest tomography (CT) scan was performed to confirm the diagnosis. Patients were studied 4–7 days after admission, and only those with a positive molecular test and CT scan indicating COVID-19 were included. In the initial plan of our study, we considered identifying all patient groups in the hospital, but we found that the wards mostly contained severe cases, and mild cases tended to leave the hospital. Therefore, only severe cases were included for initial evaluation. The severity was determined according to the world health organization (WHO) Interim Guidance [20]. According to this guidance, the infection was considered severe if the patient met one of the following conditions: severe respiratory distress, respiratory rate ≥ 30 breaths/minute and pulse oxygen saturation (SpO2) ≤ 93% on resting state. Patients were characterized for age, gender, body mass index (BMI), ABO and Rh blood group systems, chronic diseases (cardiovascular and diabetes), C-reactive protein (CRP), erythrocyte sedimentation rate (ESR), hemoglobin (Hb), platelet count, white blood cell count (WBC), random blood glucose (RBG) and vitamin D status (Table 1 ). The healthy controls were blood donors and health service personnel. Their serum was negative for antibodies to viruses (human hepatitis viruses, HIV and SARS-CoV-2) and CRP. Besides, their ESR was <20 mm/h, they had no respiratory infection in the past 12 months, and they did not suffer from chronic disease such as respiratory allergy, diabetes or cardiovascular disease. Written consent was obtained from participants after approval of the Ethics Committee at the Iraqi Ministry of Health and Environment.
Table 1.
Baseline characteristics of COVID-19 cases and controls.
| Characteristic | Cases; n = 103 | Controls; n = 105 | p-value | |
|---|---|---|---|---|
| Age; years | 57.0 (47.0–66.0) | 32.0 (25.0–39.0) | <0.001 | |
| Age groups; years | <45 | 20 (19.4) | 92 (87.6) | <0.001 |
| ≥ 45 | 83 (80.6) | 13 (12.4) | ||
| Gender | Male | 76 (73.8) | 73 (69.5) | 0.495 |
| Female | 27 (26.2) | 32 (30.5) | ||
| Body mass index; kg/m2 | Normal weight | 28 (27.2) | 39 (37.1) | 0.124 |
| Overweight/obese | 75 (72.8) | 66 (62.9) | ||
| ABO system | A | 34 (33.0) | 31 (29.5) | 0.713 |
| B | 17 (16.5) | 24 (22.9) | ||
| AB | 14 (13.6) | 14 (13.3) | ||
| O | 38 (36.9) | 36 (34.3) | ||
| Rh system | Positive | 84 (81.6) | 90 (85.7) | 0.658 |
| Negative | 19 (18.4) | 15 (14.3) | ||
| Chronic diseases | Cardiovascular | 30 (29.1) | 0 (0.0) | |
| Diabetes | 9 (8.7) | 0 (0.0) | ||
| Cardiovascular/diabetes | 20 (19.4) | 0 (0.0) | ||
| No disease | 44 (42.7) | 100 (100.0) | ||
| C-reactive protein | Negative | 0 (0.0) | 105 (100.0) | |
| Positive | 103 (100.0) | 0 (0.0) | ||
| Erythrocyte sedimentation rate; mm/hour | 57.0 (39.0–80.0) | 9.0 (6.0–13.0) | <0.001 | |
| Hemoglobin, g/dL | 14.3 ± 9.8 | 13.4 ± 1.8 | 0.356 | |
| Platelets ×109/L | 282.9 ± 135.9 | 273.2 ± 95.5 | 0.554 | |
| White blood cell count ×109/L | 12.3 ± 5.2 | 9.4 ± 1.9 | <0.001 | |
| Random blood glucose; mg/dL | 185.0 (144.0–290.0) | 93.0 (87.0–106.0) | <0.001 | |
| Vitamin D (25OHD3); ng/mL | 41.2 (35.6–47.9) | 49.2 (46.4–52.3) | <0.001 | |
Values were given as median followed by interquartile range (25 – 75%) in parentheses (non-parametric variable), mean ± standard deviation (parametric variable) or number followed by percentage in parentheses (categorical variable). p: Probability of Mann-Whitney U test (to compare non-parametric variables), least significant difference test (to compare parametric variables) or Pearson Chi-square test (to compare categorical variables). Significant p-value is indicated in bold.
2.2. Determination of sHLA-G
Serum level of HLA-G was determined using a sandwich enzyme-linked immunosorbent assay (ELISA) kit designed for quantitative detection of total HLA-G in serum, plasma, cell culture supernatant, cell lysates and tissue homogenates. Instructions of manufacturer were followed to determine HLA-G level (Cat. No E0443Hu, Bioassay Technology Laboratory, China). Briefly, the provided plate was pre-coated with anti-human HLA-G antibody. Standards and serum samples were added to pre-assigned wells in the plate, and after an incubation period, biotinylated anti-human HLA-G antibody was added. This was followed by the addition of streptavidin-horseradish peroxidase. After incubation, the wells were washed and then a substrate solution was added. A color proportional to the HLA-G concentration was developed. The reaction was terminated with an acidic stop solution and absorbance was measured at 450 nm. Concentrations of standards were plotted against their respective absorbances, and then a curve-fitting equation was obtained and used to calculate the HLA-G level of unknown samples. The standard curve range of the kit was 0.3 – 90 ng/mL.
2.3. Statistical analysis
The statistical analysis was performed using IBM SPSS Statistics 25.0 (Armonk, NY: IBM Corp.) and GraphPad Prism version 8.0.0 (San Diego, California USA). Categorical variables were given as number and percent, and significant differences were assessed using two-tailed Fisher exact or Chi-square test. Continuous variables were tested for normality (Kolmogorov-Smirnov and Shapiro-Wilk tests). Parametric variables (i.e. normally distributed) were expressed as mean ± standard deviation (SD), and significant differences were tested using least significant difference test. Non-parametric variables were given as median and interquartile range (IQR: 25 – 75%), and significant differences were determined using Mann-Whitney U (to compare two groups) or Kruskal-Wallis (to compare more than two groups) test. Multinomial logistic regression analysis was performed to estimate odds ratio (OR) and 95% confidence interval (CI) after classifying sHLA-G levels into four quartiles, which were 1 (<25%), 2 (25–50%), 3 (>50–75%) and 4 (>75%). Four models were followed to perform the analysis; I (unadjusted), II (adjusted for age), III (adjusted for age and gender) and IV (adjusted for age, gender and BMI). Receiver operating characteristic (ROC) curve analysis was performed to determine area under the curve (AUC), 95% CI, cut-off value, sensitivity and specificity. The Youden index was used to select the best cut-off value. Spearman rank correlation analysis was applied to estimate correlation coefficient between study variables. A probability (p) value ≤ 0.05 was taken statistically significant. The p-value was corrected (pc) due to multiple comparisons using Bonferroni correction.
3. Results
3.1. Baseline characteristics
A significant increase in median age was observed in COVID-19 patients compared to controls (57 vs. 32; p <0.001). Further, the patients and controls were divided into two age groups (<45 and ≥ 45 years). It was found that most patients were classified under the age group ≥ 45 years (80.6%), while most of controls were classified under the age group <45 years (87.6%). This difference was significant (p <0.001). Stratification by gender, BMI, and blood groups ABO and Rh did not reveal significant differences between patients and controls. Patients were characterized by increased incidence of cardiovascular disease and diabetes (57.2%), and this was accompanied by a significant increase in the median level of RBG compared to controls (185 vs. 93 mg/dL; p <0.001). ESR and WBC were also significantly increased in patients (57 vs. 9 mm/h and 12.3 vs. 9.4×10⁹/L, respectively; p <0.001), while median levels of vitamin D were significantly decreased (41.2 vs. 49.2 ng/mL; p <0.001) (Table 1).
3.2. Serum level of sHLA-G
The median levels of sHLA-G were significantly increased in serum of COVID-19 patients compared to controls (19.3 vs. 12.7 ng/mL; p <0.001) (Fig. 1 ). When patients and controls were stratified by gender, BMI, chronic disease, or ABO and Rh blood groups, the sHLA-G level did not show a significant difference in each stratum (Table 2 ). Regarding age groups (<45 and ≥ 45 years), although their frequencies showed a significant difference between patients and controls, neither the patients nor the controls showed a significant difference in sHLA-G level between these age groups (Fig. 2 ). Logistic regression analysis revealed that patients in the quartiles >50–75% and >75% of sHLA-G level were more likely to have COVID-19 even after adjusting the analysis for age, gender and BMI (Model IV); the estimated OR under this model was 11.56 (95% CI = 3.15–42.37; p <0.001) and 43.34 (95% CI = 9.63–195.12; p <0.001), respectively (Table 3 ).
Fig. 1.

Scatter dot plot of soluble HLA-G (sHLA-G) levels in serum of COVID-19 cases and healthy control subjects. The horizontal lines indicate the median concentration for each group, while vertical lines denote interquartile range (IQR). The difference between COVID-19 cases and controls was assessed by the non-parametric Mann-Whitney U test.
Table 2.
Median levels of soluble HLA-G in serum of COVID-19 cases and controls stratified by some characteristics.
| Characteristic | HLA-G median (IQR: 25% − 75%); ng/mL |
||
|---|---|---|---|
| Cases; n = 103 | Controls; n = 105 | ||
| Gender | Male | 18.8 (15.5–22.1) | 12.7 (10.8–15.1) |
| Female | 20.5 (16.9–30.5) | 13.3 (10.8–15.3) | |
| p-value | 0.141 | 0.551 | |
| Body mass index; kg/m2 | Normal weight | 20.8 (17.5–26.4) | 14.1 (11.9–15.5) |
| Overweight/obese | 19.0 (15.4–21.7) | 12.4 (10.4–14.9) | |
| p-value (pc) | 0.102 | 0.129 | |
| ABO system | A | 19.0 (16.2–24.1) | 14.1 (11.9–15.8) |
| B | 19.3 (16.3–20.0) | 13.2 (10.0–16.0) | |
| AB | 19.8 (14.6–22.4) | 12.4 (11.0–14.6) | |
| O | 19.6(16.9–22.4) | 11.9 (10.3–14.4) | |
| p-value (pc) | 0.991 | 0.106 | |
| Rh system | Positive | 19.0 (15.8–22.2) | 12.9 (10.8–15.3) |
| Negative | 20.2 (17.7–28.9) | 11.8 (9.5–14.3) | |
| p-value (pc) | 0.366 | 0.358 | |
| Chronic diseases | Cardiovascular | 19.3 (15.7–24.3) | NA |
| Diabetes | 18.7 (15.4–25.0) | NA | |
| Cardiovascular/diabetes | 19.7 (17.7–23.1) | NA | |
| No disease | 19.0 (10.4–21.1) | NA | |
| p-value | 0.545 | ||
IQR: Interquartile range; p: Probability of Mann-Whitney U test (to compare two groups) or Kruskal-Wallis test (to compare more than two groups); pc: The probability value is adjusted by the Bonferroni correction for multiple tests. Significant p-value is indicated in bold.
Fig. 2.

Scatter dot plot of soluble HLA-G (sHLA-G) levels in serum of COVID-19 cases and healthy control subjects stratified by age groups. The horizontal lines indicate the median concentration for each group, while vertical lines denote interquartile range (IQR). The difference between age groups was assessed by the non-parametric Mann-Whitney U test.
Table 3.
Multinomial logistic regression analysis of sHLA-G between COVID-19 patients and controls.
| Model | Analysis | Serum level of sHLA-G; ng/mL |
|||
|---|---|---|---|---|---|
| Quartile 1 (<25%) | Quartile 2 (25–50%) | Quartile 3 (>50–75%) | Quartile 4 (>75%) | ||
| I | OR (95% CI) | Reference | 1.75 (0.66–4.66) | 12.09 (4.64–31.50) | 41.21 (13.22–128.49) |
| p-value | 0.265 | <0.001 | <0.001 | ||
| II | OR (95% CI) | Reference | 1.46 (0.40–5.30) | 8.88 (2.51–31.40) | 26.78 (6.53–109.79) |
| p-value | 0.562 | 0.001 | <0.001 | ||
| III | OR (95% CI) | Reference | 1.47 (0.41–5.29) | 9.04 (2.58–31.72) | 29.39 (7.05–122.58) |
| p-value | 0.552 | 0.001 | <0.001 | ||
| IV | OR (95% CI) | Reference | 1.73 (0.47–6.34) | 11.56 (3.15–42.37) | 43.34 (9.63–195.12) |
| p-value | 0.401 | <0.001 | <0.001 | ||
Model I: Unadjusted analysis; Model II: Adjusted for age; Model III: Adjusted for age and gender; Model IV: Adjusted for age, gender and body mass index; OR: Odds ratio; CI: Confidence interval; p: Probability (significant p-value is indicated in bold).
3.3. ROC curve analysis
ROC curve analysis revealed that up-regulated level of sHLA-G was a very good predictor of COVID-19. The AUC was 0.871 (95% CI = 0.822 – 0.919; p <0.001). At a cut-off value of 15.4 ng/mL (optimized by the Youden index), the sensitivity and specificity of sHLA-G were 79.6 and 79.0%, respectively (Fig. 3 ).
Fig. 3.
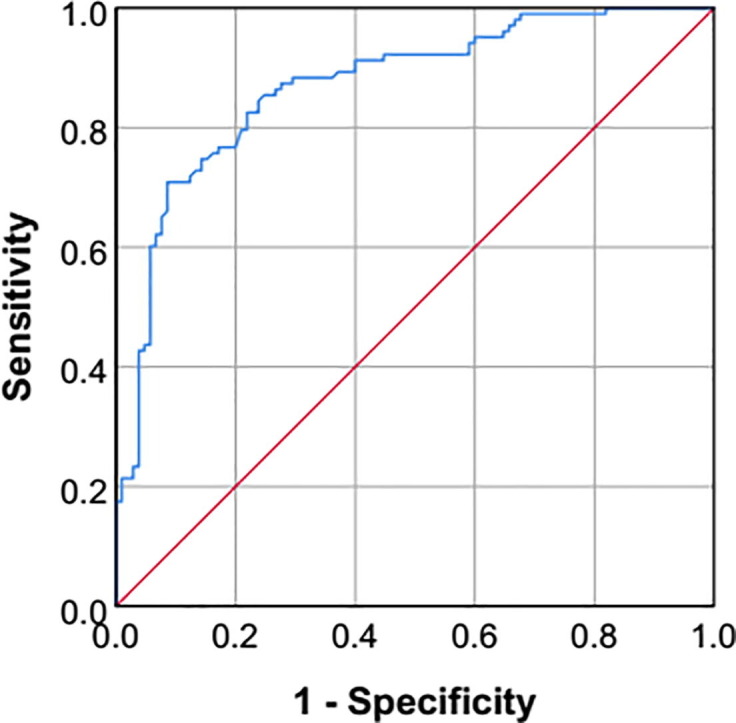
Receiver operating characteristic (ROC) curve plot of soluble HLA-G for predicting COVID-19 (Area under curve = 0.871; 95% confidence interval = 0.822 – 0.919; p-value <0.001; Youden index = 0.586; Cut-off value = 15.4 ng/mL; Sensitivity = 79.6%; Specificity = 79.0%).
3.4. Spearman rank correlation
Spearman rank correlation analysis revealed that sHLA-G was positively correlated with age, ESR, WBC and RBG (correlation coefficient = 0.495, 0.558, 0.204 and 0.501, respectively; p <0.01), while a negative correlation was recorded with vitamin D (correlation coefficient = -0.155; p <0.01) (Table 4 ).
Table 4.
Spearman rank correlation analysis between study variables.
| Variable | sHLA-G | Age | ESR | WBC | RBG | Vitamin D |
|---|---|---|---|---|---|---|
| sHLA-G | 1.000 | 0.495** | 0.558** | 0.204** | 0.501** | −0.155* |
| Age | 1.000 | 0.657** | 0.302** | 0.656** | −0.294** | |
| ESR | 1.000 | 0.370** | 0.665** | −0.362** | ||
| WBC | 1.000 | 0.180** | −0.181** | |||
| RBG | 1.000 | −0.346** | ||||
| Vitamin D | 1.000 |
ESR: Erythrocyte sedimentation rate; WBC: White blood cell count; RBG: Random blood glucose.
Correlation is significant at the 0.05 level (2-tailed).
Correlation is significant at the 0.01 level (2-tailed).
4. Discussion
The median age of the patients recruited was 57 years, and thus age is indicated as a critical risk factor for the development of COVID1-19 and progression to severe disease. Previous studies have also documented that severity and outcome of COVID-19 depends largely on age of patients, with adults in their sixth decade of life accounting for majority of hospitalizations and having a higher risk of death than younger adults [21]. This may be related to two immune phenomena linked to aging, immunosenescence and cellular senescence, which can cause impaired immunological responses to SARS-CoV-2 and increased systemic inflammation due to irreversible cell cycle arrest [22]. Besides, age-related morbidities, such as cardiovascular disease and diabetes, may also increase susceptibility to COVID-19 and are likely to be associated with a more severe illness [23]. These findings are reinforced in the current study and >50% of COVID-19 patients had chronic diseases (cardiovascular disease and diabetes). Further, their RBG was 185 mg/dL, which is indicative of pre-diabetes according the American Diabetes Association Criteria [24]. Consistent with our observation, it has been found that hyperglycemia occurred in 33.2% of COVID-19 patients during hospitalization, and the proportion was higher in severe cases compared to non-severe cases (45.4 vs. 21.5%) [25]. Accordingly, it has been hypothesized that the SARS-CoV-2 may reduce insulin secretion through its effects on pancreatic β-cell function [26]. The COVID-19 receptor (ACE2: angiotensin-converting enzyme 2) has been shown to be expressed by pancreatic cells, as well as other metabolic organs and tissues (for instance, adipose tissue, intestine and kidneys). Therefore, the virus may cause multidirectional changes in glucose metabolism that could complicate pre-existing diabetes or lead to the development of hyperglycemia in non-diabetic patients [27]. It has also been demonstrated that COVID-19 patients are markedly characterized by elevated serum levels of pro-inflammatory cytokines; for instance, interleukin-1 (IL-1), IL-6, IL-12, interferon-gamma (IFN-γ) and tumor necrosis factor-alpha (TNF-α) [28]. Inflammation due to high production of cytokines may lead to insulin resistance. Furthermore, these cytokines may impair insulin production by pancreatic β-cell [29].
This study also revealed that patients with severe COVID-19 had a significantly lower serum level of vitamin D compared to controls. Thus, it can be indicated that this vitamin represents an additional risk factor for disease progression and severity. Vitamin D is an essential food supplement that contributes to maintaining good health and preventing diseases, especially respiratory diseases. Low levels of vitamin D have been associated with an elevated risk of developing pneumonia and viral upper respiratory infections [30]. In the case of COVID-19, vitamin D can be considered as a protective factor due to its role in regulating the production of pro-inflammatory cytokines from pulmonary epithelial cells and macrophages, as well as in suppressing the cytokine storm, which is associated with immunopathogenesis of SARS-Cov-2 infection [31]. These beneficial effects in improving COVID-19 outcomes have been experimentally demonstrated, and patients who received adjunctive Pulse D therapy (vitamin D) showed a significant reduction in inflammatory markers associated with the clinical course of disease [32].
In addition to age, cardiovascular disease, diabetes and vitamin D status, sHLA-G can be considered an additional risk factor linked to COVID-19 immunopathogenesis. Levels of sHLA-G were significantly up-regulated in serum of patients with severe COVID-19 compared to controls. Patients who were high producers of sHLA-G were 14.73-folds more likely to develop COVID-19 compared to the low producers. Moreover, the ROC curve analysis demonstrated the predictive significance of sHLA-G in differentiating between COVID-19 patients and controls. (AUC = 0.871). However, there is a point of concern regarding age mismatch between patients and controls; the median age of patients was 57 years, while it was 32 years in controls. To test the hypothesis that sHLA-G might be affected by age, patients and controls were divided into two age groups (<45 and 45 years), and sHLA-G serum levels were examined in these groups. It was found that both age groups of patients showed a significant increase in sHLA-G levels compared to corresponding groups in controls. Further, there was no significant difference between the age groups of patients or controls (Fig. 2). This may indicate that age had no effect on sHLA-G, and that the observed up-regulated level of these molecules was associated with the risk of COVID-19 infection regardless of age. In addition, sHLA-G level was also not affected by gender, BMI, or ABO and Rh blood group systems, and this may confirm the significance of sHLA-G in immunopathogenesis of COVID-19.
There is no direct evidence to support or refute these findings, but several studies have indicated that HLA-G plays a prominent role in controlling the pathogenesis of a number of autoimmune and inflammatory diseases, such as inflammatory bowel disease, celiac disease, psoriasis, asthma, rheumatoid arthritis, juvenile idiopathic arthritis and systemic lupus erythematosus [14]. The main function of sHLA-G is to inhibit innate and adaptive immune responses by interacting with its ligands on target cells to transmit inhibitory signals. Natural killer cells, CD4 + and CD8 + T cells, B cells, macrophages, dendritic cells and neutrophils are among the target cells functionally influenced by sHLA-G. Thus, most features of the immune response, including differentiation, proliferation, cell lysis, cytokine production, and immunoglobulin release, can be inhibited by sHLA-G [15], [33]. This is apparent in viral infections and patients infected with human immunodeficiency virus [34], human cytomegalovirus [35], herpes simplex type I virus [36], H1N1 influenza virus [37] or hepatitis B virus [38] have shown up-regulated expression of cell-bound HLA-G or sHLA-G molecules, which were associated with persistent viral infection. On the contrary, a down-regulated expression of the HLA-G5 isoform was found in cervical cancer cases infected with human papillomavirus [39]. Therefore, increased expression of sHLA-G may enhance the virus ability to escape from immune mechanisms; otherwise, sHLA-G secretion may represent an exaggerated immune response to counteract the inflammatory response during viral infection [15]. In COVID-19, the first indication of HLA-G involvement in COVID-19 was documented by Zhang and colleagues. The authors followed the dynamics of peripheral immune cells (WBC, neutrophils, monocytes, B cells and CD4 + and CD8 + T cells), cytokines (IL-4, IL-6, IFN-γ and TNF-α) and HLA-G and its inhibitory receptors immunoglobulin-like transcript (ILT) 2, ILT4- and KIR2DL4 (killer cell immunoglobulin-like receptor, two immunoglobulin domains and long cytoplasmic tail four) in a patient with severe COVID-19 pneumonia up to the recovery period. Their data indicated that frequency of HLA-G + T cells, B cells and monocytes followed the pattern high-low–high, while frequency of cells expressing the receptors ILT2, ILT4 and KIR2DL4 remained relatively stable [17]. Next, Zidi proposed that HLA-G molecules could be considered as potent determinants in inhibiting immune cell functions during SARS-CoV2 infection, thereby promoting virus subversion [18]. Fraga-Silva and colleagues also suggested that HLA-G expression induced by SARS-CoV2 may be associated with increased morbidity and mortality, and increased expression of HLA-G in COVID-19 patients may predict a worse outcome [19]. In a man infected with SARS-CoV-2, HLA-G expression was found in epithelial cells of the intestinal mucosa and in some local lymphocytes. The authors concluded that HLA-G is involved in the viral immune escape mechanism, as well as in neoangiogenesis, and this may cause COVID-19-dependent hemorrhage [16]. Besides, a genome-wide association study in critically-ill patients with COVID-19 from the UK identified that the HLA-G variant rs9380142 was associated with susceptibility to disease [40]. These observations may suggest that the expression pattern and genetic variants of HLA-G in COVID-19 is warranted to guide research to understand the mechanisms involved in disease control. However, it has been commented that HLA-G expression in COVID-19 is a complex process influenced by various factors, including infection stage, HLA-G variants, administered therapy and cytokine profile, which may create an immunological environment involved in determining the outcome of COVID-19 [19].
The up-regulated level of sHLA-G was positively correlated with age, ESR, WBC and RBG. The relationship between sHLA-G and age has not been well presented and conflicting results were found. In healthy Malian individuals, a negative correlation was found between sHLA-G and age, and those aged 3–25 years showed significantly higher levels of sHLA-G compared to individuals over 26 years of age [41]. Further, no correlation was found between age and sHLA-G in bone marrow plasma samples of healthy Italian donors [42]. The median age of the current COVID-19 patients was 57 years and this may explain the positive correlation between sHLA-G and age, especially if we take into account the observations that SARS-CoV-2 can induce the expression of sHLA-G and also disproportionally affect the elderly [19], [21]. With regard to WBC and ESR, the results may be justified because both are biomarkers of inflammation [43], and sHLA-G molecules are involved in modulating inflammatory responses [13]. In the case of RBG, it has been demonstrated that sHLA-G was more frequent in patients with type 2 diabetes mellitus or impaired glucose tolerance than in normal glucose tolerance. Moreover, plasma levels of sHLA-G were gradually elevated across glucose tolerance classes [44]. In contrast to these positive correlations, sHLA-G showed a negative correlation with vitamin D. This may indicate that up-regulation of sHLA-G and down-regulation of vitamin D could contribute to viral persistence in COVID-19 patients, because it is suggested that the outcomes of both changes are linked to immunosuppressive effects, and these effects are associated with an increased risk of developing COVID-19 [13], [19], [31], [45]. The presented correlations have not been well defined in COVID-19 and further studies are warranted to understand their mechanisms.
The study suffered from a number of limitations. First, the patients were not monitored for the level of sHLA-G from admission until recovery. Second, the profile of pro- and anti-inflammatory cytokines was not determined. Third, the viral load was not taken into account in the analysis. Fourth, patients with asymptomatic, moderate and critical COVID-19 were not investigated. Fifth, the low sample size of patients (particularly the age group <45 years) and controls (particularly the age group ≥ 45 years) was an important limitation of the study.
In conclusion, sHLA-G showed up-regulated expression in the serum of patients with severe COVID-19. This up-regulation was positively correlated with age, ESR, WBC and RBG, while it was negatively correlated with vitamin D status.
Declaration of Competing Interest
The authors declare that they have no known competing financial interests or personal relationships that could have appeared to influence the work reported in this paper.
Acknowledgments
We appreciate the kind assistance and cooperation of the medical staff at Dar Al-Salam Field Hospital, Al-Karkh General Hospital and Al-Furat General Hospital.
References
- 1.LAM W.K., ZHONG N.S., TAN W.C. Overview on SARS in Asia and the World. Respirology. 2003;8(s1):S2–S5. doi: 10.1046/j.1440-1843.2003.00516.x. [DOI] [PMC free article] [PubMed] [Google Scholar]
- 2.N. Ramadan, H. Shaib, Middle east respiratory syndrome coronavirus (MERS-COV): A review, GERMS. 9 (2019) 35–42. 10.18683/germs.2019.1155. [DOI] [PMC free article] [PubMed]
- 3.Zheng J. SARS-coV-2: An emerging coronavirus that causes a global threat. Int. J. Biol. Sci. 2020;16:1678–1685. doi: 10.7150/ijbs.45053. [DOI] [PMC free article] [PubMed] [Google Scholar]
- 4.Worldometer, Coronavirus update (Live), (2021). https://www.worldometers.info/coronavirus/(accessed April 29, 2021).
- 5.World Health Organization, Naming the coronavirus disease (COVID-19) and the virus that causes it, (2021). https://www.who.int/emergencies/diseases/novel-coronavirus-2019/technical-guidance/naming-the-coronavirus-disease-(covid-2019)-and-the-virus-that-causes-it (accessed May 22, 2021).
- 6.Attaway A.H., Scheraga R.G., Bhimraj A., Biehl M., Hatipoğ Lu U. Severe covid-19 pneumonia: Pathogenesis and clinical management. BMJ. 2021;372 doi: 10.1136/bmj.n436. [DOI] [PubMed] [Google Scholar]
- 7.Fakhroo A.D., Al Thani A.A., Yassine H.M. Markers Associated with COVID-19 Susceptibility, Resistance, and Severity. Viruses. 2020;13:1–18. doi: 10.3390/v13010045. [DOI] [PMC free article] [PubMed] [Google Scholar]
- 8.Tahaghoghi-Hajghorbani S., Zafari P., Masoumi E., Rajabinejad M., Jafari-Shakib R., Hasani B., Rafiei A. The role of dysregulated immune responses in COVID-19 pathogenesis. Virus Res. 2020;290 doi: 10.1016/j.virusres.2020.198197. [DOI] [PMC free article] [PubMed] [Google Scholar]
- 9.Crux N.B., Elahi S. Human Leukocyte Antigen (HLA) and immune regulation: How do classical and non-classical HLA alleles modulate immune response to human immunodeficiency virus and hepatitis C virus infections? Front. Immunol. 2017;8:1. doi: 10.3389/fimmu.2017.00832. [DOI] [PMC free article] [PubMed] [Google Scholar]
- 10.Wieczorek M., Abualrous E.T., Sticht J., Álvaro-Benito M., Stolzenberg S., Noé F., Freund C. Major histocompatibility complex (MHC) class I and MHC class II proteins: Conformational plasticity in antigen presentation. Front. Immunol. 2017;8:1. doi: 10.3389/fimmu.2017.00292. [DOI] [PMC free article] [PubMed] [Google Scholar]
- 11.Halenius A., Gerke C., Hengel H. Classical and non-classical MHC i molecule manipulation by human cytomegalovirus: So many targets But how many arrows in the quiver? Cell. Mol. Immunol. 2015;12:139–153. doi: 10.1038/cmi.2014.105. [DOI] [PMC free article] [PubMed] [Google Scholar]
- 12.Djurisic S., Hviid T.V.F. HLA class Ib molecules and immune cells in pregnancy and preeclampsia. Front. Immunol. 2014;5:652. doi: 10.3389/fimmu.2014.00652. [DOI] [PMC free article] [PubMed] [Google Scholar]
- 13.Alegre E., Rizzo R., Bortolotti D., Fernandez-Landázuri S., Fainardi E., González A. Some basic aspects of HLA-G biology. J. Immunol. Res. 2014;2014 doi: 10.1155/2014/657625. [DOI] [PMC free article] [PubMed] [Google Scholar]
- 14.Morandi F., Rizzo R., Fainardi E., Rouas-Freiss N., Pistoia V. Recent advances in our understanding of HLA-G biology: Lessons from a wide spectrum of human diseases. J. Immunol. Res. 2016;2016 doi: 10.1155/2016/4326495. [DOI] [PMC free article] [PubMed] [Google Scholar]
- 15.Amiot L., Vu N., Samson M. Immunomodulatory properties of HLA-G in infectious diseases. J. Immunol. Res. 2014;2014 doi: 10.1155/2014/298569. [DOI] [PMC free article] [PubMed] [Google Scholar]
- 16.Rizzo Roberta, Neri Luca Maria, Simioni Carolina, Bortolotti Daria, Occhionorelli Savino, Zauli Giorgio, Secchiero Paola, Semprini Chiara Marina, Laface Ilaria, Sanz Juana Maria, Lanza Giovanni, Gafà Roberta, Passaro Angelina. SARS-CoV-2 nucleocapsid protein and ultrastructural modifications in small bowel of a 4-week-negative COVID-19 patient. Clin. Microbiol. Infect. 2021;27(6):936–937. doi: 10.1016/j.cmi.2021.01.012. [DOI] [PMC free article] [PubMed] [Google Scholar]
- 17.Zhang S., Gan J., Chen B.G., Zheng D., Zhang J.G., Lin R.H., Zhou Y.P., Yang W.Y., Lin A., Yan W.H. Dynamics of peripheral immune cells and their HLA-G and receptor expressions in a patient suffering from critical COVID-19 pneumonia to convalescence. Clin. Transl. Immunol. 2020;9 doi: 10.1002/cti2.1128. [DOI] [PMC free article] [PubMed] [Google Scholar]
- 18.Zidi I. Puzzling out the COVID-19: Therapy targeting HLA-G and HLA-E. Hum. Immunol. 2020;81:697–701. doi: 10.1016/j.humimm.2020.10.001. [DOI] [PMC free article] [PubMed] [Google Scholar]
- 19.de T.F., Fraga-Silva C., Maruyama S.R., Sorgi C.A., de E.M., Russo S., Fernandes A.P.M., de Barros Cardoso C.R., Faccioli L.H., Dias-Baruffi M., Bonato V.L.D. COVID-19: Integrating the Complexity of Systemic and Pulmonary Immunopathology to Identify Biomarkers for Different Outcomes. Front. Immunol. 2021;11:3887. doi: 10.3389/fimmu.2020.599736. [DOI] [PMC free article] [PubMed] [Google Scholar]
- 20.World Health Organization, Clinical management of severe acute respiratory infection when novel coronavirus (2019-nCoV) infection is suspected: interim guidance 28 January 2020, Who. (2020) 10. WHO/2019-nCoV/clinical/2020.5%0ACC BY-NC-SA 3.0 IGO%0AWHO/2019-nCoV/clinical/2020.5%0ACC BY-NC-SA 3.0 IGO%0Ahttps://apps.who.int/iris/handle/10665/330893e.
- 21.A.L. Mueller, M.S. Mcnamara, D.A. Sinclair, Why does COVID-19 disproportionately affect older people?, Aging (Albany. NY). 12 (2020) 9959–9981. 10.18632/aging.103344. [DOI] [PMC free article] [PubMed]
- 22.Zhou D., Borsa M., Simon A.K. Hallmarks and detection techniques of cellular senescence and cellular ageing in immune cells. Aging Cell. 2021;20 doi: 10.1111/acel.13316. [DOI] [PMC free article] [PubMed] [Google Scholar]
- 23.Sanyaolu Adekunle, Okorie Chuku, Marinkovic Aleksandra, Patidar Risha, Younis Kokab, Desai Priyank, Hosein Zaheeda, Padda Inderbir, Mangat Jasmine, Altaf Mohsin. Comorbidity and its Impact on Patients with COVID-19. SN Compr. Clin. Med. 2020;2(8):1069–1076. doi: 10.1007/s42399-020-00363-4. [DOI] [PMC free article] [PubMed] [Google Scholar]
- 24.Diabetes Care. 2019;42:S13–S28. doi: 10.2337/dc19-S002. [DOI] [PubMed] [Google Scholar]
- 25.Li Xiaochen, Xu Shuyun, Yu Muqing, Wang Ke, Tao Yu, Zhou Ying, Shi Jing, Zhou Min, Wu Bo, Yang Zhenyu, Zhang Cong, Yue Junqing, Zhang Zhiguo, Renz Harald, Liu Xiansheng, Xie Jungang, Xie Min, Zhao Jianping. Risk factors for severity and mortality in adult COVID-19 inpatients in Wuhan. J. Allergy Clin. Immunol. 2020;146(1):110–118. doi: 10.1016/j.jaci.2020.04.006. [DOI] [PMC free article] [PubMed] [Google Scholar]
- 26.Ceriello A. Hyperglycemia and COVID-19: What was known and what is really new? Diabetes Res. Clin. Pract. 2020;167 doi: 10.1016/j.diabres.2020.108383. [DOI] [PMC free article] [PubMed] [Google Scholar]
- 27.Rubino Francesco, Amiel Stephanie A., Zimmet Paul, Alberti George, Bornstein Stefan, Eckel Robert H., Mingrone Geltrude, Boehm Bernhard, Cooper Mark E., Chai Zhonglin, Del Prato Stefano, Ji Linong, Hopkins David, Herman William H., Khunti Kamlesh, Mbanya Jean-Claude, Renard Eric. New-Onset Diabetes in Covid-19. N. Engl. J. Med. 2020;383(8):789–790. doi: 10.1056/NEJMc2018688. [DOI] [PMC free article] [PubMed] [Google Scholar]
- 28.Costela-Ruiz V.J., Illescas-Montes R., Puerta-Puerta J.M., Ruiz C., Melguizo-Rodríguez L. SARS-CoV-2 infection: The role of cytokines in COVID-19 disease. Cytokine Growth Factor Rev. 2020;54:62–75. doi: 10.1016/j.cytogfr.2020.06.001. [DOI] [PMC free article] [PubMed] [Google Scholar]
- 29.Ceriello A., De Nigris V., Prattichizzo F. Why is hyperglycaemia worsening COVID-19 and its prognosis?, Diabetes. Obes. Metab. 2020;22:1951–1952. doi: 10.1111/dom.14098. [DOI] [PMC free article] [PubMed] [Google Scholar]
- 30.Kenneth Weir E., Thenappan T., Bhargava M., Chen Y. Does Vitamin D deficiency increase the severity of COVID-19? Clin. Med. J. R. Coll. Physicians London. 2020;20:E107–E108. doi: 10.7861/CLINMED.2020-0301. [DOI] [PMC free article] [PubMed] [Google Scholar]
- 31.Khan A.H., Nasir N., Nasir N., Maha Q., Rehman R. Vitamin D and COVID-19: is there a role? J. Diabetes Metab. Disord. 2021:1–8. doi: 10.1007/s40200-021-00775-6. [DOI] [PMC free article] [PubMed] [Google Scholar]
- 32.Lakkireddy M., Gadiga S.G., Malathi R.D., Karra M.L., Prasad Murthy Raju I.S.S.V., Ragini S., Chinapaka K.S.S.S., Baba M. Kandakatla. Impact of daily high dose oral vitamin D therapy on the inflammatory markers in patients with COVID 19 disease. Sci. Rep. 2021;11:10641. doi: 10.1038/s41598-021-90189-4. [DOI] [PMC free article] [PubMed] [Google Scholar] [Retracted]
- 33.Montilla D., Pérez M., Borges L., Bianchi G., Cova J.A. Soluble Human Leukocyte Antigen-G in the Bronchoalveolar Lavage of Lung Cancer Patients. Arch. Bronconeumol. 2016;52:420–424. doi: 10.1016/j.arbr.2016.06.018. [DOI] [PubMed] [Google Scholar]
- 34.Murdaca G., Contini P., Setti M., Cagnati P., Lantieri F., Indiveri F., Puppo F. Behavior of non-classical soluble HLA class G antigens in human immunodeficiency virus 1-infected patients before and after HAART: Comparison with classical soluble HLA-A, -B, -C antigens and potential role in immune-reconstitution. Clin. Immunol. 2009;133:238–244. doi: 10.1016/j.clim.2009.08.002. [DOI] [PubMed] [Google Scholar]
- 35.Albayati Z., Alyami A., Alomar S., Middleton D., Bonnett L., Aleem S., Flanagan B.F., Christmas S.E. The Influence of Cytomegalovirus on Expression of HLA-G and its Ligand KIR2DL4 by Human Peripheral Blood Leucocyte Subsets. Scand. J. Immunol. 2017;86(5):396–407. doi: 10.1111/sji.2017.86.issue-510.1111/sji.12594. [DOI] [PubMed] [Google Scholar]
- 36.Mégret Françoise, Prehaud Christophe, Lafage Mireille, Moreau Philippe, Rouas-Freiss Nathalie, Carosella Edgardo D., Lafon Monique. Modulation of HLA-G and HLA-E Expression in Human Neuronal Cells After Rabies Virus or Herpes Virus Simplex Type 1 Infections. Hum. Immunol. 2007;68(4):294–302. doi: 10.1016/j.humimm.2006.12.003. [DOI] [PubMed] [Google Scholar]
- 37.Chen Hai-Xiao, Chen Bao-Guo, Shi Wei-Wu, Zhen Rui, Xu Dan-Ping, Lin Aifen, Yan Wei-Hua. Induction of cell surface human leukocyte antigen-G expression in pandemic H1N1 2009 and seasonal H1N1 influenza virus-infected patients. Hum. Immunol. 2011;72(2):159–165. doi: 10.1016/j.humimm.2010.11.009. [DOI] [PubMed] [Google Scholar]
- 38.Laaribi A.B., Bortolotti D., Hannachi N., Mehri A., Hazgui O., Ben Yahia H., Babay W., Belhadj M., Chaouech H., Yacoub S., Letaief A., Ouzari H.I., Boudabous A., Di Luca D., Boukadida J., Rizzo R., Zidi I. Increased levels of soluble HLA-G molecules in Tunisian patients with chronic hepatitis B infection. J. Viral Hepat. 2017;24(11):1016–1022. doi: 10.1111/jvh.2017.24.issue-1110.1111/jvh.12718. [DOI] [PubMed] [Google Scholar]
- 39.Guimarães Marcia C.M., Soares Christiane P., Donadi Eduardo A., Derchain Sophie F.M., Andrade Liliana A.L.A., Silva Tarsia G.A., Hassumi Marcela K., Simoes Renata T., Miranda Fabiana A., Lira Régia C.P., Crispim Janaina, Soares Edson G. Low expression of human histocompatibility soluble leukocyte antigen-G (HLA-G5) in invasive cervical cancer with and without metastasis, associated with papilloma virus (HPV) J. Histochem. Cytochem. 2010;58(5):405–411. doi: 10.1369/jhc.2009.954131. [DOI] [PMC free article] [PubMed] [Google Scholar]
- 40.Pairo-Castineira Erola, Clohisey Sara, Klaric Lucija, Bretherick Andrew D., Rawlik Konrad, Pasko Dorota, Walker Susan, Parkinson Nick, Fourman Max Head, Russell Clark D., Furniss James, Richmond Anne, Gountouna Elvina, Wrobel Nicola, Harrison David, Wang Bo, Wu Yang, Meynert Alison, Griffiths Fiona, Oosthuyzen Wilna, Kousathanas Athanasios, Moutsianas Loukas, Yang Zhijian, Zhai Ranran, Zheng Chenqing, Grimes Graeme, Beale Rupert, Millar Jonathan, Shih Barbara, Keating Sean, Zechner Marie, Haley Chris, Porteous David J., Hayward Caroline, Yang Jian, Knight Julian, Summers Charlotte, Shankar-Hari Manu, Klenerman Paul, Turtle Lance, Ho Antonia, Moore Shona C., Hinds Charles, Horby Peter, Nichol Alistair, Maslove David, Ling Lowell, McAuley Danny, Montgomery Hugh, Walsh Timothy, Pereira Alexandre C., Renieri Alessandra, Shen Xia, Ponting Chris P., Fawkes Angie, Tenesa Albert, Caulfield Mark, Scott Richard, Rowan Kathy, Murphy Lee, Openshaw Peter J.M., Semple Malcolm G., Law Andrew, Vitart Veronique, Wilson James F., Baillie J. Kenneth. Genetic mechanisms of critical illness in COVID-19. Nature. 2021;591(7848):92–98. doi: 10.1038/s41586-020-03065-y. [DOI] [PubMed] [Google Scholar]
- 41.Carlini F., Traore K., Cherouat N., Roubertoux P., Buhler S., Cortey M., Simon S., Doumbo O., Chiaroni J., Picard C., Di Cristofaro J. HLA-G UTR haplotype conservation in the Malian population: Association with soluble HLA-G. PLoS One. 2013;8:82517. doi: 10.1371/journal.pone.0082517. [DOI] [PMC free article] [PubMed] [Google Scholar]
- 42.Morandi F., Pozzi S., Carlini B., Amoroso L., Pistoia V., Corrias M.V. Soluble HLA-G and HLA-E Levels in Bone Marrow Plasma Samples Are Related to Disease Stage in Neuroblastoma Patients. J. Immunol. Res. 2016;2016 doi: 10.1155/2016/7465741. [DOI] [PMC free article] [PubMed] [Google Scholar]
- 43.Ong E., Farran S., Salloum M., Gardner S., Giovinco N., Armstrong D., Nix D., Al Mohajer M. The Role of Inflammatory Markers: WBC, CRP, ESR, and Neutrophil-to-Lymphocyte Ratio (NLR) in the Diagnosis and Management of Diabetic Foot Infections, Open Forum. Infect. Dis. 2015;2 doi: 10.1093/ofid/ofv133.1079. [DOI] [Google Scholar]
- 44.Solini A., Muscelli E., Stignani M., Melchiorri L., Santini E., Rossi C., Astiarraga B.D., Rizzo R., Baricordi O.R. Soluble human leukocyte antigen-g expression and glucose tolerance in subjects with different degrees of adiposity. J. Clin. Endocrinol. Metab. 2010;95:3342–3346. doi: 10.1210/jc.2009-2747. [DOI] [PubMed] [Google Scholar]
- 45.Weiss S.T. Vitamin D and the HLA locus help to explain the relationship between autoimmune and allergic diseases. Prim. Care Respir. J. 2014;23:2–3. doi: 10.4104/pcrj.2014.00009. [DOI] [PMC free article] [PubMed] [Google Scholar]