

Abstract
Purpose:
The current study compared the modified radiographic response assessment in neuro-oncology (mRANO), immunotherapy RANO (iRANO), and standard RANO criteria as well as quantified the association between progression-free (PFS) and overall survival (OS) in an immunotherapy trial in recurrent glioblastoma (rGBM).
Experimental Design:
47 patients with rGBM were enrolled in a prospective phase II convection-enhanced delivery of an IL4R-targeted immunotoxin (MDNA55-05, NCT02858895). Bidirectional tumor measurements were created by local sites and centrally by an independent radiologic faculty (IRF), then standard RANO, iRANO, and mRANO criteria were applied.
Results:
41 of 47 patients (mean age 56 ± 11.7) were evaluable for response. PFS was significantly shorter using standard RANO compared to iRANO (log-rank, P<0.0001; HR=0.3) and mRANO (P<0.0001; HR=0.3). In patients who died and had confirmed progression on standard RANO, no correlation was observed between PFS and OS (Local,P=0.47;Central,P=0.34). Using iRANO, a weak association was observed between confirmed PFS and OS via local site measurements (P=0.017), but not central measurements (P=0.18). 24 of 41 patients (59%) were censored using iRANO and because they lacked confirmation of progression 3 months after initial progression. A strong correlation was observed between mRANO PFS and OS for both local (R2=0.66, P<0.0001) and centrally-determined reads (R2=0.57, P=0.0007).
Conclusions:
No correlation between radiographic PFS and OS was observed for standard RANO or iRANO, but a correlation was observed between PFS and OS using the mRANO criteria. Also, the iRANO criteria was difficult to implement due to need to confirm progression 3 months after initial progression, censoring more than half the patients.
Introduction
MDNA55 (IL-4(38-37)-PE38KDEL) is an engineered circularly permutated Interleukin-4 (cpIL-4) fused to a modified sequence of the Pseudomonas aeruginosa exotoxin A (PE) specifically designed for glioblastoma (GBM). When the cpIL4 portion of MDNA55 binds to the IL4 receptor on the surface of glioma cells, the entire complex is endocytosed. Following the cleavage and activation by furin-like proteases found in high concentrations with in the endosome of cancer cells, the catalytic domain of the PE is released into the tumor cell cytosol, where it induces cell death via ADP-ribosylation of the Elongation Factor-2 (EF-2) and induction of apoptosis through caspase activation (1). Importantly, cells that do not express the IL4R target do not bind to MDNA55 and are therefore, not subject to PE-mediated cell death.
Previous evidence suggests an immune response comprises at least part of the mechanism of action of MDNA55. While imaging has only been evaluated in a small cohort of patients to date, treatment-related pseudoprogression (PsP) has been observed in a number of preliminary studies(2,3), suggesting higher treatment efficacy and better outcomes in patients with PsP(4,5). Additionally, MDNA55 causes immunogenic cell death resulting in the release of soluble mediators and triggering of an immune response, which has also been associated with improved survival(6). While assessment of response using the standard RANO criteria is currently accepted criteria by the FDA(7), it does not adequately address issues associated with PsP and immunotherapies. Therefore, the current study also conducted response assessment based on a modified RANO (mRANO) criteria(8), which allows for continuation on therapy during initial radiographic progression in order to confirm subsequent tumor growth and/or identify possible pseudo-progression. The immunotherapy RANO (iRANO) criteria(9) was also developed for use with immunotherapies, but it is more applicable in newly diagnosed glioblastoma studies and is less feasible for recurrent studies due to the requirements of a 6 month observation window, confirmation 3 months after initial progressive enhancement, and the relatively short median survival in patients with recurrent GBM.
The objective of the current study was to determine the radiographic therapeutic response of recurrent glioblastoma to MDNA55 using standard RANO, iRANO and the mRANO criteria applied to both local and independent radiologic facility (IRF)-determined tumor measurements. We hypothesize the mRANO criteria will more accurately predict long-term therapeutic benefit in patients treated with MDNA55.
Materials and Methods
Study Design
Study MDNA55-05 (ClinicalTrials.gov #NCT02858895) was a single-arm, open-label, multicenter study in adults aged ≥18 years with histologically proven primary (de novo) GBM without IDH1/IDH2 mutation that had recurred or progressed (first or second relapse, per standard RANO criteria) and not indicated for resection at relapse. The study was conducted from April 11, 2017, through October 31, 2019. All subjects must have had the standard of care (first line therapy consisting of surgery and radiotherapy with or without chemotherapy Stupp protocol(10) and discontinued any previous standard or investigational therapy. A total of 9 sites participated in this study, including the University of California San Francisco, Duke University, Cleveland Clinic, University of Texas San Antonio, Pacific Neuroscience Institute at Providence Saint John’s Health Center, Marcus Neuroscience Institute at Boca Raton Regional Hospital, Oregon Health and Science University, Mozovian Brodnowski Hospital, and the University of Pennsylvania. Fig. 1A shows the study schema. All patients provided informed written consent to be part of this clinical trial approved by Institutional Review Boards (IRBs) and Ethics Review Boards at the local sites. The study was conducted in accordance with the Declaration of Helsinki and International Conference on Harmonization Guidelines for Good Clinical Practice.
Figure 1. Study schema and representative patients.

(A) Treatment schema for MDNA55-05. Upon tumor recurrence, the MRI scan was submitted centrally for screening end eligibility. After confirmation of eligibility, patients entered the study and received a baseline, planning MRI within 14 days of the screening MRI. This baseline MRI scan was used as the reference for response determination. Following the planning MRI, patients received an additional MRI for catheter placement and started CED infusion of MDNA55 (plus a gadolinium-based contrast agent) including real-time infusion monitoring using MRI. Patients also received an MRI scan at the end of infusion to document the extent of drug distribution throughout the tumor. Following infusion and the post-infusion MRI scan, patients were monitored approximately every 30 days until disease progression or death. (B) A 64 year-old male patient who experienced rapid disease progression on MRI and died 3 months after initiating treatment. Green arrows on the end of infusion MRI scan denote anterior portions of the tumor that appeared to receive adequate coverage of MDNA55 after infusion, which subsequently resulted in disease control. This is contrasted with areas denoted with red arrows that did not receive adequate coverage of MDNA55 after CED, which subsequently showed tumor growth and lack of disease control. (C-D) A 76 year-old male and 68 year-old female who experienced long-term disease control, with OS of 23.4 and 26.7 months, respectively. (E) A 34 year-old male patient who experienced transient, progressive enhancement followed by stabilization, which was determined to meet the threshold of PsP as defined by the mRANO criteria.
Study Population
Male and female subjects ≥ 18 years of age must have had a life expectancy > 12 weeks, Karnofsky performance status (KPS) ≥ 70. Subjects were required to have a tumor diameter of ≥1 cm x ≥1 cm (minimum) to 4 cm in any direction by pre-interventional MRI within 14 days of planned treatment and had no features that made the tumor a poor target for convection enhanced delivery (CED) (e.g., significant liquefaction or geometric features not conducive to CED).
MDNA55 Dosing
Eligible subjects underwent surgery associated with catheter placement (Fig. 1). MDNA55 was administered intra- and peritumorally via 1 to 4 surgically placed catheters. Subjects received a dose concentration range of 1.5 to 9.0 μg/mL and dose volume range of 0* to 66 mL. Total dose administered did not exceed 240 μg (established maximum tolerated dose of MDNA55). *Note: One subject underwent catheter placement but did not receive MDNA55 treatment. Of the 46 subjects that received treatment, the volume range was 12 to 66mL.
MDNA55 was infused with the objective of achieving coverage of the tumor and the peritumoral margin to the maximum extent possible as indicated by distribution of a co-infused gadolinium diethylenetriamine pentaacetic acid (Gd DTPA, Magnevist®) tracer observed by MRI.
Subjects received a single dose of MDNA55 infusate via CED. Infusion flow rate was established such that the duration of infusion would be approximately 24 to 48 hours. Infusion via each catheter was initiated at the rate of 3 μL/min/catheter and gradually increased in a stepwise manner to maximum flow rate of up to 50 μL/min/catheter according to Protocol versions 1.0 to 4.0. In Protocol Version 5.0, the infusion flow rate was adjusted at the discretion of the Investigator during real time MRI (with subject maintained under anesthesia) provided that the flow rate per catheter did not exceed 10 μL/min. After the real-time MRI infusion, the monitoring period was deemed complete and remainder of infusion continued with the subject awake. On Day 1 or Day 2 (depending on duration of infusion), an MRI was performed upon completion of infusion as a final evaluation of MDNA55 infusate distribution.
Expected duration of study participation for each subject was up to 12.5 months, including up to 14 days of screening, up to 3-day planning period and a 12-month follow-up period relative to the day of catheter placement / start of infusion being designated as Day 0.
Magnetic Resonance Imaging (MRI)
All patients had anatomic images acquired at baseline and subsequent follow up exams (Fig. 1) according to the international standardized brain tumor imaging protocol (11), including T2-weighted, T2-weighted FLAIR, diffusion-weighted images, and parameter matched, 1-1.5 mm isotropic 3D T1-weighted scans before and following injection of gadolinium based contrast agents. Follow-up MRI exams were performed at 30, 60, 90, and 120 days after CED infusion and every 8 weeks thereafter until 360 days of active follow up were completed. Subjects who completed the 360 day assessment without disease progression or discontinued early without disease progression were continued to be followed for disease status until progression when possible. After progression, subjects were continued to be followed for survival and to confirm disease progression. Advanced imaging was also acquired in a subset of patients, but not used in the current study.
Local Site and Independent Radiologic Facility (IRF) Enhancing Tumor Measurements
Measurable lesions (>1cm × 1cm) were measured using the maximal cross-sectional enhancing diameters (bidimensional measurements) based post-contrast, contrast enhanced T1-weighted images. Multiple imaging planes were reviewed as needed to confirm the accuracy of the measurements or segmented lesion boundary. The lesion size was determined as the sum of product diameters (SPD), calculated by multiplying the cross-sectional enhancing diameters for each target lesion, then adding these bidimensional measurements. Baseline SPD was used as reference to further characterize any objective target lesion progression/regression. The SPD measurements were performed both by clinicians at the local sites involved in the study as well as Imaging Analysis Group (IAG; www.ia-grp.com), an IRF or imaging contract research organization. To visualize population-based temporal trends in SPD with respect to baseline SPD, we performed polynomial regression applied to temporal data similar to previous approaches(12). A 4th order model was chosen to capture at two potential events resulting from the in SPD over time (e.g. PsP and disease progression, PsP and disease stabilization, etc.).
Radiographic Response Assessment Criteria
Three separate RANO criteria were evaluated in the current study: standard RANO(7), iRANO(9), and mRANO(8).
Baseline Evaluation.
The baseline or reference time point for the current study was the planning MRI within 72 hours of catheter placement for all three RANO criteria.
Target Lesions and Measurable Disease.
Target lesions and the definition of measurable disease are identical for all three RANO criteria. At baseline, tumor lesions were categorized measurable or non-measurable. To be considered “measurable”, a lesion was defined as bidimensionally contrast-enhancing with clearly defined margins by MRI, with two perpendicular diameters of at least 10 mm, and visible on 2 axial slices which are preferably at least 5 mm apart with 0 mm skip. For the current study, a maximum of five of the largest lesions was measured and the SPD of these lesions were computed. Details about defining multifocal disease, non-measurable and non-target lesion evaluation, etc. are found in Supplemental Document A.
Clinical Data Requirements for Response Assessment.
Clinical information was required for central response assessment for the purpose of identifying and accounting for factors that may influence the interpretation of radiographic images. The clinical information provided included on-study dates of radiotherapy, surgical procedures, corticosteroid usage and dose, and neurological assessments (e.g. KPS), as well as other relevant procedural history. Radiotherapy and surgical history are presented to the central readers for consideration during lesion assessment. Corticosteroid dose and usage, along with neurological assessments were provided at each timepoint for incorporation into the integrated response calculation.
Neurological function was assessed on a 5-point Likert scale from 0: No neurologic symptoms, fully active at home/work without assistance to 4: Severe neurologic symptoms, totally inactive requiring complete assistance at home or in institution, unable to work. This data is often provided as “stable, better, worse”, for example. The definition of clinical deterioration was defined as decline in the Karnofsky Performance Status (KPS) from baseline of 100 or 90 to 70 or less, a decline in KPS of at least 20 from baseline of 80 or less, or a decline in KPS from any baseline to 50 or less, for at least 7 days, be considered neurologic deterioration unless attributable to comorbid events or changes in corticosteroid dose. Importantly, the neurological assessment in neuro-oncology (NANO) criteria were not available at the time of the trial.
Steroid usage and dosage were derived from a concomitant medications electronic case report form (eCRF). Patients were deemed not to be on active steroids if they were not on steroids or were on physiologic replacement doses only (e.g., <1.5 mg dexamethasone or equivalent per day or as otherwise specified). An average steroid dose no greater than 2 mg change from baseline was deemed stable, and if outside this range the steroid dose was considered increased or decreased, accordingly.
For all criteria, objective response rate (ORR) was defined as the proportion of patients exhibiting a robust, confirmed partial or complete response (PR or CR) sustained for at least 4 weeks. Progression-free survival (PFS) was defined as the time from initial treatment until progressive disease (PD) or death. Duration of clinical benefit (DOCB) was defined as the time from first confirmed response (PR or CR) or disease stabilization (SD) until PD or death.
Standard RANO Response Criteria.
According to the standard RANO criteria(7), PD was defined as ≥25% increase in SPD of target lesions compared with the smallest SPD measurement obtained either at baseline (if no decrease) or best response (on stable or increasing steroid dose) in target lesions, relative to target nadir (i.e. the lowest SPD on a prior timepoint). For cases where the best response contains no measurable disease, a subsequent new measurable lesion resulted in a timepoint response of PD. PD was also called if there are unequivocal increases in non-enhancing tumor burden as evidenced by significant increases in T2/FLAIR lesion size. Any new measurable lesions were also considered PD. A CR was defined as complete disappearance of all enhancing target lesions and non-measurable disease (i.e. non-target lesions) for at least 4 weeks. If all non-target lesions were not evaluable then a CR was not possible. PR was defined as ≥50% decrease in SPD compared to baseline in target lesions, sustained for at least 4 weeks. Patients with non-measurable disease only at Baseline cannot have PR, the best possible response is SD. Additional details about the standard RANO criteria can be found in the detailed imaging charter (Supplemental Document A).
iRANO Criteria.
The iRANO criteria represents an adaptation of the standard RANO criteria for the specific evaluation of therapeutic response in neuro-oncology patients undergoing immunotherapy(9). The iRANO criteria provides guidance for interpreting progressive imaging findings that may occur following initiation of immunotherapy. The iRANO criteria suggests that patients with progressive enhancement within the first 6 months of initiating treatment be evaluated again after 3 months of continued treatment if their neurological status remains stable or improving (Figure S1). For cases where the best response contained no measurable disease, a subsequent new measurable lesion resulted in a timepoint response of PD only if after 6 months from the start of therapy. PD was also called if there were unequivocal increases in non-enhancing tumor burden as evidenced by significant increases in T2/FLAIR lesion size only if after 6 months from the start of therapy. Any new measurable lesions were also be considered PD only if after 6 months from the start of therapy. A repeat scan with confirmation of PD was required 3 months after initial PD if the initial PD scan was less than 6 months after the start of therapy. If PD occurred after 6 months from the start of therapy, no additional confirmation was required. The definition for SD, PR and CR were identical between standard RANO and iRANO. Additional details about the iRANO criteria can be found Supplemental Document A.
mRANO Criteria.
The modified RANO, or mRANO, response criteria(8) was designed to address many of the challenges associated with previous guidelines for response assessment, including an objective definition of PsP and pseudoresponse (PsR), the requirement of confirmed progression as evidenced by continual growth with respect to initial progressive enhancement, and a number of other critical loopholes. It was the goal of the mRANO criteria to be a more contemporary and treatment agnostic response criteria that could be used for response assessment and patient management for adaptive or bucket trials in both anti-angiogenic and immunotherapy agents at the same time. In the current study, the mRANO criteria allowed patients to stay on study for sufficient evaluation time, even after transient changes in MRI were observed, while allowing for precise quantification of the rate or incidence of PsP using an objective definition that can be repeated in future trials. While the definition for SD, PR, and CR is identical between the standard RANO, iRANO, and mRANO criteria, the definition of PD for the mRANO criteria is distinctly different (Figure S2). Using mRANO, PD is defined as a ≥25% increase in SPD of target lesions compared with the smallest SPD measurement obtained either at baseline (if no decrease) or best response (on stable or increasing steroid dose) in target lesions. For cases where the baseline or best response contains no measurable disease, a subsequent new measurable lesion will result in a timepoint response of PD, while a confirmed PD must be obtained after a measurable lesion has increased in size by ≥25%. Note that new sites of measurable disease do not trigger PD, but instead the dimensions are added to the SPD. Additionally, non-target (T2/FLAIR) lesions are not considered in the mRANO critieria. According to mRANO, confirmation of either response or progression must be maintained on intervening scans until 4 or more weeks after the first event. If not confirmed or sustained, this can be considered PsP or PsR. For confirmation to occur there must be no contradictory response prior to the first scan 4 or more week later, and it must be confirmed on the next available scan. Note patients with possible PsP or PsR were given the objective status of “Preliminary Progression” or “Preliminary Response”, respectively. Once PsP, PsR, or true PR/CR/PD was confirmed, the objective status was changed accordingly. Additional details about the mRANO criteria can be found in Supplemental Document A.
Results
A total of 47 patients were included in the intent to treat (ITT) population, of which 42 had measurable disease and sufficient follow-up according to the local site measurements and of these, 41 patients were deemed evaluable for central review. Table 1 summarizes the patient demographics in this modified ITT population (N=41).
Table 1:
Patient Demographics for Modified Intent to Treat Population with Adequate Data Available for RANO Assessment by IRF (N=41)
| Baseline Characteristics | MDNA55-05 Population (N=41) |
|---|---|
| Sex | |
| Male, n (%) | 25 (61%) |
| Female, n (%) | 16 (39%) |
| Age | |
| Median (Range) | 55 (34 – 77) |
| Mean (StDev) | 56 (± 11.7) |
| KPS, n (%) | |
| 70 and 80 | 19 (46%) |
| 90 and 100 | 22 (54%) |
| IDH Status | |
| Wild Type | 35 (85%) |
| Mutated | 0 (0%) |
| Unknown | 6 (15%) |
| MGMT Status | |
| Pos (methylated) | 15 (37%) |
| Neg (unmethylated) | 22 (54%) |
| Unknown | 4 (10%) |
| IL4 Receptor Status | |
| High (H-score > 60), n (%) | 21 (51%) |
| Low (H-score ≤ 60), n (%) | 16 (39%) |
| Unknown | 4 (10%) |
| Max Tumor Dimension a, mm | |
| Median (Range) | 29.7 (12.0 – 8.5) |
| Mean (StDev) | 31.0 (± 10.5) |
| Tumor Location | |
| Parietal | 14 (34%) |
| Frontal | 11 (27%) |
| Temporal | 9 (22%) |
| Other | 7 (17%) |
| Extent of Tumor Resection at Diagnosis | |
| Total Resection | 33 (80%) |
| Partial Resection | 8 (20%) |
| Number of prior relapses, n (%): | |
| 1 | 33 (80%) |
| 2 | 8 (20%) |
| Steroid Use at Baseline | |
| None | 25 (61%) |
| ≤ 4 mg/day | 14 (34%) |
| > 4mg/day | 2 (5%) |
| Unknown | 0 (0%) |
Patients exhibited a number of dynamic changes on MRI following convection enhanced delivery of MDNA55. While some patients exhibited rapid tumor growth and progression (Fig. 1B), a large proportion of patients exhibited long-term disease control (Fig. 1C–D). Anecdotally, patients who experienced rapid radiographic progression appeared to have insufficient drug penetration into the lesion as evidenced by the T1-weighted images after the end of infusion of MDNA55 with gadolinium (Fig. 1B, red arrows), while areas illustrating sufficient drug infusion appeared to be better controlled (Fig. 1B, green arrows). Additionally, quite a few patients experienced transient, progressive enhancement followed by stabilization or tumor shrinkage, commonly referred to as immune-related PsP (Fig. 1E; Figure S3). These trends were apparent for the entire cohort when visualized using spider plots showing percentage change in tumor size from baseline (Fig. 2A; IRF-measurements shown). Additionally, population-based changes estimated using local polynomial (4th order) regression fitting to the percentage change in bidirectional product from baseline showed a pattern of transient changes in enhancing tumor size during the first 6 months of treatment initiation, with a maximum tumor size occurring approximately 79.5 days from baseline (Fig. 2B). Overall survival (OS) for the patients included in the radiographic analysis was approximately 11.8 months.
Figure 2.

(A) Spider plots showing percentage change in tumor bidirectional product with respect to baseline over time for patients treated with MDNA55. (B) Population-based changes in tumor size estimated using a local polynomial (4th order) regression fitting to the percentage change in bidirectional product. (C) Kaplan-Meier plots showing difference in overall survival (OS) in patients determined to have PsP versus patients who did not experience PsP, as defined by the mRANO critiera. Results suggested patients who exhibited PsP had a small, non-significant survival advantage compared to patients who did not exhibit PsP (Log-rank, P=0.3268, median OS = 450.7 days for PsP vs. 349.2 days for non-PsP).
Objective Response Rates (ORR)
According to local measurements, no patients received a durable radiographic response when evaluated using the standard or mRANO criteria. However, 2 of 42 patients (4.8%) did exhibit a durable radiographic response after confirmed pseudoprogression according to the iRANO criteria applied to local measurements. Using the Centrally-determined measurements, all three criteria indicated a single patient had a confirmed durable partial response (2.4%).
Pseudoprogression Rates (PsP)
Using local measurements, 4 of 42 patients (9.5%) had confirmed PsP according to the iRANO criteria and 19 of 42 patients (45.2%) exhibited confirmed PsP according to the mRANO critieria. These rates were similar when using the Centrally-determined measurements, with 5 of 41 patients (12.2%) and 20 of 41 patients (48.8%) exhibiting confirmed PsP according to the iRANO and mRANO criteria, respectively. Using the mRANO criteria applied to the Centrally-determined tumor measurements to define PsP, patients who exhibited progressive enhancement followed by tumor stability or shrinkage had a 100 day survival advantage, although not statistically significant, when compared with patients who did not exhibit PsP (Fig. 2C; Log-rank, P=0.3268, median OS = 450.7 days for PsP vs. 349.2 days for non-PsP).
Tumor Control Rates
Using local measurements, the rates of tumor control defined by having a best response of confirmed SD, PR, or CR for standard RANO, iRANO, and mRANO were 38%, 48%, and 79%, respectively. This was again similar to Centrally-determined measurements, with 37%, 46%, and 76% exhibiting tumor control. It is important to note that for the iRANO and mRANO criteria, tumors were allowed to stabilize after initial progressive enhancement in order to allow for evolution and quantification of PsP. Thus, approximately 26% of patients exhibited disease control after PsP using the iRANO criteria and 64.5% of patients exhibited disease control after PsP using the mRANO criteria, applied to the Centrally-determined measurements. Approximately 20% and 58% of patients exhibited tumor control after PsP using the iRANO and mRANO applied to local measurements.
Progression-Free Survival (PFS)
Local site determined PFS was significantly shorter using the standard RANO criteria compared to both the iRANO (Fig. 3A; log-rank, P<0.0001, HR=0.28; median PFS = 34 days vs. 351 days) and the mRANO criteria (log-rank, P<0.0001, HR=0.29; median PFS = 34 days vs. 122 days). Similarly, Centrally-determined PFS was also significantly shorter using standard RANO criteria compared with iRANO (Fig. 3B; log-rank, P<0.0001, HR=0.27; median PFS = 35 days vs. 155 days) and mRANO (log-rank, P<0.0001, HR=0.28; median PFS = 35 vs. 110 days). No difference in PFS was observed between iRANO and mRANO applied to the local measurements (Fig. 3A; log-rank, P=0.6709, HR=1.15) or Centrally-determined measurements (Fig. 3B; log-rank, P=0.5875, HR=0.93). No significant difference in PFS was observed between local measurements and Centrally-determined measurements when using the standard RANO (P=0.4484), iRANO (P=0.6946), or mRANO criteria (P=0.5835). PFS6 rates using the RANO, iRANO, and mRANO criteria were 5.8%, 64%, and 37% for local reads and 2.4%, 43%, and 33% for IRF measurements.
Figure 3. Progression-free survival (PFS) and duration of clinical benefit (DOCB) for standard RANO, iRANO, and mRANO evaluated both by local site and independent radiological facility (IRF)-determined measurements.
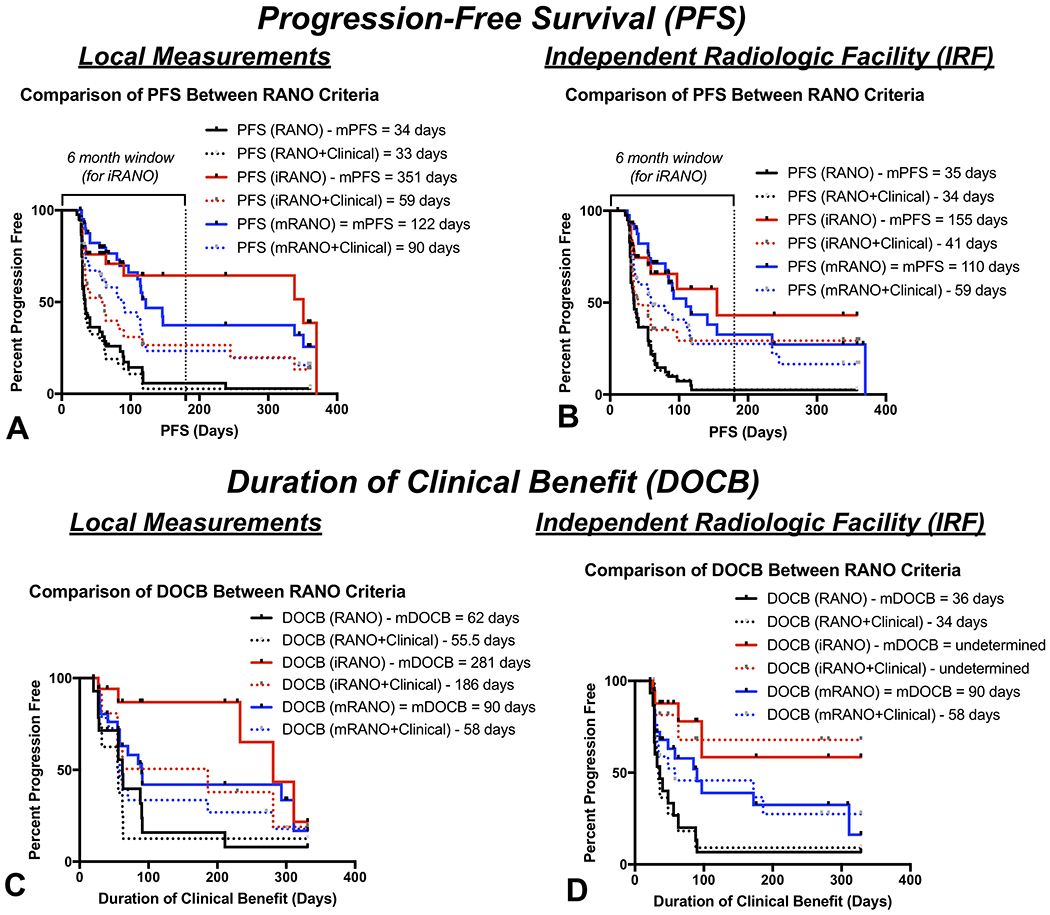
(A) PFS across different RANO criteria using local measurements. (B) PFS across different RANO criteria using centrally determined IRF measurements. (C) DOCB across different RANO criteria using local measurements. (D) DOCB across different RANO criteria using central IRF measurements. Solid lines = radiographic measurements only. Dashed lines = radiographic plus clinical information.
PFS estimates were significantly shorter for iRANO after integration of clinical information including steroid dose and KPS (Fig. 3A, dashed lines; iRANO vs. iRANO+Clinical, Local Reads, P=0.0094, IRF, P=0.0289). Approximately 20% of patients exhibited neurological decline prior to radiographic progression using the iRANO criteria. Although standard RANO (P=0.5407) and mRANO (P=0.0562) were not significantly different after including clinical information, both criteria demonstrated shorter PFS when neurological decline was considered disease progression and, similar to iRANO, approximately 20% of patients exhibited neurological decline prior to radiographic progression using the mRANO criteria. Progression-free survival at 6 months (PFS6) rates using the RANO, iRANO, and mRANO criteria combined with clinical status were 2.7%, 27%, and 23% for local reads and 2.6%, 29%, and 28% for IRF measurements.
Duration of Clinical Benefit (DOCB)
Using local tumor measurements (Fig. 3C), a total of 14 of the 16 patients (87.5%) exhibiting tumor control had a measurable DOCB using the standard RANO criteria, 18 of 20 patients (90%) with tumor control had measurable DOCB using iRANO, and 28 of 33 patients (84.8%) with tumor control had measurable DOCB using the mRANO criteria. No difference in DOCB was observed between standard RANO and mRANO (log-rank, P=0.1059, HR=1.8; median DOCB = 62 vs. 90 days) or between iRANO and the mRANO criteria (P=0.1187, HR=2.1; median DOCB = 281 vs. 90 days). However, there was a significant difference between DOCB between standard RANO and iRANO using local measurements (P=0.0021, HR=4.3, median DOCB = 62 vs. 281 days). No difference in DOCB was observed after integration of clinical variables including steroids and neurological status for any criteria (P>0.12 for all criteria).
Centrally-determined measurements (Fig. 3D) suggested all 15 patients (100%) exhibiting tumor control had measurable DOCB using the standard RANO criteria, all 19 patients (100%) with tumor control had measurable DOCB using the iRANO criteria, and only 26 of the 31 patients (83.9%) with tumor control had measurable DOCB using the mRANO criteria. Using IRF measurements, standard RANO determined DOCB was significantly shorter compared to both iRANO (log-rank, P=0.0003, HR=5.8; median DOCB = 36 days vs. undetermined for iRANO because <50% of patients with measurable DOCB expired) and mRANO (P=0.0238, HR=2.2; median DOCB = 36 vs. 90 days). No difference in DOCB was found between iRANO and mRANO using IRF measurements (P=0.0895). No difference in DOCB was observed between local and IRF measurements using standard RANO (log-rank, P=0.2426), iRANO (P=0.9402), or mRANO (P=0.6820). No difference in DOCB was observed after integration of clinical variables including steroids and neurological status for any criteria (P>0.12 for all criteria).
Correlation between Progression-Free (PFS) and Overall Survival (OS)
In patients who died and had confirmed progression on standard RANO, no correlation was observed between PFS and OS for both local (Fig. 4A; R2=0.02, P=0.4739) and IRF measurements (Fig. 4D; R2=0.032, P=0.3410). Using the iRANO, a weak association driven by a few outliers was observed between confirmed PFS and OS via local site measurements (Fig. 4B; R2=0.5789, P=0.0173), but not central IRF measurements (Fig. 4E; R2=0.3232, P=0.1830). Importantly, 24 of 41 patients (59%) were censored using iRANO and not included because they did not have confirmation of progression 3 months after initial progression. A strong significant correlation was observed between mRANO PFS and OS for both local (Fig. 4C; R2=0.66, P<0.0001) and Centrally-determined measurements (Fig. 4F; R2=0.57, P=0.0007), suggesting mRANO-determined PFS may be a strong predictor of OS. It is important to note that even if patients with PFS greater than 120 days are removed, this trend is still significant for measurements done at the IRF (Figure S4).
Figure 4. Correlation between radiographic PFS and OS for the standard RANO, iRANO, and mRANO criteria.

(A) Correlation between radiographic PFS using the standard RANO criteria applied to local measurements and OS for patients who died. (B) Correlation between radiographic PFS using the iRANO criteria applied to local measurements and OS for patients who died. (C) Correlation between radiographic PFS using the mRANO criteria applied to local measurements and OS for patients who died. (D) Correlation between radiographic PFS using the standard RANO criteria applied to Centrally-determined IRF measurements and OS for patients who died. (E) Correlation between radiographic PFS using the iRANO criteria applied to Centrally-determined measurements and OS for patients who died. (F) Correlation between radiographic PFS using the mRANO criteria applied to Centrally-determined IRF measurements and OS for patients who died. Solid circles = patients who progressed. Open circles = patients who were censored (not used in correlation analysis, only for visualization purposes).
Considering clinical status along with the standard RANO criteria did not result in a significant correlation between PFS and OS for either local measurements (Fig. 5A; R2=0.0534, P=0.2463) or IRF measurements (Fig. 5D; R2=0.03243, P=0.3410). However, a statistically significant correlation was observed between PFS and OS when using the iRANO criteria combined with clinical status (Fig. 5B, E; Local Reads, R2=0.6344, P=0.0001; IRF, R2=0.5079, P=0.0029). This did not appear to be driven by neurological status alone (P=0.9767). Similar to radiographic evaluations alone, PFS and OS were highly correlated using the combination of mRANO criteria and clinical status (Fig. 5C, F; Local Reads, R2=0.5958, P<0.0001; IRF, R2=0.6435, P<0.0001).
Figure 5. Correlation between radiographic or clinically-determined PFS and OS for the standard RANO, iRANO, and mRANO criteria.

(A) Correlation between radiographic or clinically-determined PFS using the standard RANO criteria applied to local measurements and OS for patients who died. (B) Correlation between radiographic or clinically-determined PFS using the iRANO criteria applied to local measurements and OS for patients who died. (C) Correlation between radiographic or clinically-determined PFS using the mRANO criteria applied to local measurements and OS for patients who died. (D) Correlation between radiographic or clinically-determined PFS using the standard RANO criteria applied to Centrally-determined measurements and OS for patients who died. (E) Correlation between radiographic or clinically-determined PFS using the iRANO criteria applied to Centrally-determined measurements and OS for patients who died. (F) Correlation between radiographic or clinically-determined PFS using the mRANO criteria applied to Centrally-determined IRF measurements and OS for patients who died. Solid circles = patients who progressed. Open circles = patients who were censored (not used in correlation analysis, only for visualization purposes).
Correlation between Duration of Clinical Benefit (DOCB) and Overall Survival (OS)
No significant correlation was observed between DOCB and OS for standard RANO using either local (Figure S5A; R2=0.046, P=0.5529) or Centrally-determined measurements (Figure S5D; R2=0.075, P=0.4161). Not enough information was available to adequately estimate the association was between DOCB and OS using iRANO (Figure S5B, S5E). A significant positive correlation was observed between mRANO-determined DOCB and OS for both local (Figure S5C; R2=0.8537, P=0.0001) and central IRF measurements (Figure S5F; R2=0.672, P=0.0037), suggesting the duration of disease control evaluated using the mRANO criteria may strongly associated with long-term patient outcomes.
Discussion
While only currently evaluated in this particular drug, results suggest the mRANO criteria may be superior to standard RANO and iRANO for therapeutic response assessment in recurrent GBM, particularly for immunotherapies. Because of the high rate of PsP observed in the current study (48.8%), standard RANO is not adequate for estimating PFS as all these patients would exhibit early failure despite a slight survival advantage in these patients. The iRANO criteria was also not sufficient to estimate PFS because of the high rate of unconfirmed progression (~60%) and heavy dependence on the accuracy of neurological evaluations to measure PFS with meaningful associations with OS. (It is important to note that patients on this trial were strongly encouraged, but not required, to follow iRANO guidelines requiring confirmation of progression 3 months after initial progressive enhancement.) The mRANO criteria allowed patients to stay on study for sufficient evaluation time, even after transient changes in MRI were observed, while allowing for precise quantification of the rate or incidence of PsP using an objective definition that can be repeated in future trials. Additionally, there was a significant correlation between mRANO-defined PFS (and DOCB) and OS in patients treated with MDNA55, with or without use of clinical status, which suggests it may be a better early surrogate of survival benefit in patients with recurrent GBM compared to commonly used response criteria.
Results suggest that the therapeutic activity of a single administration of MDNA55, an IL4R targeted therapy, is at least comparable to other treatments commonly used to treat recurrent GBM (13) in an all comer patient population irrespective of the dose with or without PsP. The mRANO criteria-defined median PFS was 4 months and 33%, respectively, and 2 months and 28% after incorporating clinical information including neurological status and steroid dose. These estimates of PFS and PFS6 rate are consistent with both lomustine (median PFS≈2-6 months, PFS6≈20-25%(13–15)) and temozolomide (2-6 months, PFS6= 18-48%(13,16,17)). Additionally, the median OS on the current study in patients with imaging available was 11.8 months, which is slightly longer but comparable to what would be expected from carmustine (OS≈5.1-7.5 months(18,19)), lomustine (OS≈7.1-9.8 months(13–15)), or temozolomide (OS≈5.4-9.9 months(13,16,17)). Importantly, there appeared to be a potential link between who experienced rapid radiographic progression and those that exhibited insufficient drug penetration into the lesion as evidenced by the T1-weighted images after the end of infusion of MDNA55 with gadolinium. This may suggest at least some proportion of patients who did not respond well to MDNA55 may have benefitted if the tumor was exposed to higher drug concentrations.
Additionally, results suggest ORR may be inadequate as a therapeutic endpoint for MDNA55 because of the high rate of PsP (48.8%). Only 2% of patients exhibited a radiographic response in the current study, partially because standard RANO identifies patients with PsP exhibiting early failure, while the best response after PsP using mRANO is stable disease. However, iRANO allows for response after initial progression and additional cases of radiographic response were not observed.
It is also important to highlight the differences between local and central determination of progression when examining all three criteria. For example, local measurements using standard RANO did about as well as central reads in terms of estimating PFS, due to a vast number of patients exhibiting progressive enhancement at the first follow-up, so there really isn’t much added value of using an IRF in this context because the sites were able to easily identify the first PD event. However, when more nuanced criteria is used for iRANO and mRANO, local calls of progression and clinical benefit were drastically different between the local sites and IRF. This suggests that more specific training and expertise may be required for local sites to properly implement these contemporary response criteria for clinical care.
There are a number of important limitations to the current study, some of them intrinsic to the specific response criteria mentioned. For example, while assessment of response using the standard RANO criteria is currently accepted criteria by the FDA(7), it does not address issues associated with PsP and immunotherapies and involves significant ambiguity in determining qualitative changes in T2/FLAIR lesion size. Although iRANO (9) was developed for use with immunotherapies, it is impractical to implement in recurrent disease trials because the required observation window is approximately the median survival leading to a large proportion being censored for PFS. Another limitation to the current study is the relatively small sample size and the use of a single, particular type of immunotherapy. It is conceivable that the trends and observations in the current study do not generalize across larger groups of patients or other types of immunotherapies. Future studies aimed at replicating these findings in a larger patient cohort and other types of immunotherapy are warranted.
In summary, data suggests the mRANO criteria may be superior to the standard RANO and iRANO criteria, particularly for immunotherapies. The mRANO-defined PFS and DOCB was highly associated with OS in patients treated with MDNA55. Further, results indicate that overall survival (OS) should likely be the primary endpoint for MDNA55, while the mRANO criteria should be used for patient management and estimation of PFS as a possible secondary endpoint in a subsequent phase III trial.
Supplementary Material
Translational Relevance.
Radiographic response assessment is critical for identifying potential therapeutic benefit of new experimental treatments. The standard RANO, iRANO, and mRANO criteria were all developed as improvements or modifications to previous response criteria, but they have not been evaluated side-by-side nor have they been correlated with concrete therapeutic benefit as defined by overall survival. Results from the current study suggests standard RANO and iRANO defined PFS does not correlate with OS in recurrent GBM, whereas both locally- and centrally-determined PFS using mRANO strongly correlated with OS. Together, this suggests the mRANO criteria may be superior to the standard RANO and iRANO criteria, particularly for immunotherapies.
Acknowledgments:
Funding was provided by Medicenna (Bexon, Coello, Merchant, Ellingson), the American Cancer Society (ACS) Research Scholar Grant (RSG-15-003-01-CCE) (Ellingson), UCLA SPORE in Brain Cancer (NIH/NCI 1P50 CA211015-01A1) (Ellingson), and NIH/NCI 1R21 CA223757-01 (Ellingson).
Footnotes
Conflicts of Interest:
Benjamin Ellingson: Paid advisor for Medicenna, MedQIA, Neosoma, Agios, Siemens, Janssen, Imaging Endpoints, Kazia, VBL, Oncoceutics, Boston Biomedical Inc (BBI), and ImmunoGenesis. Grant funding from Siemens, Agios, and Janssen.
John Sampson: None
Achal Singh Achrol: None
Manish K. Aghi: None
Krystof Bankiewicz: None
Chencai Wang: None
Steven Brem: Advisor for Novocure, Northwest Biotherapeutics, and Tocagen
Andrew Brenner: None
Sajeel Chowdhary: None
John R. Floyd: None
Seunggu Han: None
Santosh Kesari: Advisor and grant funding from Medicenna
Dina Randazzo: None
Michael Vogelbaum: Honoraria from Tocagen and Celgene. Indirect equity and royalty rights from Infuseon Therapeutics.
Frank Vrionis: None
Miroslaw Zabek: None
Nicholas Butowski: Advisor for Hoffman La-Roche; Nativis; Medicenna; Bristol Meyers Squibb; VBL, Pulse Therapeutics, Lynx Group, Boston Bio. Paid Consultant for Nativis; Hoffman La-Roche; Medicenna, DelMar, QED, Karyopharm. Grant funding: Beigene, BMX, Deciphera, DeNovo, Epicentrix, Oncoceutics, Stellar Orbus, Istari, Kiyatec, Amgen, Tocagen.
Martin Bexon: Employed by Medicenna.
Melissa Coello: Employed by Medicenna
Nina Merchant: Employed by Medicenna
Fahar Merchant: Employed by Medicenna
REFERENCES
- 1.Wedekind JE, Trame CB, Dorywalska M, Koehl P, Raschke TM, McKee M, et al. Refined crystallographic structure of Pseudomonas aeruginosa exotoxin A and its implications for the molecular mechanism of toxicity. J Mol Biol 2001;314(4):823–37 doi 10.1006/jmbi.2001.5195. [DOI] [PubMed] [Google Scholar]
- 2.Floeth FW, Aulich A, Langen KJ, Burger KJ, Bock WJ, Weber F. MR imaging and single-photon emission CT findings after gene therapy for human glioblastoma. AJNR Am J Neuroradiol 2001;22(8):1517–27. [PMC free article] [PubMed] [Google Scholar]
- 3.Rainov NG, Heidecke V. Long term survival in a patient with recurrent malignant glioma treated with intratumoral infusion of an IL4-targeted toxin (NBI-3001). J Neurooncol 2004;66(1-2):197–201 doi 10.1023/b:neon.0000013478.27604.01. [DOI] [PubMed] [Google Scholar]
- 4.Zhou M, Niu C, Jia L, He H. The value of MGMT promote methylation and IDH-1 mutation on diagnosis of pseudoprogression in patients with high-grade glioma: A meta-analysis. Medicine (Baltimore) 2019;98(50):e18194 doi 10.1097/MD.0000000000018194. [DOI] [PMC free article] [PubMed] [Google Scholar]
- 5.Radbruch A, Fladt J, Kickingereder P, Wiestler B, Nowosielski M, Baumer P, et al. Pseudoprogression in patients with glioblastoma: clinical relevance despite low incidence. Neuro Oncol 2015;17(1):151–9 doi 10.1093/neuonc/nou129. [DOI] [PMC free article] [PubMed] [Google Scholar]
- 6.Leshem Y, Pastan I. Pseudomonas Exotoxin Immunotoxins and Anti-Tumor Immunity: From Observations at the Patien’s Bedside to Evaluation in Preclinical Models. Toxins (Basel) 2019;11(1) doi 10.3390/toxins11010020. [DOI] [PMC free article] [PubMed] [Google Scholar]
- 7.Wen PY, Macdonald DR, Reardon DA, Cloughesy TF, Sorensen AG, Galanis E, et al. Updated response assessment criteria for high-grade gliomas: response assessment in neuro-oncology working group. J Clin Oncol 2010;28(11):1963–72 doi 10.1200/JCO.2009.26.3541. [DOI] [PubMed] [Google Scholar]
- 8.Ellingson BM, Wen PY, Cloughesy TF. Modified Criteria for Radiographic Response Assessment in Glioblastoma Clinical Trials. Neurotherapeutics 2017;14(2):307–20 doi 10.1007/s13311-016-0507-6. [DOI] [PMC free article] [PubMed] [Google Scholar]
- 9.Okada H, Weller M, Huang R, Finocchiaro G, Gilbert MR, Wick W, et al. Immunotherapy response assessment in neuro-oncology: a report of the RANO working group. Lancet Oncol 2015;16(15):e534–e42 doi 10.1016/S1470-2045(15)00088-1. [DOI] [PMC free article] [PubMed] [Google Scholar]
- 10.Stupp R, Mason WP, van den Bent MJ, Weller M, Fisher B, Taphoorn MJ, et al. Radiotherapy plus concomitant and adjuvant temozolomide for glioblastoma. N Engl J Med 2005;352(10):987–96 doi 10.1056/NEJMoa043330. [DOI] [PubMed] [Google Scholar]
- 11.Ellingson BM, Bendszus M, Boxerman J, Barboriak D, Erickson BJ, Smits M, et al. Consensus recommendations for a standardized Brain Tumor Imaging Protocol in clinical trials. Neuro-Oncology 2015;17(9):1188–98 doi 10.1093/neuonc/nov095. [DOI] [PMC free article] [PubMed] [Google Scholar]
- 12.Tran AN, Lai A, Li S, Pope WB, Teixeira S, Harris RJ, et al. Increased sensitivity to radiochemotherapy in IDH1 mutant glioblastoma as demonstrated by serial quantitative MR volumetry. Neuro Oncol 2014;16(3):414–20 doi 10.1093/neuonc/not198. [DOI] [PMC free article] [PubMed] [Google Scholar]
- 13.Weller M, Cloughesy T, Perry JR, Wick W. Standards of care for treatment of recurrent glioblastoma--are we there yet? Neuro Oncol 2013;15(1):4–27 doi 10.1093/neuonc/nos273. [DOI] [PMC free article] [PubMed] [Google Scholar]
- 14.Wick W, Puduvalli VK, Chamberlain MC, van den Bent MJ, Carpentier AF, Cher LM, et al. Phase III study of enzastaurin compared with lomustine in the treatment of recurrent intracranial glioblastoma. J Clin Oncol 2010;28(7):1168–74 doi 10.1200/JCO.2009.23.2595. [DOI] [PMC free article] [PubMed] [Google Scholar]
- 15.Batchelor TT, Mulholland P, Neyns B, Nabors LB, Campone M, Wick A, et al. Phase III randomized trial comparing the efficacy of cediranib as monotherapy, and in combination with lomustine, versus lomustine alone in patients with recurrent glioblastoma. J Clin Oncol 2013;31(26):3212–8 doi 10.1200/JCO.2012.47.2464. [DOI] [PMC free article] [PubMed] [Google Scholar]
- 16.Balmaceda C, Peereboom D, Pannullo S, Cheung YK, Fisher PG, Alavi J, et al. Multi-institutional phase II study of temozolomide administered twice daily in the treatment of recurrent high-grade gliomas. Cancer 2008;112(5):1139–46 doi 10.1002/cncr.23167. [DOI] [PubMed] [Google Scholar]
- 17.Wick A, Felsberg J, Steinbach JP, Herrlinger U, Platten M, Blaschke B, et al. Efficacy and tolerability of temozolomide in an alternating weekly regimen in patients with recurrent glioma. J Clin Oncol 2007;25(22):3357–61 doi 10.1200/JCO.2007.10.7722. [DOI] [PubMed] [Google Scholar]
- 18.Brandes AA, Tosoni A, Amista P, Nicolardi L, Grosso D, Berti F, et al. How effective is BCNU in recurrent glioblastoma in the modern era? A phase II trial. Neurology 2004;63(7):1281–4 doi 10.1212/01.wnl.0000140495.33615.ca. [DOI] [PubMed] [Google Scholar]
- 19.Reithmeier T, Graf E, Piroth T, Trippel M, Pinsker MO, Nikkhah G. BCNU for recurrent glioblastoma multiforme: efficacy, toxicity and prognostic factors. BMC Cancer 2010;10:30 doi 10.1186/1471-2407-10-30. [DOI] [PMC free article] [PubMed] [Google Scholar]
Associated Data
This section collects any data citations, data availability statements, or supplementary materials included in this article.