

Abstract
Despite newly available treatments for spinal muscular atrophy (SMA), novel circulating biomarkers are still critically necessary to track SMA progression and therapeutic response. To identify potential biomarkers, we performed whole‐blood RNA sequencing analysis in SMA type 1 subjects under 1 year old and age‐matched healthy controls. Our analysis revealed the Heat Shock Protein Family A Member 7 (HSPA7)/heat shock 70kDa protein 7 (HSP70B) as a novel candidate biomarker to track SMA progression early in life. Changes in circulating HSP70B protein levels were associated with changes in circulating neurofilament levels in SMA newborns and infants. Future studies will determine whether HSP70B levels respond to molecular therapies.
Introduction
With the federal recommendation to screen all newborns in the United States for spinal muscular atrophy (SMA) 1 and the emergence of three distinct effective molecular therapies to treat SMA newborns and infants at risk, identifying novel biomarkers to detect and monitor evidence of disease activity early in life is critical. Infants undergo rapid growth and transformational maturational events during a time when relying on clinical signs, symptoms or even established outcome measures are of insufficient sensitivity to predict the emergence of adverse clinical outcomes, whether due to an alteration of the underlying disease phenotype or as a secondary consequence of the therapy itself.
SMA is caused by mutations in the survival motor neuron 1 (SMN1) gene and the number of copies of SMN2, a paralog gene to SMN1, inversely correlates with phenotypic severity and is the primary disease modifier in SMA. Infants with 1‐2 SMN2 copies have prenatal or early neonatal onset of acute denervation that can result in severe outcomes, while symptom onset in those with three or more SMN2 copies is much more variable, ranging from infancy to adulthood. 2 , 3 , 4 , 5 In spite of having three recent FDA‐approved treatments for SMA, the lack of circulating biomarkers to track SMA progression and therapeutic consequences continues to impair our ability to ensure the best outcomes for SMA newborns.
Cerebrospinal fluid and plasma/serum neurofilament (NF) levels are the markers of neuronal damage and have been recently identified as a potential prognostic and treatment responsive biomarker in SMA and other neurodegenerative diseases. 6 , 7 , 8 To further identify novel systemic biomarkers to predict and track SMA severity across a range of phenotypes, all newly diagnosed SMA patients, their siblings, and their families are offered enrollment in the SPOT SMA Longitudinal Pediatric Data Repository (LPDR) database and linked biorepository. 9 , 10 , 11 The SPOT SMA LPDR was launched in 2016 to extend the Project Cure SMA LPDR, with appropriate modifications for anticipatory follow‐up for SMA newborns and affected and unaffected siblings (NCT02831296). Here, we performed RNA sequencing and differential expressions analyses in samples from SMA type 1 subjects under 1 year old and age‐matched healthy control subjects to identify novel SMA biomarkers early in life. Our analysis identified for the first time the Heat Shock Protein Family A Member 7 (HSPA7)/heat shock 70 kDa protein 7 (HSP70B) as a novel candidate biomarker to track SMA progression in the first year of life, indicating that its circulating protein levels are associated with NF levels in SMA newborns and infants.
Materials and methods
Study approval and subjects
Written informed consent and parental consent were obtained from all participants under Institutional Ethics Review Boards at the University of Utah (protocol 8751) and Massachusetts General Hospital (protocol 2016P000469). We have launched the Project Cure SMA Longitudinal Pediatric Data Repository (LPDR) and SPOT SMA LPDR including several samples collected in the past decade from SMA patients. These biorepositories and linked databases include detailed demographic information and comprehensive genotype/phenotype data from SMA patients receiving or not molecular and gene therapies, and their unaffected siblings. Here, we queried the Project Cure SMA and SPOT SMA LPDRs housed within the Research Electronic Data Capture Web Application at the Newborn Screening Translational Research Network for all RNA samples available from SMA subjects under 2 years of age not receiving any SMN‐targeted molecular or gene therapy at the time of sample collection. Specifically, any subject receiving treatment with valproic acid (VPA), phenylbutyrate (PBA), nusinersen, onasemnogene abeparvovec and risdiplam were therefore excluded. For initial RNA sequencing exploratory analysis, we chose samples meeting strict quality control standards from five SMA type 1 infants and five healthy age‐matched healthy controls under 1 year old (Cohort 1). We further validated our HSPA7 findings using all 51 RNA samples from 22 SMA subjects in our database (Cohort 2) using the same strict cutoffs for RNA integrity and purity. Validation of a selected target (HSP70B protein encoded by HSPA7 gene) protein levels was performed to determine a potential correlation with NF levels (Cohort 3). Table 1 presents the distribution of sex, age, SMA type, and SMN2 copies for these cohorts. SMN1 and SMN2 copy numbers were determined using quantitative polymerase chain reaction as previously described. 12
Table 1.
Characteristics of SMA and control subjects in each cohort studied.
| Cohort 1 (n = 10) | Cohort 2 (n = 22) | Cohort 3 (n = 20) | ||||
|---|---|---|---|---|---|---|
| Control (n = 5) | SMA (n = 5) | Pre‐symptomatic (n = 6) | SMA with 2 SMN2 copies (n = 6) | SMA with 3 SMN2 copies (n = 10) | SMA subject with NF data | |
| Gender | ||||||
| Male | 4 (80%) | 3 (60%) | 1 (16.6%) | 4 (66%) | 5 (50%) | 11 (55%) |
| Female | 1 (20%) | 2 (40%) | 5 (83.3%) | 2 (33%) | 5 (50%) | 9 (45%) |
| Age, Yrs. | 160 (11 ‐ 361) | 121 (1 ‐ 259) | 10.7 (1 ‐ 19) | 224.5 (76 ‐ 453) | 303 (6 ‐ 613) | 156.5 (0 ‐ 351) |
| SMN2 copies | ||||||
| 2 | ‐ | 5 (100%) | 0 (0%) | 6 (100%) | 0 (0) | 13 (65%) |
| 3 | ‐ | 0 (0%) | 6 (100%) | 0 (0%) | 10 (100%) | 7 (35%) |
| SMA type | ||||||
| Pre‐symptomatic | 6 (100%) | ‐ | ‐ | 3 (15%) | ||
| 1 | ‐ | 5 (100%) | ‐ | 6 (100%) | ‐ | 11 (55%) |
| 2 | ‐ | 0 (0%) | ‐ | ‐ | 8 (80%) | 6 (30%) |
| 3 | ‐ | 0 (0%) | ‐ | ‐ | 2 (20%) | ‐ |
All samples were obtained after a query in the Project Cure SMA and SPOT SMA LPDRs housed within the Research Electronic Data Capture Web Application at the Newborn Screening Translational Research Network for all RNA samples available from SMA subjects under 2 years of age not receiving any SMN‐targeted molecular or gene therapy at the time of sample collection.
RNA sequencing analysis
RNA was extracted using the PAXgene Blood RNA kit (Qiagen, Hilden, Germany; 762164). RNA‐sequencing libraries were prepared from 250 ng of DNase‐treated total RNA using the TruSeq Stranded mRNA kit (Illumina). RNA sequencing FASTA files were trimmed and quality checked using FastQC. RNA‐sequencing reads were then mapped to the hg38 human genome, which had been annotated with exons and introns. Counts for each gene were generated using the package STAR. A custom R script was created for differential expression analysis. Package DESeq2 was used for all differential expression at default parameters. Data were submitted to NCBI Gene Expression Omnibus (GEO; GSE174056).
Intron retention analysis
Read were aligned to genome version hg38 and annotation database GENCODE V21 using the STAR algorithm (v. 2.4.0h). The resulting bam files were used to calculate the degree of intron retention per sample using the rMATS algorithm and custom intron annotation files, generated as described previously. 13 , 14 Significantly retained introns were defined as FDR < 0.05 between SMA patients and controls.
Reverse‐Transcription and Quantitative PCR of Sample mRNA. RNA was reverse transcribed using the high‐capacity cDNA reverse transcription kit (Applied Biosystems, 4368814). cDNA was amplified using Power up SYBR green master mix (Applied Biosystems; A25742) in a QuantStudio 3 Real‐Time PCR system (Applied Biosystems, A28567). The HPRT expression was used as housekeeping in all qPCR calculations. Primer sequences are as follow: HSPA7 Forward: GGCTAACAAGATCACCAATGACA; HSPA7 Reverse: TCGGCTTCATGAACCATCCT; HPRT Forward: GAAAAGGACCCCACGAAGTGT; HPRT Reverse: AGTCAAGGGCATATCCTACAA.
HSP70B and neurofilaments levels
Serum phosphorylated neurofilament heavy chain (pNf‐H) concentrations were measured using a pNF‐H enzyme‐linked lectin assay (ProteinSimple, CA, USA) according to the manufacturer's instruction and as previously described. 8 HSP70B levels were determined using a commercially available enzyme‐linked immunosorbent assay (ELISA) kit (MyBioSource, CA, USA; MBS287601) according to the manufacturer’s instructions.
Statistical analysis
Data are presented as box plots (min to max) with dots as individual values. Statistical analyses were performed using R. Unpaired Student’s t tests or Kruskal–Wallis test were used to compare groups. Kendall rank correlation coefficient was used to evaluate correlations. Statistical significance was defined as p < 0.05.
Results and discussion
We analyzed a cohort of SMA patients with two SMN2 copies with clinical symptoms early in life, which represented the natural history of the disease since subjects were not receiving any molecular or gene therapies at the sampling time. Whole‐blood RNA sequencing confirmed no expression of SMN1 in all SMA patients (Figure 1A), with no significant difference in the SMN2 expression between SMA subjects and controls (Figure 1A). We took advantage of this dataset to explore novel candidate biomarkers of SMA progression early in life. Differential expression analysis of exons showed 206 genes with p < 0.05 in SMA subjects as compared to control (Figure 1B). From these 206 genes, 32 had a fold change > 1.2 and clustered together in healthy controls and four out of five SMA patients (Figure 1C). Using a more restricted cutoff of false discover rate (FDR) at 0.2 (excluding SMN1), we found five genes upregulated in SMA subjects as compared to controls (Figure 1D). Among these genes, HSPA7 was the only gene expressed in whole blood in all subjects and consistently upregulated in all SMA patients (Figure 1D). RT‐qPCR analysis validated these findings, showing a 2.7‐fold increase in HSPA7 mRNA levels in SMA subjects as compared to controls (Figure 1E).
FIGURE 1.
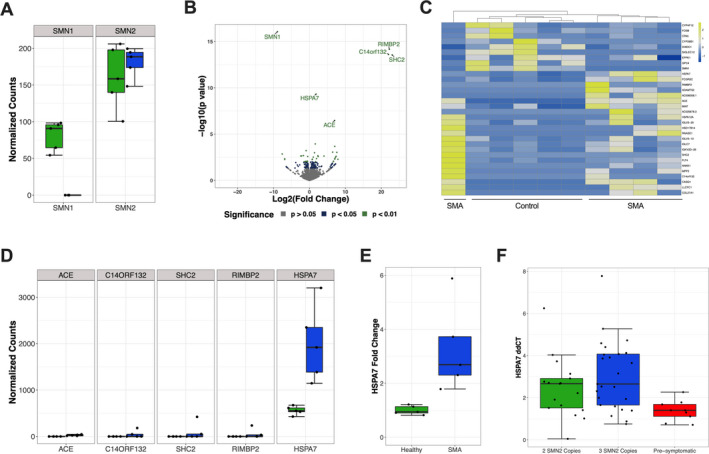
RNA sequencing reveals increased HSP70B mRNA levels in the whole blood of SMA Infants. (A) Negative binomial normalized read counts of SMN1 and SMN2 genes in SMA versus healthy controls. Green indicates control subjects, while blue indicates SMA subjects. (B) Volcano plot comparing SMA and control subjects. (C) Heatmap plot of normalized counts for genes with p < 0.01 and an absolute value of log2 fold change > 1.2. (D) Normalized counts of SMA and healthy patients for differentially expressed genes with FDR < 0.2. Green indicates control subjects, while blue indicates SMA subjects. (E) Quantitative RT‐qPCR for HSPA7 mRNA levels. p = 0.02. (F) HSPA7 mRNA levels in a cohort of SMA patients divided into symptomatic SMA subjects with only two SMN2 copies, symptomatic SMA subjects with three SMN2 copies, and pre‐symptomatic SMA subjects with three SMN2 copies. p = 0.01 and p = 0.003 when comparing pre‐symptomatic SMA subjects with symptomatic SMA subjects with only two SMN2 copies and symptomatic SMA subjects with three SMN2 copies, respectively.
We sought to evaluate the HSPA7 mRNA expression in an independent cohort of SMA subjects with whole‐blood RNA samples collected in the 2 years of life. We quantified HSPA7 expression in a total of 51 samples from 22 different subjects and next divided samples into three groups: 1) symptomatic SMA subjects with two SMN2 copies, 2) symptomatic SMA subjects with three SMN2 copies, and 3) pre‐symptomatic SMA subjects with three SMN2 copies (Table 1). Symptomatic SMA subjects with two or three SMN2 copies had significantly higher HSPA7 mRNA expression than pre‐symptomatic SMA subjects (Figure 1F). There was no significant difference between symptomatic subjects with two and three SMN2 copies (Figure 1F). Based on these findings, we raised the hypothesis that HSPA7 expression could be a circulating biomarker for SMA.
In an additional analysis, we determined whether changes in SMA subjects would be associated with increased intron retention in whole blood. SMN plays a critical role in the assembly of small nuclear ribonucleoproteins (snRNPs), controlling correct spliceosomal assembly. Increased intron retention occurs in murine models of SMA and in human cellular models with depleted SMN. 13 , 15 However, there are no studies demonstrating intron retention in systemic tissues in SMA subjects, including the whole blood which could be useful in the clinical setting to track disease progression. Our current analysis revealed that SMA infants display retained introns in whole blood when compared to controls (Figure 2A‐C) including main differences in the atypical class of spliceosomal introns U12‐type (Figure 2D‐F).
FIGURE 2.
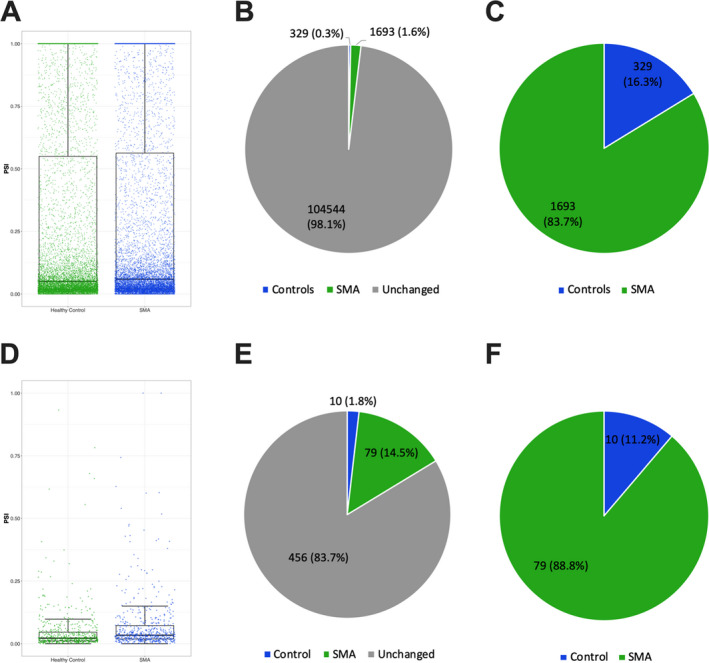
Increased systemic intron retention in SMA infants. (A) Comparison between SMA and controls for total intron retention in the whole blood (p < 0.001). (B‐C) Pie charts showing the percentage of introns more retained in SMA or control subjects. (D) Comparison between SMA and controls for U12 intron retention in the whole blood (P < 0.001). (E‐F) Pie charts showing the percentage of U12 introns more retained in SMA or control subjects. Individual values indicate each intron retained in individual samples. PSI: percentage spliced‐in values.
HSPA7 is a single exon gene expected to encode the heat shock 70 kDa protein 7 (HSP70B; UniProtKB accession number P48741). There is evidence showing that HSPA7 is a functional gene and the HSPA7 mRNA can be transcribed, but little is known about the potential function (if any) of the HSP70B protein. 16 , 17 , 18 Here, we used a commercially available ELISA to measure the serum HSP70B protein levels in SMA subjects under 1 year old. These experiments revealed that serum HSP70B protein is detectable at concentrations ranging from 6.9 to 26.2 ng/ml in SMA newborns and infants. We, therefore, aimed to determine a potential correlation between serum HSP70B protein levels and neurofilaments, as circulating neurofilaments are markers of neuronal damage and have been established as a prognostic and treatment responsive biomarker in SMA. 6 , 7 , 8 We analyzed 37 serum samples available in our database with available pNf‐H data in SMA subjects under 1 year old not receiving therapies. We observed a positive correlation between serum pNf‐H and HSP70B protein levels (Figure 3A). Because we also observed an extensive range in the pNf‐H concentrations (0.98 to 29.06 ng/ml), we next divided this cohort of samples into two subgroups based on the median of the pNf‐H data (Figure 3B). Remarkably, SMA patients with high serum pNf‐H levels also displayed significantly higher HSP70B protein levels as compared to SMA patients with low pNf‐H levels (Figure 3C).
FIGURE 3.
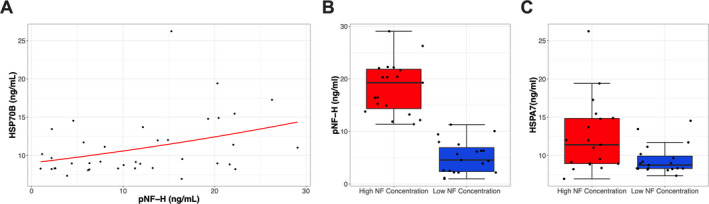
Association between HSPA7 protein levels and neurofilament concentrations. (A) Association between serum HSP70B protein levels and neurofilament concentrations. Kendall rank correlation coefficient revealed p = 0.018, with a Spearman r value of 0.37. (B) Division of samples in two groups based on low and high neurofilament concentrations in SMA patients. (C) HSP70B protein levels in samples previously divided based on neurofilament levels. p = 0.01 between groups.
Given the ubiquitous presence of the SMN protein in all human cells and its role in important cellular pathways, it is likely that SMN deficiency outside of the motor neuron contributes to pathogenesis and cumulative disease burden in patients with SMA. In fact, SMN has been demonstrated to regulate the assembly of spliceosome machinery, which is critical for the functionality of all cell types. 19 SMN deficiency can induce intron retention and trigger global DNA damage and stress response. 13 Previous data indicate that heat‐shock proteins are rapidly overexpressed in response to DNA damage and may present a role in DNA repair in different contexts. 20 , 21 Therefore, we speculate that increased HSP70B levels in SMA infants are a DNA damage response. Moreover, we cannot exclude the possibility of a compensatory effect not related to SMN deficiency, but more linked to the physiological effects of the muscle atrophy condition.
These novel findings demonstrate increased systemic HSP70B levels and intron retention in SMA newborns and infants. Because circulating HSP70B levels can be precisely measured using ELISA experiments, we will include these measurements in our routine analysis with SMA subjects to further acquire longitudinal follow‐up data and determine the effects of molecular and/or gene therapies. We also encourage other additional studies to test circulating HSP70B levels in SMA patients, which can be in principle a new biomarker to track SMA progression early in life.
Author Contributions
EJE, CRRA, and KJS conceived and designed the study. EJE, RZ, JAH, PC, and JFS carried out RNAseq experiments and analysis. MP and WF performed and analyzed neurofilament experiments. EJE and CRRA carried out other experiments. KJS provided laboratory support and supervised the experiments. EJE and CRRA performed data analysis and drafted the manuscript. All authors interpreted the data, participated in manuscript review, and approved the final manuscript.
Conflict of Interest
EJE, CRRA, and RZ report no conflict of interest. MP, WF, PC, and JAH are employees of Biogen and hold stock/stock options in Biogen. JFS was a employer at Biogen at the time the work was performed and holds stock/stock options in Biogen; he is now employed at Vertex Pharmaceuticals, Boston. KJS is on the scientific advisory board for Cure SMA and is a consultant for Biogen, Roche and AveXis. KJS receives clinical trial funding from AveXis and Biogen.
Acknowledgments
We are grateful to all the patients and families who participated in this study. We would like to thank Chao Sun and Will Chen for helpful discussions during this study. CRRA received a fellowship from the MGH Executive Committee on Research. KJS received financial support from NIH NICHD R01HD054599, NIH NINDS R21NS108015, Biogen, and Cure SMA.
This study was uploaded to medRxiv preprint server: doi: https://doi.org/10.1101/2020.11.20.20235325.
Funding Statement
This work was funded by NIH NICHD grant R01HD054599; Biogen ; MGH grant MGH Executive Committee on Research; Cure SMA ; NIH NINDS grant R21NS108015.
References
- 1. Evidence‐based Review of Newborn Screening for Spinal Muscular Atrophy (SMA). 2020.
- 2. Mailman MD, Heinz JW, Papp AC, et al. Molecular analysis of spinal muscular atrophy and modification of the phenotype by SMN2. Genet Med 2002;4(1):20–26. [DOI] [PubMed] [Google Scholar]
- 3. Feldkotter M, Schwarzer V, Wirth R, et al. Quantitative analyses of SMN1 and SMN2 based on real‐time LightCycler PCR: fast and highly reliable carrier testing and prediction of severity of spinal muscular atrophy. Am J Hum Genet 2002;70(2):358–368. [DOI] [PMC free article] [PubMed] [Google Scholar]
- 4. Crawford TO, Paushkin SV, Kobayashi DT, et al. Evaluation of SMN protein, transcript, and copy number in the biomarkers for spinal muscular atrophy (BforSMA) clinical study. PLoS One 2012;7(4):e33572. [DOI] [PMC free article] [PubMed] [Google Scholar]
- 5. Ramos DM, d'Ydewalle C, Gabbeta V, et al. Age‐dependent SMN expression in disease‐relevant tissue and implications for SMA treatment. J Clin Invest 2019;129(11):4817–4831. [DOI] [PMC free article] [PubMed] [Google Scholar]
- 6. Winter B, Guenther R, Ludolph AC, et al. Neurofilaments and tau in CSF in an infant with SMA type 1 treated with nusinersen. J Neurol Neurosurg Psychiatry 2019;90(9):1068–1069. [DOI] [PubMed] [Google Scholar]
- 7. Ackerley S, Thornhill P, Grierson AJ, et al. Neurofilament heavy chain side arm phosphorylation regulates axonal transport of neurofilaments. J Cell Biol 2003;161(3):489–495. [DOI] [PMC free article] [PubMed] [Google Scholar]
- 8. Darras BT, Crawford TO, Finkel RS, et al. Neurofilament as a potential biomarker for spinal muscular atrophy. Ann Clin Transl Neurol 2019;6(5):932–944. [DOI] [PMC free article] [PubMed] [Google Scholar]
- 9. Alves CRR, Zhang R, Johnstone AJ, et al. Serum creatinine is a biomarker of progressive denervation in spinal muscular atrophy. Neurology 2020;94(9):e921–e931. [DOI] [PMC free article] [PubMed] [Google Scholar]
- 10. Alves CRR, Zhang R, Johnstone AJ, et al. Whole blood survival motor neuron protein levels correlate with severity of denervation in spinal muscular atrophy. Muscle Nerve 2020;62(3):351–357. [DOI] [PMC free article] [PubMed] [Google Scholar]
- 11. Siranosian JJ, Nery FC, Alves CRR, et al. Whole‐blood dysregulation of actin‐cytoskeleton pathway in adult spinal muscular atrophy patients. Ann Clin Transl Neurol 2020;7(7):1158–1165. [DOI] [PMC free article] [PubMed] [Google Scholar]
- 12. Prior TW, Krainer AR, Hua Y, et al. A positive modifier of spinal muscular atrophy in the SMN2 gene. Am J Hum Genet 2009;85(3):408–413. [DOI] [PMC free article] [PubMed] [Google Scholar]
- 13. Jangi M, Fleet C, Cullen P, et al. SMN deficiency in severe models of spinal muscular atrophy causes widespread intron retention and DNA damage. Proc Natl Acad Sci USA 2017;114(12):E2347–E2356. [DOI] [PMC free article] [PubMed] [Google Scholar]
- 14. Shen S, Park JW, Lu ZX, et al. rMATS: robust and flexible detection of differential alternative splicing from replicate RNA‐Seq data. Proc Natl Acad Sci USA 2014;111(51):E5593–E5601. [DOI] [PMC free article] [PubMed] [Google Scholar]
- 15. Doktor TK, Hua Y, Andersen HS, et al. RNA‐sequencing of a mouse‐model of spinal muscular atrophy reveals tissue‐wide changes in splicing of U12‐dependent introns. Nucleic Acids Res 2017;45(1):395–416. [DOI] [PMC free article] [PubMed] [Google Scholar]
- 16. Parsian AJ, Sheren JE, Tao TY, et al. The human Hsp70B gene at the HSPA7 locus of chromosome 1 is transcribed but non‐functional. Biochim Biophys Acta 2000;1494(1–2):201–205. [DOI] [PubMed] [Google Scholar]
- 17. Leung TK, Hall C, Rajendran M, et al. The human heat‐shock genes HSPA6 and HSPA7 are both expressed and localize to chromosome 1. Genomics 1992;12(1):74–79. [DOI] [PubMed] [Google Scholar]
- 18. Leung TK, Rajendran MY, Monfries C, et al. The human heat‐shock protein family. Expression of a novel heat‐inducible HSP70 (HSP70B') and isolation of its cDNA and genomic DNA. Biochem J 1990;267(1):125–132. [DOI] [PMC free article] [PubMed] [Google Scholar]
- 19. Swoboda KJ. Romancing the spliceosome to fight spinal muscular atrophy. N Engl J Med 2014;371(18):1752–1754. [DOI] [PMC free article] [PubMed] [Google Scholar]
- 20. Dubrez L, Causse S, Borges Bonan N, et al. Heat‐shock proteins: chaperoning DNA repair. Oncogene 2020;39(3):516–529. [DOI] [PubMed] [Google Scholar]
- 21. Sottile ML, Nadin SB. Heat shock proteins and DNA repair mechanisms: an updated overview. Cell Stress Chaperones 2018;23(3):303–315. [DOI] [PMC free article] [PubMed] [Google Scholar]