

Abstract
Genome-wide association studies have been successful mapping loci for individual phenotypes, but few studies have comprehensively interrogated evidence of shared genetic effects across multiple phenotypes simultaneously. Statistical methods have been proposed for analyzing multiple phenotypes using summary statistics, which enables studies of shared genetic effects while avoiding challenges associated with individual-level data sharing. Adaptive tests have been developed to maintain power against multiple alternative hypotheses because the most powerful single-alternative test depends on the underlying structure of the associations between the multiple phenotypes and a single nucleotide polymorphism (SNP). Here we compare the performance of six such adaptive tests: two adaptive sum of powered scores (aSPU) tests, the unified score association test (metaUSAT), the adaptive test in a mixed-models framework (mixAda) and two principal-component-based adaptive tests (PCAQ and PCO). Our simulations highlight practical challenges that arise when multivariate distributions of phenotypes do not satisfy assumptions of multivariate normality. Previous reports in this context focus on low minor allele count (MAC) and omit the aSPU test, which relies less than other methods on asymptotic and distributional assumptions. When these assumptions are not satisfied, particularly when MAC is low and/or phenotype covariance matrices are singular or nearly singular, aSPU better preserves type I error, sometimes at the cost of decreased power. We illustrate this trade-off with multiple phenotype analyses of six quantitative electrocardiogram traits in the Population Architecture using Genomics and Epidemiology (PAGE) study.
Introduction
Genetic susceptibility underlies a majority of complex phenotypes, as illustrated by thousands of loci (1) that have been identified in genome-wide association studies (GWAS). This large body of published GWAS has enabled fresh insights into the genetic architecture underlying complex phenotypes, including strong evidence of shared genetic effects (i.e. pleiotropy), even among phenotypes with few known etiologic links (2–4). Shared genetic effects have the potential to identify novel biologic pathways (2), inform drug development and disease classification (3–6), clarify adverse drug reactions (7), advise on crucial assumptions underlying Mendelian randomization (MR) studies (8) and increase statistical power (9,10). However, few studies have systematically identified and characterized evidence of such effects across a spectrum of complex phenotypes.
The limited number of studies interrogating shared genetic effects across a broad phenotypic spectrum may reflect the difficulty of accurately measuring common and rare phenotypes spanning phenotypic domains (e.g. cardiovascular, metabolic, cancer, kidney, liver, psychiatric, ocular, neuromuscular and dermatological) and life stages (e.g. childhood, adulthood, pregnancy) in large populations. Statistical methods that leverage publicly available GWAS summary statistics offer a method for studying genetic effects shared within or across phenotypic domains, while avoiding challenges associated with individual-level data sharing. These summary statistics are generally more flexible for incorporating data comprised of related individuals and/or multiple outcome types, as well as overlapping participants. Although multiple phenotype methods are not directed at establishing pleiotropy, they can identify loci where a more explicit evaluation of pleiotropy is warranted (3). While several statistical methods have been proposed for multiple phenotype testing using summary statistics, comprehensive comparisons are only now emerging (e.g. (11)) despite considerable interest in multiple phenotype testing not only for GWAS (12,13), but also when interrogating ‘OMIC correlates of health and disease (14,15). Few comparative evaluations have been published to review the expanding range of tools for multiple phenotype analyses, and there is incomplete guidance on the relative merits of different methods across practical settings.
Methods that rely on summary data use a matrix of single nucleotide polymorphism (SNP)-phenotype association statistics to compute a SNP-specific multiple phenotype association test. Multiple papers have shown that a correlation matrix can be estimated either by computing the correlation among non-significant association statistics directly to obtain an estimate of residual phenotypic correlation (16–18) or by using them as inputs to an LD-score regression approach (19) to obtain an estimate of genetic correlation. The methods considered in this paper use phenotypic correlation estimates. Given the test statistics and the estimated correlation matrix, there are many ways to combine the information across phenotypes to test the null hypothesis that there is no genetic association with any of the phenotypes, e.g. summing over phenotypes, focusing on the biggest test statistics by raising them to a power or considering only the biggest one, and/or transforming the data prior to combination (16–18,20–21) (Table 1). Each unique combination of test statistics maintains power against a different alternative hypothesis. Researchers rarely know the underlying structure of the relationships among the phenotypes and a given SNP, and this structure likely varies across SNPs. Therefore, adaptive tests that maintain power against multiple alternative hypotheses have been proposed for use on a genome-wide basis (Table 2).
Table 1.
Methods that are powerful against a single alternative. Columns describe the way that the phenotype-specific association statistics Zk are combined across K phenotypes, while rows represent different approaches to transforming these association statistics before combining them. Specifically, the identity transformation (I) implies no change to the statistic, the T−1 transformation implies rotation onto the orthogonal coordinate system defined by the eigenvectors of the estimated correlation matrix R, e.g. PC1 = umaxTZ where umax is the eigenvector associated with the largest eigenvalue of R, and the R−1 transformation implies multiplying the Z-scores by the inverse of the estimated correlation matrix, e.g. VC = ZTR−1R−1Z. The notation SPU* implies SPU using this R−1 transformation
| L1 norm | L2 norm | Lγ norm | L∞ norm | ||
| Statistic |

|

|

|

|
|
| Transformation | I | Burden test; SPU(1) | SSU; SPU(2); PCQ0 | SPU(γ) | minP; SPU(Inf) |
| T−1 | PC1, PC2, etc | Wald; CCA; metaMANOVA; PCQ1 | PCminP | ||
| R−1 | Shom; SPU*(1); MPAT fixed effect; PCLC | VC; Shet (no threshold); MPAT variance of random effect; PCQ2; SPU*(2) | SPU*(γ) | SPU*(Inf) |
Table 2.
Adaptive methods that maintain power against multiple alternatives. Each column describes a different adaptive test, while the rows indicate which type of tests are included in each adaptive test, how P-values are estimated, and how much computational time is needed for each test. Computational burden is based on analyses of simulated data for one million SNPs, n = 1000, MAF = 0.05, and five traits with correlation of 0.6, using 20 CPUs (Intel Xeon E5–2680) on the University of North Carolina cluster
| aSPU | aSPU* | metaUSAT | mixAda | PCAQ | PCO | |
|---|---|---|---|---|---|---|
| Sum | SPU(1) | SPU*(1) | SPU*(1) | SPU*(1) | ||
| Sum of squares | SPU(2) | SPU*(2) | SSU=SPU(2) Wald |
VC | SSU=SPU(2) Wald VC |
SSU=SPU(2) Wald VC |
| Sum of powers | … | … | ||||
| Maximum | SPU(Inf) | SPU*(Inf) | PCminP | |||
| Non-linear | PCFisher | |||||
| P-value computation | Monte Carlo simulations to get reference distribution | Monte Carlo simulations to get reference distribution | numerical integration with reference distribution being a mixture of (potentially dependent) chi-square distributions | numerical integration with reference distribution being a mixture of independent chi-square distributions | assuming MVN of inverse-normal-transformed P-values, with covariance estimated via Monte Carlo simulations | assuming MVN of inverse-normal-transformed P-values, with covariance estimated via Monte Carlo simulations |
| Computational burden (CPU-hours) | 12.2 | 11.4 | 4.7 | 13.7 | 33 | 64 |
These adaptive tests are the ones that we evaluate in this manuscript; specifically, we include two versions of the adaptive sum of powered scores (aSPU) test (18), the unified score association test using summary data (metaUSAT) (20), the test based on both fixed effects and variance components from a mixed model (mixAda) (17), and two principal-component-based tests (PCAQ and PCO) (21). In general, the adaptive tests seek to simultaneously account for distinct patterns of homogeneous and heterogeneous SNP effects across phenotypes. They do so by incorporating different combinations of tests from Table 1 and estimating P-values using different methods. Thus, their properties depend both on what components are included in the statistic and on how P-values are computed. All adaptive methods except aSPU incorporate at least one test that transforms the Z statistics using the inverse of the estimated correlation matrix. It is possible to transform the Z statistics in aSPU, which we denote aSPU*, but the test that does not include the estimated correlation in the test statistic is recommended (18).
Some of these adaptive tests, plus multiple phenotype tests using individual-level data and tests that are powerful against a single alternative hypothesis, were evaluated by Ray and Chatterjee (11) in scenarios where the assumption of multivariate normality (MVN) was not satisfied and minor allele count (MAC) was low. However, their examination excluded aSPU, perhaps due to its computational burden. In this paper, using our newly developed, more efficient implementation of aSPU in the Julia language (13), we add aSPU to performance comparisons when MAC is low and the MVN assumption is not satisfied. We also evaluate an additional scenario in which violation of the MVN assumption leads to inflated type I error rates: when phenotype correlation matrices are singular or nearly singular, a situation not previously reported.
To evaluate the performance of the six adaptive multiple phenotype tests, all of which can be implemented in multiethnic populations using only summary GWAS data, we present results from a series of simulations, paired with data from a multiethnic cohort, the Population Architecture using Genomics and Epidemiology (PAGE) study (22). Based on our results we provide practical advice for choosing a method in general as well as specific advice when the MAC is low or the phenotypes of interest are highly correlated.
Results
In this section we present comparisons of adaptive multiple phenotype test levels and power both when MAC is low and when phenotypic correlation matrices are nearly singular, first using summary statistics generated via simulations and then using data collected in the PAGE multiethnic cohort study. For the simulations, we use one sample of 1000 people per phenotype, with varying MAC, phenotype correlation and multivariate distribution as detailed in the Materials and Methods section.
Simulations comparing the tests’ levels: low MAC
Figure 1 compares type I error of the six tests when traits have a multivariate t (MVT) distribution with 5 degrees of freedom (df) and SNP MAC ranges from 20 to 300. For a MAC of 20–30, all methods had inflated type I error, though aSPU had the least inflation (Fig. 1C and D). For a MAC of 100, only aSPU had appropriate control of type I error (Fig. 1B). For a MAC of 300, all methods showed control of type I error (Fig. 1A).
Figure 1 .
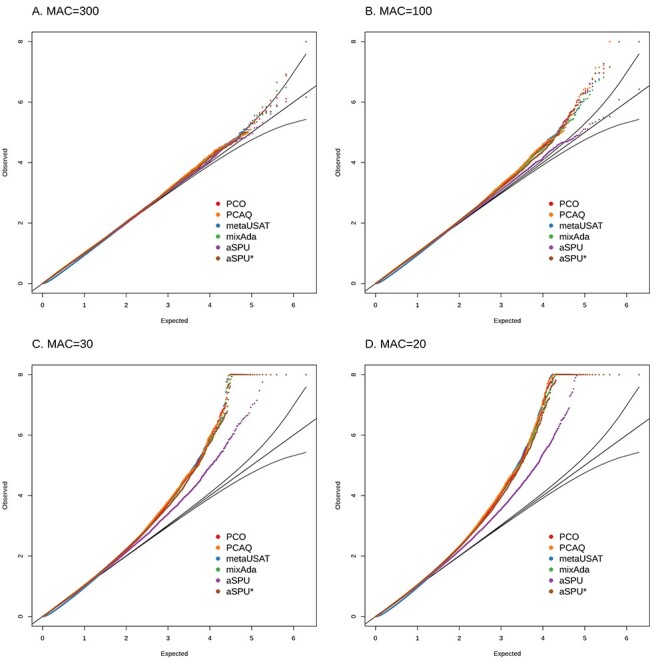
Simulations under the null hypothesis with low effective sample size, specifically MAC ranging from 20 to 300, as indicated in the figure. Five traits with pairwise correlation of 0.6 and MVT distribution with 5 df are simulated. For each scenario and each method, figures include q-q plots of the observed versus expected −log10 P-values, including 95% prediction bands for the null hypothesis.
Simulations using MVT distributions with 3 and 10 df are included in Supplementary Material, Figs. S1 and S2. They show that type I error is preserved at lower MAC when the underlying multivariate trait distribution was closer to normality (Supplementary Material, Fig. S1), that higher MAC is required to preserve type I error when the underlying multivariate trait distribution was further from normality (Supplementary Material, Fig. S2), and that the comparisons among methods are similar for all displayed MVT distributions.
Simulations comparing the tests’ powers: low MAC
The six tests’ power can only be compared in scenarios where all of the tests preserve type I error. For SNPs with MAC of 30, we compared power when the traits have an MVN distribution, where type I error is preserved (Supplementary Material, Fig. S3). Figure 2 shows that the relative power of the methods depended on the correlation among traits and the pattern of the effects. When the SNP variant had the same effect size for all five traits, all methods have similar power. However, when only a subset of the traits was associated, aSPU has lower power than the other methods, particularly when the trait correlation was strong (Fig. 2A). That said, with strong trait correlation, it would be surprising for only a subset of the traits to have a genetic effect, so the scenario for the left panel in Figure 2A would not be common in empirical data.
Figure 2 .
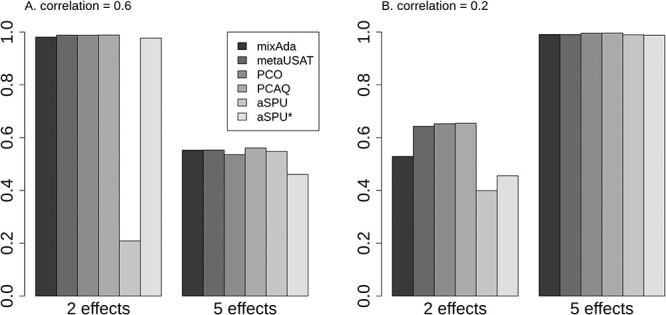
Estimated power using multivariate data for five traits simulated under an MVN distribution with exchangeable correlation of 0.2 or 0.6. Simulated SNPs have MAC of 30, and either two or five traits have SNP effects, with a constant effect size based on SNP-specific genetic variance of 2.5%.
Simulations comparing the tests’ levels: near-singularity of correlation matrix
Figure 3 illustrates type I error of these tests for more common SNPs and traits that have a nearly singular correlation matrix and are far from MVN assumptions. In these simulations, modeled on six contiguous ECG traits that are each adjusted for their sum, all methods had inflated type I error for an MVT distribution with 2 df (Fig. 3A), but as the df increased, the performance of all methods improved. With higher df, aSPU had less type I error (Fig. 3B and C) than other methods. The closer the underlying trait distribution was to MVN, the less influential a nearly singular correlation structure was on the validity of the test. When one trait was excluded so that the trait correlation matrix was no longer nearly singular, all methods still had inflated type I error for an MVT distribution with 2 df (Supplementary Material, Fig. S4A), but the inflation was much less substantial than when the correlation matrix was nearly singular. With 3–5 df, all methods had minimal type I error (Supplementary Material, Fig. S4B–D).
Figure 3 .
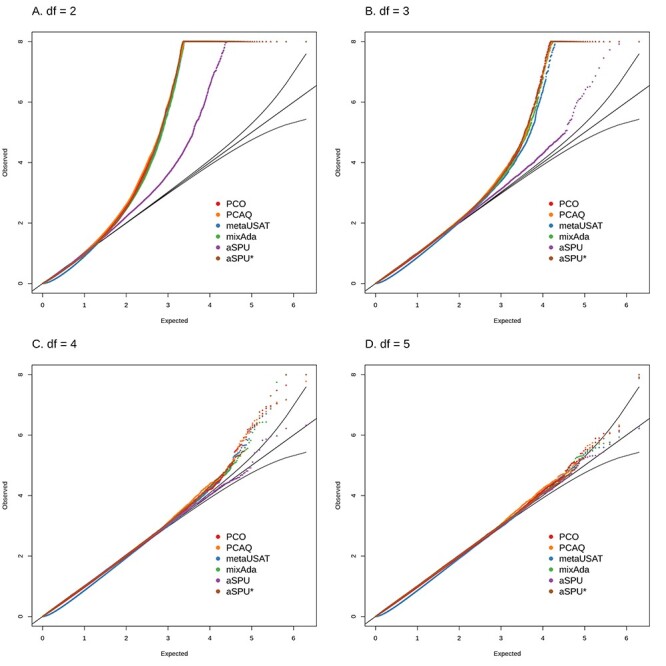
Simulations under the null with non-normal trait distributions, specifically MVT with 2–5 df in plots (A)–(D). Six traits with high correlation modeled on the ECG components in Table 3C, and a SNP with MAC = 600 are simulated. For each scenario and each method, figures include q-q plots of the observed versus expected −log10 P-values, including 95% prediction bands for the null hypothesis.
Simulations comparing the tests’ levels under two other relationships among traits—a linear relationship and a non-linear relationship—are included in Supplementary Material, Figs. S5 and S6. When traits linearly determine each other, all methods except aSPU, and sometimes mixAda, had substantial type I error for a range of MVT distributions, and even when MVN assumptions were satisfied (Supplementary Material, Fig. S5). When traits have a non-linear relationship, for all methods except aSPU there was still substantial type I error for MVT distributions with less than 5 df, though it was less pronounced than in the case of a linear relationship and resolved for df of 5 and higher (Supplementary Material, Fig. S6).
The amount of type I error in these simulations reported in Figure 3 and Supplementary Material, Figures S4–S6 was directly related to the trait correlation matrix condition number, a measure of degree of singularity (23). The condition number was essentially infinite for the linearly related traits, intermediate at 151 for the non-linearly related traits, smaller yet still elevated at 47 for the traits that sum to an adjustment variable, and smallest at 2 when one of the traits that sum to the adjustment variable was excluded.
Simulations comparing the tests’ powers: near-singularity of correlation matrix
Power of the tests was compared in scenarios where correlation matrices were nearly singular and all tests preserved type I error (Supplementary Material, Fig. S7). Figure 4 presents power comparisons based on sets of both five and six ECG traits with MVN distributions and several different patterns of association that are based on published ECG results. Specifically, we included three scenarios as described in Table 4: 1) a strong (genome-wide significant) association with one trait plus a moderate (P = 5 × 10⁻⁴) association with another trait (Strong + Moderate), 2) multiple moderate associations (P = 5 × 10⁻³ to 1 × 10⁻⁵) plus a strong association with the most highly correlated trait (Multiple Moderate) and 3) a strong association with only one trait (Strong only).
Figure 4 .
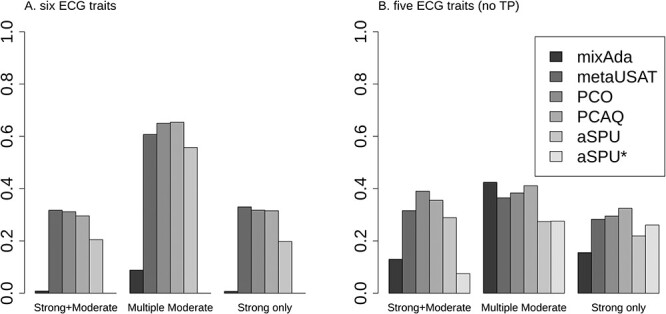
Estimated power using multivariate data simulated using the correlation of ECG traits with MVN distribution. Simulated SNPs have MAC of 600, and three patterns of association are included, as specified in Table 4.
Table 4.
P-values and directions of effect that were used in simulations to estimate relative power of multiple phenotype methods in the context of a nearly singular correlation matrix. The P-values and directions of effect for these SNPs were taken from analyses of PAGE ECG data using aSPU (11). They were converted into effect sizes for simulations by incorporating the standard error of the effect, which is a function of the number of people (1000) and the MAF (0.3) used in simulations
| Motivating SNP | P wave | PR segment |
QRS interval |
ST segment |
T wave | TP segment |
|
|---|---|---|---|---|---|---|---|
| Strong + Moderate | rs13143308 | 2 × 10 −11; − | 5 × 10⁻⁴; + | 2 × 10⁻¹; − | 3 × 10⁻²; − | 3 × 10⁻¹; + | 1 × 10⁻¹; + |
| Multiple Moderate | rs3211938 | 2 × 10⁻⁵; − | 8 × 10⁻³; − | 5 × 10⁻³; − | 4 × 10⁻¹; + | 1 × 10⁻⁵; − | 1 × 10 −13; + |
| Strong only | rs13047360 | 7 × 10⁻¹; + | 3 × 10⁻²; + | 2 × 10 −11; − | 2 × 10⁻¹; − | 5 × 10⁻²; + | 1 × 100; + |
Figure 4 shows that the relative power of different methods to analyze associations varied depending on the size and direction of effects, as well as the trait correlation matrix. For Strong + Moderate and Strong only, metaUSAT, PCO and PCAQ had the highest power, with the relative ordering of the other three methods dependent on the trait correlation matrix and whether there was a second moderate effect. Specifically, when the correlation was nearly singular (Fig. 4A), both mixAda and the transformed version of aSPU (aSPU*) had negligible power, while the untransformed version of aSPU had power closer to metaUSAT, PCO and PCAQ. On the other hand, when the correlation was not nearly singular (Fig. 4B), all three of aSPU, aSPU* and mixAda had higher power, though still not as high as metaUSAT, PCO and PCAQ. In the Strong + Moderate scenario of Figure 4B, aSPU had power close to metaUSAT, PCO and PCAQ, whereas in the Strong only scenario, aSPU’s power was reduced while mixAda’s and aSPU*’s powers were higher. In the Multiple Moderate scenario, the comparison of the tests’ power when the correlation matrix was nearly singular (Fig. 4A) was similar to the comparison under the Strong + Moderate and Strong only scenarios. However, when the trait correlation matrix was not nearly singular (Fig. 4B), mixAda had the highest power, followed by PCAQ, PCO and metaUSAT, and both versions of aSPU had a bit lower power. Overall, in the scenarios we considered where type I error is preserved, metaUSAT, PCO and PCAQ consistently had the highest power. However, aSPU’s power was not dramatically lower, making it a reasonable alternative in scenarios where type I error of the other methods may not be preserved.
PAGE analyses
Multiple phenotype analyses of six ECG phenotypes in the PAGE study (13) provide a published example where the trait correlation matrix was nearly singular and the data were analyzed using aSPU. Figure 5 compares the six adaptive methods using the same data on the 34 668 participants, but for an expanded set of SNPs with no MAF or MAC filters. The figure includes only likely null SNPs for which all single-phenotype P-values were  1 × 10⁻⁴, and these are stratified by minor allele frequency (MAF) greater or less than 0.05 and inclusion of five moderately correlated or all six highly correlated traits. Figures 5A and C show that when using six ECG traits, all multiple phenotype methods except aSPU had much lower P-values than expected, likely reflecting inflated type I error, regardless of MAF category. When using only the five less correlated ECG traits, excluding TP segment, Figures 5B and D show that all methods yielded many fewer low P-values, likely reflecting less inflated type I error. Again results were similar regardless of MAF category. Results from aSPU look truly null, whereas other methods still included more low P-values than would be expected under the null; it is impossible to know whether these low P-values represent inflated type I error or actual associations.
Figure 5 .
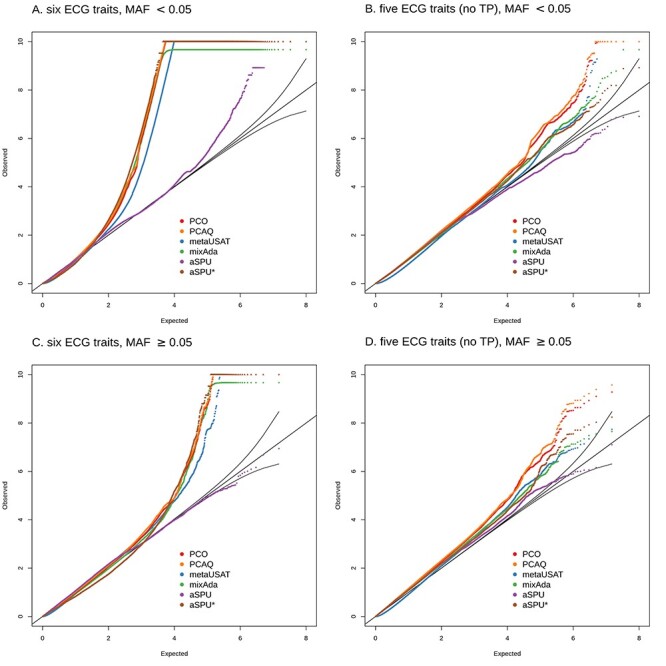
Adaptive multiple phenotype tests of ECG traits in PAGE data, including SNPs with all six single-phenotype P-values >1 × 10⁻⁴. (A) and (C) include all six highly correlated ECG traits [P wave, PR segment, QRS interval, ST segment, T wave and TP segment], whereas (B) and (D) exclude TP segment, which is most highly correlated with the other traits. The top row includes the 50 million SNPs with MAF < 0.05, while the bottom row includes the 7.5 million SNPs with MAF ≥ 0.05. For each scenario and each method, subfigures include q-q plots of the observed versus expected −log10 P-values, including 95% prediction bands for the null hypothesis.
Restricting to the SNPs that were included in published analyses of the ECG traits, first using all six traits, then excluding TP segment, Figure 6 shows the number of significant SNPs (P < 5 × 10⁻⁹) identified with the different adaptive tests. Results from PCO and PCAQ were quite similar, so we only show the PCO results. Both the performance of tests and the comparison of test results were substantially different when the trait correlation matrix was nearly singular (Fig. 6A) from what they were when the trait correlation matrix was not nearly singular (Fig. 6B). Because we cannot know which results represent true associations versus false positives or false negatives, we cannot know for sure which methods performed better in these empirical results.
Figure 6 .
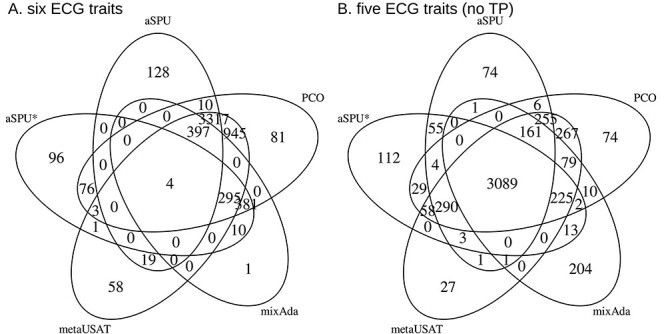
Venn diagrams showing significant SNPs (P < 5 × 10⁻⁹), among the 17.6 million with MAF > 0.01 in at least one stratum, in analyses of PAGE summary statistics from six ECG traits with nearly singular correlation matrix [P wave, PR segment, QRS interval, ST segment, T wave and TP segment] in plot (A) and five ECG traits with substantially less singular correlation matrix [excluding TP segment] in plot (B).
However, informed by our simulations of null data when the correlation matrix is nearly singular, we suspect that for all methods except aSPU there were hundreds of SNPs that may be false positives in the six-trait analysis. Specifically, none of the 295 SNPs identified as significant by all tests except aSPU in Figure 6A was significant using any of the methods in the five-trait analysis, and only two of the 295 had a single-trait P-value <1 × 10⁻⁴ for TP segment. Additionally, none of the 381 SNPs identified as significant by only PCO, mixAda and aSPU* was identified as significant using any method in the five-trait analysis, and none of the 381 had a significant P-value for association with TP segment.
Potential differences in power are also hard to characterize in actual data. However, mixAda and aSPU* identified many fewer significant results than the other methods when the correlation matrix was nearly singular in Figure 6A, despite being more consistent with them when the correlation matrix was not nearly singular in Figure 6B. This relationship is consistent with our simulated power results in Figure 4. The 3718 SNPs significant using aSPU, metaUSAT and PCO in the six-trait analyses (Fig. 6A) were also significant either for TP segment alone or using at least one method in the five-trait analyses. The same is true for the 945 SNPs that were only significant using metaUSAT and PCO (Fig. 6A). For these 945 SNPs, aSPU P-values ranged from 5 × 10⁻⁴ to 5 × 10⁻⁹, providing some evidence that many of these SNPs may be true associations that aSPU did not have power to detect. This hypothesis is consistent with aSPU’s lower power in simulations shown in Figure 4. We do note, however, that some of these additional significant SNPs could also be due to metaUSAT and PCO having inflated type I error in this setting.
Discussion
In this paper, we compared six adaptive multiple phenotype tests that can be implemented on a genome-wide scale using summary data. When MVN assumptions are not satisfied, we confirmed recent findings that five of the tests can have inflated type I error for SNPs with low MAC (11), and showed that the sixth test can also suffer from inflated type I error for SNPs with low MAC. We also contribute new findings illustrating how all six tests can also have inflated type I error when phenotypic correlation is nearly singular. And we show that the sixth test, aSPU, is more robust to the violation of MVN assumptions than the other adaptive methods. In some scenarios, the increased robustness of aSPU may come at the cost of less statistical power than the other tests. We provide empirical evidence in PAGE data that supports the existence of this trade-off, though this evidence could also be the result of poor type I error control. Thus, in practical applications, the choice of adaptive test, as well as decisions about what SNPs and what phenotypes to include, should consider both the amount of information in terms of MAC and the correlation among the phenotypes.
All methods make assumptions about the MVN nature of the joint Z-statistics; however, their robustness to violation of those assumptions varies, depending on whether the test statistics are transformed using the inverse of the estimated correlation across phenotypes. Of the adaptive tests, aSPU is the only test that does not incorporate the inverse of the estimated correlation matrix in the test statistic; instead, it uses the estimated correlation only in the computation of the reference distribution. This feature makes aSPU more robust to violation of MVN assumptions. However, as noted by previous researchers (11,20), the most powerful test for a given SNP is a complicated function of the pattern of correlation among traits and the trait-specific associations. In scenarios where type I error is preserved by all methods, our simulations have shown that aSPU may have decreased power compared to methods that use transformed test statistics to evaluate multivariate associations. That said, the patterns of correlation and effects across traits will often be more complicated than what is presented in this paper, so these power comparisons do not provide a comprehensive view of all possibilities.
Ray and Chatterjee (11) evaluated scenarios where the effective sample size is low, concluding that the most reliable option was MultiPhen (24), a reverse regression proportional-odds approach that uses a likelihood ratio test and requires individual-level data. When only summary-level data are available, some improvement on the options considered by Ray and Chatterjee can be achieved by choosing aSPU which does not rely as heavily on asymptotic MVN distribution of the traits. However, with low enough MAC, even aSPU does not have enough information to provide good estimates of multiple phenotype associations when MVN assumptions are not satisfied, so a phenotype-specific MAC cutoff is recommended. The appropriate phenotype-specific MAC cutoff depends on how severe the departure from normality is and what method will be used. In simulated data, we have found that for single-study results analyzed with aSPU a cutoff of 40 is adequate if the true distribution is MVT with 10 df (Supplementary Material, Fig. S1), and a cutoff closer to 100 is needed for a t distribution with 5 df (Fig. 1). Examining rarer SNPs is of course of interest, but power is typically low, so some method of combining rare SNPs will be necessary. A SNP combination method has been developed using individual-level data (25), and more recently, using summary data (26).
As in the case of small MAC, when the estimated correlation matrix is nearly singular, aSPU without the estimated inverse correlation matrix in the test statistic has better type I error properties than other tests. However, given enough departure from normality, aSPU has inflated type I error in line with the other adaptive multiple phenotype methods. While several methods are available to test MVN assumptions (27) they may not have enough power to detect important deviations in subsets of SNPs, and there is no established method to test MVN assumptions using summary data across the many SNPs included in GWAS. Univariate normality for each phenotype also is not sufficient to establish MVN, and the impact of this is greatest when there is insufficient data for asymptotic distribution theory to apply (11,28). Therefore, we recommend that analysts think carefully about the relationships among their phenotypes of interest and check explicitly for near singularity of their estimated covariance matrix, for example by checking its condition number. If the condition number is large, analysts should consider omitting highly correlated traits, particularly when using a method that incorporates the inverse correlation matrix into the test statistic.
Related to the issue of near-singularity of the correlation matrix is the question of the number of traits that these methods can accommodate. As the number of traits increases, both the computational complexity and the chance that the correlation matrix is singular increase. New methods that accommodate the near singularity of the correlation matrix are being developed for investigation of pleiotropy across larger numbers of traits, for example across 58 brain volumetric measures available in the UK Biobank (29).
Another practical issue in multiple phenotype analyses is the need to estimate a correlation matrix. Most adaptive multiple phenotype methods can accommodate use of either a phenotypic or a genetic correlation matrix. The methods discussed in this paper used phenotypic correlation matrices, which must be accurately estimated to satisfy MVN assumptions. Ray and Boehnke (20) acknowledged the importance of the correlation estimate but found minimal practical issues in simulations with mis-specified covariance estimates. Recent work has indicated that genetic correlation matrices may be preferable (30); however, under the null hypothesis the correlation among test statistics reflects phenotypic correlation, so test results can differ substantially when genetic correlation estimates are used instead. Additionally, using summary data to estimate genetic correlation typically relies on bivariate LD score regression methods (19), which are not straightforward to apply to multiethnic data and may suffer inaccuracies when there is genetic heterogeneity between the actual sample and the reference data (31). Methods in development aim to estimate genetic correlation more accurately in diverse populations, but these methods currently require individual-level genotype data (32). Future work that facilitates estimation of genetic correlation in multiethnic populations using summary data could improve the performance of these adaptive multiple phenotype methods.
In this paper, we focus on methods that can be implemented using summary data on multiple phenotypes in multiethnic populations. Several other methods have been developed, but do not directly apply in this context. One such method is multi-trait analysis of GWAS (MTAG), the goal of which is to obtain a more powerful test of each single trait’s association by incorporating its correlation with other traits (33). The trait-specific estimates MTAG provides are weighted sums of the GWAS estimates and can be combined using a minimum P-value type approach to test the hypothesis that one or more of the traits are associated with the SNP, which is the goal of the methods evaluated herein. MTAG uses LD-score regression to account for all types of estimation error, including sampling error, population stratification, sample overlap and cryptic relatedness. A related, recently proposed method that also uses results from LD-score regression is Pleiotropic Locus Exploration and Interpretation using Optimal test (PLEIO) (34). PLEIO is specifically designed to detect SNPs with multiple phenotype associations. Both of these LD-score regression approaches work well in large homogeneous samples for which reference populations can be easily defined. However, with smaller sample sizes and more diverse populations, their utility is less clear.
Other methods excluded from our comparisons include Bayesian approaches such as CPBayes (35) and reverse regression methods such as meta-SCOPA (36). Bayesian approaches have the advantage of providing explicit information about the optimal subset of associated traits but are computationally intensive. Reverse regression approaches require the same set of phenotypes to be available across all studies. Although one reverse regression approach (MultiPhen) (24) has been shown to preserve type I error with small MAC and under violation of MVN assumptions, it currently requires individual level data, does not permit imputed SNP data, and does not meaningfully adjust for population structure and relatedness. meta-SCOPA addresses some of these concerns but still requires new analysis of individual-level data before aggregating information across studies. Reverse regression may also suffer loss of power if all phenotypes are not available in all people or if measurement error varies across phenotypes.
Genetic epidemiology has entered the era of mega-GWAS, where researchers can leverage data from hundreds of thousands of participants to enable very well-powered studies. Despite the anticipated large statistical power from these studies, multiple phenotype studies still represent a valuable suite of tools, particularly for rare diseases, diseases more common in populations poorly represented in contemporary GWAS, when examining other ‘OMICs (e.g. epigenomics or metabolomics), or in subgroup analyses. Ultimately, researchers will need to balance control of type I error against the potential for reduced statistical power.
Materials and Methods
aSPU computation
Previous efforts comparing adaptive multiple phenotype methods did not include aSPU (11). At a genome-wide scale, estimation of P-values can be computationally intensive for any of the adaptive methods, but the Monte Carlo simulations used for aSPU can be particularly burdensome given the large number of iterations that are needed to estimate accurate P-values at low significance thresholds. We (ARB) developed a Julia (37) implementation of aSPU that optimizes resource usage (https://github.com/kaskarn/JaSPU) by reusing simulated z-scores across SNPs, parsimoniously storing simulated draws with a potential impact on the computation end results, and leveraging the high-performance Julia language. Using this implementation of aSPU, P-values can be computed as quickly as for current implementations of the other methods under consideration (Table 2). Unlike the other tests we consider, for which the computational burden scales linearly with the number of SNPs, our algorithm for aSPU requires less computational time for a large number of SNPs, because the rate-limiting step in simulating the null distribution does not depend on the number of SNPs. This comparison is not entirely fair because for other methods we use R functions that have not been optimized for large numbers of SNPs, but the fact that it is currently possible to run aSPU in a comparable time-frame to the other methods enables us to add it to methods comparisons.
Simulations
All simulations and analyses were conducted in R version 3.1.1 (38), with the exception of aSPU analyses, which used Julia. The phenotypic correlation matrix, which is used as an input to the multiple phenotype methods, was estimated using all SNPs with P-values greater than 1 × 10⁻⁴ in all traits. To obtain P-values for aSPU and aSPU*, 1010 Monte Carlo simulations were run.
Our simulation studies included traits for a fixed number of people (N = 1000) in a single study using a specified correlation matrix and multivariate distribution; SNP data were generated using a fixed MAF ranging from 0.01 to 0.3 to generate an MAC ranging from 20 to 600. Linear regression models for each trait-SNP association generated trait-specific Wald statistics that were used as inputs to multiple phenotype analyses. Simulations were replicated one million times for each scenario. Under the null hypothesis of no association with any phenotypes, uniformity of P-values was assessed visually using quantile–quantile (q-q) plots of the observed −log10 P-values versus expected −log10 P-values, including 95% prediction bands. Under the alternatives of known associations, power was estimated as the percentage of samples yielding a P-value <5 × 10⁻⁹ for each method. This cutoff reflects a Bonferroni correction for 10 million SNPs.
To evaluate performance of tests for low MAC and traits that are not multivariate normal (MVN), data were simulated for five traits with exchangeable correlation of 0.6 and trait distribution of multivariate t (MVT) with either 3 (Supplementary Material, Fig. S2), 5 (Fig. 1) or 10 (Supplementary Material, Fig. S1) degrees of freedom (df). An MVT distribution has heavier tails than an MVN distribution, with higher df corresponding to a distribution that is closer to MVN. MAC varied across simulations. Under the alternative, power was estimated assuming an MVN distribution with exchangeable correlation of 0.6 and 0.2, MAC of 30, and assuming either two traits were associated with the SNP or all five traits were associated (Fig. 2). In both cases, the effect sizes for each associated trait were set equal and calculated based on a genetic variance of 2.5% so that the power estimates were in a range that would illustrate any differences across methods. Simulations for the same scenarios were also run under the null to confirm that all methods preserved type I error (Supplementary Material, Fig. S3).
To evaluate tests when traits with nearly singular correlation matrix do not have an MVN distribution, data (MVT with varying df) were simulated for four scenarios: 1) linear relationship (Supplementary Material, Fig. S5) modeled on ECG data, specifically including QT interval and its two components QRS duration and JT interval in a single analysis (Supplementary Material, Fig. S8, correlation in Table 3A), 2) non-linear relationship (Supplementary Material, Fig. S6) modeled on including BMI, weight and height in a single analysis (correlation in Table 3B), 3) highly correlated but not directly determined relationship (Fig. 3) modeled on six contiguous ECG phenotypes that together add up to the RR interval, an adjustment variable in individual-phenotype analyses (correlation in Table 3C) and 4) less correlated relationship (Supplementary Material, Fig. S4) modeled on five of the contiguous ECG phenotypes, excluding TP segment which is the most correlated one (correlation in Table 3C). SNP data were generated using MAF = 0.3 so that MAC would be 600, minimizing any impact of small effective sample sizes on the relative performance of the methods.
Table 3A.
Phenotype correlation matrix estimated using Cohorts for Heart and Aging Research in Genomic Epidemiology (CHARGE) data for QT, QRS and JT. The eigenvalues of this matrix are 2.0, 1.0 and 0.00009. Darker shading implies stronger correlation
| QT | QRS | JT | |
|---|---|---|---|
| QT | 1.00 | ||
| QRS | 0.95 | 1.00 | |
| JT | 0.11 | -0.20 | 1.00 |
Table 3B.
Phenotype correlation matrix estimated using PAGE data for BMI, height and weight. The eigenvalues of this matrix are 1.9, 1.1 and 0.01. Darker shading implies stronger correlation.
| BMI | Weight | Height | |
|---|---|---|---|
| BMI | 1.00 | ||
| Weight | 0.85 | 1.00 | |
| Height | 0.08 | 0.42 | 1.00 |
Table 3C.
Phenotype correlation matrix estimated using meta-analyzed summary statistics for each of six ECG traits in the PAGE data, using SNPs with P-value greater than 1 × 10⁻⁴ in all traits. The eigenvalues of this matrix are 1.8, 1.4, 1.2, 1.0, 0.6 and 0.04. When TP segment is not included, the eigenvalues are 1.4, 1.2, 1.0, 0.8 and 0.6. Darker shading implies stronger correlation
| P wave | PR segment | QRS interval | ST segment | T wave | TP segment | |
|---|---|---|---|---|---|---|
| P wave | 1.00 | |||||
| PR segment | -0.12 | 1.00 | ||||
| QRS interval | 0.21 | -0.01 | 1.00 | |||
| ST segment | 0.02 | -0.01 | -0.04 | 1.00 | ||
| T wave | 0.00 | -0.07 | -0.26 | -0.24 | 1.00 | |
| TP segment | -0.44 | -0.59 | -0.20 | -0.14 | -0.38 | 1.00 |
Null data were simulated for all four of these scenarios, whereas power simulations were limited to the final two scenarios modeled on five and six contiguous ECG traits. Valid comparisons of power across methods require control of type I error across all methods, so power was estimated for traits with MVN distributions (Supplementary Material, Fig. S7 for null results and Fig. 4 for power). Three patterns of multivariate effects, based on previously published results (13), were considered (Table 4). The P-values and directions of effects were converted into effect sizes for simulations by incorporating the standard error of the effect, which is a function of the number of people and the MAF used in simulations.
PAGE Analyses
Illustrative analyses were also done using data from the PAGE study (22), evaluating genetic associations with the six components of a heartbeat, as measured on an ECG: P wave, PR segment, QRS interval, ST segment, T wave and TP segment (Supplementary Material, Fig. S8). Baldassari et al. (13) estimated genetic associations with each ECG trait using data imputed to the 1000-genomes reference panel. A total of 12 strata defined by race, ethnicity and genotyping platform were analyzed separately. Specifically, African-American (AA) and Hispanic/Latino (HIS) participants from the Women’s Health Initiative (WHI) and the Hispanic Community Health Study/Study of Latinos (HCHS/SOL) were genotyped together and thus analyzed together as one stratum, whereas other WHI participants [five European-American (EA) sub-studies], as well as those from the Multi-Ethnic Study of Atherosclerosis (MESA) [EA, AA, HIS and Chinese-American] and the Atherosclerosis Risk in Communities (ARIC) study [EA and AA], were analyzed separately. The results from these 12 strata were combined via inverse-variance-weighted meta-analysis to get one estimate of association for each trait-SNP combination. For each SNP, only strata with MAF > 0.01, R2imp > 0.3, where R2imp is a measure of imputation quality, and 2 × n × MAF × (1-MAF) × R2imp > 30 were included in the meta-analysis. The trait-specific meta-analytic results, which are publicly available (dbGaP Study Accession: phs000356.v2.p1 and NHGRI GWAS catalog), were then combined using aSPU to give an estimate of association that incorporates evidence from all traits simultaneously. For this paper, we reanalyzed those trait-specific meta-analytic results using the other adaptive multiple phenotype methods for the nearly 18 million available SNPs.
To illustrate performance in low MAC scenarios, we also reran meta-analyses without the filters based on MAF and 2 × n × MAF × (1-MAF) × R2imp, and used these summary statistics as inputs to multiple phenotype analyses. The smallest stratum had 315 people, so assuming high imputation quality, MAF of 0.05 would yield MAC of 30. Therefore, we stratified multiple phenotype analyses by MAF of 0.05 to try to separate impacts of low MAC from impacts of near-singular correlation.
Due to concern about the nearly singular correlation matrix among these six ECG components, which was computed from the PAGE test statistics, we repeated the multiple phenotype analyses using only five of the ECG components, excluding TP segment due to its strong negative correlations with the other ECG components.
Supplementary Material
Acknowledgements
This work was supported by the National Institutes of Health [R01HL142825 to C.M.S., A.R.B., H.M.H., C.J.H., and C.L.A.; U01HG007416 to C.L.A., A.R.B., H.M.H., and C.J.H.; T32HL129982 to C.J.H. and H.M.H.; T32HL007055 to H.M.H.; R01ES020836 to A.R.B.; and R01HL134894 to B.M.] and the American Diabetes Association [Grant #1-19-PDF-045 to H.M.H.].
Conflict of Interest statement. The authors have no conflicts of interest to declare.
Contributor Information
Colleen M Sitlani, Cardiovascular Health Research Unit, Department of Medicine, University of Washington, Seattle, WA 98101 USA.
Antoine R Baldassari, Department of Epidemiology, University of North Carolina at Chapel Hill, Chapel Hill, NC 27516 USA.
Heather M Highland, Department of Epidemiology, University of North Carolina at Chapel Hill, Chapel Hill, NC 27516 USA.
Chani J Hodonsky, Center for Public Health Genomics, University of Virginia, Charlottesville, VA 22908 USA.
Barbara McKnight, Department of Biostatistics, University of Washington, Seattle, WA 98195 USA.
Christy L Avery, Department of Epidemiology, University of North Carolina at Chapel Hill, Chapel Hill, NC 27516 USA.
References
- 1. Buniello, A., MacArthur, J.A.L., Cerezo, M., Harris, L.W., Hayhurst, J., Malangone, C., McMahon, A., Morales, J., Mountjoy, E., Sollis, E. et al. (2019) The NHGRI-EBI GWAS Catalog of published genome-wide association studies, targeted arrays and summary statistics 2019. Nucleic Acids Res., 47, D1005–D1012. [DOI] [PMC free article] [PubMed] [Google Scholar]
- 2. Yang, C., Li, C., Wang, Q., Chung, D. and Zhao, H. (2015) Implications of pleiotropy: challenges and opportunities for mining big data in biomedicine. Front. Genet., 6, 229. [DOI] [PMC free article] [PubMed] [Google Scholar]
- 3. Solovieff, N., Cotsapas, C., Lee, P.H., Purcell, S.M. and Smoller, J.W. (2013) Pleiotropy in complex traits: challenges and strategies. Nat. Rev. Genet., 14, 483–495. [DOI] [PMC free article] [PubMed] [Google Scholar]
- 4. Wu, Y.H., Graff, R.E., Passarelli, M.N., Hoffman, J.D., Ziv, E., Hoffmann, T.J. and Witte, J.S. (2018) Identification of pleiotropic cancer susceptibility variants from genome-wide association studies reveals functional characteristics. Cancer Epidemiol. Biomark. Prev., 27, 75–85. [DOI] [PMC free article] [PubMed] [Google Scholar]
- 5. Gandal, M.J., Haney, J.R., Parikshak, N.N., Leppa, V., Ramaswami, G., Hartl, C., Schork, A.J., Appadurai, V., Buil, A., Werge, T.M. et al. (2018) Shared molecular neuropathology across major psychiatric disorders parallels polygenic overlap. Science, 359, 693–697. [DOI] [PMC free article] [PubMed] [Google Scholar]
- 6. O'Donovan, M.C. and Owen, M.J. (2016) The implications of the shared genetics of psychiatric disorders. Nat. Med., 22, 1214–1219. [DOI] [PubMed] [Google Scholar]
- 7. Gratten, J. and Visscher, P.M. (2016) Genetic pleiotropy in complex traits and diseases: implications for genomic medicine. Genome Med., 8, 78. [DOI] [PMC free article] [PubMed] [Google Scholar]
- 8. Verbanck, M., Chen, C.-Y., Neale, B.M. and Do, R. (2018) Detection of widespread horizontal pleiotropy in causal relationships inferred from Mendelian randomization between complex traits and diseases. Nat. Genet., 50, 693–698. [DOI] [PMC free article] [PubMed] [Google Scholar]
- 9. Avery, C.L., He, Q., North, K.E., Ambite, J.L., Boerwinkle, E., Fornage, M., Hindorff, L.A., Kooperberg, C., Meigs, J.B., Pankow, J.S. et al. (2011) A Phenomics-based strategy identifies loci on APOC1, BRAP, and PLCG1 associated with metabolic syndrome phenotype domains. PLoS Genet., 7, e1002322. [DOI] [PMC free article] [PubMed] [Google Scholar]
- 10. He, Q., Avery, C.L. and Lin, D.-Y. (2013) A general framework for association tests with multivariate traits in large-scale genomics studies. Genet. Epidemiol., 37, 759–767. [DOI] [PMC free article] [PubMed] [Google Scholar]
- 11. Ray, D. and Chatterjee, N. (2020) Effect of non-normality and low count variants on cross-phenotype association tests in GWAS. Eur. J. Hum. Genet., 28, 300–312. [DOI] [PMC free article] [PubMed] [Google Scholar]
- 12. Hodonsky, C.J., Baldassari, A.R., Bien, S.A., Raffield, L.M., Highland, H.M., Sitlani, C.M., Wojcik, G.L., Tao, R., Graff, M., Tang, W. et al. (2020) Ancestry-specific associations identified in genome-wide combined-phenotype study of red blood cell traits emphasize benefits of diversity in genomics. BMC Genomics, 21, 228. [DOI] [PMC free article] [PubMed] [Google Scholar]
- 13. Baldassari, A.R., Sitlani, C.M., Highland, H.M., Arking, D.E., Buyske, S., Darbar, D., Gondalia, R., Graff, M., Guo, X., Heckbert, S.R. et al. (2020) Multi-ethnic genome-wide association study of decomposed cardioelectric phenotypes illustrates strategies to identify and characterize evidence of shared genetic effects for complex traits. Circ. Genom. Precis. Med., 13, e002680. [DOI] [PMC free article] [PubMed] [Google Scholar]
- 14. Baselmans, B.M.L., Jansen, R., Ip, H.F., van Dongen, J., Abdellaoui, A., van de Weijer, M.P., Bao, Y., Smart, M., Kumari, M., Willemsen, G. et al. (2019) Multivariate genome-wide analyses of the well-being spectrum. Nat. Genet., 51, 445–451. [DOI] [PubMed] [Google Scholar]
- 15. Inouye, M., Ripatti, S., Kettunen, J., Lyytikainen, L.P., Oksala, N., Laurila, P.P., Kangas, A.J., Soininen, P., Savolainen, M.J., Viikari, J. et al. (2012) Novel loci for metabolic networks and multi-tissue expression studies reveal genes for atherosclerosis. PLoS Genet., 8, e1002907. [DOI] [PMC free article] [PubMed] [Google Scholar]
- 16. Zhu, X., Feng, T., Tayo, B.O., Liang, J., Young, J.H., Franceschini, N., Smith, J.A., Yanek, L.R., Sun, Y.V., Edwards, T.L. et al. (2015) Meta-analysis of correlated traits via summary statistics from GWASs with an application in hypertension. Am. J. Hum. Genet., 96, 21–36. [DOI] [PMC free article] [PubMed] [Google Scholar]
- 17. Liu, Z. and Lin, X. (2018) Multiple phenotype association tests using summary statistics in genome-wide association studies. Biometrics, 74, 165–175. [DOI] [PMC free article] [PubMed] [Google Scholar]
- 18. Kim, J., Bai, Y. and Pan, W. (2015) An adaptive association test for multiple phenotypes with GWAS summary statistics. Genet. Epidemiol., 39, 651–663. [DOI] [PMC free article] [PubMed] [Google Scholar]
- 19. Bulik-Sullivan, B., Finucane, H.K., Anttila, V., Gusev, A., Day, F.R., Loh, P.R., ReproGen Consortium, Psychiatric Genomics Consortium, Genetic Consortium for Anorexia Nervosa of the Wellcome Trust Case Control Consortium, Duncan, L. et al. (2015) An atlas of genetic correlations across human diseases and traits. Nat. Genet., 47, 1236–1241. [DOI] [PMC free article] [PubMed] [Google Scholar]
- 20. Ray, D. and Boehnke, M. (2018) Methods for meta-analysis of multiple traits using GWAS summary statistics. Genet. Epidemiol., 42, 134–145. [DOI] [PMC free article] [PubMed] [Google Scholar]
- 21. Liu, Z. and Lin, X. (2019) A geometric perspective on the power of principal component association tests in multiple phenotype studies. J. Am. Stat. Assoc., 114, 975–990. [DOI] [PMC free article] [PubMed] [Google Scholar]
- 22. Wojcik, G.L., Graff, M., Nishimura, K.K., Tao, R., Haessler, J., Gignoux, C.R., Highland, H.M., Patel, Y.M., Sorokin, E.P., Avery, C.L. et al. (2019) Genetic analyses of diverse populations improves discovery for complex traits. Nature, 570, 514–518. [DOI] [PMC free article] [PubMed] [Google Scholar]
- 23. Trefethen, L.N. and Bau, D. (1997) Nuemerical Linear Algebra. Society for Industrial and Applied Mathematics, Philadelphia, PA. [Google Scholar]
- 24. O'Reilly, P.F., Hoggart, C.J., Pomyen, Y., Calboli, F.C., Elliott, P., Jarvelin, M.R. and Coin, L.J. (2012) MultiPhen: joint model of multiple phenotypes can increase discovery in GWAS. PLoS One, 7, e34861. [DOI] [PMC free article] [PubMed] [Google Scholar]
- 25. Zhan, X., Zhao, N., Plantinga, A., Thornton, T.A., Conneely, K.N., Epstein, M.P. and Wu, M.C. (2017) Powerful genetic association analysis for common or rare variants with high-dimensional structured traits. Genetics, 206, 1779–1790. [DOI] [PMC free article] [PubMed] [Google Scholar]
- 26. Dutta, D., Gagliano Taliun, S.A., Weinstock, J.S., Zawistowski, M., Sidore, C., Fritsche, L.G., Cucca, F., Schlessinger, D., Abecasis, G.R., Brummett, C.M. et al. (2019) Meta-MultiSKAT: multiple phenotype meta-analysis for region-based association test. Genet. Epidemiol., 43, 800–814. [DOI] [PMC free article] [PubMed] [Google Scholar]
- 27. Korkmaz, S., Goksuluk, D. and Zararsiz, G. (2014) An R package for assessing multivariate normality. The R Journal, 6, 151–163. [Google Scholar]
- 28. Stephens, M. (2013) A unified framework for association analysis with multiple related phenotypes. PLoS One, 8, e65245. [DOI] [PMC free article] [PubMed] [Google Scholar]
- 29. Wu, C. (2020) Multi-trait genome-wide analyses of the brain imaging phenotypes in UK biobank. Genetics, 215, 947–958. [DOI] [PMC free article] [PubMed] [Google Scholar]
- 30. Masotti, M., Guo, B. and Wu, B. (2019) Pleiotropy informed adaptive association test of multiple traits using genome-wide association study summary data. Biometrics, 75, 1076–1085. [DOI] [PMC free article] [PubMed] [Google Scholar]
- 31. Ni, G., Moser, G., Schizophrenia Working Group of the Psychiatric Genomics Consortium, Wray, N.R. and Lee, S.H. (2018) Estimation of genetic correlation via linkage disequilibrium score regression and genomic restricted maximum likelihood. Am. J. Hum. Genet., 102, 1185–1194. [DOI] [PMC free article] [PubMed] [Google Scholar]
- 32. Luo, Y., Li, X., Wang, X., Gazal, S., Mercader, J.M., 23 and Me Research Team, Sigma Type 2 Diabetes Consortium, Neale, B.M., Florez, J.C., Auton, A. et al. (2020) Estimating heritability and its enrichment in tissue-specific gene sets in admixed populations. bioRxiv, 503144. [DOI] [PMC free article] [PubMed] [Google Scholar]
- 33. Turley, P., Walters, R.K., Maghzian, O., Okbay, A., Lee, J.J., Fontana, M.A., Nguyen-Viet, T.A., Wedow, R., Zacher, M., Furlotte, N.A. et al. (2018) Multi-trait analysis of genome-wide association summary statistics using MTAG. Nat. Genet., 50, 229–237. [DOI] [PMC free article] [PubMed] [Google Scholar]
- 34. Lee, C.H., Shi, H., Pasaniuc, B., Eskin, E. and Han, B. (2021) PLEIO: a method to map and interpret pleiotropic loci with GWAS summary statistics. Am. J. Hum. Genet., 108, 36–48. [DOI] [PMC free article] [PubMed] [Google Scholar]
- 35. Majumdar, A., Haldar, T., Bhattacharya, S. and Witte, J.S. (2018) An efficient Bayesian meta-analysis approach for studying cross-phenotype genetic associations. PLoS Genet., 14, e1007139. [DOI] [PMC free article] [PubMed] [Google Scholar]
- 36. Magi, R., Suleimanov, Y.V., Clarke, G.M., Kaakinen, M., Fischer, K., Prokopenko, I. and Morris, A.P. (2017) SCOPA and META-SCOPA: software for the analysis and aggregation of genome-wide association studies of multiple correlated phenotypes. BMC Bioinformatics, 18, 25. [DOI] [PMC free article] [PubMed] [Google Scholar]
- 37. Bezansonn, J.E., Edelman, A., Karpinski, S. and Shah, V.B. (2017) Julia: a fresh approach to numerical computing. SIAM Rev., 59, 65–98. [Google Scholar]
- 38. R Core Team (2014) R: A language and environment for statistical computing. R Foundation for Statistical Computing, Vienna, Austria. [Google Scholar]
Associated Data
This section collects any data citations, data availability statements, or supplementary materials included in this article.