Abstract
Restoring intestinal microbiota dysbiosis with fecal microbiota transplantation is considered as a promising treatment for ulcerative colitis. However, the mechanisms underlying its relieving effects remain unclear. Ulcerative colitis pathogenesis is associated with the involvement of immune cells and inflammatory cytokines. Here, we aimed to investigate the effect of fecal microbiota transplantation on T cell cytokines in a dextran sulfate sodium-induced ulcerative colitis mouse model. Five-aminosalicylic acid (5-ASA) was used as the positive control. Male C57BL/6 mice were randomly assigned to control, model (UC), UC + FMT, and UC + 5-ASA groups. Each group consisted of five mice. The establishment of the mouse model was verified by fecal occult-blood screening and hematoxylin–eosin staining. Results showed that fecal microbiota transplantation reduced colonic inflammation, significantly decreased T helper (Th)1 and Th17 cells, interferon-gamma, interleukin-2 and interleukin-17, as well as significantly increased Th2 and regulatory T (Treg) cells, interleukin-4, interleukin-10, and transforming growth factor-beta, and improved routine blood count. Furthermore, 16S rRNA gene-sequencing analysis showed a significant increase in the relative abundance of genus Akkermansia and a significant decrease in the relative abundance of genus Helicobacter in the ulcerative colitis group. Fecal microbiota transplantation restored the profile of the intestinal microbiota to that of the control group. These findings demonstrated the capability of fecal microbiota transplantation in controlling experimentally induced ulcerative colitis by improving Th1/Th2 and Th17/Treg imbalance through the regulation of intestinal microbiota.
Keywords: Fecal microbiota transplantation, ulcerative colitis, 5-aminosalicylic acid, microbial diversity, Th1/Th2, Th17/Treg
Impact statement
At present, no cure for ulcerative colitis (UC) is known. The side effects of conventional drugs are strong, and the disease has an easy relapse. Many studies have shown that its pathogenesis is associated with the involvement of immune cells and inflammatory cytokines. Dysbiosis can stimulate various types of autoimmune and inflammatory diseases through Th1, Th2, Th17, and Treg cell imbalance. Abnormal release of inflammatory cells and mediators may occur as a result of immune-regulation imbalance, ultimately leading to intestinal mucosal tissue damage. Fecal microbiota transplantation (FMT) involves transferring functional intestinal microbiota in the feces of healthy individual into the gastrointestinal tract of patients to reconstruct the intestinal microbiota with normal functions. The findings of this study suggested that FMT benefied UC by improving the balance of Th1/Th2 and Th17/Treg through intestinal microbiota regulation.
Introduction
Ulcerative colitis (UC) is a chronic nonspecific inflammation disorder belonging to the category of inflammatory bowel disease (IBD). It primarily affects the rectum, and the colonic mucosa and submucosa. Its main clinical manifestations include abdominal pain, diarrhea, mucoid, purulent, and bloody stools. 1 The disease starts in the rectum and typically extends proximally over a variable length of the colon, whereas some may have inflammatory cecal patch. 2 It is characterized by an alternation of attack, remission, and relapse, and occurs mostly in young people aged 20–40. It is a common, frequently occurring, and difficult disease of the digestive system. 3 , 4
The incidence of UC is increasing yearly worldwide, yet its etiology and pathogenesis remain unclear. Modern medicine believes that a combined effect of genetic, environmental, psychological, and other factors can lead to intestinal mucosal barrier damage, neuroendocrine dysfunction, and immune imbalance, resulting in local ulcers in the intestinal mucosa. 5
At present, UC has no known cure. In principle, the drug treatment of this disease involves controlling an acute attack, repairing mucosa, maintaining remission, reducing recurrence, and preventing complications. Drug treatment includes aminosalicylic acid (ASA) preparations and glucocorticoids. 6 , 7 The side effects of conventional drugs are strong, and the disease has an easy relapse. Fecal microbiota transplantation (FMT) involves the transfer of functional intestinal microbiota in the feces of healthy individuals into the gastrointestinal tract of patients in certain ways to reconstruct intestinal microbiota with normal functions, and it treats certain intestinal and extraintestinal diseases. This method has a long history and is included in the US Food and Drug Administration’s guidelines for treating Clostridium difficile infection in 2013. Its safety and effectiveness have been further confirmed, and the indications have been expanded. 8 , 9
Many studies have shown that the pathogenesis of UC is associated with the involvement of immune cells and inflammatory cytokines. Disrupted intestinal microbiota may cause harmful bacteria in the intestine to increase rapidly and cause inflammatory intestinal responses. 10 The imbalance of immune-regulation results in the abnormal release of inflammatory cells and mediators, eventually leading to intestinal mucosal tissue damage. 11
This study was carried out to access the efficacy of FMT in mice with experimentally induced UC and to explore its possible mechanism of action. The therapeutic effect was evaluated by analyzing the balance of Th1/Th17 and Th17/Treg, as well as related inflammatory factors. The possible mechanism of action was explored using 16S rRNA gene-sequencing. 5-ASA was used as the experimental (positive) control. We hypothesized that FMT could achieve its therapeutic effect in mice with experimentally induced UC by improving the balance of Th1/Th2 and Th17/Treg through intestinal microbiota regulation.
Materials and methods
Ethics approval
All procedures involving animals were approved by the Animal Use and Care Committee of Jiangxi University of Traditional Chinese Medicine. They were conducted in compliance with the principles and procedures outlined in the Guide for the Care and Use of Laboratory Animals of the National Institutes of Health (revised 2011).
Experimental animals
Male C57BL/6 mice (four weeks old) weighing 16.5 ± 2.5 g were provided by Hunan SJA Laboratory Animal Co., Ltd, Hunan, P.R. China [license number: SCXK (Xiang) 2019–0004]. The mice were kept in standard cages and allowed access to food and water ad libitum. The room was well ventilated and maintained under natural light–dark conditions.
Main reagents and instruments
Supplementary Tables 1 and 2 show the main reagents and instruments used in this study.
Experiment grouping and modeling
Mice were randomly assigned to four groups (n = 5 per group; 8 mice in the normal control group, 3 of which were used for model verification; 18 in the UC mouse model, 3 were used for model verification; and 5 in each groups of (2), (3), and (4), which were used for experiments).
Normal control group (control)
The mice had free access to normal drinking water, fed normal food, raised at normal temperature (temperature and humidity settings were the same as those of the normal model), and had no other specific treatment.
For groups (2), (3), and (4), after the model was successfully established, the mice had free access to normal drinking water, fed normal food, and raised under normal temperature. They were also given intervention according to the specific group as follows:
UC model group (UC)
Mice received an enema of 0.2 mL of phosphate buffer saline (PBS), once every 2 days for 10 consecutive days and a total of 5 times.
UC model + FMT group (UC + FMT)
Mice received an enema of 0.2 mL of fecal bacteria solution, once every 2 days for 10 consecutive days and a total of 5 times; and
UC model + 5-ASA group (UC + 5-ASA)
Mice received an enema of 0.0195 g/kg (drug concentration of 0.0195 g/mL, 0.2 mL enema per 20 g mice), once every 2 days for 10 consecutive days and a total of 5 times.
Establishment of UC mouse model
Mice were subjected to seven days of adaptive feeding and then raised under an individually ventilated cage system (setting parameters: temperature, 20°C; humidity, 45%; 12 h per day). They were fed normal food and allowed free access to distilled water containing 2% dextran sulfate sodium (DSS) for 10 consecutive days. After modeling, three mice from the UC model were selected for observation, and the samples were taken for model verification.
Fecal microbiota preparation
About 5 g of fresh morning stool samples from the normal control mice were dissolved in 10 mL of sterile PBS, thoroughly mixed, filtered through 2.0, 1.0, 0.5, and 0.25 mm stainless-steel sieves, and centrifuged for 15 min at 6000 × g. Bacteria were collected, washed with sterile PBS (3×), resuspended in 25 mL of PBS, and stored at 4°C.
Fecal occult-blood screening
Each mouse model was screened for fecal occult-blood. Those with positive results were selected for verification by hematoxylin–eosin (HE) staining, whereas those with negative results were excluded, to ensure that the model established was indeed successful for subsequent experiments.
Animal sampling
Upon completion of the intervention, mice in each group were anesthetized with an intraperitoneal injection of 45 mg/kg sodium pentobarbital. After opening the abdominal and thoracic cavities, 0.02 mL of ethylenediamine tetraacetic acid saturated solution was drawn with a 1-mL syringe to moisten the tube. Blood was obtained from the mouse heart for flow-cytometry analysis and routine blood test. The colon and cecum were collected, and the blood stains on the surface were washed. The intestinal contents were extruded with sterile cotton swabs for 16S rRNA gene-sequencing analysis. The cecum was removed, and the remaining colon and rectum were divided into three parts for HE, transmission electron microscope (TEM), and enzyme-linked immunosorbent assay (ELISA) detection.
HE staining
After rinsing with running water for several hours, tissues were dehydrated in 70%, 80%, and 90% ethanol solution. Then, they were placed in pure alcohol–xylene (1:1), xylene I, and xylene II until clear, followed by xylene–paraffin (1:1) (15 min each), and paraffin I and paraffin II (50–60 min each). The embedded tissues were sectioned, baked, dewaxed, and hydrated. After performing hematoxylin staining for 3 min, hydrochloric acid ethanol differentiation was conducted for 15 s. The sections were slightly washed and placed in blueing solution for 15 s. They were rinsed with running water, and eosin staining was performed for 3 min. The sections were rinsed, dehydrated, cleared, mounted, and examined under a microscope. A comparison was made between the UC and control groups for model verification, followed by a comparison between groups (UC, control, and the treatment groups UC+FMT and UC + 5-ASA).
TEM observation
Tissues were fixed for more than 2 h in 2.5% glutaraldehyde, rinsed with 0.1 M phosphoric acid, fixed for 2 h with 1% osmic acid, and rinsed with 0.1 M phosphoric acid. The tissues were subjected to gradient ethanol (50%–90%) followed by acetone dehydration, paraffin embedding, and solidification. Then, the specimens were sliced into 70 nm-thick sections, double stained with 3% uranium acetate–lead citrate, and observed under TEM.
Flow-cytometry detection
Detection of T helper (Th)17 cells
About 100 μL of blood from each group was taken and placed in a 12-well plate. After adding 150 μL of 1640 complete medium followed by 1 μL of phorbol myristate acetate/ionomycin mixture, the mixture was incubated for 30 min. Then, 1 μL of Brefeldin A/monensin mixture was added, and incubation was performed for 24 h. The blood was transferred into an Eppendorf tube, the mixture was centrifuged, and 150 μL of supernatant was discarded. The cells were blown evenly, after which 5 μL of CD4 APC-Cy7 was added, and the mixture was incubated for 15 min in the dark. After adding 1 mL of PBS, centrifugation for 5 min at 400 × g and washing (2×) were performed. The supernatant was discarded, 500 μL of fixation and permeabilization solution were added, and the mixture was incubated for 40 min in the dark. The specimen was centrifuged for 5 min at 400 × g, 1 mL of 1× BD permeabilization (Perm)/Wash™ buffer was added, and washed (2×). After resuspending the cells in 100 μL of 1× BD Perm/Wash™ buffer, 5 μL of interleukin (IL)-17A PE was added, and the mixture was incubated for 15 min in the dark. Then, 1 mL of 1× BD Perm/Wash™ buffer was added, and washing (2×) was performed. The cells were resuspended in 500 μL of 1× BD Perm/Wash™ buffer, and flow-cytometry detection was performed.
Detection of Th1, Th2, and regulatory T (treg) cells
The procedures were the same as above. After incubation with CD4 APC-Cy7 and cell resuspension, interferon-gamma (IFN)-γ PE and IL-4 PE were added for Th1 and Th2 cell detection, respectively, and reincubation was performed. For Treg cell detection, the cells were incubated with 5 μL of CD4 APC-Cy7/CD25 PE, followed by 5 μL of FOXP3 Alexa Fluor® 488 after cell resuspension.
ELISA detection
The kit components and reagents were restored to room temperature (RT). To set up the standard wells, 50 μL of standards at various concentrations were added to each well of the microplate. Then, the blank and sample wells were set up. Each sample well was added 40 μL of sample diluent, followed by 10 μL of sample and 100 μL of enzyme-labeled reagent. The microplate was covered with sealing film and incubated for 60 min at 37°C. The sealing film was then removed, and the liquid was discarded. The wells were washed and the microplate was patted dry. Developer A followed by developer B (50 μL each) were added into each well, which was then gently shaken and mixed. Color development was achieved after 15 min at 37°C in the dark. Subsequently, each well was added 50 μL of stop solution. The OD values were determined at 450 nm.
Routine blood test
After the blood of each group was fully anticoagulated, a veterinary hematology analyzer was used to complete the routine blood test within 4 h under RT. This step was performed to detect the number of white blood cells (WBCs), red blood cells (RBCs), platelets (PLTs), and hemoglobin (HGB) content.
Diversity analysis of intestinal microbiota
The intestinal contents were filtered, and the extracted total DNA was quantified with a spectrophotometer. In general, target sequences such as microbial ribosomal RNA that can represent the composition and diversity of the microbiota are usually used as targets. The corresponding primers are designed based on the conserved regions in the sequence to perform polymerase chain reaction (PCR) amplification. The PCR-amplification products were determined by 2% agarose-gel electrophoresis. The target fragments were cut and recovered. The recovered products were quantified using fluorescence. High-throughput sequencing was conducted, and analysis was performed using Quantitative Insights Into Microbial Ecology software. UCLUST sequence-alignment algorithm was used. Based on 97% sequence similarity, the sequences acquired from high-throughput sequencing were merged and divided into operational taxonomic units (OTUs). The most abundant sequence in each OTU was selected as the representative sequence of the OTU. Classification and identification of results were performed by comparing the ribosomal database project.
Statistical analysis
Data analysis was performed using SPSS 19 (SPSS Inc., Chicago, IL, USA). Measurement data were expressed as the mean ± standard deviation ( ± s). Comparisons between groups were conducted by one-way ANOVA with P < 0.05 as statistically significant.
Results
HE staining
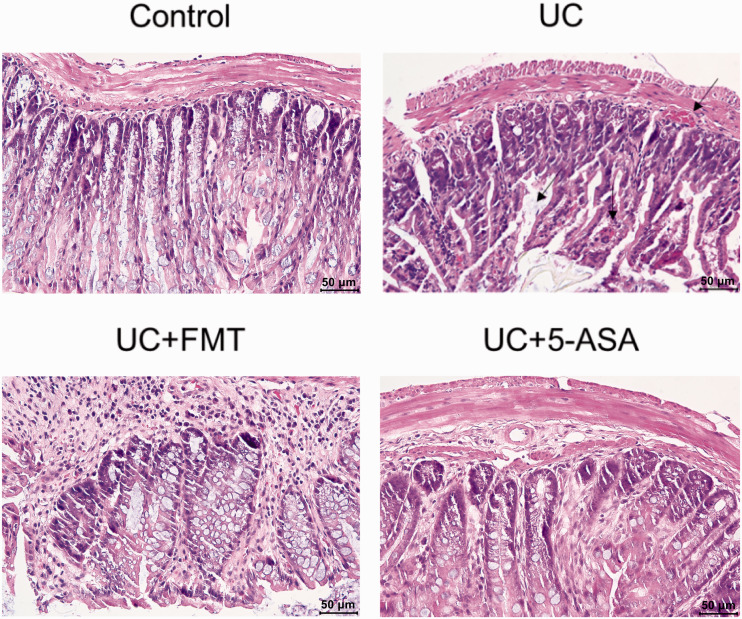
The colonic mucosa in the control group was intact, and the glands were arranged neatly. No inflammatory-cell infiltration was observed. The layers were tight, and the structure was clear. In the UC group (as indicated by the arrows), varying degrees of defects or exfoliation and necrosis on the intestinal mucosal surface were observed, part of which formed ulcers. Disappeared crypts and numerous inflammatory-cell infiltrations into the lamina propria were noted. Thickening and edema of the muscularis mucosa and submucosal vasodilation were found. More erythrocytes and eosinophils infiltration were observed. After treatment with FMT or 5-ASA, significant improvement was noted. The intestinal mucosa was basically intact; very few of them remained incomplete and broken. Additionally, the glands proliferated and were neatly arranged. The goblet cells increased. The bleeding points disappeared, and a small amount of inflammatory-cell infiltration was found (Figure 1).
Figure 1.
HE staining of the intestinal tissue of mice in each group. For the model group, the mice that tested positive for fecal occult-blood screening were selected for verification by HE staining. A comparison between the UC and control groups was made for model verification, followed by a comparison between groups (UC, control, and the treatment groups UC+FMT and UC + 5-ASA). Note: scale 50 μm. Control: normal control, UC: ulcerative colitis model, UC+FMT: ulcerative colitis model + fecal microbiota transplantation, UC + 5-ASA: ulcerative colitis model + 5-aminosalicylic acid. (A color version of this figure is available in the online journal.)
HE: hematoxylin-eosin.
TEM analysis
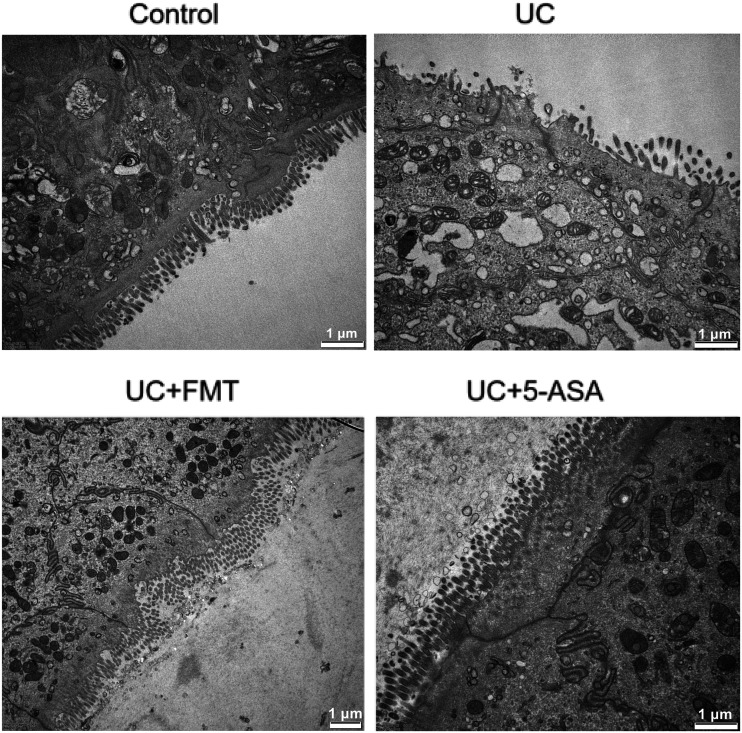
In the control group, the microvilli had regular morphology and neat arrangement. Relatively, more goblet cells, abundant mitochondria, clear cristae structure, and no changes in the rough endoplasmic reticulum were observed. In the UC group, the epithelial-cell surface had sparse microvilli, with variable lengths and irregular shapes. The gap between cells widened, the goblet cells decreased, and vacuoles were found in the cytoplasm. Swollen mitochondria, partial cristae disappearance, and some endoplasmic reticulum expansion or vacuole changes were noted. After FMT or 5-ASA treatment, a significant improvement was found. The microvilli were denser, the morphology was normal, the number of goblet cells increased, the mitochondria were slightly swollen, and the rough endoplasmic reticulum lesions were not obvious (Figure 2).
Figure 2.
Ultrastructure of the intestinal tissue of mice in each group by TEM. Tissues were fixed for more than 2 h in 2.5% glutaraldehyde, and for 2 h with 1% osmic acid, followed by gradient ethanol (50–90%) and acetone dehydration, paraffin embedding and solidification. Then, the specimens were sliced into 70 nm-thick sections, and double stained with 3% uranium acetate–lead citrate. Note: scale 1 μm. Control: normal control, UC: ulcerative colitis model, UC+FMT: ulcerative colitis model + fecal microbiota transplantation, UC + 5-ASA: ulcerative colitis model + 5-aminosalicylic acid. TEM: transmission electron microscope.
Flow-cytometry detection
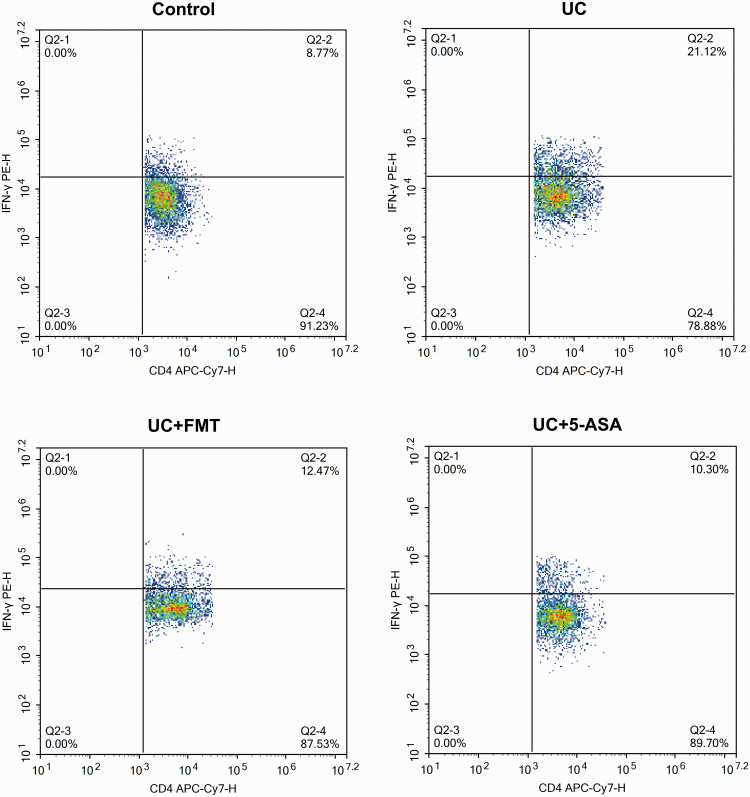
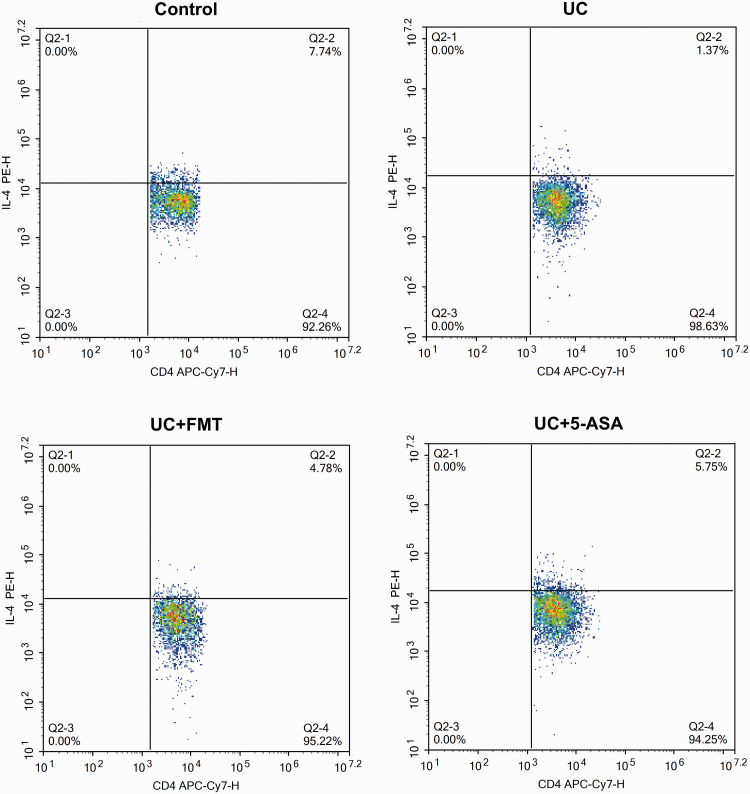
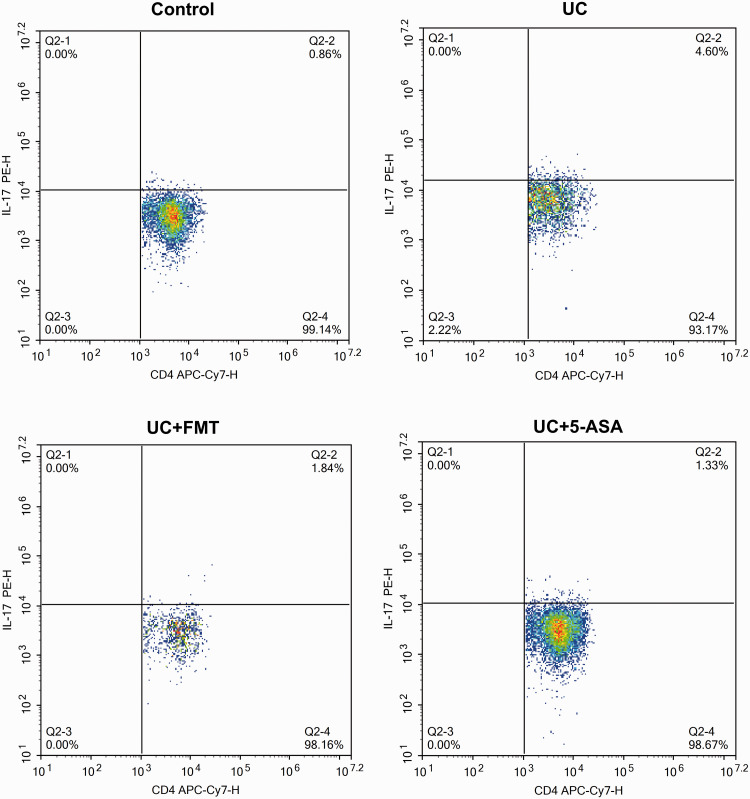
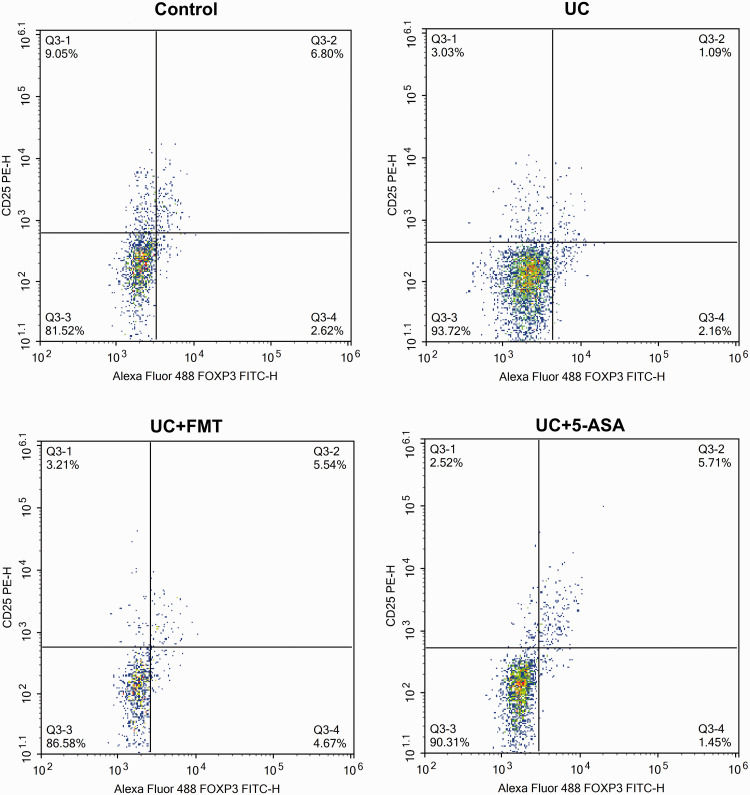
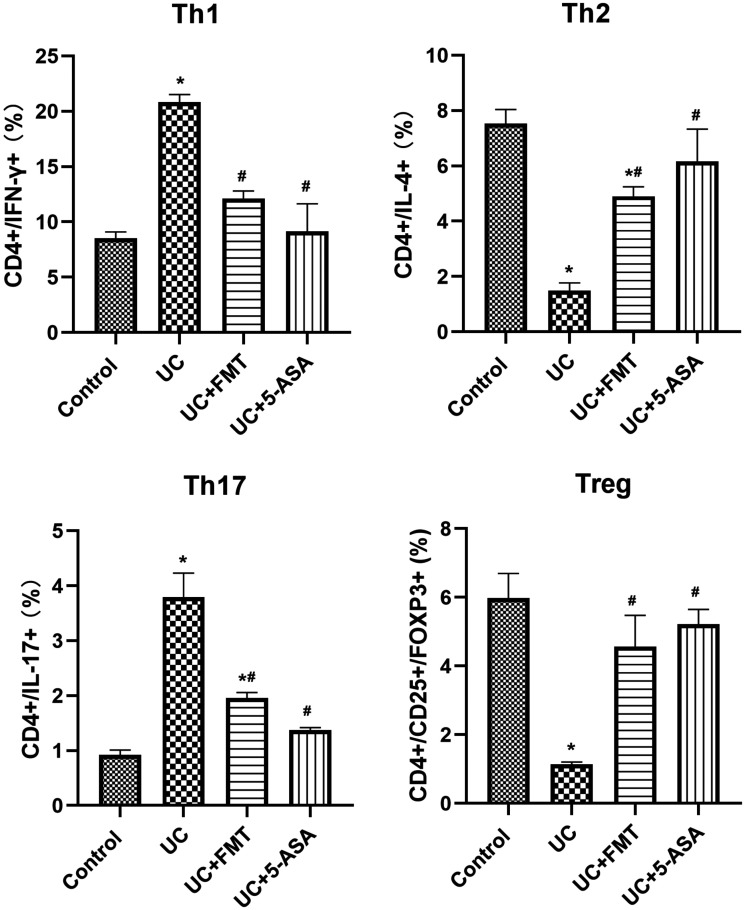
After UC modeling, the CD4+/IFN-γ+ positive Th1 cells and CD4+/IL-17+ positive Th17 cells increased significantly, whereas the CD4+/IL-4+ positive Th2 cells and CD4+/CD25+/FOXP3+ positive Treg cells decreased significantly (all P < 0.05). After treatment with FMT or 5-ASA, the Th1 cells and Th17 cells decreased significantly, whereas the Th2 cells and Treg cells increased significantly (P < 0.05, all). The levels were close to normal (Figures 3 to 7).
Figure 3.
Scatter plots of flow-cytometry detection of Th1 cells in intestinal tissue of mice in each group. The cells were incubated with 5 μL of CD4 APC-Cy7, followed by 5 μL of IFN-γ PE for Th1 cell detection. Note: Control: normal control, UC: ulcerative colitis model, UC+FMT: ulcerative colitis model + fecal microbiota transplantation, UC + 5-ASA: ulcerative colitis model + 5-aminosalicylic acid. (A color version of this figure is available in the online journal.)
IFN-γ: interferon gamma; PE: phycoerythrin; CD: cluster of differentiation; APC-Cy7: allophycocyanin-cyanine 7; Th: T helper.
Figure 4.
Scatter plots of flow-cytometry detection of Th2 cells in intestinal tissue of mice in each group. The cells were incubated with 5 μL of CD4 APC-Cy7, followed by 5 μL of IL-4 PE for Th2 cell detection. Note: Control: normal control, UC: ulcerative colitis model, UC+FMT: ulcerative colitis model + fecal microbiota transplantation, UC + 5-ASA: ulcerative colitis model + 5-aminosalicylic acid. (A color version of this figure is available in the online journal.)
IL: interleukin; PE: phycoerythrin; CD: cluster of differentiation; APC-Cy7: allophycocyanin-cyanine 7; Th: T helper.
Figure 5.
Scatter plots of flow-cytometry detection of Th17 cells in intestinal tissue of mice in each group. The cells were incubated with 5 μL of CD4 APC-Cy7, followed by 5 μL of IL-17 PE for Th17 cell detection. Note: Control: normal control, UC: ulcerative colitis model, UC+FMT: ulcerative colitis model + fecal microbiota transplantation, UC + 5-ASA: ulcerative colitis model + 5-aminosalicylic acid. (A color version of this figure is available in the online journal.)
IL: interleukin; PE: phycoerythrin; CD: cluster of differentiation; APC-Cy7: allophycocyanin-cyanine 7; Th: T helper.
Figure 6.
Scatter plots of flow-cytometry detection of Treg cells in intestinal tissue of mice in each group. The cells were incubated with 5 μL of CD4 APC-Cy7/CD25 PE followed by 5 μL of FOXP3 Alexa Fluor® 488 for Treg cell detection. Note: Control: normal control, UC: ulcerative colitis model, UC+FMT: ulcerative colitis model + fecal microbiota transplantation, UC + 5-ASA: ulcerative colitis model + 5-aminosalicylic acid. (A color version of this figure is available in the online journal.)
CD: cluster of differentiation; PE: phycoerythrin; FOXP3: forkhead box P3; FITC: fluorescein isothiocyanate; Treg: regulatory T.
Figure 7.
Histogram of flow-cytometry detection of Th1, Th2, Th17, and Treg cells in intestinal tissue of mice in each group. The cells were incubated with 5 μL of CD4 APC-Cy7, followed by 5 μL of IFN-γ PE, IL-4 PE, and IL-17 PE for Th1, Th2, and Th17 cell detection, respectively. For Treg cell detection, the cells were incubated with 5 μL of CD4 APC-Cy7/CD25 PE followed by 5 μL of FOXP3 Alexa Fluor® 488. Note: All data were presented as mean ± standard deviation. Compared with control group, *P < 0.05; compared with UC group, #P < 0.05. Control: normal control, UC: ulcerative colitis model, UC+FMT: ulcerative colitis model + fecal microbiota transplantation, UC + 5-ASA: ulcerative colitis model + 5-aminosalicylic acid. CD: cluster of differentiation; IFN-γ: interferon gamma; IL: interleukin; FOXP3: forkhead box P3; Th: T helper; Treg: regulatory T.
ELISA detection
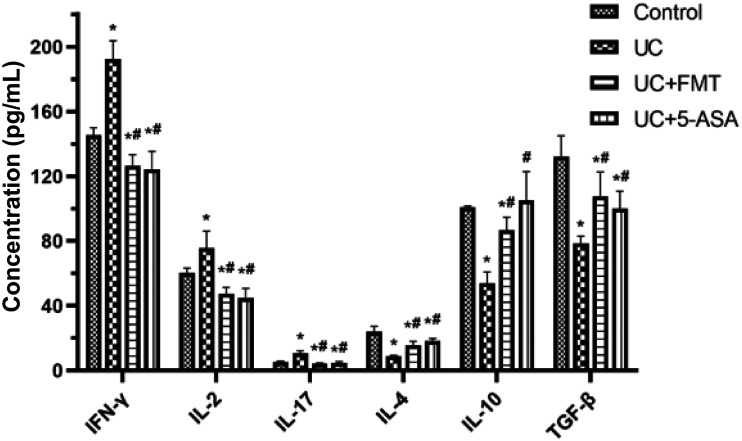
The serum levels of IFN-γ, IL-2, and IL-17 in the UC group increased significantly, whereas the serum levels of IL-4, IL-10, and transforming growth factor-beta (TGF-β) decreased significantly compared with those of the control group (all P < 0.05). The serum levels of IFN-γ, IL-2, and IL-17 in the UC + FMT and UC + 5-ASA groups decreased significantly, whereas the serum levels of IL-4, IL-10, and TGF-β increased significantly compared with the UC group (P < 0.05, all). The levels were close to normal (Figure 8).
Figure 8.
Histogram of ELISA detection of serum levels of IFN-γ, IL-2, IL-17, IL-4, IL-10, and TGF-β in mice of each group. The standard wells were set up by adding 50 μL of standards at various concentrations to each well. Then, the blank and sample wells were set up. Each sample well was added 40 μL of sample diluent, followed by 10 μL of sample, and 100 μL of enzyme-labeled reagent. The microplate was covered with sealing film, and incubated for 60 min at 37°C. Color development was achieved after 15 min at 37°C in the dark. The OD values were determined at 450 nm. Note: All data were presented as mean ± standard deviation. Compared with control group, *P < 0.05; compared with UC group, #P < 0.05. Control: normal control, UC: ulcerative colitis model, UC+FMT: ulcerative colitis model + fecal microbiota transplantation, UC + 5-ASA: ulcerative colitis model + 5-aminosalicylic acid. ELISA: enzyme-linked immunosorbent assay; IFN-γ: interferon gamma; IL: interleukin; TGF-β: transforming growth factor beta.
Routine blood test
The number of WBCs and PLTs in the UC group increased significantly, whereas the number of RBCs and the HGB content decreased significantly compared with those of the control group (P < 0.05, all). After treatment with FMT or 5-ASA, the routine blood data improved and approached the values of the control group (Table 1).
Table 1.
Routine blood analysis of mice in each group.
| Group | Number of mice | WBC (× 109/L) | RBC (× 1012/L) | PLT (× 109/L) | HGB (g/L) |
|---|---|---|---|---|---|
| Control | 5 | 3.54 ± 0.74 | 5.38 ± 0.20 | 264.2 ± 37.16 | 109.92 ± 4.35 |
| UC | 5 | 9.64 ± 1.32* | 3.57 ± 0.18* | 333 ± 29.34* | 90.5 ± 5.65* |
| UC + FMT | 5 | 6.16 ± 0.86*# | 5.05 ± 0.30# | 322 ± 25.4* | 108 ± 7.84# |
| UC + 5-ASA | 5 | 4.35 ± 0.44# | 4.98 ± 0.27# | 310 ± 30.7* | 103.8 ± 6.26# |
Note: Blood was obtained from the mouse heart. After it was fully anticoagulated, a veterinary hematology analyzer was used to complete the routine blood test within 4 h under RT. All data were presented as mean ± standard deviation. Compared with control group, *P < 0.05; compared with UC group, #P < 0.05. Control: normal control, UC: ulcerative colitis model, UC+FMT: UC model + fecal microbiota transplantation, UC + 5-ASA: UC model + 5-aminosalicylic acid.
WBC: white blood cell; RBC: red blood cell; PLT: platelet; HGB: hemoglobin; RT: room temperature.
Diversity analysis of intestinal microbiota
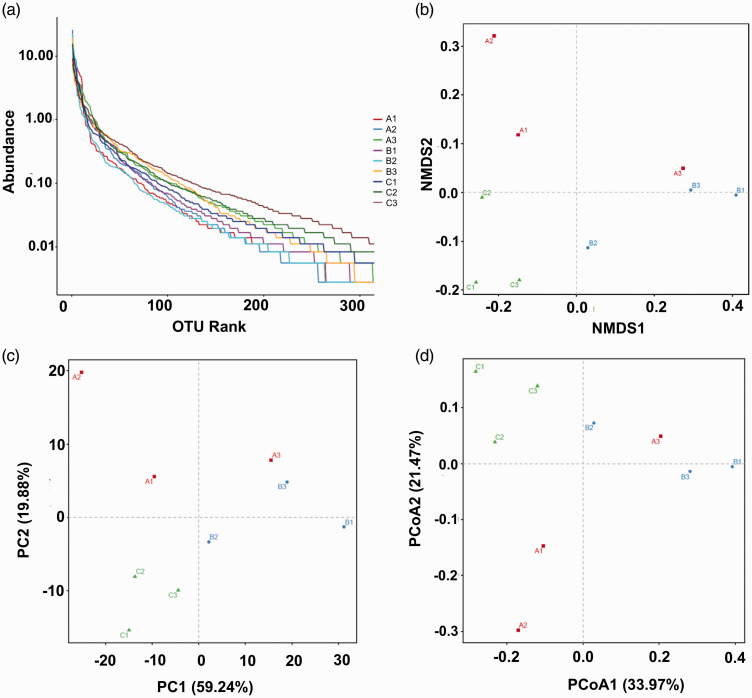
Results of the 16S rRNA gene-sequencing analysis of the intestinal contents of mice in each group are shown in Figure 9. The abundance of the species was represented by the length of the curve on the horizontal axis in Figure 9(a) (rank abundance curve). A broader curve corresponded with a richer species composition, whose uniformity was reflected by the shape of the curve. A flatter curve indicated greater uniformity. Results of non-metric multidimensional scaling analysis, beta diversity principal component analysis, and principal coordinate analysis are presented in Figure 9(b) to (d), respectively. Higher closeness of the samples to one another corresponded with higher microbial community similarity. Intestinal microbiota was restored to the pattern close to that of the control group following treatment with FMT or 5-ASA, suggesting an improvement in intestinal microbiota.
Figure 9.
Diversity analysis of intestinal microbiota in mice. The intestinal contents were filtered, and the extracted total DNA was quantified with a spectrophotometer. The PCR-amplification products were determined by 2% agarose-gel electrophoresis. The target fragments were cut and recovered. The recovered products were quantified using fluorescence. High-throughput sequencing was conducted. Analysis was performed using QIIME software. UCLUST sequence-alignment algorithm was used. Based on 97% sequence similarity, the sequences acquired from high-throughput sequencing were merged and divided into OTUs. The most abundant sequence in each OTU was selected as the representative sequence of the OTU. Classification and identification of results were performed by comparing the RDP. (a) Rank abundance curve, (b) NMDS analysis based on UniFrac distance, (c) PCA beta diversity, (d) PCoA. Note: A. control, B. UC, C. UC+FMT. Control: normal control, UC: ulcerative colitis model, UC+FMT: ulcerative colitis model + fecal microbiota transplantation. (A color version of this figure is available in the online journal.)
PCR: polymerase chain reaction; NMDS: non-metric multidimensional scaling; PCA: principal component analysis; PCoA: principal coordinate analysis; QIIME: Quantitative Insights Into Microbial Ecology; OTU: operational taxonomic unit; RDP: ribosomal database project.
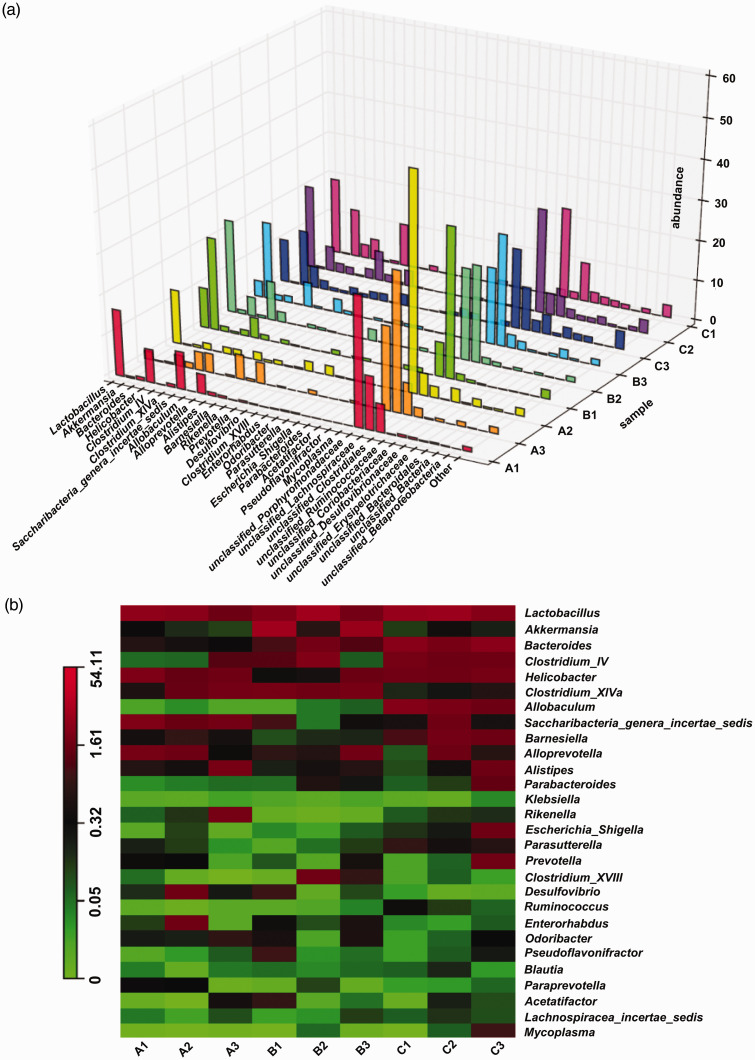
Compared with the control group, the genera that significantly increased in abundance in the UC group were Akkermansia and unclassified Lachnospiraceae, whereas the genera that significantly decreased in abundance were Helicobacter, Saccharibacteria_genera_incertae_sedis, and unclassified Porphyromonadaceae. After treatment with FMT, intestinal microbiota was restored to the pattern close to that of the control group, suggesting an improvement in intestinal microbiota (Figure 10).
Figure 10.
Comparative analysis of intestinal microbiota of mice at the genus level. The relative abundances were determined by dividing each OTU read count by the total read count of the corresponding sample. (a) 3D histogram of relative abundance at the genus level, (b) heatmap of the community composition and abundance at the genus level. Note: A: control, B: UC, C: UC+FMT. Control: normal control, UC: ulcerative colitis model, UC+FMT: ulcerative colitis model + fecal microbiota transplantation. (A color version of this figure is available in the online journal.)
OTU: operational taxonomic unit; 3D: three-dimensional.
Discussion
At present, the mechanism of FMT in UC treatment is associated with improving the structure of the intestinal microbiota, acidifying the intestinal tract to suppress the growth of pathogenic bacteria, increasing the level of intestinal anti-inflammatory metabolites such as short-chain fatty acids, increasing the abundance of beneficial bacteria, improving the balance of Th1/Th2 and Th17/Treg, regulating the balance of pro-inflammatory and anti-inflammatory factors, and stimulating the body's immune system to develop immune tolerance to intestinal microbiota. 12 , 13
Th17 and Treg cells are two key lymphocyte subsets with opposing roles. 14 A number of studies have shown that intestinal microbiota was closely related to the balance between Th17 and Treg. 15 A previous research has demonstrated that the immune imbalance of Th17/Treg could play a critical role in UC development. Inducing Treg cell and TGF-β1 production and inhibiting the levels of Th17 and IL-17 could restore the immune balance of Th17/Treg, which may suggest new therapeutic targets for UC. 16 The results of this study revealed that FMT significantly affected the UC mouse model, and the effect was not inferior to that of 5-ASA. At the same time, the results of 16S rRNA gene-sequencing analysis suggested that FMT could restore the profile of intestinal microbiota to that of the control group.
T lymphocytes play a key role in the body's immune response and immune regulation. Th cells are effector cells derived from the activation of native CD4+ T cells. They exert immune effects through the release of cytokines, assist in B cell activation to produce antibodies, and direct contact with cells. 17 After being regulated by different antigens and cytokines in the local microenvironment, Th cells can be differentiated into two subtypes, namely, Th1 and Th2. Th1 cells predominantly secrete IL-2 and IFN-γ, and involve in the cellular immune response, inflammation and acute rejection, whereas Th2 cells primarily secrete IL-4 and IL-5 and contribute to the humoral immune response. 18 , 19 According to this study, Th1 cells dominate the UC model. After treatment with FMT, Th2 cells become dominant, and the Th1/Th2 balance tends toward the control group. Th17 cells belong to a newly discovered unique Th subgroup. They are activated with the participation of various cytokines such as TGF-β, IL-6, and IL-23 and are involved in the inflammatory response, immune response to bacterial infection, and autoimmune diseases through the secretion of IL-17, IL-22, and other cytokines. 20 Studies have shown that the expression of Th17 cells and its related factors, IL-17 and IL-21, increases in the active stage of UC and increases gradually with increased disease activity. 21 Treg is a type of CD4+ CD25+ FOXP3+ T cell subgroup with negative regulation. FOXP3 is an important transcription factor of Treg, which is a marker of Treg and is involved in its differentiation and functional regulation. 22 Studies have shown that Treg plays an immunosuppressive role by releasing cytokines such as TGF-β and IL-10 and is closely associated with IBD pathogenesis. A study using flow-cytometry analysis has shown that the number of Treg cells in mouse colon with DSS-induced colitis significantly increases after treatment, indicating the participation of Treg cells in the pathogenesis of UC. 23
Normal mammals are “superorganisms,” which are symbiotic bodies composed of hosts and microorganisms. The mammalian digestive tract is inhabited by trillions of symbiotic microorganisms, known as intestinal microbiota. 24 , 25 Nearly 1.5 kg of microorganisms exist in the intestinal tract of an adult, and they affect all aspects of health of the host through co-development with it. 26 In addition to internal factors such as genotype, age, and physiological state of the host, the structure of the intestinal microbiota depends on the environmental factors such as diet and living conditions. 27 The functions of intestinal microbiota include formation of the host immune system, food digestion and nutrient absorption, and regulation of drug and bile-acid metabolism. 28 Intestinal microbiota is related to many pathological processes, such as colorectal cancer, 29 IBD, 30 metabolic disease, 31 atherosclerosis, 32 and neurological diseases. 33
Intestinal flora disorder is closely associated with the occurrence of various diseases, such as asthma, obesity, diabetes, and specifically gastrointestinal diseases. 34 The healthy intestinal microbiota is dominated by Firmicutes and Bacteroidetes, and to a lesser extent by Proteobacteria, Actinobacteria and Verrucomicrobia. An imbalance of these phyla can lead to dysbiosis. 35 In the present study, results of microbiota diversity analysis at the genus level significantly differed in Helicobacter and Akkermansia in the UC group compared with those of the control, which may be related to the occurrence and treatment of the disease. Host immunity could be the dominant forces shaping the intestinal microbiota assembly. 36
Among the various immune cells, microbiota has been shown to be related to Th1, Th2, Th17, and Treg cell development.37–39 Dysbiosis can stimulate various types of autoimmune and inflammatory diseases through an imbalance of the T-cell subpopulations, such as Th1, Th2, Th17, and Treg cells. 40 Dysbiosis can lead to increased intestinal permeability and trigger inflammation. 41 Intestinal microbiota modulation by FMT and normobiosis restoration activates the immune pathways, inducing immune cells to be involved in the resolution of inflammatory processes. 42
In conclusion, FMT had the capability to control experimentally induced UC with obvious effects via intestinal microbiota regulation, thereby improving the balance of Th1/Th2 and Th17/Treg. This study provided a theoretical basis for the treatment of UC by FMT, although further research is needed to validate the findings.
Supplemental Material
Supplemental material, sj-pdf-1-ebm-10.1177_15353702211006044 for Treatment and mechanism of fecal microbiota transplantation in mice with experimentally induced ulcerative colitis by Leichang Zhang, Xiaofei Ma, Peng Liu, Wei Ge, Lixia Hu, Zhengyun Zuo, Huirong Xiao and Wu Liao in Experimental Biology and Medicine
Footnotes
AUTHORS’ CONTRIBUTIONS: LZ and WL conceived and designed the study. LZ, XM, PL, WG, LH, ZZ, and HX performed the experiments. LZ, XM, PL, and WL analyzed the results. LZ and XM wrote the manuscript.
DECLARATION OF CONFLICTING INTERESTS: The author(s) declared no potential conflicts of interest with respect to the research, authorship, and/or publication of this article.
FUNDING: The authors disclosed receipt of the following financial support for the research, authorship, and/or publication of this article: This work was supported by the National Youth Foundation of China (Grant No. 81804101).
ORCID iD: Wu Liao https://orcid.org/0000-0002-0749-6454
SUPPLEMENTAL MATERIAL: Supplemental material for this article is available online.
References
- 1.Khoruts A, Weingarden AR. Emergence of fecal microbiota transplantation as an approach to repair disrupted microbial gut ecology. Immunol Lett 2014; 162:77–81 [DOI] [PMC free article] [PubMed] [Google Scholar]
- 2.Ordás I, Eckmann L, Talamini M, Baumgart DC, Sandborn WJ. Ulcerative colitis. Lancet 2012; 380:1606–19 [DOI] [PubMed] [Google Scholar]
- 3.Wickbom A, Bohr J, Nyhlin N, Eriksson A, Lapidus A, Münch A, Ung KA, Vigren L, Öst Å, Tysk C, Swedish Organisation for the Study of Inflammatory Bowel Disease (SOIBD). Microscopic colitis in patients with ulcerative colitis or Crohn's disease: a retrospective observational study and review of the literature. Scand J Gastroenterol 2018; 53:410–6 [DOI] [PubMed] [Google Scholar]
- 4.Permpoon V, Pongpirul K, Anuras S. Ethnic variations in ulcerative colitis: experience of an international hospital in Thailand. World J Gastrointest Pharmacol Ther 2016; 7:428–33 [DOI] [PMC free article] [PubMed] [Google Scholar]
- 5.Sung MK, Park MY. Nutritional modulators of ulcerative colitis: clinical efficacies and mechanistic view. World J Gastroenterol 2013; 19:994–1004 [DOI] [PMC free article] [PubMed] [Google Scholar]
- 6.da Silva BC, Lyra AC, Rocha R, Santana GO. Epidemiology, demographic characteristics and prognostic predictors of ulcerative colitis. World J Gastroenterol 2014; 20:9458–67 [DOI] [PMC free article] [PubMed] [Google Scholar]
- 7.Ford AC, Bernstein CN, Khan KJ, Abreu MT, Marshall JK, Talley NJ, Moayyedi P. Glucocorticosteroid therapy in inflammatory bowel disease: systematic review and meta-analysis. Am J Gastroenterol 2011; 106:590–9 [DOI] [PubMed] [Google Scholar]
- 8.Surawicz CM, Brandt LJ, Binion DG, Ananthakrishnan AN, Curry SR Gilligan PH, McFarland LV, Mellow M, Zuckerbraun BS. Guidelines for diagnosis, treatment, and prevention of Clostridium difficile infections. Am J Gastroenterol 2013; 108:478–98 [DOI] [PubMed] [Google Scholar]
- 9.Cammarota G, Pecere S, Ianiro G, Masucci L, Currò D. Principles of DNA-based gut microbiota assessment and therapeutic efficacy of fecal microbiota transplantation in gastrointestinal diseases. Dig Dis 2016; 34:279–85 [DOI] [PubMed] [Google Scholar]
- 10.Shen ZH, Zhu CX, Quan YS, Yang ZY, Wu S, Luo WW, Tan B, Wang XY. Relationship between intestinal microbiota and ulcerative colitis: mechanisms and clinical application of probiotics and fecal microbiota transplantation. World J Gastroenterol 2018; 24:5–14 [DOI] [PMC free article] [PubMed] [Google Scholar]
- 11.Kaur A, Goggolidou P. Ulcerative colitis: understanding its cellular pathology could provide insights into novel therapies. J Inflamm 2020; 17:15. [DOI] [PMC free article] [PubMed] [Google Scholar]
- 12.Tian Y, Zhou Y, Huang S, Li J, Zhao K, Li X, Wen X, Li XA. Fecal microbiota transplantation for ulcerative colitis: a prospective clinical study. BMC Gastroenterol 2019; 19:116. [DOI] [PMC free article] [PubMed] [Google Scholar]
- 13.Wei Y, Gong J, Zhu W, Tian H, Ding C, Gu L, Li N, Li J. Pectin enhances the effect of fecal microbiota transplantation in ulcerative colitis by delaying the loss of diversity of gut flora. BMC Microbiol 2016; 16:255. [DOI] [PMC free article] [PubMed] [Google Scholar]
- 14.Eisenstein EM, Williams CB. The T(reg)/Th17 cell balance: a new paradigm for autoimmunity. Pediatr Res 2009; 65:26R–31R [DOI] [PubMed] [Google Scholar]
- 15.Cheng H, Guan X, Chen D, Ma W. The Th17/treg cell balance: a gut microbiota-modulated story. Microorganisms 2019; 7:583. [DOI] [PMC free article] [PubMed] [Google Scholar]
- 16.Gong Y, Lin Y, Zhao N, He X, Lu A, Wei W, Jiang M. The Th17/treg immune imbalance in ulcerative colitis disease in a Chinese Han population. Mediators Inflamm 2016; 2016:7089137. [DOI] [PMC free article] [PubMed] [Google Scholar]
- 17.Zhu Q, Zheng P, Zhou J, Chen X, Feng Y, Wang W, Zhou F, He Q. Andrographolide affects Th1/Th2/Th17 responses of peripheral blood mononuclear cells from ulcerative colitis patients. Mol Med Rep 2018; 18:622–6 [DOI] [PubMed] [Google Scholar]
- 18.Bing X, Xuelei L, Wanwei D, Linlang L, Keyan C. EGCG maintains Th1/Th2 balance and mitigates ulcerative colitis induced by dextran sulfate sodium through TLR4/MyD88/NF-κB signaling pathway in rats. Can J Gastroenterol Hepatol 2017; 2017:3057268. [DOI] [PMC free article] [PubMed] [Google Scholar]
- 19.Cayzer C, Patel K, Wang X, Florin T. Effect of probiotics on Th1 and Th2 cytokines: relevance to pathogenesis and treatment of ulcerative colitis. J Gastroenterol Hepatol 2001; 16:36 [Google Scholar]
- 20.Bing X, Linlang L, Keyan C. Decreased breg/Th17 ratio improved the prognosis of patients with ulcerative colitis. Can J Gastroenterol Hepatol 2018; 2018:5760849. [DOI] [PMC free article] [PubMed] [Google Scholar]
- 21.Jiang W, Su J, Zhang X, Cheng X, Zhou J, Shi R, Zhang H. Elevated levels of Th17 cells and Th17-related cytokines are associated with disease activity in patients with inflammatory bowel disease. Inflamm Res 2014; 63:943–50 [DOI] [PubMed] [Google Scholar]
- 22.Luo S, Wen R, Wang Q, Zhao Z, Nong F, Fu Y, Huang S, Chen J, Zhou L, Luo X. Rhubarb peony decoction ameliorates ulcerative colitis in mice by regulating gut microbiota to restoring Th17/treg balance. J Ethnopharmacol 2019; 231:39–49 [DOI] [PubMed] [Google Scholar]
- 23.Abo H, Flannigan KL, Geem D, Ngo VL, Harusato A, Denning TL. Combined IL-2 immunocomplex and anti-IL-5 mAb treatment expands Foxp3+ treg cells in the absence of eosinophilia and ameliorates experimental colitis. Front Immunol 2019; 10:459. [DOI] [PMC free article] [PubMed] [Google Scholar]
- 24.Qin J, Li R, Raes J, Arumugam M, Burgdorf KS, Manichanh C, Nielsen T, Pons N, Levenez F, Yamada T, Mende DR, Li J, Xu J, Li S, Li D, Cao J, Wang B, Liang H, Zheng H, Xie Y, Tap J, Lepage P, Bertalan M, Batto JM, Hansen T, Le Paslier D, Linneberg A, Nielsen HB, Pelletier E, Renault P, Sicheritz-Ponten T, Turner K, Zhu H, Yu C, Li S, Jian M, Zhou Y, Li Y, Zhang X, Li S, Qin N, Yang H, Wang J, Brunak S, Doré J, Guarner F, Kristiansen K, Pedersen O, Parkhill J.Weissenbach J; MetaHIT Consortium, Bork P, Ehrlich SD, Wang J. A human gut microbial gene catalogue established by metagenomic sequencing. Nature 2010; 464:59–65 [DOI] [PMC free article] [PubMed] [Google Scholar]
- 25.Xu J, Bjursell MK, Himrod J, Deng S, Carmichael LK, Chiang HC, Hooper LV, Gordon JI. A genomic view of the human-Bacteroides thetaiotaomicron symbiosis. Science 2003; 299:2074–6 [DOI] [PubMed] [Google Scholar]
- 26.Yatsunenko T, Rey FE, Manary MJ, Trehan I, Dominguez-Bello MG, Contreras M, Magris M, Hidalgo G, Baldassano RN, Anokhin AP, Heath AC, Warner B, Reeder J, Kuczynski J, Caporaso JG, Lozupone CA, Lauber C, Clemente JC, Knights D, Knight R, Gordon JI. Human gut microbiome viewed across age and geography. Nature 2012; 486:222–7 [DOI] [PMC free article] [PubMed] [Google Scholar]
- 27.Nicholson JK, Holmes E, Kinross J, Burcelin R, Gibson G, Jia W, Pettersson S. Host-gut microbiota metabolic interactions. Science 2012; 336:1262–7 [DOI] [PubMed] [Google Scholar]
- 28.Garrett WS, Gordon JI, Glimcher LH. Homeostasis and inflammation in the intestine. Cell 2010; 140:859–70 [DOI] [PMC free article] [PubMed] [Google Scholar]
- 29.O'Keefe SJ, Ou J, Aufreiter S, O'Connor D, Sharma S, Sepulveda J, Fukuwatari T, Shibata K, Mawhinney T. Products of the colonic microbiota mediate the effects of diet on colon cancer risk. J Nutr 2009; 139:2044–8 [DOI] [PMC free article] [PubMed] [Google Scholar]
- 30.Hooper LV, Littman DR, Macpherson AJ. Interactions between the microbiota and the immune system. Science 2012; 336:1268–73 [DOI] [PMC free article] [PubMed] [Google Scholar]
- 31.Sanz Y, Santacruz A, Gauffin P. Gut microbiota in obesity and metabolic disorders. Proc Nutr Soc 2010; 69:434–41 [DOI] [PubMed] [Google Scholar]
- 32.Li D, Zhang L, Dong F, Liu Y, Li N, Li H, Lei H, Hao F, Wang Y, Zhu Y, Tang H. Metabonomic changes associated with atherosclerosis progression for LDLR(-/-) mice. J Proteome Res 2015; 14:2237–54 [DOI] [PubMed] [Google Scholar]
- 33.Parracho HM, Bingham MO, Gibson GR, McCartney AL. Differences between the gut microflora of children with autistic spectrum disorders and that of healthy children. J Med Microbiol 2005; 54:987–91 [DOI] [PubMed] [Google Scholar]
- 34.Andrews H, Barczak P, Allan RN. Psychiatric illness in patients with inflammatory bowel disease. Gut 1987; 28:1600–4 [DOI] [PMC free article] [PubMed] [Google Scholar]
- 35.Eckburg PB, Bik EM, Bernstein CN, Purdom E, Dethlefsen L, Sargent M, Gill SR, Nelson KE, Relman DA. Diversity of the human intestinal microbial flora. Science 2005;308:1635--8. [DOI] [PMC free article] [PubMed] [Google Scholar]
- 36.Sun Y, Li L, Xia Y, Li W, Wang K, Wang L, Miao Y, Ma S. The gut microbiota heterogeneity and assembly changes associated with the IBD. Sci Rep 2019; 9:440. [DOI] [PMC free article] [PubMed] [Google Scholar]
- 37.Atarashi K, Tanoue T, Shima T, Imaoka A, Kuwahara T, Momose Y, Cheng G, Yamasaki S, Saito T, Ohba Y, Taniguchi T, Takeda K, Hori S, Ivanov II, Umesaki Y, Itoh K, Honda K. Induction of colonic regulatory T cells by indigenous clostridium species. Science 2011; 331:337–41 [DOI] [PMC free article] [PubMed] [Google Scholar]
- 38.Gaboriau-Routhiau V, Rakotobe S, Lécuyer E, Mulder I, Lan A, Bridonneau C, Rochet V, Pisi A, De Paepe M, Brandi G, Eberl G, Snel J, Kelly D, Cerf-Bensussan N. The key role of segmented filamentous bacteria in the coordinated maturation of gut helper T cell responses. Immunity 2009; 31:677–89 [DOI] [PubMed] [Google Scholar]
- 39.Mazmanian SK, Liu CH, Tzianabos AO, Kasper DL. An immunomodulatory molecule of symbiotic bacteria directs maturation of the host immune system. Cell 2005; 122:107–18 [DOI] [PubMed] [Google Scholar]
- 40.Lee N, Kim WU. Microbiota in T-cell homeostasis and inflammatory diseases. Exp Mol Med 2017; 49:e340. [DOI] [PMC free article] [PubMed] [Google Scholar]
- 41.Weingarden AR, Vaughn BP. Intestinal microbiota, fecal microbiota transplantation, and inflammatory bowel disease. Gut Microbes 2017; 8:238–52 [DOI] [PMC free article] [PubMed] [Google Scholar]
- 42.Burrello C, Garavaglia F, Cribiù FM, Ercoli G, Lopez G, Troisi J, Colucci A, Guglietta S, Carloni S, Guglielmetti S, Taverniti V, Nizzoli G, Bosari S, Caprioli F, Rescigno M, Facciotti F. Therapeutic faecal microbiota transplantation controls intestinal inflammation through IL10 secretion by immune cells. Nat Commun 2018; 9:5184. [DOI] [PMC free article] [PubMed] [Google Scholar]
Associated Data
This section collects any data citations, data availability statements, or supplementary materials included in this article.
Supplementary Materials
Supplemental material, sj-pdf-1-ebm-10.1177_15353702211006044 for Treatment and mechanism of fecal microbiota transplantation in mice with experimentally induced ulcerative colitis by Leichang Zhang, Xiaofei Ma, Peng Liu, Wei Ge, Lixia Hu, Zhengyun Zuo, Huirong Xiao and Wu Liao in Experimental Biology and Medicine


