Abstract
Precise deposition of CpG methylation is critical for mammalian development and tissue homeostasis and is often dysregulated in human diseases. The localization of de novo DNA methyltransferase DNMT3A is facilitated by its PWWP domain recognizing histone H3 lysine 36 (H3K36) methylation1,2 and is normally depleted at CpG islands (CGIs)3. However, methylation of CGIs regulated by Polycomb repressive complexes (PRCs) has also been observed4–8. Here, we report that DNMT3A PWWP domain mutations identified in paragangliomas9 and microcephalic dwarfism10 promote aberrant localization of DNMT3A to CGIs in a PRC1-dependent manner. DNMT3A PWWP mutants accumulate at regions containing PRC1-mediated formation of monoubiquitylated histone H2A lysine 119 (H2AK119ub), irrespective of the amounts of PRC2-catalyzed formation of trimethylated histone H3 lysine 27 (H3K27me3). DNMT3A interacts with H2AK119ub-modified nucleosomes through a putative amino-terminal ubiquitin-dependent recruitment region, providing an alternative form of DNMT3A genomic targeting that is augmented by the loss of PWWP reader function. Ablation of PRC1 abrogates localization of DNMT3A PWWP mutants to CGIs and prevents aberrant DNA hypermethylation. Our study implies that a balance between DNMT3A recruitment by distinct reader domains guides de novo CpG methylation and may underlie the abnormal DNA methylation landscapes observed in select human cancer subtypes and developmental disorders.
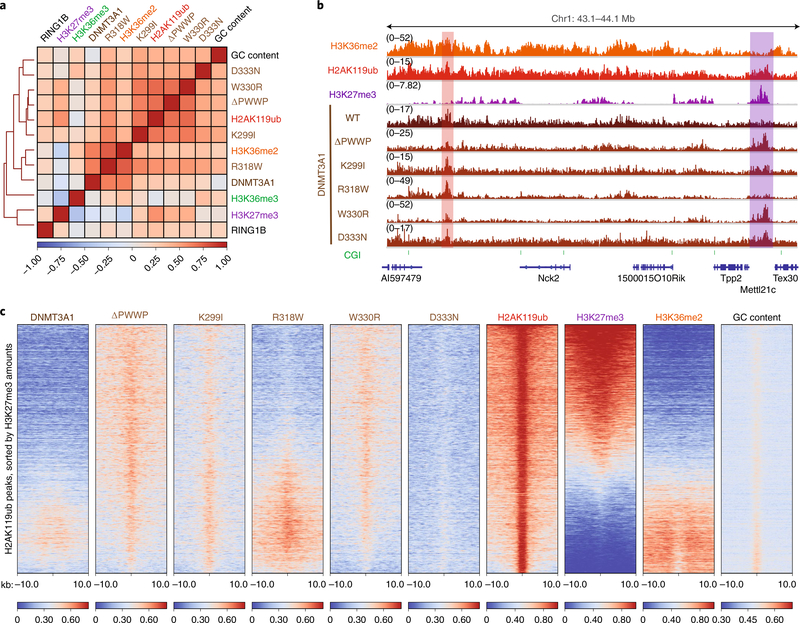
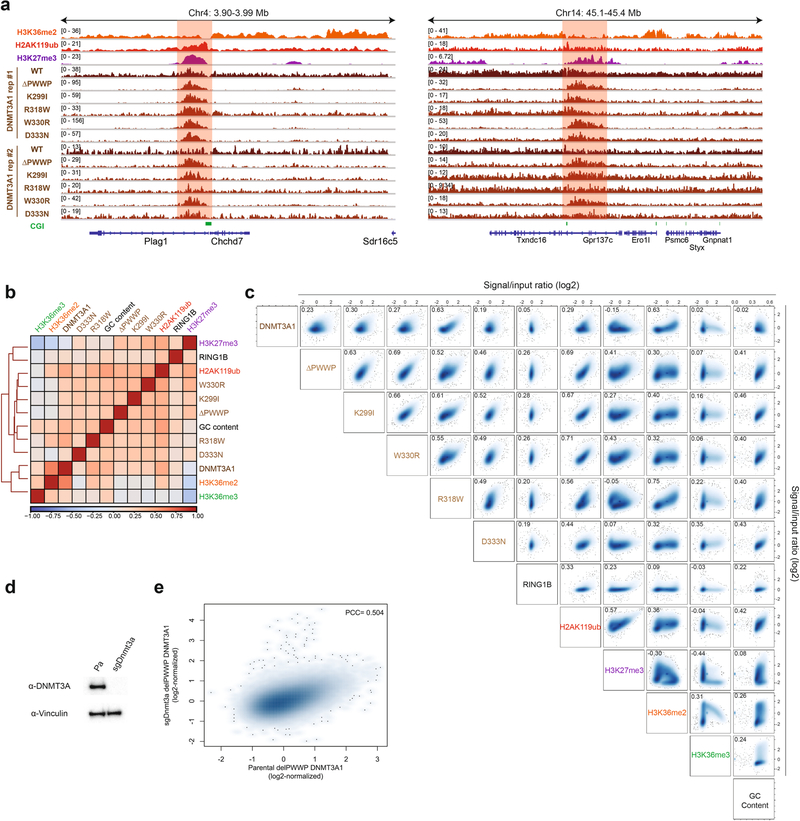
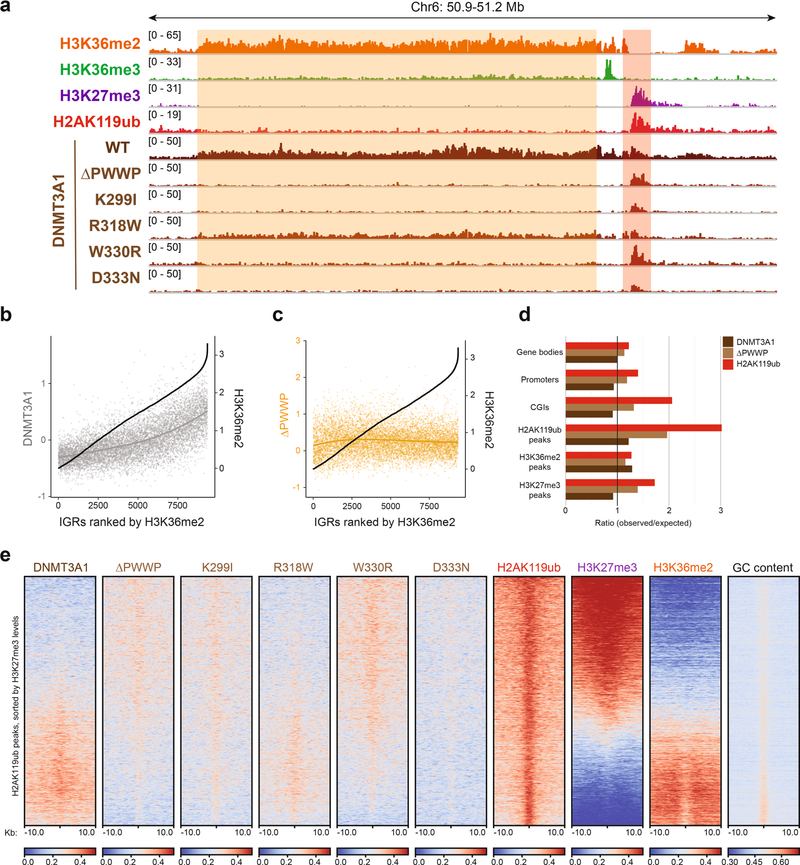
Disease-associated hotspot missense mutations in DNMT3A impair the binding of its PWWP domain to di- and trimethylated histone H3 lysine 36 (H3K36me2 and H3K36me3) (refs. 10,11), and also promote DNA hypermethylation of Polycomb-regulated regions through an uncharacterized mechanism9,10,12. To better understand the regulation of DNMT3A mutant targeting, we stably expressed wild-type, PWWP domain deletion mutant (ΔPWWP) and patient-derived PWWP domain mutant (K299I, R318W, W330R and D333N) forms of hemagglutinin (HA)-tagged DNMT3A1—the predominant isoform in somatic cells13,14—in C3H10T1/2 mouse mesenchymal stem-like cells (MSCs). We next obtained genome-wide binding profiles for each mutant by using chromatin immunoprecipitation followed by sequencing (ChIP– seq) and compared them to the genomic distribution patterns of histone post-translational modifications (H3K36me2, H3K36me3, H3K27me3 and H2AK119ub) and the PRC1 subunit RING1B in MSCs2,15. DNMT3A ΔPWWP and patient-derived mutant binding profiles were all highly correlated and most strongly enhanced at Polycomb-regulated regions as defined by the presence of H3K27me3 or H2AK119ub (Fig. 1a and Extended Data Fig. 1a–c). Similar genomic localization patterns of DNMT3A ΔPWWP were observed in the absence of endogenous DNMT3A (Extended Data Fig. 1d,e). Consistent with previous biochemical characterizations, the DNMT3A PWWP mutants exhibited reduced localization to H3K36me2-enriched intergenic regions relative to wild-type DNMT3A (Extended Data Fig. 2a–d). Thus, disease-associated mutations in DNMT3A alter PWWP-mediated targeting to intergenic regions and promote mistargeting to Polycomb-regulated regions through disruption of PWWP reader domain functionality.
Fig. 1 |. Disease-associated mutations promote DNMT3A colocalization with H2AK119ub due to loss of PWWP domain reader functionality.
a, Heat map showing genome-wide, pairwise Pearson correlations across 10-kb bins (n = 245,842) for H3K36me2, H3K36me3, H3K27me3, H2AK119ub, GC content, DNMT3A1 wild type, DNMT3A1 PWWP mutants and RING1B. b, Genome browser representation of ChIP-seq normalized reads for H3K36me2, H2AK119ub, H3K27me3, DNMT3A1 wild type and DNMT3A1 PWWP mutants in mouse MSCs at chromosome 1: 43.1–44.1 Mb. Genes from the RefSeq database are annotated at the bottom. The shaded areas indicate H2AK119ub-enriched genomic regions associated with H3K27me3 (purple) and H3K36me2 (red). c, Enrichment heat map depicting ChIP-seq normalized reads centered at H2AK119ub peaks ±10 kb (n = 16,064), sorted by H3K27me3 amounts for DNMT3A1 wild type, DNMT3A1 PWWP mutants, H2AK119ub, H3K27me3, H3K36me2 and GC content.
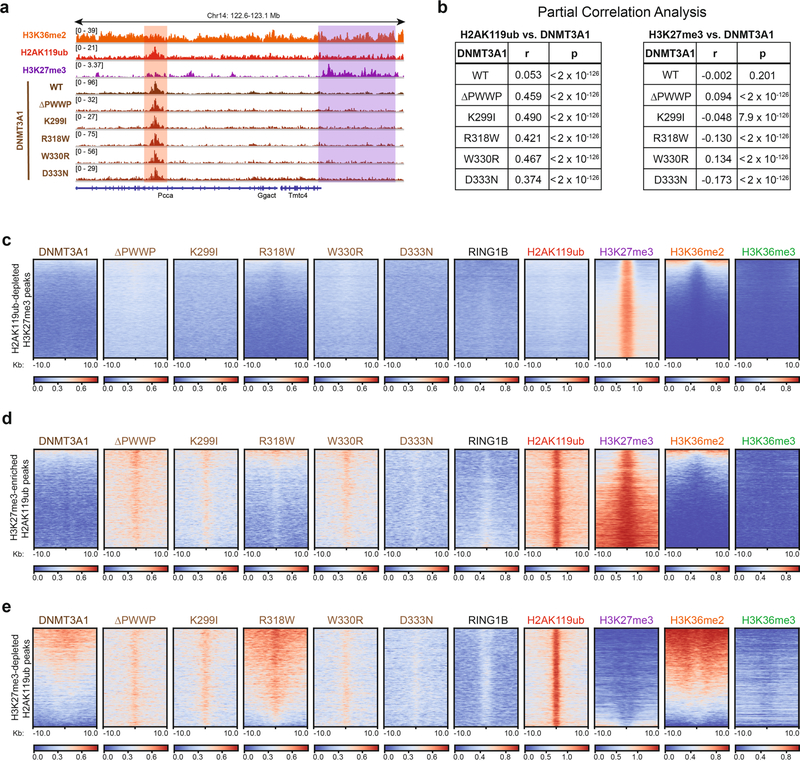
Upon closer examination, we noted that the DNMT3A mutant binding correlated more strongly genome-wide with H2AK119ub compared with H3K27me3 (Fig. 1a and Extended Data Fig. 1a–c). Indeed, DNMT3A ΔPWWP and patient-derived mutants were closely associated with H2AK119ub peaks genome-wide, whereas DNMT3A wild-type colocalized with H2AK119ub primarily in the accompanying presence of H3K36me2 (Fig. 1b,c, Extended Data Figs. 2e and 3a). DNMT3A mutant binding closely tracked with H2AK119ub even after accounting for the genomic distribution of H3K27me3 and H3K36me2 (Extended Data Fig. 3b), whereas mutant association with H3K27me3 peaks lacking H2AK119ub genome-wide was minimal (Extended Data Fig. 3a,c). Accordingly, DNMT3A mutant localization to H2AK119ub peaks was observed regardless of the accompanying presence (Extended Data Fig. 3d) or absence (Extended Data Fig. 3e) of H3K27me3, further suggesting that their recruitment to Polycomb-regulated regions occurs separately from PRC2 activity.
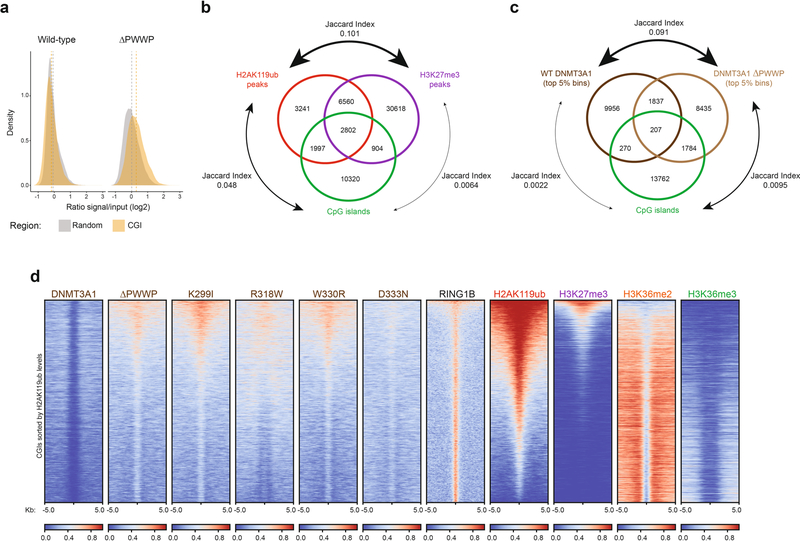
While canonical PRC1 recognizes H3K27me3 through chromodomain-containing CBX subunits, variant forms of PRC1 are targeted to CGIs in a PRC2-independent fashion16–18. We thus examined whether DNMT3A mutants were targeted to CGIs due to the action of PRC1. In aggregate, DNMT3A ΔPWWP and H2AK119ub were enriched at CGIs relative to wild-type DNMT3A (Extended Data Fig. 2d). Permutation testing confirmed that DNMT3A ΔPWWP localization was enriched at CGIs, whereas wild-type DNMT3A localization was not (Extended Data Fig. 4a). Genome-wide analysis also showed that CGIs were more strongly associated with the presence of H2AK119ub (4,799 of 16,023 CGIs; 29.9%) than H3K27me3 (3,706 of 16,023 CGIs; 23.1%) (Extended Data Fig. 4b). DNMT3A ΔPWWP was highly enriched at only a fraction of all CGIs (1,991 of 16,023, 12.4%) (Extended Data Fig. 4c). On closer examination, we observed enhanced localization of DNMT3A mutants specifically at H2AK119ub-enriched CGIs, in contrast to wild-type DNMT3A, which exhibited weaker association with CGIs consistent with the relative depletion of H3K36me2 and H3K36me3 at these sites (Extended Data Fig. 4d). Furthermore, targeting of DNMT3A mutants to H2AK119ub-enriched CGIs could not be explained by the presence of PRC1 itself, as the RING1B subunit was relatively uniformly enriched across all CGIs (Extended Data Fig. 4d). Together, these results indicate that DNMT3A mutant localization to CGIs is strongly and specifically correlated with the presence of H2AK119ub
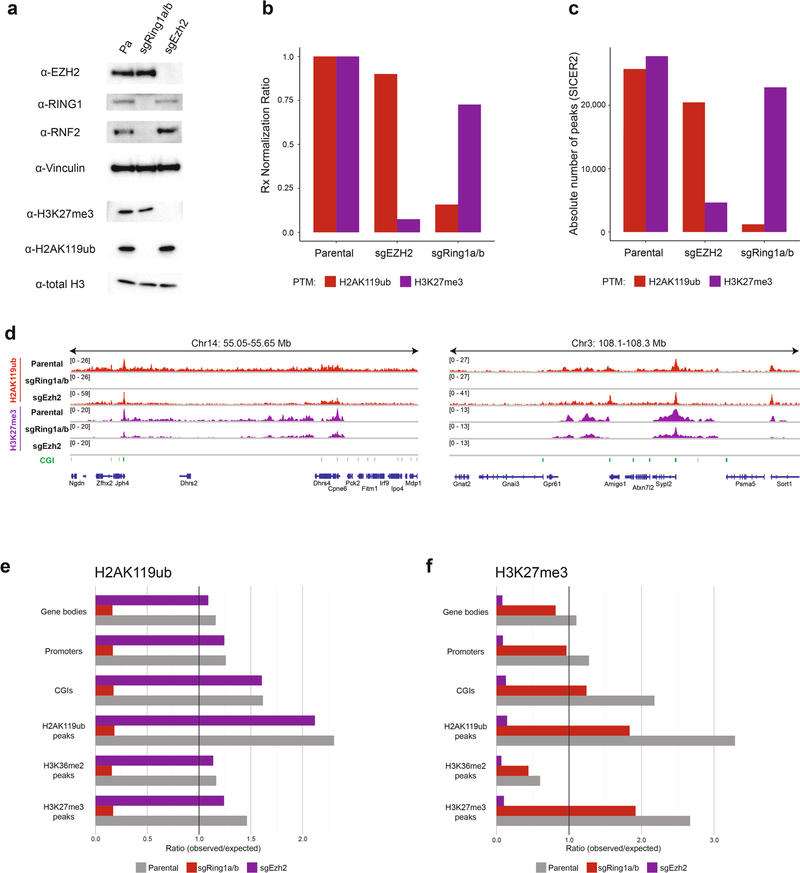
PRC1 contains two interchangeable ubiquitin ligase catalytic subunits, RING1A and RING1B, which are redundant for depositing H2AK119ub genome-wide19,20 whereas PRC2 deposits H3K27me3 primarily through its methyltransferase catalytic subunit EZH2 (ref. 21). To directly test if PRC1 and PRC2 are required for DNMT3A mutant targeting, we used CRISPR–Cas9 to genetically ablate both Ring1 and Rnf2 (sgRing1a/b) or Ezh2 alone (sgEzh2) in MSCs (Extended Data Fig. 5a). Genetic ablation of PRC1 was accompanied by a profound reduction in global amounts of H2AK119ub and a modest reduction in H3K27me3 amounts; conversely, ablation of PRC2 led to a marked reduction in the amounts of H3K27me3, but not H2AK119ub (Extended Data Fig. 5a,b). Genome-wide, the prevalence and distribution of H3K27me3 in sgRing1a/b cells, and of H2AK119ub in sgEzh2 cells, were largely similar to those observed in parental MSCs (Extended Data Fig. 5c–f).
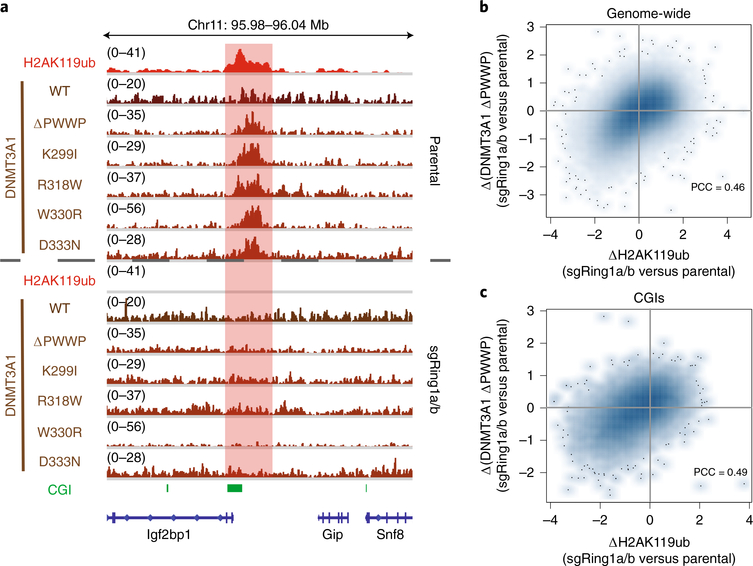
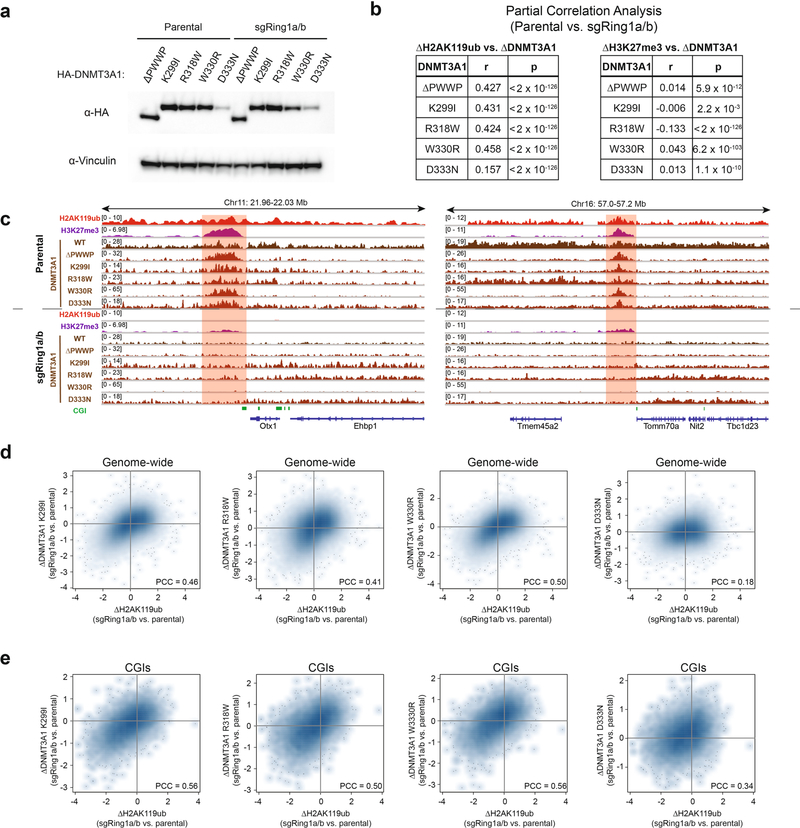
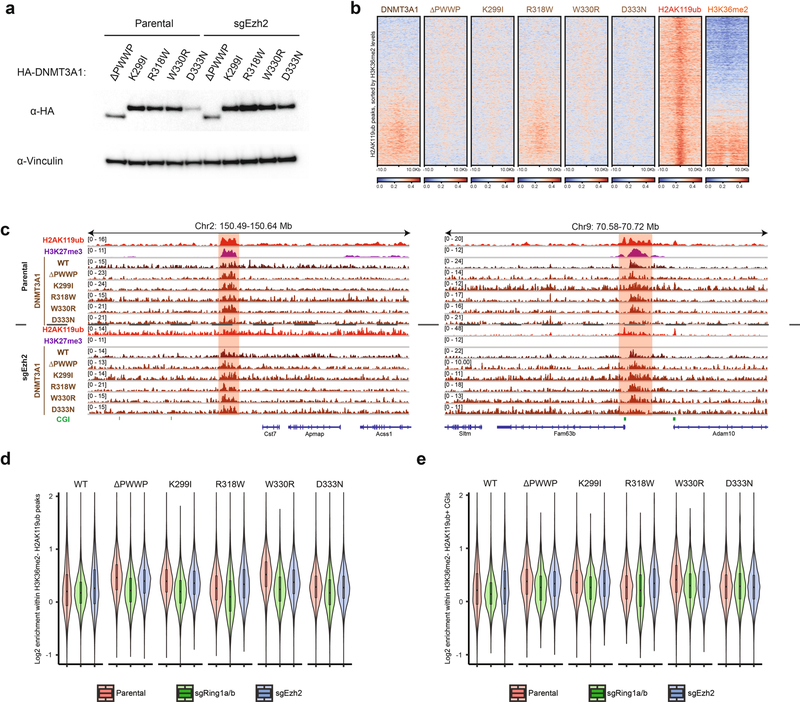
We next stably expressed DNMT3A ΔPWWP and patient-derived mutants in sgRing1a/b cells at equivalent amounts to parental MSCs (Extended Data Fig. 6a). ChIP–seq in sgRing1a/b MSCs showed impaired localization of DNMT3A mutants at sites of H2AK119ub depletion (Fig. 2a). As PRC1 in certain contexts can support downstream recruitment of PRC2 (refs. 18,22,23), we sought to confirm that loss of DNMT3A mutant recruitment could not be explained by changes to H3K27me3. Partial correlation analysis indicated that reductions in DNMT3A mutant recruitment tracked more closely with changes to H2AK119ub than changes to H3K27me3 in sgRing1a/b cells (Extended Data Fig. 6b). Moreover, loss of DNMT3A mutant localization at H2AK119ub-depleted regions was observed despite the persistence of H3K27me3 at some sites (Extended Data Fig. 6c). Genome-wide, depletion of H2AK119ub in sgRing1a/b cells was accompanied by reduced recruitment of both DNMT3A ΔPWWP (Fig. 2b) and patient-derived mutants (Extended Data Fig. 6d). Similar trends were also observed at CGIs for DNMT3A ΔPWWP (Fig. 2c) and patient-derived mutants (Extended Data Fig. 6e). For comparison, we stably expressed DNMT3A ΔPWWP and patient-derived mutants in sgEzh2 cells (Extended Data Fig. 7a). Global depletion of H3K27me3 was not accompanied by substantial changes in the genome-wide distribution of DNMT3A PWWP mutants, which localized to H2AK119ub peaks in sgEzh2 cells (Extended Data Fig. 7b,c). In line with these data, DNMT3A PWWP mutant localization to H2AK119ub-enriched regions (Extended Data Fig. 7d) and CGIs (Extended Data Fig. 7e) lacking H3K36me2 was more strongly blunted by deletion of PRC1 than ablation of PRC2.
Fig. 2 |. PRC1-catalyzed H2AK119ub deposition is required for localization of DNMT3A to CGIs.
a, Genome browser representation of ChIP-seq normalized reads for H2AK119ub, DNMT3A1 wild type and DNMT3A1 PWWP mutants in parental and sgRing1a/b mouse MSCs at chromosome 11: 95.98–96.04Mb. CGIs (green) and genes from the RefSeq database are annotated at the bottom. The shaded area indicates an H2AK119ub-enriched genomic region. b, Difference in ChIP-seq normalized reads of DNMT3A1 ΔPWWP between parental and sgRing1a/b mouse MSCs relative to that of H2AK119ub for 10-kb nonoverlapping bins genome-wide (n = 245,842). Pearson’s correlation coefficient is indicated. c, Difference in ChIP-seq normalized reads of DNMT3A1 ΔPWWP between parental and sgRing1a/b mouse MSCs relative to that of H2AK119ub for CGIs (n = 15,492). Pearson’s correlation coefficient is indicated.
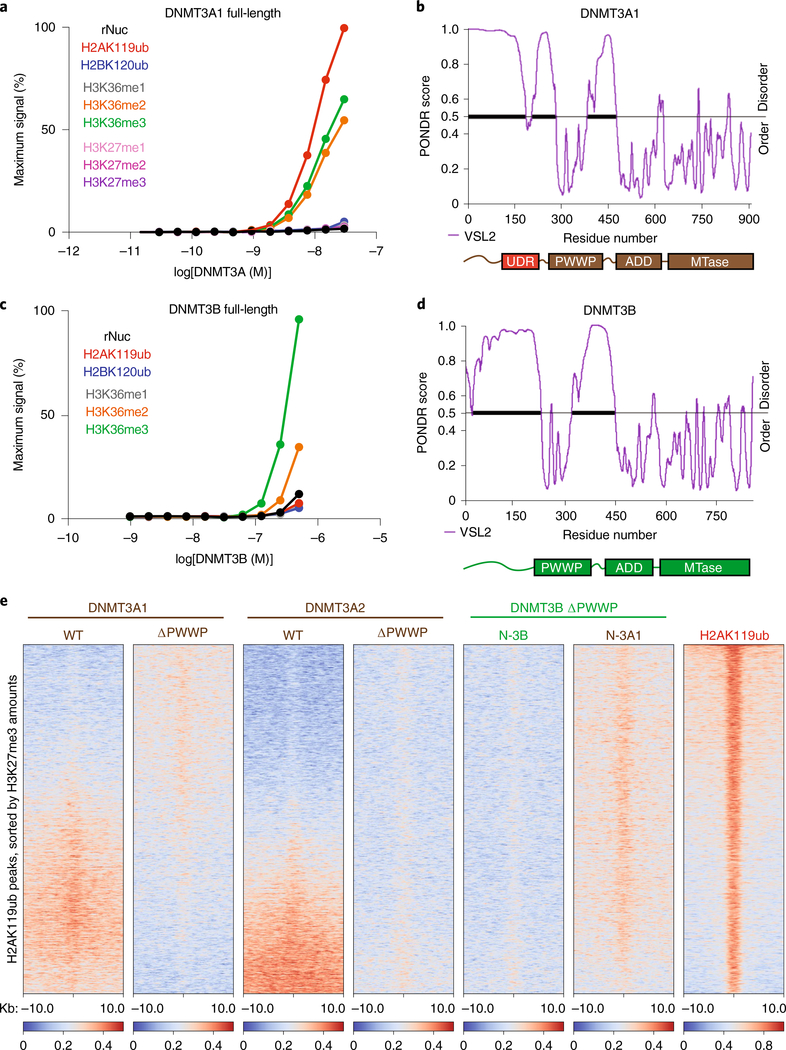
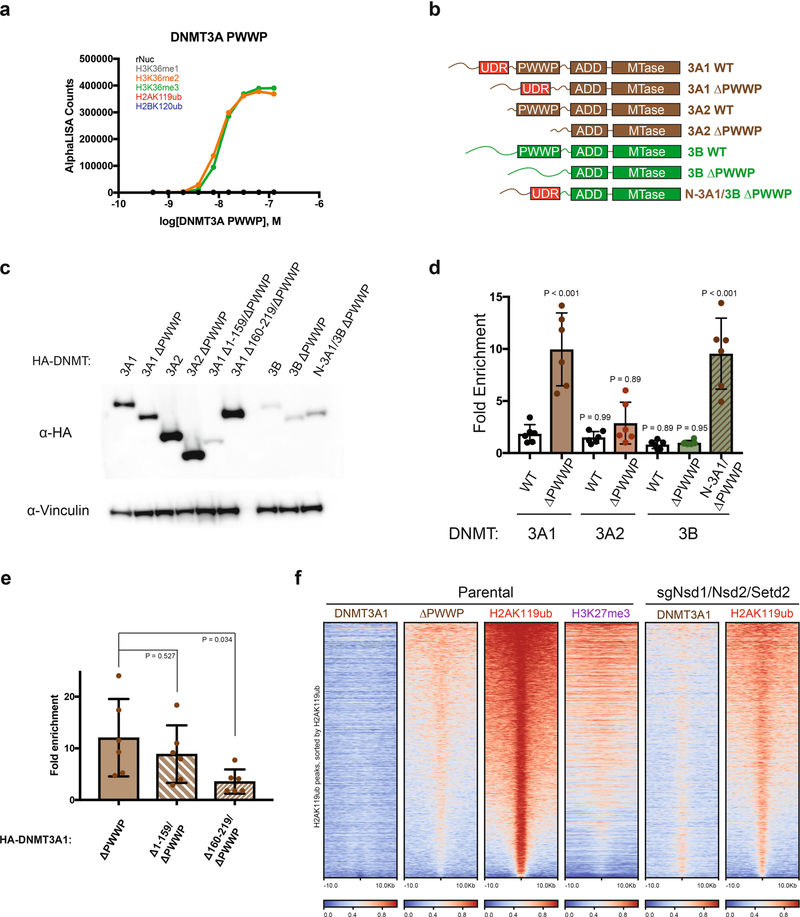
We asked whether DNMT3A mutant recruitment is mediated through direct interaction with H2AK119ub-modified nucleosomes. We reasoned that wild-type DNMT3A may possess a latent ability to bind H2AK119ub, which is augmented in cells upon loss of PWWP domain reader function. We therefore examined the inter-actions between purified full-length DNMT3A1 and semisynthetic nucleosomes in vitro. Indeed, we observed DNMT3A1 bound to nucleosomes modified with H2AK119ub, in addition to those with H3K36me2 or H3K36me3, but did not recognize unmodified nucleosomes or those containing H2BK120ub, H3K36me1, H3K27me1, H3K27me2 or H3K27me3 (Fig. 3a). Furthermore, interaction with H2AK119ub-modified nucleosomes was not observed for the purified DNMT3A PWWP domain (DNMT3APWWP) (Extended Data Fig. 8a). We speculated that full-length DNMT3A1 may contain a ubiquitin-dependent recruitment region (UDR), similar to a structured region identified in 53BP1 that mediates interaction with H2AK15ub-modified nucleosomes24,25. Consistent with this notion, Predictor of Natural Disordered Regions (PONDR) analysis showed the presence of an unannotated ordered domain (residues 160–219) in the amino-terminal region of DNMT3A1 that could serve as a putative UDR (Fig. 3b).
Fig. 3 |. DNMT3A interacts directly with H2AK119ub through an N-terminal UDR.
a, AlphaLISA counts for interaction of GST-tagged full-length DNMT3A1 titrated against modified (as indicated) or unmodified (rNuc) nucleosomes. Data are mean values from replicates and are representative of two independent experiments. b, Graph of intrinsic disorder for DNMT3A1. PONDR VSL2 scores are indicated on the y axis and the amino acid positions are indicated on the x axis, with the domain structure of DNMT3A1 shown below. c, AlphaLISA counts for interaction of GST-tagged full-length DNMT3B titrated against modified (as indicated) or unmodified (rNuc) nucleosomes. Data are mean values from replicates and are representative of two independent experiments. d, Graph of intrinsic disorder for DNMT3B. PONDR VSL2 scores are indicated on the y axis and the amino acid positions are indicated on the x axis, with the domain structure of DNMT3B shown below. e, Enrichment heat map depicting ChIP-seq normalized reads centered at H2AK119ub peaks ± 10 kb (n = 16,064), sorted by H3K27me3 amounts for DNMT3A1 wild type, DNMT3A1 ΔPWWP, DNMT3A2 wild type, DNMT3A2 ΔPWWP, DNMT3B ΔPWWP (N-3B) and chimeric DNMT3B ΔPWWP containing the amino-terminal residues 1–219 of DNMT3A1 (N-3A1), and H2AK119ub.
The amino-terminal region of DNMT3A1 is absent from DNMT3A2—a shorter isoform expressed primarily in early development—and has minimal amino acid sequence conservation with that of DNMT3B, the other mammalian de novo DNA methyltransferase14. Purified full-length DNMT3B engaged nucleosomes modified with H3K36me3 and H3K36me2 but, unlike DNMT3A1, failed to interact with H2AK119ub-modified nucleosomes in vitro (Fig. 3c). The amino-terminal portion of DNMT3B also lacked a well-demarcated ordered domain (Fig. 3d), suggesting that UDR-mediated recognition of H2AK119ub may be specific to DNMT3A1. To assess whether the amino-terminal UDR region of DNMT3A1 is necessary and sufficient for targeting to H2AK119ub-enriched regions, we stably expressed wild-type, PWWP deletion and domain-swap mutants of DNMT3A1, DNMT3A2 and DNMT3B in parental MSCs (Extended Data Fig. 8b,c). Deletion of the PWWP domain promoted localization of DNMT3A1, but not DNMT3A2 (3A2 ΔPWWP) or DNMT3B (3B ΔPWWP), to H2AK119ub-enriched regions. Swapping of the amino-terminal region of DNMT3A1 into DNMT3B (N-3A1/3B ΔPWWP) was sufficient to confer colocalization with H2AK119ub (Fig. 3e, Extended Data Fig. 8d). Furthermore, we found that DNMT3A1 ΔPWWP required the UDR (residues 160–219) for targeting to H2AK119ub-enriched regions whereas the amino-terminal disordered region (residues 1–159) was dispensable (Extended Data Fig. 8e). As disruption of PWWP reader functionality promoted UDR-mediated recruitment of DNMT3A to H2AK119ub-enriched regions, we wondered whether cellular depletion of H3K36me2 and H3K36me3, the binding substrates of the DNMT3A PWWP domain, would elicit a similar effect. Accordingly, wild-type DNMT3A1 exhibited enhanced colocalization with H2AK119ub in MSCs that were profoundly depleted of global H3K36me2/3 amounts due to genetic ablation of several major H3K36 methyltransferase enzymes (sgNsd1/Nsd2/Setd2) (ref. 2) (Extended Data Fig. 8f).
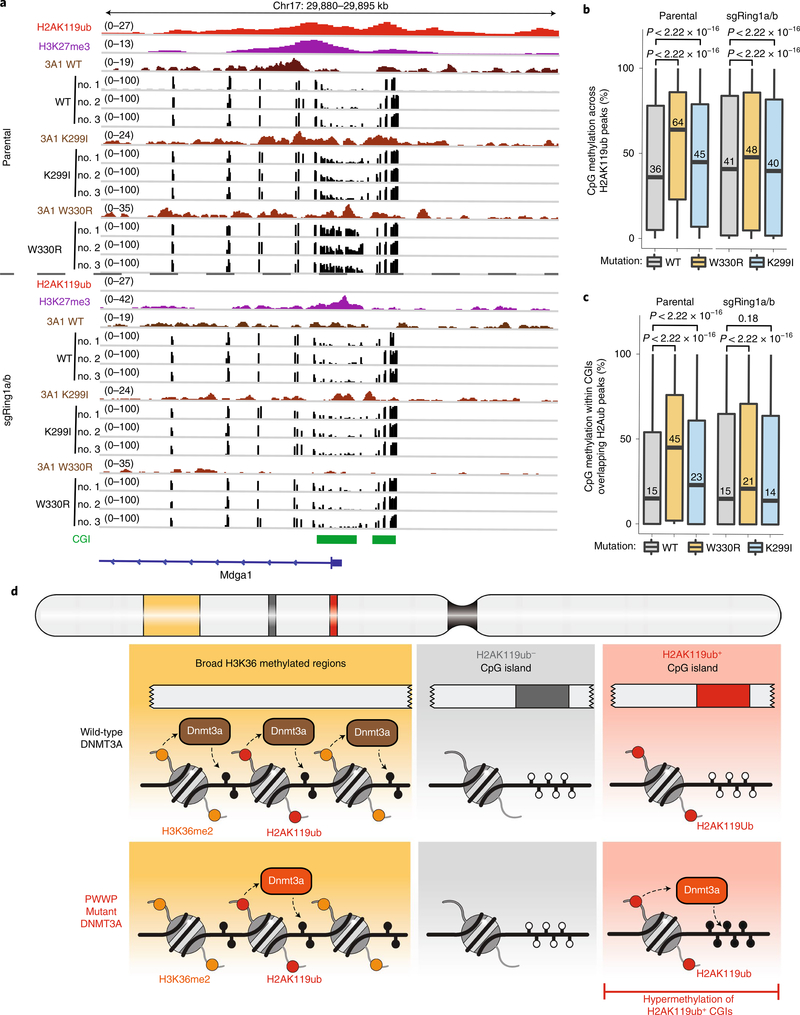
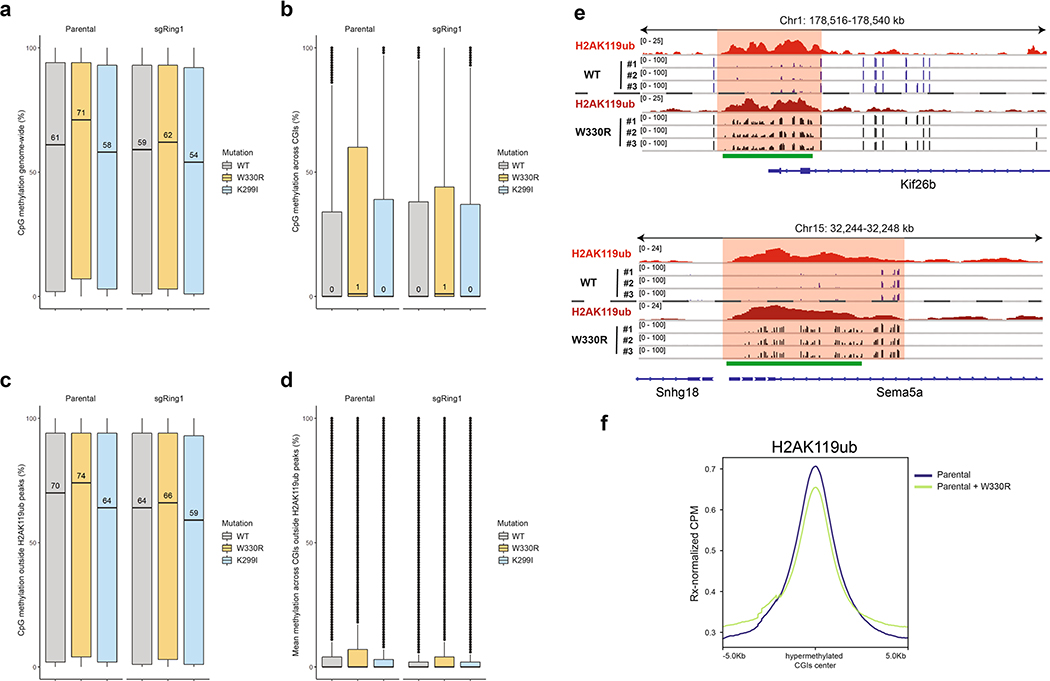
Patient samples harboring hotspot missense mutations in DNMT3A are characterized by DNA hypermethylation of Polycomb-regulated regions, which is recapitulated by a mouse model of the W330R mutation9,10,12. To determine whether hypermethylation may be a direct consequence of DNMT3A mutant recruitment by H2AK119ub, we performed reduced representation bisulfite sequencing (RRBS) in parental and sgRing1a/b MSCs expressing wild-type, K299I-mutant or W330R-mutant DNMT3A1 (Extended Data Fig. 9a,b). In both K299I- and W330R-expressing parental cells, we observed DNA hypermethylation at H2AK119ub-enriched CGIs that was abrogated by deletion of PRC1 and concomitant loss of DNMT3A1 K299I and W330R mutant recruitment (Fig. 4a). Genome-wide, expression of DNMT3A1 K299I and W330R mutants promoted hypermethylation of H2AK119ub-enriched regions in a PRC1-dependent manner (Fig. 4b) and elicited minimal changes at H2AK119ub-depleted regions (Extended Data Fig. 9c). CGI hypermethylation in K299I-and W330R-mutant cells similarly required PRC1 and coincided with the presence (Fig. 4c) but not the absence (Extended Data Fig. 9d) of H2AK119ub in parental MSCs. In addition, hypermethylation of CGIs in W330R-expressing cells was not accompanied by substantial alterations in local H2AK119ub amounts (Extended Data Fig. 9e,f). We conclude that PRC1 is required for aberrant methylation of H2AK119ub-enriched regions including CGIs by DNMT3A mutants.
Fig. 4 |. DNMT3A-mediated CGI hypermethylation is dependent on PRC1.
a, Genome browser representation of ChIP-seq normalized reads for H2AK119ub, DNMT3A1 wild type (WT), DNMT3A1 K299I, DNMT3A1 W330R and RRBS data for CpG methylation (black) in parental and sgRing1a/b mouse MSCs expressing wild-type, K299I or W330R DNMT3A1 at chromosome 17: 29,880–29,895 kb. CGIs (green) and genes from the RefSeq database are annotated at the bottom. b, Boxplots for CpG methylation in parental H2AK119ub peak regions (n = 387,308 CpGs) in parental and sgRing1a/b mouse MSCs expressing DNMT3A1 wild type (gray), K299I (blue) or W330R (orange). The center line represents the median (indicated), the box limits are the 25th and 75th percentiles and the whiskers are the minimum to maximum values. P values were determined by two-sided Wilcoxon rank-sum test. c, Boxplots for CpG methylation at CpG islands in parental H2AK119ub peak regions (n = 278,112 CpGs) in parental and sgRing1a/b mouse MSCs expressing DNMT3A1 wild type (gray), K299I (blue) or W330R (orange). The center line represents the median (indicated), the box limits are the 25th and 75th percentiles and the whiskers are the minimum to maximum values. P values were determined by two-sided Wilcoxon rank-sum test. d, Model depicting changes in DNMT3A genomic localization patterns due to PWWP domain mutations associated with paragangliomas and microcephalic dwarfism. Wild-type DNMT3A is recruited to intergenic regions through PWWP-mediated recognition of H3K36me2. Disease-associated mutations in the PWWP domain abrogate binding to H3K36-methylated nucleosomes, promoting localization of DNMT3A to H2AK119ub-enriched regions that are depleted of H3K36me2, including CpG islands, through UDR-mediated recognition of H2AK119ub. As a result, H2AK119ub-enriched CpG islands become hypermethylated.
Our findings provide evidence for molecular cross-talk between PRC1-catalyzed H2AK119ub and DNMT3A that drives CGI hypermethylation upon mutational inactivation of PWWP reader function (Fig. 4d). We propose that, under steady-state conditions, PWWP-mediated recruitment of DNMT3A1 in cells predominates due to greater abundance of H3K36me2 and H3K36me3 compared with H2AK119ub (refs. 2,26,27). Alternative promoter use that regulates expression of the short isoform DNMT3A2, which lacks the ability to interact with H2AK119ub, may serve as another mechanism for preventing DNA methylation of PRC1-regulated regions in early developmental contexts13. Consistent with this notion, in mouse embryonic stem cells, DNMT3A1 exhibits a stronger propensity to localize to Polycomb-regulated regions than DNMT3A2 (ref. 14). Structural characterization of the DNMT3A1 UDR domain will be necessary to understand its selectivity for H2AK119ub-modified nucleosomes and show similarities to other histone ubiquitylation reader modules, including the UDR domain of 53BP1, which engages H2AK15Ub-modified nucleosomes through interaction with the acidic patch of the nucleosome core particle25. Further efforts aimed at elucidating how disease-associated DNMT3A PWWP mutations alter interaction with H3K36-methylated nucleosomes may also help clarify differences in the propensity of each mutant to colocalize with H2AK119ub and aberrantly methylate associated CGIs.
We propose that DNMT3A missense mutations observed in paragangliomas and microcephalic dwarfism share a common mechanism of action, although further study is required to assess their functional effect on cellular and organismal growth. However, we note that interaction with H2AK119ub-modified nucleosomes is an inherent property of wild-type DNMT3A and is not a neomorphic capability conferred by the disease-associated mutations. This raises the possibility that DNMT3A recruitment to, and de novo methylation of, H2AK119ub-enriched regions may occur in other physiologic and pathophysiologic contexts through changes in the balance between PWWP-mediated and UDR-mediated targeting. Indeed, de novo methylation of CGIs by wild-type DNMT3A has been reported in hematopoietic stem cells upon cytokine stimulation28 and many Polycomb-regulated gene promoters become DNA methylated during neuronal differentiation5. Moreover, phosphorylation of DNMT3A can direct its recruitment to heterochromatic regions and block its binding to promoters29,30. Further work is warranted to assess how post-translational modifications of DNMT3A affect its genomic targeting in development and disease. We speculate that UDR-mediated recruitment of DNMT3A may be promoted by oncogenic signaling pathways to create the patterns of CGI hypermethylation observed across diverse cancer types.
Online content
Any methods, additional references, Nature Research reporting summaries, source data, extended data, supplementary information, acknowledgements, peer review information; details of author contributions and competing interests; and statements of data and code availability are available at https://doi.org/10.1038/s41588-021-00856-5.
Methods
Plasmid and lentivirus generation for cell culture.
Single guide (sgRNAs) directed against mouse Ring1, Rnf2, Ezh2 and Dnmt3a were cloned into px458 (Addgene 48138; a gift from F. Zhang). Mouse DNMT3A and DNMT3B cDNA sequences from Horizon Dharmacon were cloned into pCDH-EF1-MCS-Neo (System Biosciences) with an N-terminal FLAG-HA epitope tag. We performed all cloning, including generation of deletion, domain-swap and patient-associated mutations using Gibson assembly (NEB). Deletion of residues 276–423 (corresponding to residues 280–427 in human DNMT3A) was used to generate DNMT3A ΔPWWP. Deletion of residues 220–360 (corresponding to residues 213–353 in human DNMT3B) was used to generate DNMT3B ΔPWWP. The amino-terminal region of mouse DNMT3A1 (residues 1–219) was swapped into DNMT3B to replace the amino-terminal disordered region and PWWP domain comprising residues 1–360 to generate N-3A1/3BΔPWWP. Identification of an amino-terminal ordered region of DNMT3A corresponding to residues 160–219 was determined using the VSL2 algorithm for intrinsic disorder (http://www.pondr.com/). The paraganglioma and microcephalic dwarfism missense mutations K299I, R318W, W330R and D333N correspond to mouse DNMT3A residues K295, R314, W326 and D329, respectively. To produce lentivirus, 293 T cells were transfected with the lentiviral vector along with helper plasmids (psPAX2, pVSVG), and supernatant was collected and filtered 48 h later for transduction.
Cell culture and generation of CRISPR-Cas9 edited cell lines.
C3H10T1/2 cells (ATCC) were cultured in Dulbecco’s modified Eagle’s medium (DMEM, Invitrogen) with 10% fetal bovine serum (FBS, Sigma). sgRing1a/b, sgEzh2 and sgDnmt3a cells were generated by transfecting parental cells with sgRNA-containing px458 using Lipofectamine 2000 (Invitrogen) and sorting GFP+ cells after 48 h. Following 1 week of culture, single cells were sorted into 96-well plates. Clones were then expanded and screened for global reduction of H2AK119ub by immunoblot. Transgenic C3H10T1/2 lines expressing epitope-tagged DNMT3A or DNMT3B were generated using lentiviral transduction as described previously2. Transduced cells were grown under G418 selection (1,000 μg ml−1) 48 h after transduction and selected for at least 1 week before being collected for immunoblot, ChIP–seq or RRBS.
Immunoblotting.
Whole-cell lysates were separated by SDS-PAGE, transferred to a polyvinylidenedifluoride (PVDF) membrane, blocked with 5% nonfat milk in PBS containing 0.5% Tween-20 for 1 h at room temperature, probed with primary antibodies at a 1:1,000 dilution overnight at 4 °C and detected with horseradish peroxidase-conjugated anti-rabbit or anti-mouse secondary antibodies at a 1:5,000 dilution (GE Healthcare). Primary antibodies used were: anti-HA (Biolegend, catalog no. 901501), anti-EZH2 (Cell Signaling, catalog no. 5246), anti-RING1 (Cell Signaling, catalog no. 13069), anti-RING1B (Active Motif, catalog no. 39663), anti-H3K27me3 (Cell Signaling, catalog no. 9733), anti-H2AK119ub (Cell Signaling, catalog no. 8240), anti-H3 (Abcam, catalog no. ab1791) and anti-vinculin (Cell Signaling Technology, catalog no. 13901).
dCypher nucleosome binding assays.
Nucleosome interaction assays were carried out as described previously2. Mononucleosomes were assembled from recombinant human histones expressed in Escherichia coli: two copies each of histones H2A, H2B, H3 and H4 (accession numbers: H2A-P04908; H2B-O60814; H3.1-P68431 or H3.2*-Q71DI3 (* when noted contains C110A); H4-P62805) wrapped by 147 base pairs of 601 positioning sequence DNA with a 5’ biotin-triethylene glycol spacer group. All nucleosomes were confirmed by agarose gel electrophoresis/ ethidium bromide staining to have minimal free DNA, and by reducing SDS-PAGE/Coomassie brilliant blue staining to have equal histone stochiometry. Post-translational modifications were confirmed by mass spectrometry (for example, electrospray ionization–time-of-flight) and immunoblotting (if an antibody was available). Then, 5 μl of 250 nM GST-DNMT3Apwwp (Active Motif, catalog no. 32541), GST-DNMT3A1 (Reaction Biology, catalog no. DMT-21–125) or GST-DNMT3B (Reaction Biology, catalog no. DMT-21−126) was incubated with 5 μl of 10 nM biotinylated nucleosomes (EpiCypher, catalog no. 16–9001) for 30 min at room temperature in binding buffer (20 mM Tris pH 7.5, 0.01% bovine serum albumin (BSA), 0.01% NP-40, 0.5 mM dithiothreitol (DTT), (100 mM NaCl for PWWP domain or 250 mM NaCl for full-length proteins) and (1.7 μg ml−1 salmon sperm DNA for recombinant full-length DNMT3A)) in a 384-well plate. A mix of 10 μl of 2.5 μg ml−1 glutathione acceptor beads (PerkinElmer, catalog no. AL109M) and 5 μg ml−1 streptavidin donor beads (PerkinElmer, catalog no. 6760002) was prepared in bead buffer (20 mM Hepes pH 7.5, 0.01% BSA, 0.01% NP-40 and (100 mM NaCl for PWWP domain or 250 mM NaCl for full-length proteins)) and added to each well. The plate was incubated at room temperature in subdued lighting for 60 min and AlphaLISA signal measured on a PerkinElmer 2104 EnVision (680 nm laser excitation, 570 nm emission filter ± 50 nm bandwidth). Each binding interaction was performed in duplicate.
ChIP.
Cross-linking ChIP in MSCs was performed as described previously2 using ~2 × 10⁷ cells per immunoprecipitation. Before fixation, medium was aspirated and cells washed once with PBS. Cells were cross-linked directly on the plate using 1% paraformaldehyde for 5 min at room temperature with gentle shaking. Glycine was added to quench (final concentration 125 mM, incubated for 5 min at room temperature), then cells were washed once with cold PBS, scraped off the plates and pelleted. To obtain a soluble chromatin extract, cells were resuspended in 1 ml LB1 (50 mM HEPES, 140 mM NaCl, 1 mM EDTA, 10% glycerol, 0.5% NP-40, 0.25% Triton X-100 and 1× Complete protease inhibitor) and incubated rotating at 4 °C for 10 min. Samples were centrifuged, resuspended in 1 ml LB2 (10 mM Tris-HCl pH 8.0, 200 mM NaCl, 1 mM EDTA, 0.5 mM EGTA and 1× Compete protease inhibitor), and incubated rotating at 4 °C for 10 min. Finally, samples were centrifuged, resuspended in 1 ml LB3 (10 mM Tris-HCl pH 8.0, 100 mM NaCl, 1 mM EDTA, 0.5 mM EGTA, 0.1% Na deoxycholate, 0.5% N-lauroylsarcosine, 1% Triton X-100 and 1× Complete protease inhibitor) and homogenized by passing two times through a 27-gauge needle. Chromatin extracts were sonicated for 8 min (anti-HA ChIP) or 12 min (anti-histone PTM ChIP) using a Covaris E220 focused ultrasonicator at peak power 140, duty factor 5, and cycles/burst 200. For ChIP of histone post-translational modifications, after centrifugation, samples were spiked with soluble chromatin from Drosophila S2 cells to comprise 2–5% of total chromatin in the lysate. The lysates were incubated with 100 μl Pierce anti-HA beads (Thermo Scientific, catalog no. 88836) or 75 μl protein A Dynabeads (Invitrogen) bound to anti-H2AK119ub (Cell Signaling, catalog no. 8240) or anti-H3K27me3 (Cell Signaling, catalog no. 9733) antibodies at a 1:50 dilution, and incubated overnight at 4 °C with 5% kept as input DNA. Magnetic beads were sequentially washed with low-salt buffer (150 mM NaCl; 0.1% SDS; 1% Triton X-100; 1 mM EDTA and 50 mM Tris-HCl), high salt buffer (500 mM NaCl; 0.1% SDS; 1% Triton X-100; 1 mM EDTA and 50 mM Tris-HCl), LiCl buffer (150 mM LiCl; 0.5% Na deoxycholate; 0.1% SDS; 1% Nonidet P-40; 1 mM EDTA and 50 mM Tris-HCl) and TE buffer (1 mM EDTA and 10 mM Tris-HCl). Beads were resuspended in elution buffer (1% SDS, 50 mM Tris-HCl pH 8.0, 10 mM EDTA and 200 mM NaCl) and incubated for 30 min at 65 °C. After centrifugation, the eluate was reverse cross-linked overnight at 65 °C. The eluate was then treated with RNase A for 1 h at 37 °C and with Proteinase K (Roche) for 1 h at 55 °C and DNA was recovered using a Qiagen PCR purification kit.
ChIP-qPCR and ChIP-seq.
ChIP–qPCR for DNMT3A and DNMT3B domain-swap and deletion mutants was performed using the Applied Biosystems StepOnePlus system with SYBR green dye. Genomic regions of interest were selected based on their amounts of H2AK119ub as determined by ChIP–seq. Fold enrichment for DNMT3A/B binding was determined by dividing the signal (percentage input) at individual H2AK119ub-enriched regions by the averaged signal from several H2AK119ub-depleted negative control regions. ChIP–qPCR primers used for this study are listed in Supplementary Table 1.
For ChIP–seq, library preparation was carried out using KAPA HTP Illumina or KAPA Hyper Prep library preparation reagents according to the manufacturer’s protocol. ChIP–seq libraries were sequenced using Illumina HiSeq 4000 or NovaSeq 6000 at 50-bp single reads or Illumina NovaSeq 6000 at 100-bp single reads. ChIP–seq data for H3K36me2, H3K36me3, DNMT3A1 wild-type, RING1B and H3K27me3 in parental MSCs were obtained from the Gene Expression Omnibus (GEO) database (accession numbers: GSE118785, GSE69291).
Analysis of ChIP-seq data.
Alignment and normalization.
Raw reads were aligned to mouse (UCSC mm10) and Drosophila (UCSC dm6) genome builds using BWA v.0.7.17 (ref. 31) with default parameters. All ChIP–seq samples were normalized relative to matched input DNA and normalized for read depth as described previously32. We define Si and Ni as the read counts in the ith genomic compartment for the ChIP sample and input sample, respectively. Ts and Tn are the total reads for the ChIP and input samples, respectively. We use c to denote a pseudocount (1 for all the analyses presented here), which we use to avoid zeroes in the denominator when normalizing, and in logarithms downstream in the analysis. Normalized signal is then calculated for the ith bin (sinorm) as follows. For analyses comparing real versus expected enrichment, sinorm is computed without taking the logarithm (for example, Extended Data Fig. 2d).
When comparing between samples (parental versus sgRing1a/b cells), ChIP– seq for broad histone marks (H3K27me3, H3K36me2 and H3K36me3) were also normalized using exogeneous (Drosophila) reference chromatin (ChIP–Rx), which enables us to quantitatively compare ChIP–seq enrichment across experiments33. For ChIP–Rx, we calculate ChIP–seq CPM (counts per million mapped reads for a given bin), and multiply that by the ChIP–Rx ratio (denoted Rx) for standardization across samples. We define s as the percentage of reads mapped to the mouse genome in the ChIP sample and sdmel as the percentage of reads mapped to the spiked-in Drosophila genome in the ChIP sample. Similarly, i and idmel are defined for the corresponding input sample. CPM, Rx, and Rx-normalized signal are then calculated as follows:
Depending on the analysis, scores were normalized genome-wide at either 200-bp or 10-kb bin resolution. For aggregate plots and heat maps (for example, Fig. 1c,d), ChIP–seq signal was normalized for 200-bp bins, and then smoothed by taking the mean across five bins. The score in each 200-bp bin therefore describes the mean score more than 1 kb centered at that bin. Normalization was performed using the bamCompare tool from deepTools v.3.3.1 (ref. 34) with appropriate arguments for adding pseudocounts, smoothing, scaling by Rx, TN and Ts, and taking the log2 of the ratio. Read count statistics (TN, Ts, s and i) were obtained using the flagstat tool from samtools v.1.9 (ref. 35). For analyses spanning specific regions such as CGIs (for example, Fig. 1c), smoothed 200-bp scores were mapped onto bed intervals describing the regions of interest using the bedmap–wmean function from BEDOPS v.2.4.37 (ref. 36). For genome-wide analyses (for example, Figs. 1a and 2b), 10-kb normalized ChIP–seq signal was used.
Annotations.
The annotations of RefSeq genes and CGIs for the mm10 genome were downloaded from the University of California, Santa Cruz (UCSC) Table Browser and UCSC genome annotation database. For genic regions, we kept only the longest region (transcriptional start site to transcriptional end site) if several isoforms exist. We considered promoters to be 1 kb region upstream from the transcriptional start site. For analysis of intergenic regions (Extended Data Fig. 1d,e), we took the complement of all genes using the complement tool from bedtools v.2.27.1 (ref. 37), then retained only regions at least 10 kb long. For peak sets contained within, or strictly outside, a second peak set (as used in Extended Data Fig. 2c–e), we used the intersect tool from bedtools with appropriate arguments37.
Enrichment plots.
Genome-wide pairwise correlations (for example, Fig. 1a) were generated using the multiBigwigSummary and plotCorrelation tools from deepTools v.3.3.1 (ref. 34). Enrichment heat maps and aggregate plots (for example, Fig. 1c and Extended Data Fig. 9f) were also generated with deepTools (computeMatrix, plotProfile and plotHeatmap tools).
Tracks.
ChIP–seq coverage tracks (for example, Fig. 1b) were visualized using IGV v.2.4.8 (ref. 38).
Peak calling.
Peaks for H2AK119ub, H3K27me3 and H3K36me2 were called using SICER39—a peak-caller intended for use on broadly distributed marks— with default parameters. Given that we have replicated H2AK119ub ChIP–seq in parental cells, we retained only peaks called in both H2AK119ub parental replicates (n = 16,558). For analyses involving ChIP–seq or RRBS data, only peaks outside blacklist regions were considered (n = 16,064).
Delta values.
‘Delta’ values (Fig. 2b,c and Extended Data Fig. 4b,d,e) represent the difference in log2-normalized score for each 10-kb bin between conditions (sgRing1a/b - parental). Subtracting scores between bedGraph files, plotting and correlation analysis was done using Bash, AWK and R scripts.
Enrichment by annotation.
Enrichment by genomic annotation (for example, Extended Data Fig. 1c) was computed in R using the annotatr package40 and then plotted using geom_bar from ggplot2 (ref. 41).
DNMT3A1 enrichment test.
To test enrichment of DNMT3A1 wild type versus ΔPWWP at CGIs, smoothed histograms of enrichment were generated for normalized ChIP–seq signal at CGIs and an equivalent number of shuffled regions of equal size to CGIs (Extended Data Fig. 3a). These regions were randomly selected genome-wide, excluding blacklist regions, using the shuffle tool from bedtools37.
Overlap analysis.
Number of overlaps between peak sets, most enriched 10-kb bins and CGIs was calculated with the overlap tool from bedtools37. Jaccard indices were calculated using the jaccard tool from bedtools37. To simplify this analysis, only consensus H2AK119ub peaks that are completely disjoint between replicates (n = 14,600) were used.
Partial correlation.
Partial correlation analyses (for example, Extended Data Fig. 2b) were conducted in R using the ppcor package42.
Excluded regions.
All ChIP–seq analyses were restricted to regions outside ENCODE blacklisted regions43. For region-specific analyses, regions overlapping with blacklisted regions were excluded.
RRBS.
Genomic DNA (100 ng) was digested with 100U of MspI (NEB) and end-repaired/A-tailed using Kapa Hyper Prep kit (Kapa Biosystems). After ligation of Illumina-sequencing compatible indexes, DNA was purified using a 1×Agencourt AMPure XP bead clean up (Beckman Coulter). Bisulfite conversion was carried out using the Zymo EZ DNA kit (Zymo Research) using the following program: 55 cycles: 95 °C 30 s, 50 °C 15 min and 4 °C hold. Libraries were amplified 17 cycles using Uracil+Ready mix (Kapa Biosystems, catalog no. KK2801). The resulting libraries, mean size 388 bp, were normalized to 3 nM, pooled and clustered on a pair-end-read flow cell and sequenced for 100 cycles on a NovaSeq 6000 (Illumina). Primary processing of sequencing images was done using Illumina’s Real Time Analysis software (RTA). CASAVA 1.8.2 software was then used to demultiplex samples and generate raw reads and respective quality scores. Analysis of bisulfite treated sequence reads was carried out as described previously44, using CUTADAPT v.1.13 instead of FLEXBAR to remove adapter sequences.
Analysis of RRBS data.
Alignment and normalization.
Raw reads were aligned to the mouse genome (UCSC mm10) using Bismark45. Alignments were merged for each sample’s three replicates. The resulting alignment files were processed using the extract and mergeContext functions from MethylDackel v.0.4.0 (https://github.com/dpryan79/MethylDackel) with options set to calculate methylation for each CpG, keeping only CpGs with a coverage of at least 10x. To compare between samples (all combinations of parental or sgRing1a/b and wild-type, K299I or W330R DNMT3A1), we restricted further analysis to CpGs that meet the 10xcoverage threshold across all samples. We therefore retained 2,310,626 CpGs genome-wide, of the 2,885,240 CpGs represented in at least one of the six RRBS samples (80.08%).
Calling differentially methylated regions.
We called differentially methylated CGIs using Defiant46. We identified 650 hypermethylated CGIs, which we define as CGIs where CpGs gained at least 40% methylation in cells expressing DNMT3A1 W330R compared with cells expressing DNMT3A1 wild type, with false discovery rate <0.01.
Boxplots.
Boxplots of per-CpG methylation scores (for example, Fig. 4b,c) were generated in R using geom_boxplot from ggplot2 (ref. 41). For analysis of CGI methylation, CpGs within CGIs were extracted using the intersect tool from bedtools37.
Excluded regions.
All RRBS analyses were restricted to regions outside ENCODE blacklisted regions43. For region-specific analyses, regions overlapping with blacklisted regions were excluded.
Reporting Summary.
Further information on research design is available in the Nature Research Reporting Summary linked to this article.
Data availability
The ChIP–seq and RRBS data have been deposited in the GEO database under accession number GSE147879. Additional ChIP–seq data from GSE118785 and GSE69291 were also used in this study. Source data are provided with this paper.
Code availability
Custom scripts (R, AWK and Bash) used to compute delta score correlation, generate scatterplots, H3K36me2-ranked intergenic regions, enrichment by genomic annotation and DNMT3A1 enrichment tests are available in the following GitHub repository: https://github.com/pr-gen/dnmt3a_h2ak119ub.
Extended Data
Extended Data Fig. 1 |. Profiling DNMT3A PWWP mutant genomic targeting genome-wide.
a) Genome browser representation of ChIP-seq normalized reads for H3K36me2, H2AK119ub, H3K27me3, and replicates of DNMT3A1 wild-type and DNMT3A1 PWWP mutants in mouse MSCs at chromosome 4: 3.90–3.99 Mb and chromosome 14: 45.1–45.4 Mb. CGIs (green) and genes from the RefSeq database are annotated at the bottom. The shaded areas indicate H2AK119ub-enriched genomic regions. b) Heat map showing genome-wide, pairwise Pearson correlations across 10-kb bins (n = 245,842) between H3K36me2, H3K36me3, H3K27me3, GC content, and RING1B with replicates of H2AK119ub, DNMT3A1 wild-type, and DNMT3A1 PWWP mutants. c) Scatterplots showing genome-wide, pairwise Pearson correlations across 10-kb bins (n = 245,842) for ChIP-seq normalized reads between H3K36me2, H3K36me3, H3K27me3, H2AK119ub, GC content, DNMT3A1 wild-type, DNMT3A1 PWWP mutants, and RING1B. Pearson’s correlation coefficients are indicated. d) Immunoblots of lysates generated from parental and sgDnmt3a mouse MSCs. Vinculin was used as a loading control. Data are representative of two independent experiments. e) Scatterplot showing genome-wide Pearson correlation across 10-kb bins (n = 245,842) for ChIP-seq normalized reads of DNMT3A1 ΔPWWP between parental and sgDnmt3a cells. Pearson’s correlation coefficient is indicated.
Extended Data Fig. 2 |. Disease-associated DNMT3A PWWP mutations alter recruitment to H3K36me2-enriched regions.
a) Genome browser representation of ChIP-seq normalized reads for H3K36me2, H3K36me3, H3K27me3, H2AK119bb, DNMT3A1 wild-type and DNMT3A1 PWWP mutants in mouse MSCs at chromosome 6: 50.9–51.2 Mb. The shaded areas indicate H3K36me2-enriched (orange) and H2AK119ub-enriched (red) genomic regions. b) ChIP-seq normalized reads for DNMT3A1 wild-type (gray) in mouse MSCs relative to H3K36me2 at intergenic regions. Intergenic regions greater than 10-kb (n = 13,990) were ranked and sorted by mean H3K36me2 enrichment in MSCs. The black line indicates mean H3K36me2 enrichment per bin. c) ChIP-seq normalized reads for DNMT3A1 ΔPWWP (orange) in mouse MSCs relative to H3K36me2 at intergenic regions. Intergenic regions greater than 10-kb (n = 13,990) were ranked and sorted by mean H3K36me2 enrichment in MSCs. The black line indicates mean H3K36me2 enrichment per bin. d) Ratio of observed-to-expected ChIP-seq reads for DNMT3A1 wild-type, ΔPWWP, and H2AK119ub in annotated genomic regions. Numbers of expected reads were generated assuming equivalent genomic distribution to input. e) Enrichment heat map depicting ChIP-seq normalized reads centered at H2AK119ub peaks ± 10-kb (n = 16,064), sorted by H3K27me3 levels for H3K36me2, H3K27me3, and GC content with replicates of DNMT3A1 wild-type, DNMT3A1 PWWP mutants, and H2AK119ub.
Extended Data Fig. 3 |. DNMT3A mutants colocalize with H2AK119ub independently of H3K27me3.
a) Genome browser representation of ChIP-seq normalized reads for H2AK119ub, H3K27me3, DNMT3A1 wild-type and DNMT3A1 PWWP mutants in mouse MSCs at chromosome 14: 122.6–123.1 Mb. Genes from the RefSeq database are annotated at the bottom. The shaded areas indicate H3K27me3-enriched (purple) and H2AK119ub-enriched (red) genomic regions. b) Genome-wide partial correlations of ChIP-seq normalized reads across 10-kb bins (n = 245,842) in parental MSCs. Left: relationships between DNMT3A1 PWWP mutants and H2AK119ub after controlling for H3K27me3 and H3K36me2. Right: relationships between DNMT3A1 PWWP mutants and H3K27me3 after controlling for H2AK119ub and H3K36me2. P values of partial correlations were determined using a Student’s t distribution42. c) Enrichment heat map depicting ChIP-seq normalized reads centered at H2AK119ub-depleted H3K27me3 peaks ± 10-kb (n = 34,361) for DNMT3A1 wild-type, DNMT3A1 PWWP mutants, RING1B, H2AK119ub, H3K27me3, H3K36me2, and H3K36me3. Regions are sorted by H3K36me2 enrichment. d) Enrichment heat map depicting ChIP-seq normalized reads centered at H3K27me3-enriched H2AK119ub peaks ± 10-kb (n = 9,868) for DNMT3A1 wild-type, DNMT3A1 PWWP mutants, RING1B, H2AK119ub, H3K27me3, H3K36me2, and H3K36me3. Regions are sorted by H3K36me2 enrichment. e) Enrichment heat map depicting ChIP-seq normalized reads centered at H3K27me3-depleted H2AK119ub peaks ± 10-kb (n = 6,837) for DNMT3A1 wild-type, DNMT3A1 PWWP mutants, RING1B, H2AK119ub, H3K27me3, H3K36me2, and H3K36me3. Regions are sorted by H3K36me2 enrichment.
Extended Data Fig. 4 |. Loss of PWWP reader domain function promotes DNMT3A targeting to CpG islands.
a) Observed DNMT3A1 wild-type and ΔPWWP enrichment at 10-kb bins overlapping CpG islands (n = 16,414) in MSCs compared to expected signal represented by enrichment at randomly-shuffled 10-kb regions (n = 16,414). b) Overlap analysis of H2AK119ub peaks, H3K27me3 peaks, and CpG islands in mouse MSCs. Jaccard index for pairwise comparisons are indicated. c) Overlap analysis of DNMT3A1 wild-type (top 5% of 10-kb bins), DNMT3A ΔPWWP (top 5% of 10-kb bins), and CpG islands in mouse MSCs. Jaccard index for pairwise comparisons are indicated. d) Enrichment heat map depicting ChIP-seq normalized reads centered at CpG islands ± 5-kb for DNMT3A1 wild-type, DNMT3A1 PWWP mutants, RING1B, H2AK119ub, H3K27me3, H3K36me2, and H3K36me3. Regions are sorted by H2AK119ub enrichment.
Extended Data Fig. 5 |. Perturbation of PRC1 and PRC2 in mouse MSCs.
a) Immunoblots of lysates generated from parental, sgRing1a/b, and sgEzh2 mouse MSCs. Vinculin and total H3 were used as loading controls. Data are representative of two independent experiments. b) Ratios of ChIP-seq reads for H2AK119ub and H3K27me3 between target chromatin (mouse) and reference spike-in chromatin (Drosophila) in parental, sgRing1a/b, and sgEzh2 mouse MSCs. c) Absolute number of ChIP-seq peaks for H2AK119ub and H3K27me3 called by SICER2 in parental (first replicate), sgRing1a/b, and sgEzh2 mouse mMSCs. d) Genome browser representation of ChIP-seq normalized reads for H2AK119ub and H3K27me3 in parental, sgRing1a/b, and sgEzh2 mouse MSCs at chromosome 14: 50.05–55.65 Mb and chromosome 3: 108.1–108.3 Mb. CGIs (green) and genes from the RefSeq database are annotated at the bottom. e) Rx-adjusted ratio of observed-to-expected ChIP-seq reads for H2AK119ub in annotated genomic regions in parental, sgRing1a/b, and sgEzh2 cells. Numbers of expected reads were generated assuming equivalent genomic distribution to input. f) Rx-adjusted ratio of observed-to-expected ChIP-seq reads for H3K27me3 in annotated genomic regions in parental, sgRing1a/b, and sgEzh2 cells. Numbers of expected reads were generated assuming equivalent genomic distribution to input.
Extended Data Fig. 6 |. Genetic ablation of PRC1 abrogates recruitment of DNMT3A mutants despite persistence of H3K27me3.
a) Immunoblots of lysates generated from parental and sgRing1a/b mouse MSCs that ectopically express HA-tagged DNMT3A1 PWWP mutants. Vinculin was used as a loading control. Data are representative of two independent experiments. b) Genome-wide partial correlations of ChIP-seq normalized reads across 10-kb bins (n = 245,842) between parental and sgRing1a/b MSCs. Left: relationships between changes in DNMT3A1 PWWP mutants and H2AK119ub after controlling for changes in H3K27me3. Right: relationships between changes in DNMT3A1 PWWP mutants and H3K27me3 after controlling for changes in H2AK119ub. P values of partial correlations were determined using a Student’s t distribution42. c) Genome browser representation of ChIP-seq normalized reads for H2AK119ub, H3K27me3, DNMT3A1 wild-type and DNMT3A1 PWWP mutants in parental and sgRing1a/b mouse MSCs at chromosome 11: 21.96–22.03 Mb and chromosome 16: 57.0–57.2 Mb. CGIs (green) and genes from the RefSeq database are annotated at the bottom. The shaded areas indicate H2AK119Ub-enriched (red) genomic regions. d) Difference in ChIP-seq normalized reads of DNMT3A1 K299I, R318W, W330R, and D333N between parental and sgRing1a/b mouse MSCs relative to that of H2AK119ub for 10-kb non-overlapping bins genome-wide (n = 245,842). Pearson’s correlation coefficient is indicated. e) Difference in ChIP-seq normalized reads of DNMT3A1 K299I, R318W, W330R, and D333N between parental and sgRing1a/b mouse MSCs relative to that of H3K27me3 for CGIs (n = 15,492). Pearson’s correlation coefficient is indicated.
Extended Data Fig. 7 |. DNMT3A recruitment to H2AK119ub-enriched regions remains intact upon genetic ablation of PRC2.
a) Immunoblots of lysates generated from parental and sgEzh2 mouse MSCs that ectopically express HA-tagged DNMT3A1 PWWP mutants. Vinculin was used as a loading control. Data are representative of two independent experiments. b) Enrichment heat map depicting ChIP-seq normalized reads centered at H2AK119ub peaks ± 10-kb (n = 16,064) for DNMT3A1 wild-type, DNMT3A1 PWWP mutants, H2AK119ub, and H3K36me2 in sgEzh2 mouse MSCs. Regions are sorted by increasing H3K36me2 enrichment. c) Genome browser representation of ChIP-seq normalized reads for H2AK119ub, H3K27me3, DNMT3A1 wild-type and DNMT3A1 PWWP mutants in parental and sgEzh2 mouse MSCs at chromosome 2: 150.49–150.64Mb and chromosome 9: 70.58–70.72 Mb. CGIs (green) and genes from the RefSeq database are annotated at the bottom. The shaded areas indicate genomic regions enriched for both H2AK119ub and H3K27me3. d) Violin plots for ChIP-seq normalized reads across 10-kb bins overlapping parental H3K36me2-depleted H2AK119ub peak regions (n = 16,436) of DNMT3A1 wild-type and PWWP mutants in parental (red), sgRing1a/b (green), and sgEzh2 (blue) mouse MSCs. The center line in the embedded boxplots represents the median, the box limits are the 25th and 75th percentiles, and the whiskers are the minimum to maximum values. Outliers beyond 1.5 times the value of the 25th and 75th percentile across all bins are excluded (n = 269 excluded). e) Violin plots for ChIP-seq normalized reads across 10-kb bins overlapping parental H3K36me2-depleted H2AK119ub-enriched CGIs (n = 4,621) of DNMT3A1 wild-type and PWWP mutants in parental (red), sgRing1a/b (green), and sgEzh2 (blue) mouse MSCs. The center line in the embedded boxplots represents the median, the box limits are the 25th and 75th percentiles, and the whiskers are the minimum to maximum values. Outliers beyond 1.5 times the value of the 25th and 75th percentile across all bins are excluded (n = 87 excluded).
Extended Data Fig. 8 |. H2AK119ub interaction potential is specific for DNMT3A and resides within putative N-terminal ubiquitin-dependent recruitment region.
a) AlphaLISA counts for interaction of GST-tagged DNMT3APWWP titrated against modified (as indicated) or unmodified (rNuc) nucleosomes. Data are mean values from replicates and are representative of two independent experiments. b) Schematic of wild-type, deletion, and domain swap mutants of DNMT3A1, DNMT3A2, and DNMT3B. c) Immunoblots of lysates generated from parental mouse MSCs that ectopically express HA-tagged wild-type, deletion, and domain swap mutants of DNMT3A1, DNMT3A2, and DNMT3B. Vinculin was used as a loading control. Data are representative of two independent experiments. d) Fold enrichment of DNMT3A1, DNMT3A2, DNMT3B, and their corresponding deletion mutants at H2AK119ub-enriched regions in mouse MSCs, measured by ChIP-qPCR. Each data point represents signal at an individual locus (n = 6). Bar plots and whiskers are mean ± s.d. Data are representative of two independent experiments. P values were determined by one-way analysis of variance (ANOVA). e) Fold enrichment of DNMT3A1 ΔPWWP and co-deletion mutants of N-terminal disordered (Δ1–159) and ordered (Δ160–219) domains at H2AK119ub-enriched regions in mouse MSCs, measured by ChIP-qPCR. Each data point represents signal at an individual locus (n = 6). Bar plots and whiskers are mean ± s.d. Data are representative of two independent experiments. P values were determined by one-way analysis of variance (ANOVA). f) Enrichment heat map depicting ChIP-seq normalized reads centered at H2AK119ub peaks ± 10-kb (n = 16,064) for DNMT3A1 wild-type, DNMT3A1 ΔPWWP, H2AK119ub, and H3K27me3 in parental mouse MSCs compared to DNMT3A1 wild-type and H2AK119ub in sgNsd1/Nsd2/Setd2 mouse MSCs. Regions are sorted by H2AK119ub enrichment.
Extended Data Fig. 9 |.
DNA methylation landscape changes associated with alterations in DNMT3A recruitment a) Boxplots for CpG methylation genome-wide (n = 2,115,198 CpGs) in parental and sgRing1a/b mouse MSCs expressing DNMT3A1 wild-type (gray), K299I (blue), or W330R (orange). The center line represents the median (indicated), the box limits are the 25th and 75th percentiles, the whiskers are the minimum to maximum values and discrete points represent outliers. b) Boxplots for CpG methylation at CpG islands (n = 718,611 CpGs) in parental and sgRing1a/b mouse MSCs expressing DNMT3A1 wild-type (gray), K299I (blue), or W330R (orange). The center line represents the median (indicated), the box limits are the 25th and 75th percentiles, the whiskers are the minimum to maximum values and discrete points represent outliers. c) Boxplots for CpG methylation outside parental H2AK119ub peak regions (n = 1,727,890 CpGs) in parental and sgRing1a/b mouse MSCs expressing DNMT3A1 wild-type (gray), K299I (blue), or W330R (orange). The center line represents the median (indicated), the box limits are the 25th and 75th percentiles, the whiskers are the minimum to maximum values and discrete points represent outliers. d) Boxplots for CpG methylation at CpG islands outside parental H2AK119ub peak regions (n = 442,516 CpGs) in parental and sgRing1a/b mouse MSCs expressing DNMT3A1 wild-type (gray), K299I (blue), or W330R (orange). The center line represents the median (indicated), the box limits are the 25th and 75th percentiles, the whiskers are the minimum to maximum values and discrete points represent outliers. e) Genome browser representation of ChIP-seq normalized reads for H2AK119ub and Reduced Representation Bisulfite Sequencing (RRBS) data for CpG methylation (black) in parental mouse MSCs expressing either wild-type or W330R DNMT3A1 at chromosome 1: 178,516–178,540 Kb and chromosome 15: 32,244–32,248 Kb. CGIs (green) and genes from the RefSeq database are annotated at the bottom. f) Averaged ChIP-seq Rx-normalized read signal at hypermethylated CpG islands in DNMT3A1 W330R-expressing cells ± 5-kb (n = 3,054, methylation difference >20%, FDR = 0.01), represented as Rx-adjusted CPM for H2AK119ub in parental mouse MSCs compared to cells expressing DNMT3A1 W330R.
Supplementary Material
Acknowledgements
We thank members of the Lu, Majewski and Allis laboratories for critical reading of the manuscript. We thank the Epigenomics Core at Weill Cornell Medicine for generating RRBS libraries, sequencing, data alignment and methylation calls. This research was supported by the United States National Institutes of Health (NIH) grants (P01CA196539 to C.D.A. and J.M.; R00CA212257 to C.L.; T32GM007739 and F30CA224971 to D.N.W.; R44GM116584 and R44GM117683 to M.-C.K.); St. Jude Children’s Research Hospital and the Rockefeller University (to C.D.A.); Genome Canada, Genome Quebec, Canadian Institutes of Health Research, and computational infrastructure from Compute Canada and Calcul Quebec (to J.M.). C.L. is the Giannandrea Family Dale F. Frey Breakthrough Scientist of the Damon Runyon Foundation (DFS-28-18), a Pew-Stewart Scholar for Cancer Research and supported by an AACR Gertrude B. Elion Cancer Research Grant.
Footnotes
Competing interests
M.R.M., I.K.P., Z.B.G. and M.-C.K. declare competing interests. EpiCypher is a commercial developer and supplier of platforms used in this study: recombinant semisynthetic modified nucleosomes and the dCypher nucleosome binding assay. The remaining authors declare no competing interests.
Additional information
Extended data is available for this paper at https://doi.org/10.1038/s41588-021-00856-5.
Supplementary information The online version contains supplementary material available at https://doi.org/10.1038/s41588-021-00856-5.
Peer review information Nature Genetics thanks Alexander Meissner, Albert Jeltsch, Robert Klose and the other, anonymous, reviewer(s) for their contribution to the peer review of this work.
Reprints and permissions information is available at www.nature.com/reprints.
References
- 1.Baubec T et al. Genomic profiling of DNA methyltransferases reveals a role for DNMT3B in genic methylation. Nature 520, 243–247 (2015). [DOI] [PubMed] [Google Scholar]
- 2.Weinberg DN et al. The histone mark H3K36me2 recruits DNMT3A and shapes the intergenic DNA methylation landscape. Nature 573, 281–286 (2019). [DOI] [PMC free article] [PubMed] [Google Scholar]
- 3.Wu H et al. Dnmt3a-dependent nonpromoter DNA methylation facilitates transcription of neurogenic genes. Science 329, 444–448 (2010). [DOI] [PMC free article] [PubMed] [Google Scholar]
- 4.Chen Z, Yin Q, Inoue A, Zhang C & Zhang Y Allelic H3K27me3 to allelic DNA methylation switch maintains noncanonical imprinting in extraembryonic cells. Sci. Adv 5, eaay7246 (2019). [DOI] [PMC free article] [PubMed] [Google Scholar]
- 5.Mohn F et al. Lineage-specific Polycomb targets and de novo DNA methylation define restriction and potential of neuronal progenitors. Mol. Cell 30, 755–766 (2008). [DOI] [PubMed] [Google Scholar]
- 6.Ohm JE et al. A stem cell-like chromatin pattern may predispose tumor suppressor genes to DNA hypermethylation and heritable silencing. Nat. Genet 39, 237–242 (2007). [DOI] [PMC free article] [PubMed] [Google Scholar]
- 7.Schlesinger Y et al. Polycomb-mediated methylation of Lys27 of histone H3 pre-marks genes for de novo methylation in cancer. Nat. Genet 39, 232–236 (2007). [DOI] [PubMed] [Google Scholar]
- 8.Widschwendter M et al. Epigenetic stem cell signature in cancer. Nat. Genet 38, 157–158 (2007). [DOI] [PubMed] [Google Scholar]
- 9.Remacha L et al. Gain-of-function mutations in DNMT3A in patients with paraganglioma. Genet. Med 20, 1644–1651 (2018). [DOI] [PubMed] [Google Scholar]
- 10.Heyn P et al. Gain-of-function DNMT3A mutations cause microcephalic dwarfism and hypermethylation of Polycomb-regulated regions. Nat. Genet. 51, 96–105 (2019). [DOI] [PMC free article] [PubMed] [Google Scholar]
- 11.Dukatz M et al. H3K36me2/3 binding and DNA binding of the DNA methyltransferase DNMT3A PWWP domain both contribute to its chromatin interaction. J. Mol. Biol 431, 5063–5074 (2019). [DOI] [PubMed] [Google Scholar]
- 12.Sendžikaitė G et al. A DNMT3A PWWP mutation leads to methylation of bivalent chromatin and growth retardation in mice. Nat. Commun 10, 1884 (2019). [DOI] [PMC free article] [PubMed] [Google Scholar]
- 13.Chen T, Ueda Y, Xie S & Li E A novel Dnmt3a isoform produced from an alternative promoter localizes to euchromatin and its expression correlates with active de novo methylation. J. Biol. Chem. 277, 38746–38754 (2002). [DOI] [PubMed] [Google Scholar]
- 14.Manzo M et al. Isoform-specific localization of DNMT3A regulates DNA methylation fidelity at bivalent CpG islands. EMBO J. 36, 3421–3434 (2017). [DOI] [PMC free article] [PubMed] [Google Scholar]
- 15.Lu C et al. Histone H3K36 mutations promote sarcomagenesis through altered histone methylation landscape. Science 352, 844–849 (2016). [DOI] [PMC free article] [PubMed] [Google Scholar]
- 16.Tavares L et al. RYBP-PRC1 complexes mediate H2A ubiquitylation at polycomb target sites independently of PRC2 and H3K27me3. Cell 148, 664–678 (2012). [DOI] [PMC free article] [PubMed] [Google Scholar]
- 17.Wu X, Johansen JV & Helin K Fbxl10/Kdm2b recruits polycomb repressive complex 1 to CpG islands and regulates H2A ubiquitylation. Mol. Cell 49, 1134–1146 (2013). [DOI] [PubMed] [Google Scholar]
- 18.Blackledge NP et al. Variant PRC1 complex-dependent H2A ubiquitylation drives PRC2 recruitment and Polycomb domain formation. Cell 157, 1445–1459 (2014). [DOI] [PMC free article] [PubMed] [Google Scholar]
- 19.de Napoles M et al. Polycomb group proteins Ring1A/B link ubiquitylation of histone H2A to heritable gene silencing and X inactivation. Dev. Cell 7, 663–676 (2004). [DOI] [PubMed] [Google Scholar]
- 20.Wang H et al. Role of histone H2A ubiquitination in Polycomb silencing. Nature 431, 873–878 (2004). [DOI] [PubMed] [Google Scholar]
- 21.Margueron R et al. Ezh1 and Ezh2 maintain repressive chromatin through different mechanisms. Mol. Cell. 32, 503–518 (2008). [DOI] [PMC free article] [PubMed] [Google Scholar]
- 22.Cooper S et al. Targeting polycomb to pericentric heterochromatin in embryonic stem cells reveals a role for H2AK119u1 in PRC2 recruitment. Cell Rep. 7, 1456–1470 (2014). [DOI] [PMC free article] [PubMed] [Google Scholar]
- 23.Cooper S et al. Jarid2 binds mono-ubiquitylated H2A lysine 119 to mediate crosstalk between Polycomb complexes PRC1 and PRC2. Nat. Commun 7, 13661 (2016). [DOI] [PMC free article] [PubMed] [Google Scholar]
- 24.Fradet-Turcotte A et al. 53BP1 is a reader of the DNA-damage-induced histone H2A Lys 15 ubiquitin mark. Nature 499, 50–54 (2013). [DOI] [PMC free article] [PubMed] [Google Scholar]
- 25.Wilson MD et al. The structural basis of modified nucleosome recognition by 53BP1. Nature 536, 100–103 (2016). [DOI] [PubMed] [Google Scholar]
- 26.Goldknopf IL & Busch H Isopeptide linkage between nonhistone and histone 2A polypeptides of chromosomal conjugate-protein A24. Proc. Natl Acad. Sci. USA 74, 864–868 (1977). [DOI] [PMC free article] [PubMed] [Google Scholar]
- 27.West MH & Bonner WM Histone 2B can be modified by the attachment of ubiquitin. Nucleic Acids Res. 8, 4671–4680 (1980). [DOI] [PMC free article] [PubMed] [Google Scholar]
- 28.Spencer DH et al. CpG Island hypermethylation mediated by DNMT3A is a consequence of AML progression. Cell 168, 801–816 (2017). [DOI] [PMC free article] [PubMed] [Google Scholar]
- 29.Deplus R et al. Regulation of DNA methylation patterns by CK2-mediated phosphorylation of Dnmt3a. Cell Rep. 8, 743–753 (2014). [DOI] [PubMed] [Google Scholar]
- 30.Kumar D & Lassar AB Fibroblast growth factor maintains chondrogenic potential of limb bud mesenchymal cells by modulating DNMT3A recruitment. Cell Rep. 8, 1419–1431 (2014). [DOI] [PMC free article] [PubMed] [Google Scholar]
References
- 31.Li H & Durbin R Fast and accurate short read alignment with Burrows–Wheeler transform. Bioinformatics 25, 1754–1760 (2009). [DOI] [PMC free article] [PubMed] [Google Scholar]
- 32.Harutyunyan AS et al. H3K27M induces defective chromatin spread of PRC2-mediated repressive H3K27me2/me3 and is essential for glioma tumorigenesis. Nat. Commun 10, 1262 (2019). [DOI] [PMC free article] [PubMed] [Google Scholar]
- 33.Orlando DA et al. Quantitative ChIP–seq normalization reveals global modulation of the epigenome. Cell Rep. 9, 1163–1170 (2014). [DOI] [PubMed] [Google Scholar]
- 34.Ramírez F et al. deepTools2: a next generation web server for deep-sequencing data analysis. Nucleic Acids Res. 44, W160–W165 (2016). [DOI] [PMC free article] [PubMed] [Google Scholar]
- 35.Li H et al. The sequence alignment/map format and SAMtools. Bioinformatics 25, 2078–2079 (2009). [DOI] [PMC free article] [PubMed] [Google Scholar]
- 36.Neph S et al. BEDOPS: high-performance genomic feature operations. Bioinformatics 28, 1919–1920 (2012). [DOI] [PMC free article] [PubMed] [Google Scholar]
- 37.Quinlan AR & Hall IM BEDTools: a flexible suite of utilities for comparing genomic features. Bioinformatics 26, 841–842 (2010). [DOI] [PMC free article] [PubMed] [Google Scholar]
- 38.Robinson JT et al. Integrative genomics viewer. Nat. Biotechnol 29, 24–26 (2011). [DOI] [PMC free article] [PubMed] [Google Scholar]
- 39.Xu S, Grullon S, Ge K & Peng W Spatial clustering for identification of ChIP-enriched regions (SICER) to map regions of histone methylation patterns in embryonic stem cells. Methods Mol. Biol 1150, 97–111 (2014). [DOI] [PMC free article] [PubMed] [Google Scholar]
- 40.Cavalcante RG & Sartor MA annotatr: genomic regions in context. Bioinformatics 33, 2381–2383 (2017). [DOI] [PMC free article] [PubMed] [Google Scholar]
- 41.Wickham H ggplot2: Elegant Graphics for Data Analysis (Springer, 2016). [Google Scholar]
- 42.Kim S ppcor: an R package for a fast calculation to semi-partial correlation coefficients. Commun. Stat. Appl. Methods 22, 665–674 (2015). [DOI] [PMC free article] [PubMed] [Google Scholar]
- 43.Amemiya HM, Kundaje A & Boyle AP The ENCODE blacklist: identification of problematic regions of the genome. Sci. Rep 9, 9354 (2019). [DOI] [PMC free article] [PubMed] [Google Scholar]
- 44.Garrett-Bakelman FE et al. Enhanced reduced representation bisulfite sequencing for assessment of DNA methylation at base pair resolution. J. Vis. Exp 96, e52246 (2015). [DOI] [PMC free article] [PubMed] [Google Scholar]
- 45.Krueger F & Andrews SR Bismark: a flexible aligner and methylation caller for Bisulfite-seq applications. Bioinformatics 27, 1571–1572 (2011). [DOI] [PMC free article] [PubMed] [Google Scholar]
- 46.Condon DE et al. Defiant: (DMRs: easy, fast, identification and ANnoTation) identifies differentially methylated regions from iron-deficient rat hippocampus. BMC Bioinf. 19, 31 (2018). [DOI] [PMC free article] [PubMed] [Google Scholar]
Associated Data
This section collects any data citations, data availability statements, or supplementary materials included in this article.
Supplementary Materials
Data Availability Statement
The ChIP–seq and RRBS data have been deposited in the GEO database under accession number GSE147879. Additional ChIP–seq data from GSE118785 and GSE69291 were also used in this study. Source data are provided with this paper.


