

Summary
The piRNA pathway safeguards genomic integrity by silencing transposable elements (transposons) in the germline. While Piwi is the central piRNA factor, others including Asterix/Gtsf1 have also been demonstrated to be critical for effective silencing. Here, using eCLIP with a custom informatic pipeline, we show that Asterix/Gtsf1 specifically binds tRNAs in cellular contexts. We determined the structure of mouse Gtsf1 by NMR spectroscopy and identified the RNA binding interface on the protein’s first zinc finger, which was corroborated by biochemical analysis as well as cryo-EM structures of Gtsf1 in complex with co-purifying tRNA. Given the known dependence of LTR retrotransposons on tRNAs primers, we suspected then demonstrated that LTR retrotransposons are in fact preferentially de-repressed in Asterix mutants. Together, these findings link Asterix/Gtsf1, tRNAs, and LTR retrotransposon silencing, and suggest that Asterix exploits tRNA dependence to identify transposon transcripts and promote piRNA silencing.
Introduction
To maintain genomic integrity, the activity of mobile genetic elements (transposons) must be repressed. This is particularly important in the germline where transposon silencing, enforced by the Piwi-interacting RNA (piRNA) pathway (Czech and Hannon, 2016; Siomi et al., 2011), affords genetic stability between generations. piRNA silencing is accomplished through interrelated mechanisms that function in distinct cellular compartments. In the cytoplasm, piRNA-directed cleavage leads to post-transcriptional target degradation (Brennecke et al., 2007; Gunawardane et al., 2007). In the nucleus, however, Piwi-piRNA complexes are believed to recognize nascent transposon transcripts, recruit additional factors, and ultimately enforce the deposition of histone H3 lysine 9 trimethylation (H3K9me3) repressive marks (Klenov et al., 2011; Le Thomas et al., 2013; Rozhkov et al., 2013; Sienski et al., 2012).
The results of three, independent, genome-wide screens revealed a number of candidate proteins that are essential for piRNA silencing (Czech et al., 2013; Handler et al., 2013; Muerdter et al., 2013). While many of these factors affected piRNA biogenesis, others had no obvious effect on piRNA levels or composition. This suggests that this second class of factors principally act downstream of piRNA biogenesis most likely either in transcriptional gene silencing (TGS) or in the ping-pong cycle (reviewed in Czech et al. (Czech and Hannon, 2016)).
Recent work on several of these proteins (including, but not limited to, Panoramix (Yu et al., 2015), Nxf2, and Nxt1 (Batki et al., 2019; Fabry et al., 2019; Murano et al., 2019)) has provided a framework for linking the piRNA pathway to deposition of heterochromatic silencing marks. However, many of the molecular and mechanistic underpinnings that govern these connections remain obscure. With this in mind, we endeavored to detail the role of one of the strongest hits in the aforementioned screens, the protein CG3893/Cue110/Asterix/Gtsf1, in piRNA transposon silencing.
In Drosophila, expression of Asterix is largely restricted to the female germline, where it is critical not only to transposon silencing, but also more broadly for ovarian development. There, Asterix localizes to the nucleus and has been shown to interact with Piwi (Donertas et al., 2013; Muerdter et al., 2013; Ohtani et al., 2013). Similarly, gametocyte-specific factor 1 (Gtsf1), the mammalian homolog of Asterix, is involved in retrotransposon suppression and is also important in both oogenesis and spermatogenesis (Krotz et al., 2009; Yoshimura et al., 2018). Reports on the sub-cellular localization of Gtsf1 are mixed, with the most recent findings revealing focal localization in both nuclei and cytoplasmic processing bodies (piP bodies) (Yoshimura et al., 2018).
Asterix and Gtsf1 are small proteins, 167 amino acids in length, predicted to consist of two N-terminal CHHC-type zinc fingers and a disordered C-terminal domain (Fig. 1A). CHHC zinc fingers have only been identified in eukaryotes and there are found in just three protein groups: spliceosomal U11–48K proteins, tRNA methyltransferases, and gametocyte specific factors (such as Asterix/Gtsf1) (Andreeva and Tidow, 2008). In the former two cases, these motifs have been demonstrated to bind RNA (Tidow et al., 2009; Wilkinson et al., 2007).
Figure 1. Structure and RNA binding activity of Asterix/Gtsf1.
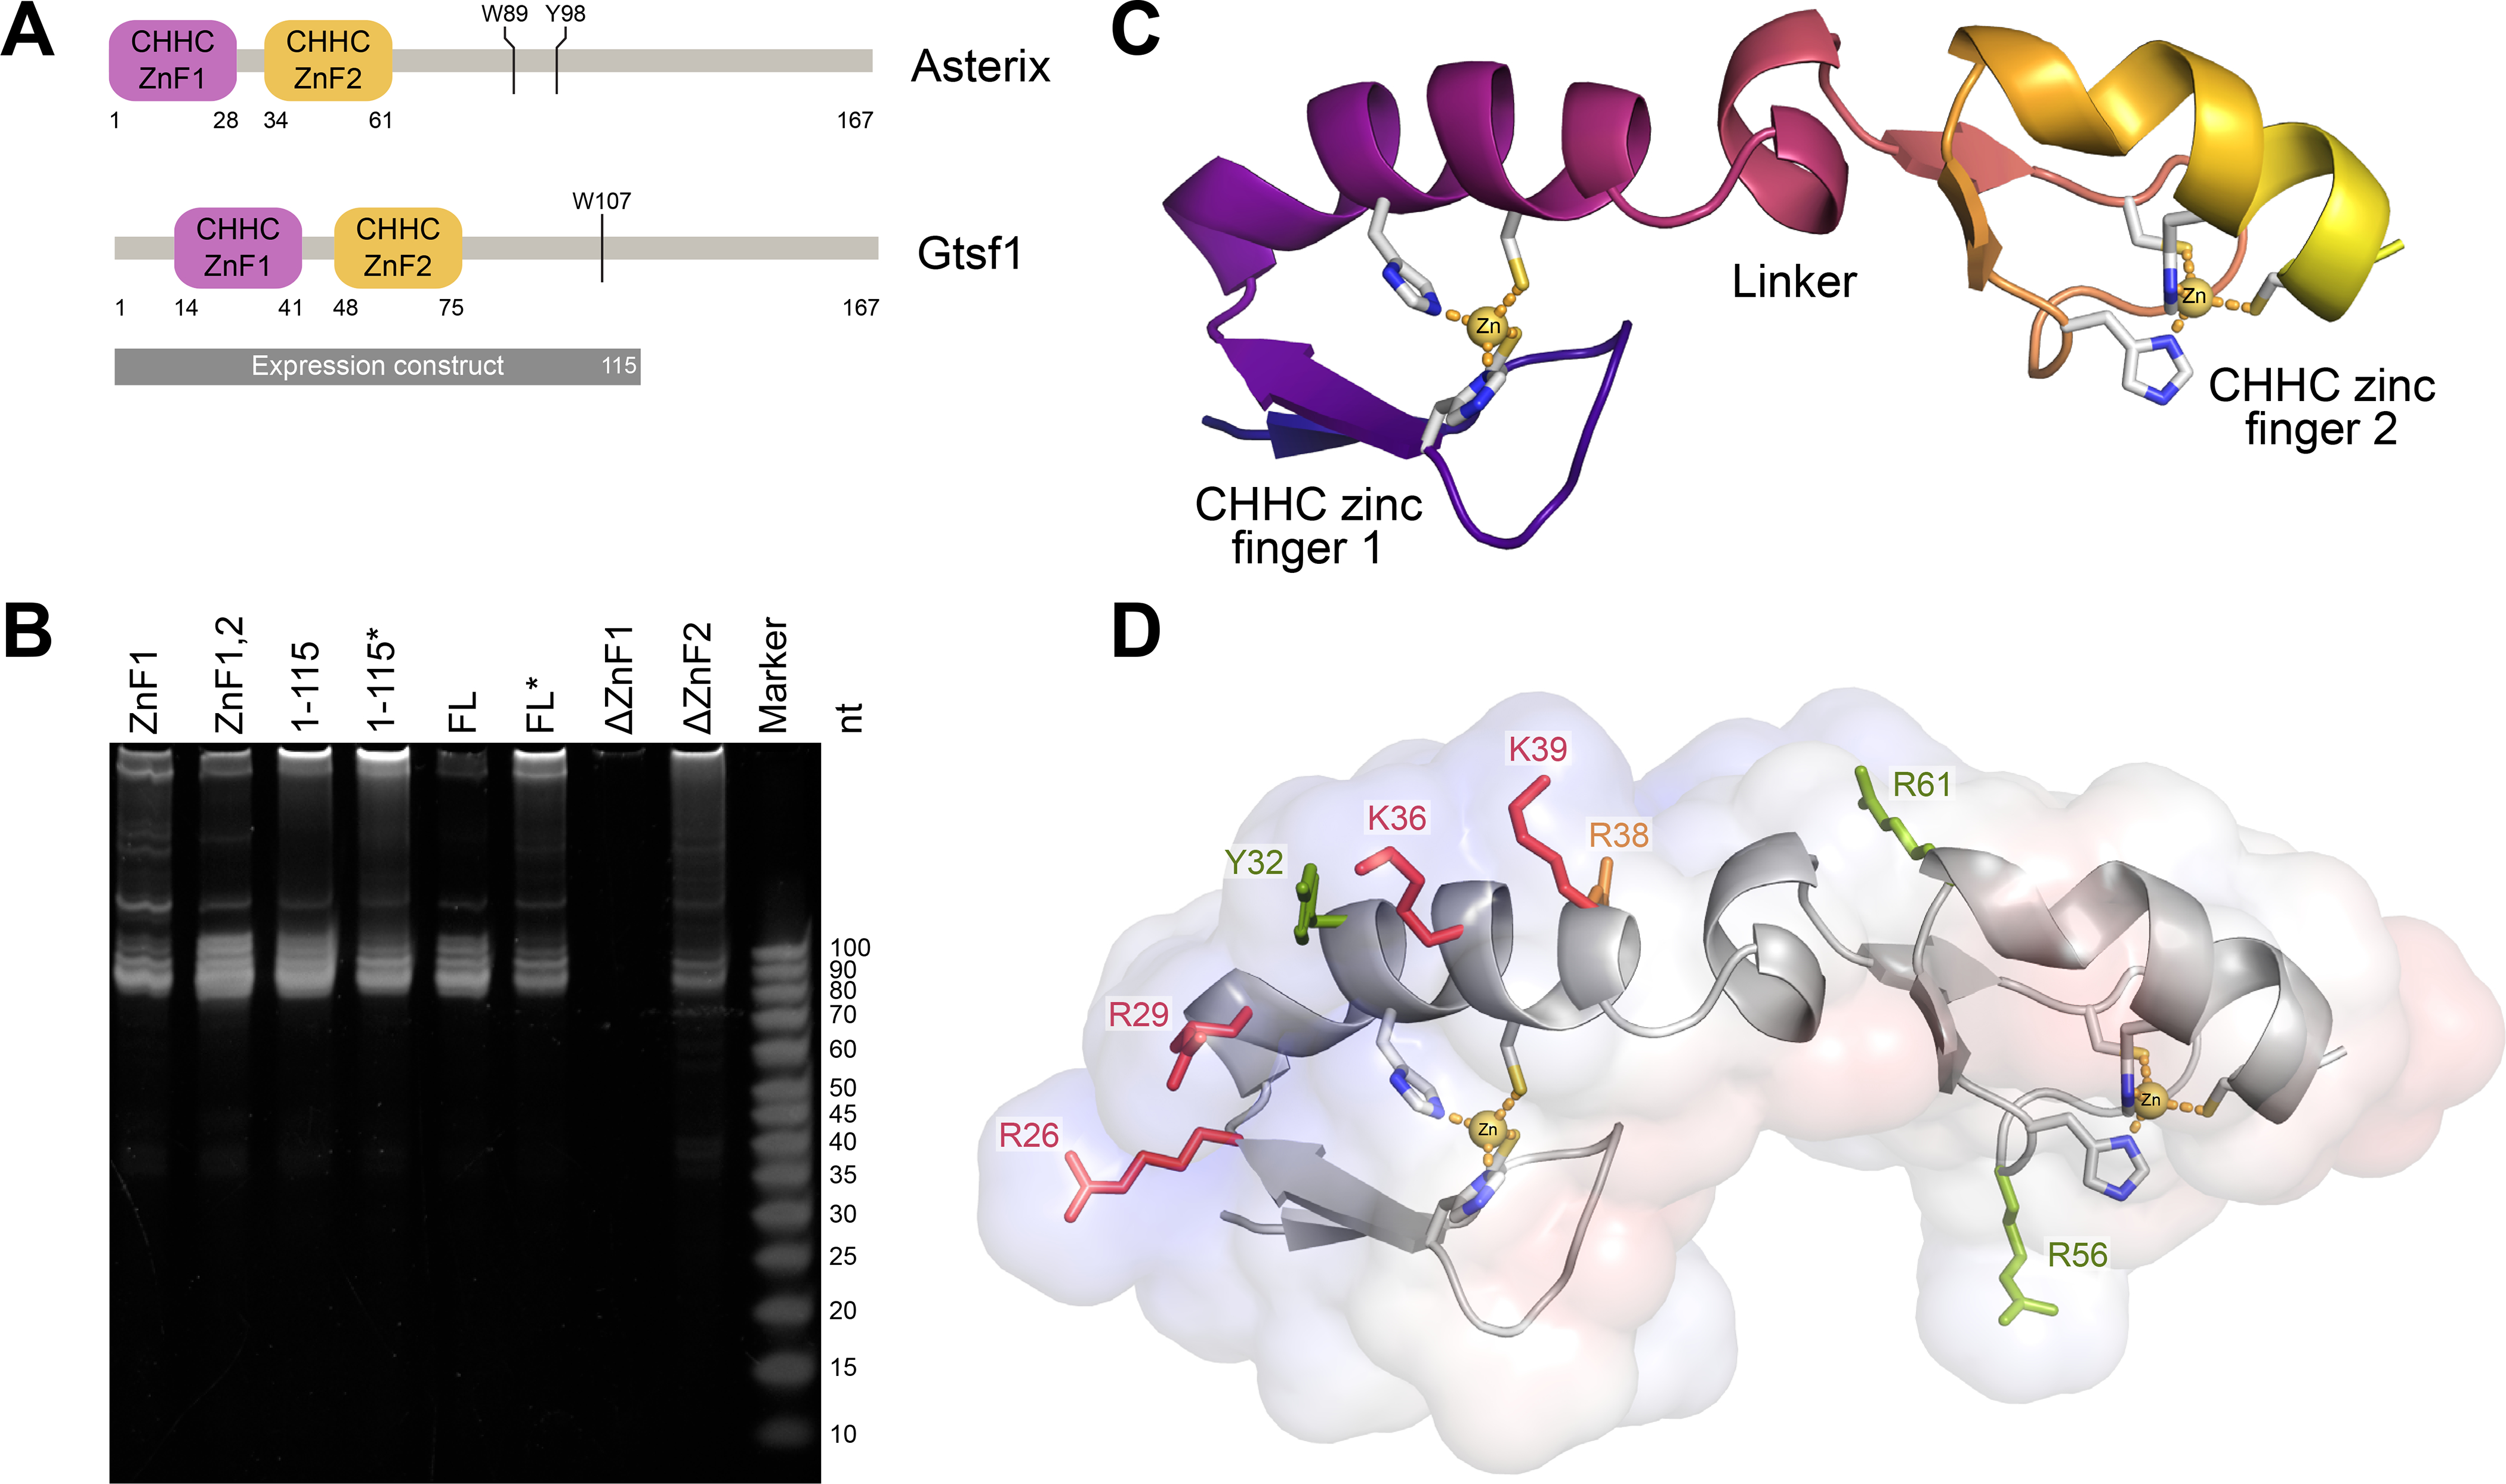
(A) Domain architecture. Asterix/Gtsf1 is comprised of two, N-terminal, CHHC zinc fingers and a C-terminal tail predicted to be intrinsically disordered. Aromatic residues that interact with Piwi proteins are indicated. (B) Urea-PAGE analysis of RNAs that co-purify with Gtsf1 truncation constructs. Domains or amino acid ranges of each recombinantly-expressed mouse Gtsf1 construct are indicated above the corresponding lane. FL denotes full-length protein. Asterisks indicate constructs containing four cysteine to serine point mutations that were included in the NMR construct to limit aggregation. (C) Solution structure of mouse Gtsf1. The lowest energy structure for the protein’s core (residues 13–72) is depicted as a ribbon diagram. Zinc-coordinating residues are shown as sticks with zinc atoms displayed as yellow spheres. (D) Mapping of the RNA-binding interface. The calculated electrostatic surface of mouse Gtsf1 (scaled from −5 kBT in red to +5 kBT in blue) displays a positively-charged ridge on ZnF1. Zinc-coordinating residues and point mutations tested for effects on RNA binding are shown as sticks (red = abolishes binding; orange = hinders binding; green = no effect). See also Supplemental Figures 1–4 and Supplemental Table 1.
To detail the role of Asterix/Gtsf1 in retrotransposon silencing, we implemented a combination of biochemical, structural, cell-based, and informatic analyses. Here, we present biochemical evidence that Asterix/Gtsf1 directly binds RNA. We determined the structure of mouse Gtsf1 using NMR spectroscopy and mapped the RNA binding site through mutational analysis. Using eCLIP and a customized informatic workflow, we demonstrate that Asterix/Gtsf1 preferentially binds to tRNAs in cells. Using cryo-electron microscopy we solved a low-resolution structure of Gtsf1 in complex with tRNA. Together, these findings led us to propose a model of how Asterix uses tRNA biology to effect transposon silencing. Informatic analysis of existing datasets implicated Asterix as particularly relevant in silencing LTR transposons, a transposon class which share an evolutionary history with tRNA.
Results
Asterix/Gtsf1 is an RNA-binding protein
We initiated structural studies with recombinantly-produced mouse Gtsf1 to systematically characterize its molecular role in retrotransposon silencing. During purification from Sf9 cells, we observed that Gtsf1 co-purified with endogenous nucleic acids (Supplemental Fig. 1). These species could be separated by ion exchange chromatography (Supplemental Fig. 1A), resulting in monodisperse and highly-purified protein (Supplemental Fig. 1B–C) in addition to isolated nucleic acids.
When assessed by urea-PAGE (Supplemental Fig. 1D), the nucleic acids displayed a narrow size distribution (~70–90 nucleotides), suggesting that specific ligands were being bound. We hypothesized that this Gtsf1-bound material was RNA by analogy to the ligands of other CHHC zinc fingers proteins’ ligands. Treatment with RNase A or sodium hydroxide degraded this material whereas treatment with DNase I did not, verifying that this was indeed the case (Supplemental Fig. 1E).
To further pinpoint the RNA binding activity of Gtsf1, we created a panel of truncation constructs, similarly expressed each in Sf9, and assessed which of these co-purified with RNA (Fig. 1B). The first CHHC zinc finger (ZnF1) was found to be both necessary and sufficient for the majority of RNA binding (Fig. 1B). Additional inclusion of the second CHHC zinc finger fully recapitulated the RNA size profile as compared of the full-length protein’s pulldown.
Purified RNAs are usually unstable and RNAs of this size are unlikely to be fully protected by a single, 45 amino-acid (~5 kilodalton) protein binding partner such as ZnF1. Thus, this result suggests that the isolated RNAs were structured, affording them some protection from degradation.
Overall structure of Gtsf1
As the zinc finger RNA-binding modules were now of primary interest, we examined a construct of mouse Gtsf1, spanning residues 1 to 115, using NMR spectroscopy (Fig. 1C, Supplemental Figs. 2–3, Supplemental Table 1). In agreement with folding and domain predictions, initial HSQC experiments suggested the protein to contain both ordered and disordered segments (Supplemental Fig. 2A). Subsequent backbone assignment more specifically indicated the structured core of the protein spanned residues 13–73, with residues outside this range tending to be disordered. Analysis of secondary chemical shifts (Supplemental Fig. 2D–E) as well as backbone conformation predictions using TALOS and CSI methods indicated strand-strand-helix architectures for both ZnF1 and ZnF2, similar to that observed for the only other reported CHHC zinc finger structure (Tidow et al., 2009).
Structure determination of residues 1–80 revealed two, tandem, CHHC zinc finger domains (ZnF1, ZnF2) connected by an α-helix-containing linker (Fig. 1C, Supplemental Fig. 3) with the N- and C-termini being intrinsically disordered. In preliminary structure calculations, which did not include restraints for the CHHC residues with zinc, each zinc finger already displayed a strand-strand-helix fold with the appropriate zinc-coordinating residues in proximity to one another.
In the NMR-derived structural ensemble of the twenty, final, lowest energy structures (Supplemental Fig. 3A–C), the relative positions of the zinc finger domains varied somewhat owing to flexibility in the intervening linker. Nonetheless, structure calculations for the individual domains were highly superimposable (Supplemental Fig. 3F–G) with R.M.S.D. values of 0.2 Å for backbone atoms for each zinc finger, further allowing for confident interpretation of each domain’s individual structure. Moreover, these domains were highly superimposable with each other and the only other CHHC zinc finger structure available (from the U11–48K spliceosomal protein (Tidow et al., 2009)) (Supplemental Fig. 3H). Co-evolution analysis (Ovchinnikov et al., 2014) additionally corroborated the overall protein fold, with several intra-ZnF residues displaying evidence of co-evolution (Supplemental Fig. 3E). Final validation of the structural ensemble with Molprobity (Davis et al., 2007) indicated reasonable geometry overall, with the core (residues 13–73) possessing very few violations (Supplemental Table 1).
ZnF1 presents a conserved RNA-binding interface
Guided by the protein structure, we next mapped the RNA-binding interface. Calculation of the electrostatic surface of Gtsf1 revealed a pronounced, positively-charged ridge running the length of ZnF1 (Fig. 1D). Mutagenesis of single basic residues along this patch abrogated or reduced RNA-binding activity with no apparent effects on expression or solubility (Supplemental Fig. 4A, C), indicating that they indeed form part of the RNA-binding interface. Correspondingly, mutations of basic residues on ZnF2 (Fig. 1D, Supplemental Fig. 4B, D) did not affect RNA-binding.
Evolutionary analysis corroborated the importance of ZnF1, with residues important for RNA binding among the most highly conserved in the structure (Supplemental Fig. 3D). Although some key residues—notably in the CHHC metal-coordination site—of ZnF2 were also highly conserved, ZnF2 was more variable overall. Together, these findings bolstered our initial characterization that ZnF1 mediates RNA interactions (Fig. 1B) and precisely identified basic residues in this region as forming a conserved interface for RNA-binding.
Recombinantly-produced Gtsf1 co-purifies with tRNAs
To complement the biochemical characterization of Gtsf1 protein and gain insight into the possible identities of biologically-relevant ligands, we next analyzed the RNAs that were being retained during recombinant expression in Sf9. RNAs that co-purified with mouse Gtsf1 were isolated by phenol:cholorform extraction, ethanol precipitated, then subjected to size-selection and next-generation sequencing.
Consistent with the previous observation that the bound RNAs were approximately 70–90 nucleotides in size, we found considerable enrichment of tRNAs in the Gtsf1 pull-down compared to size-matched controls (Supplemental Table 2). This enrichment was readily apparent, even though the Sf9 genome is not fully annotated, as approximately 15% of the sequencing library was comprised of a single tRNA species. Moreover, each of the twenty most abundant sequences were determined to be tRNA-derived, with 50% of all library reads corresponding to these twenty sequences.
Enrichment of tRNA sequences contrasted with size-matched controls from extracted Sf9 total RNAs where the top sequence was derived from the highly abundant large ribosomal subunit yet nonetheless made up only ~4% of the library. The top tRNA read in the size-matched control only contributed approximately 0.3% of the total reads.
Gtsf1 directly binds tRNAs in cellular contexts
To catalogue RNAs interacting directly with Gtsf1 in a mammalian cellular context, we employed eCLIP (Van Nostrand et al., 2016). Strep-tagged Gtsf1 was transfected into a mouse embryonal teratoma cell line (P19), bound RNAs were covalently linked using UV-crosslinking, the complexes isolated by affinity purification, and the RNA subjected to next-generation sequencing.
Many classes of RNA—such as rRNAs, tRNAs, and highly repetitive genetic elements like transposons—are typically excluded from downstream analysis due to ambiguity in read mapping and/or their high abundance. Given the relevance of these gene classes in the context of Asterix/Gtsf1, we therefore developed a custom bioinformatic workflow to ensure their inclusion. Read mapping was performed allowing for multimapping with up to 50 genomic sites per read (Dobin et al., 2013). Various sources of well-curated gene annotations (including gencode (Frankish et al., 2019), miRBase (Kozomara et al., 2019), tRNAdb (Chan and Lowe, 2016), piRNAclusterdb (Rosenkranz, 2016), and TEtranscripts (Jin et al., 2015)) were integrated for customized annotation calling. We sequentially filtered each read into a single annotation class based on known biological abundance of that class. Subsequently, the enrichment for a given gene or annotation class was determined, first by subtracting levels in a background (non-crosslinked) pull-down, then by comparing to input read counts, with multi-mapping reads being 1/n-normalized across genes within the assigned annotation class.
Analysis of these data by annotation category displayed a substantial enrichment of tRNAs (Fig. 2A) and when analyzed as a distribution of fold enrichments for individual genes in each annotation class (i.e. per locus), we again found a preponderance of tRNA enrichment (Fig. 2B). Inspection of the tRNA reads revealed widespread coverage across the tRNA body, suggesting that full-length (or nearly full-length) tRNAs were being bound. Although some variability was observed in the degree of enrichment across different tRNAs, in contrast with the Sf9 pull-downs, no particular tRNA or set of tRNAs was selected preferentially based on the anticodon (Fig. 2C).
Figure 2. Asterix/Gtsf1 specifically and directly binds tRNAs in cellular contexts.
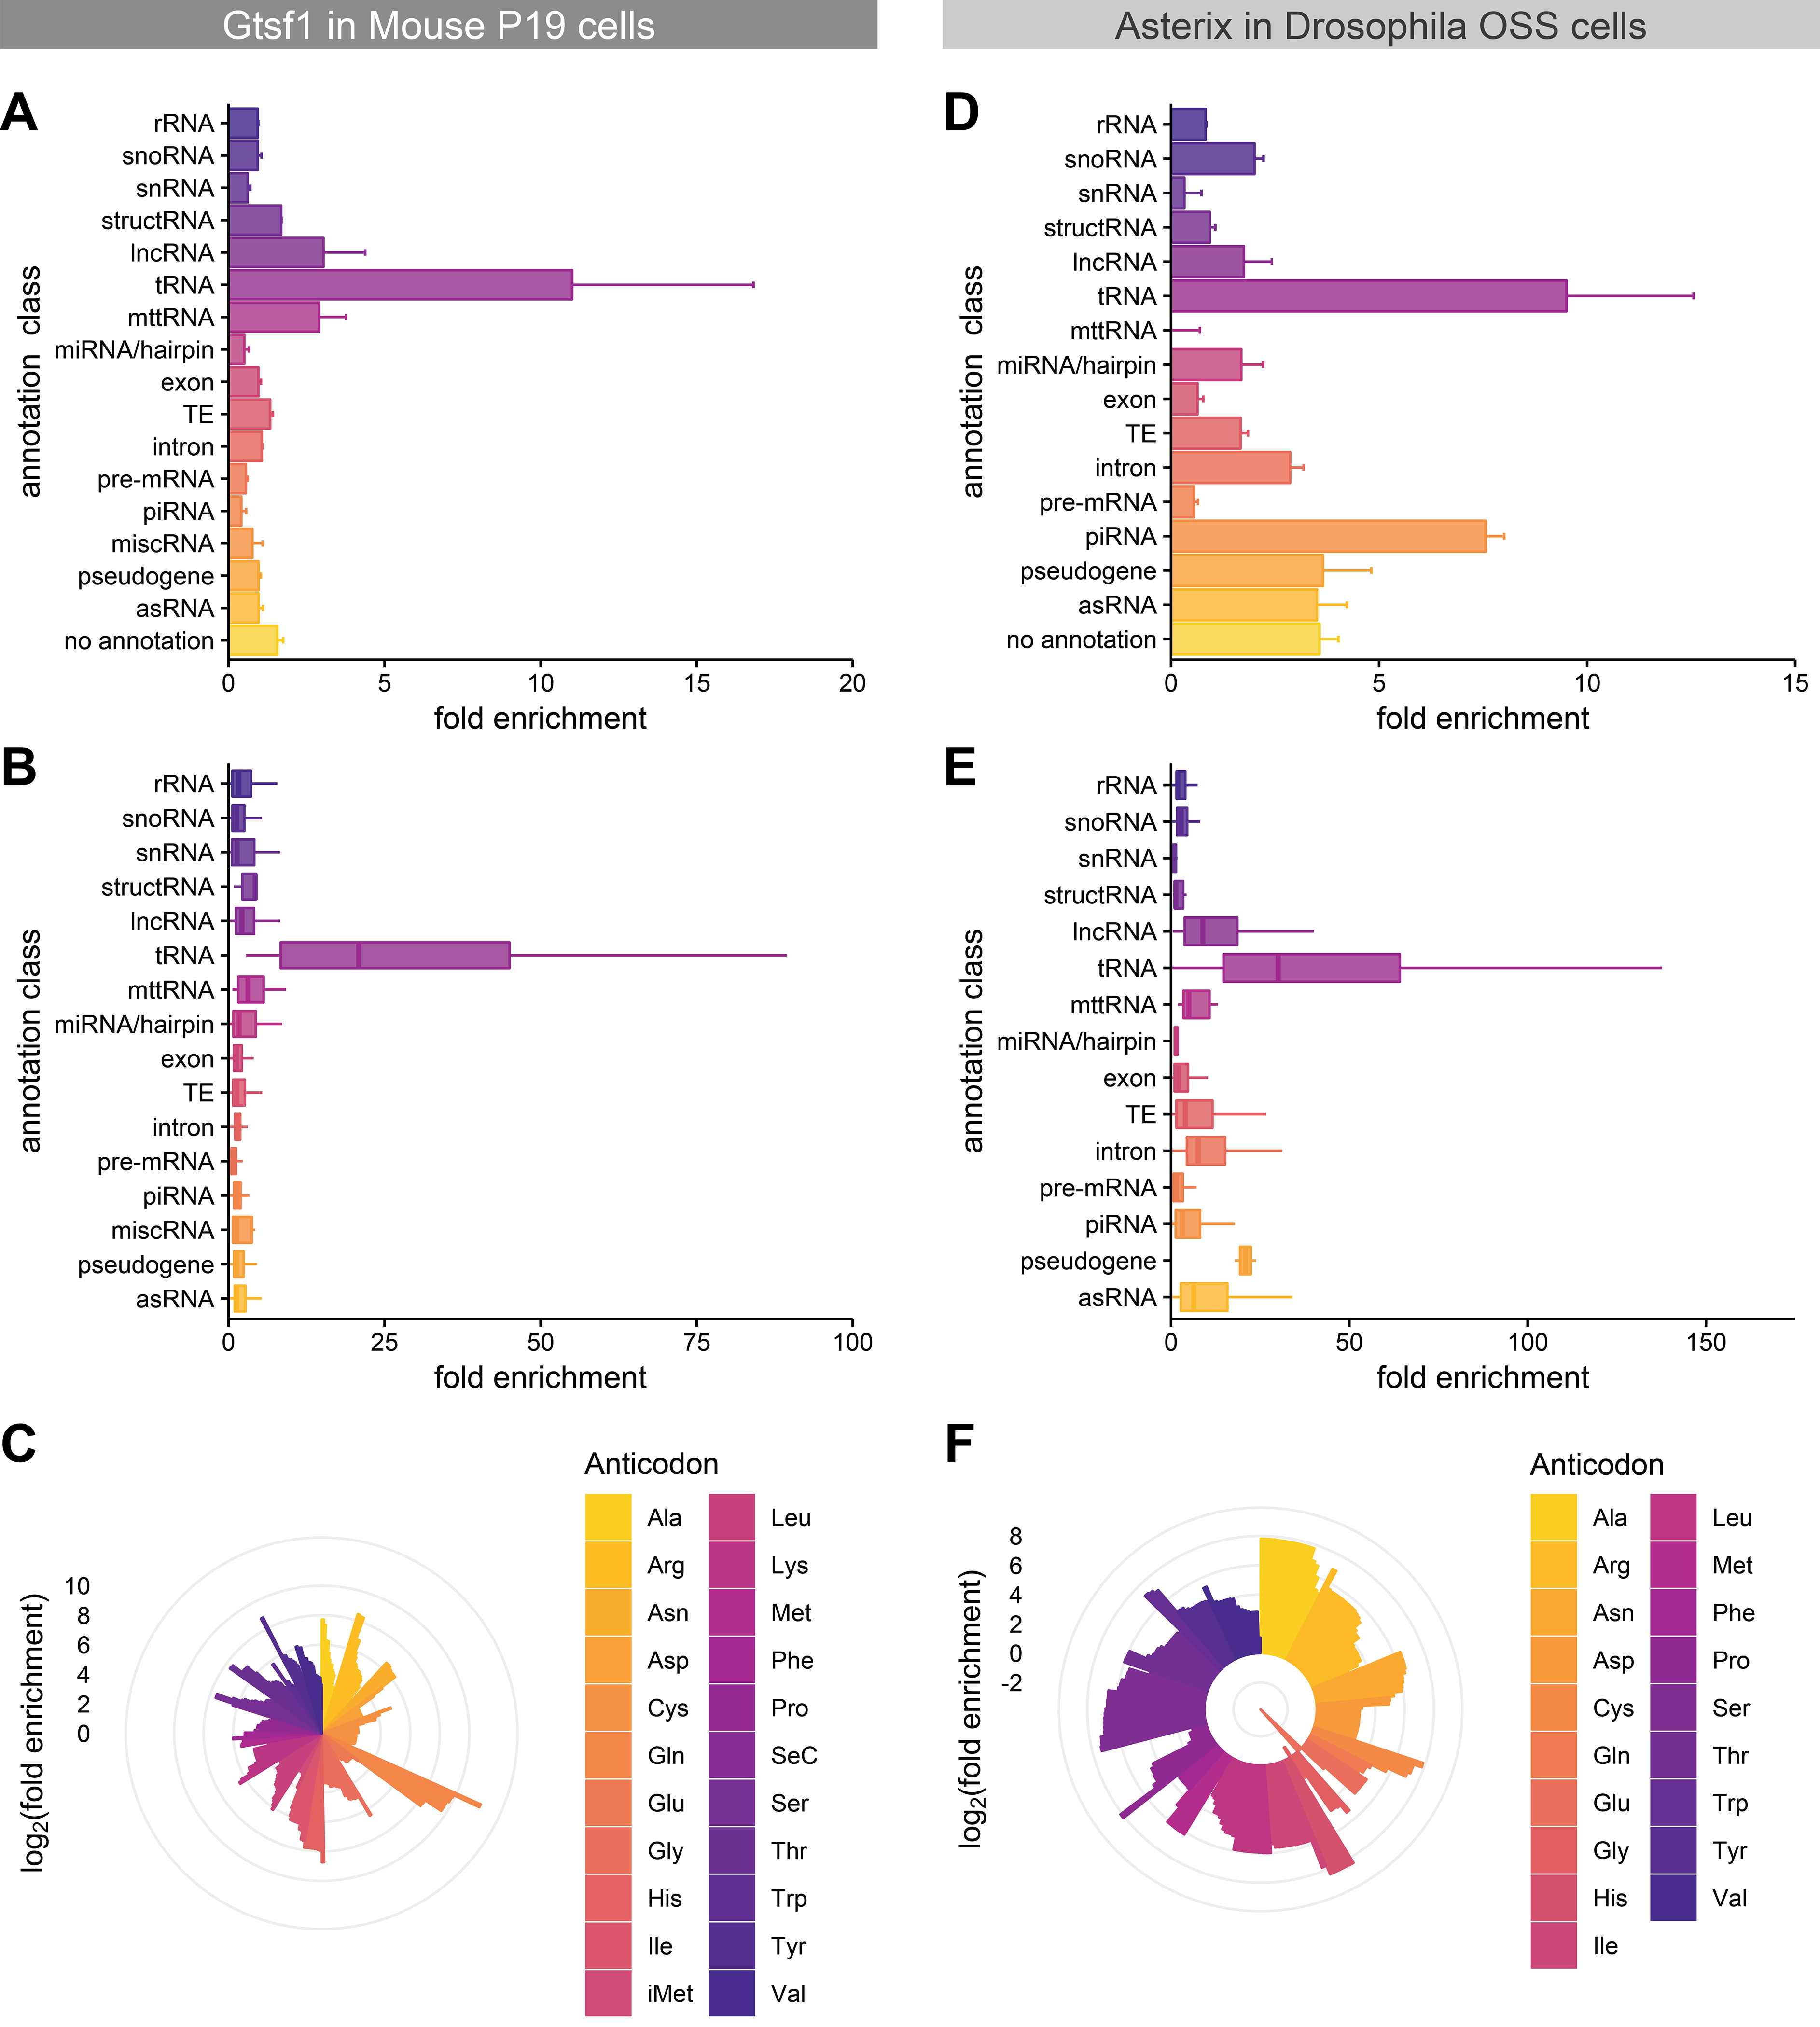
(A, D) Gene class enrichment of Asterix/Gtsf1-bound RNAs. The fold enrichment of each annotation class in eCLIP experiments for (A) mouse Gtsf1 in P19 cells and (D) Drosophila Asterix in OSS cells is shown as a bar chart. Values indicate the average fold enrichment for two replicate libraries. Error bars indicate the standard error. (B, E) Annotation enrichment distribution plots. Fold enrichment distributions among gene annotations within each class are displayed as box plots for (B) P19 mouse and (E) Drosophila OSS eCLIP experiments. (C, F) Fold enrichment scores per tRNA, sorted by anticodon. tRNA enrichment for (C) P19 mouse and (F) Drosophila OSS eCLIP experiments plotted as log2(fold enrichment) on the radial bar graph. Multiple bars of the same colors indicate distinct gene annotations for that anti-codon. See also Supplemental Figures 5–6.
We repeated the informatic analysis to test the robustness of these results (Supplemental Fig. 5). We disfavored tRNA enrichment by setting tRNAs as lowest priority in our annotation ranking (Supplemental Fig. 5B). Additionally, we developed a complementary informatic pipeline that built an alternative gene model to accommodate multimapping reads and then used tools such as DESeq2 (Love et al., 2014) to quantify enrichment (Supplemental Fig. 5C). While the absolute strength of the enrichment signals did vary among these analyses, each of these workflows supported the conclusion that tRNAs were the most enriched annotation class.
Asterix directly binds tRNAs in a Drosophila OSS cells
To date, the most productive model organism for dissecting piRNA biology has been Drosophila melanogaster, especially given the availability of an ovary-derived cell culture line (ovarian somatic sheath cells; OSS) with an intact primary piRNA silencing pathway. Indeed, the requirement of Asterix for effective transposon silencing in Drosophila was discovered in OSS cells (Czech et al., 2013; Handler et al., 2013; Muerdter et al., 2013).
Therefore, to compare our observations from mouse Gtsf1 to Drosophila Asterix and establish a framework for better cross-referencing observations between mammals and flies, we similarly performed eCLIP experiments in OSS using transfected, Strep-tagged Asterix. Once more, tRNAs were found to be highly enriched both as a class and individually (Fig. 2C–E).
Finally, to verify that these findings were not due to over-expression artefacts, we performed eCLIP experiments using FLAG-tagged Asterix under the control of its endogenous promoter. Again, tRNAs were enriched both individually and as a class (Supplemental Fig. 6). Interestingly, some piRNA enrichment was also observed in this experiment, however, unlike tRNAs, this was not found as universally across piRNA annotations. This observation may be explained by Asterix’s known association with piRISC complexes (Muerdter et al., 2013; Ohtani et al., 2013; Yoshimura et al., 2009) coupled with a preponderance of basic residues in the protein’s C-terminal, Piwi-interacting tail that are absent in the mammalian ortholog.
Gtsf1 binds tRNAs in the D-arm
To gain insight into the interaction between tRNA and Gtsf1, we further scrutinized the eCLIP data. In eCLIP, a pileup of read ends is expected at the cross-linking site, presumably due to interference from the crosslink with reverse transcription during preparation of the library. Analysis of library 5’ ends can thus be used to inform potential sequence motifs that are specifically engaged with the crosslinked protein.
An initial analysis of genomic sequences in the vicinity of library 5’ ends did not reveal obvious binding motifs. With the apparent preference for tRNAs as a Gtsf1 ligand, and recognizing that tRNAs are highly structured, we hypothesized that RNA-binding by Gtsf1 could be driven by structural determinants perhaps more so than by RNA sequence.
To test this, the 5’-end positions of mapped tRNA reads were plotted as a histogram on a model tRNA 73 nucleotides in length (not including the CCA-tail) and scored according fold enrichment weighted by Z-score (Fig. 3A). Using the analysis which retained the most tRNA reads, we were able to identify two high-scoring sites at nucleotides 18 and 22 in the D-arm (Fig. 3B).
Figure 3. Structure of mouse Gtsf1 in complex with tRNA.
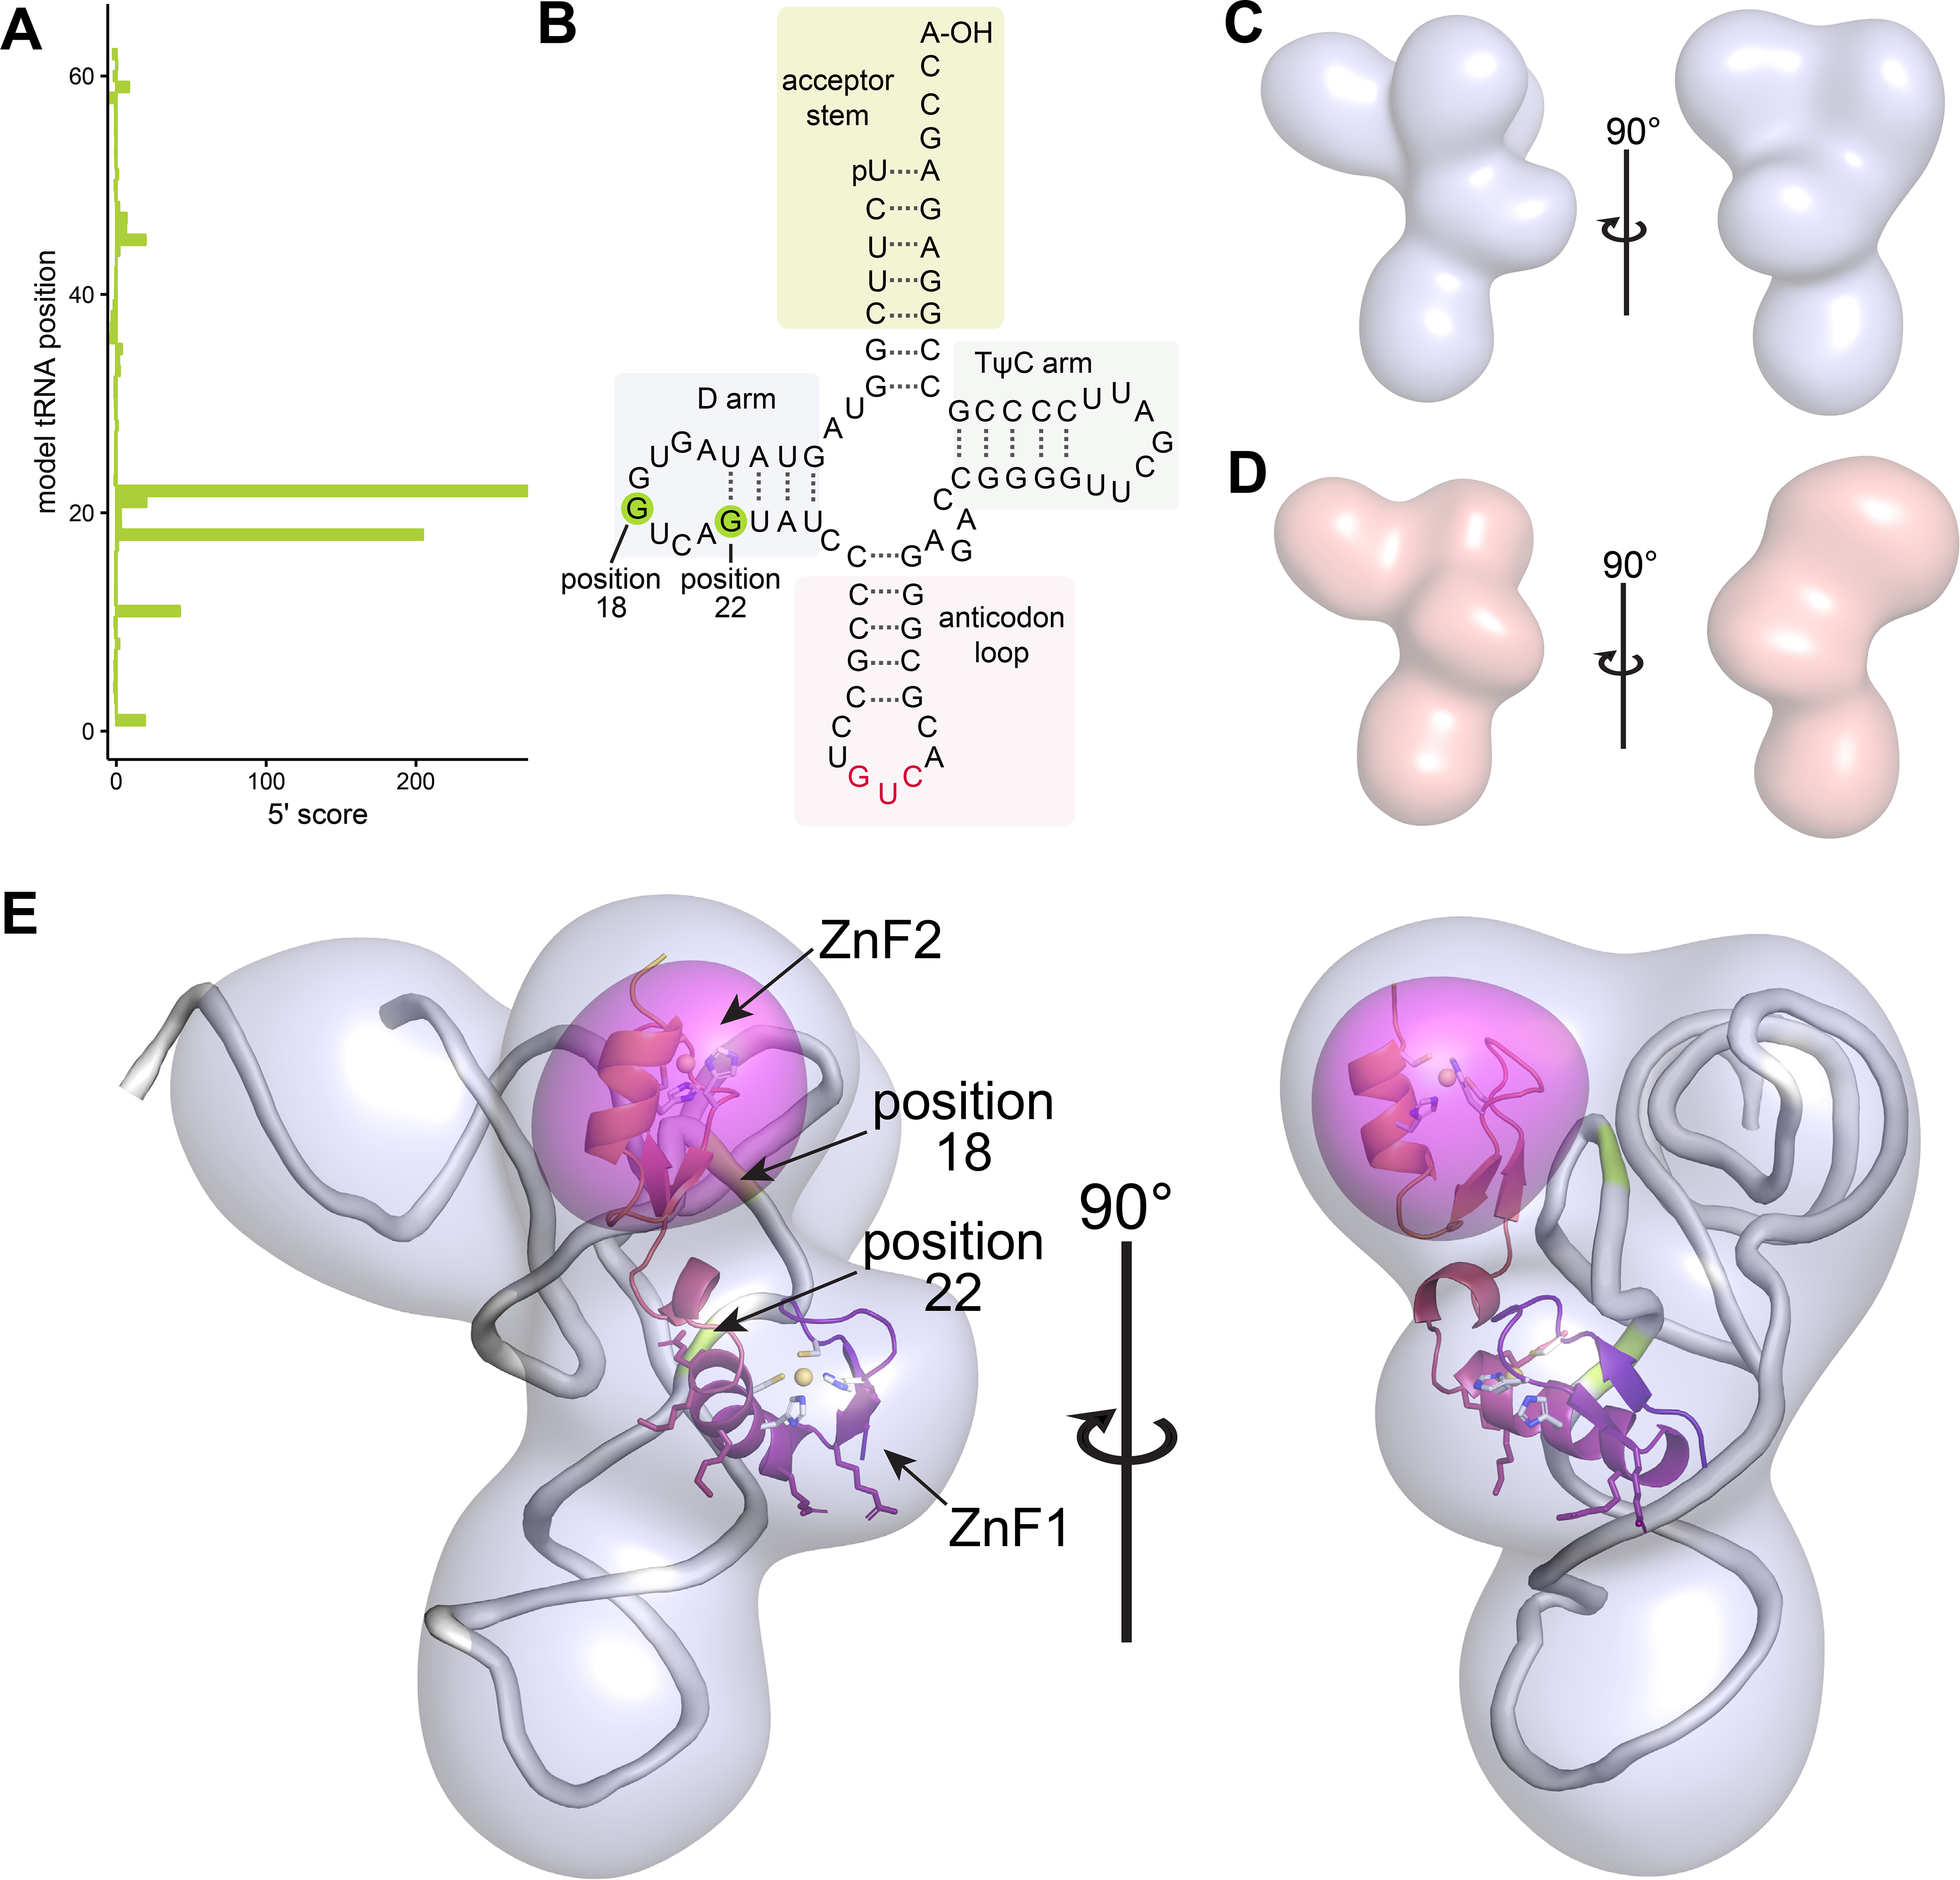
(A, B) Mapping of favored RNA crosslinking sites. (A) Analysis of tRNA reads indicates two preferred cross-linking sites that correspond to nucleotides 18 and 22 of a model tRNA. (B) These sites are in the tRNA D arm and are highlighted (green) on a tRNA secondary structure diagram. (C, D) Cryo-EM maps of mouse Gtsf1 bound to co-purifying tRNA. (C) EM density map of full-length MmGtsf1 in the presence of co-purifying RNA. The map is filtered to 10 Å and displayed with a 3.2σ cutoff. (D) cryo-EM map of a truncation construct of MmGtsf1 (only the first zinc finger; residues 1–45) in the presence of co-purifying RNA. Filtered to 10 Å and displayed with a 1.4σ cutoff, this map shows a very similar shape to that observed in (c), but lacking one lobe of the structure. (E) Difference map and structure. The full-length reconstruction (light blue) is shown with modelled tRNA (grey), the Gtsf1 NMR structure (core residues 13–72; colored as in Fig. 1C), and the difference map calculated from reconstructions (C) and (D) (pink surface; contoured at 5.8σ). Positions of favored tRNA crosslinking are highlighted in green and labelled. Residues of ZnF1 which are important for binding are shown as sticks, colored according to their position in the ribbon diagram. This alignment accommodates both molecules within the full-length reconstruction, positions the RNA-binding residues of MmGtsf1 ZnF1 near to the tRNA, places the most highly crosslinked RNA residues at the protein interaction surface, and identifies the placement of ZnF2. See also Supplemental Figure 7.
Structure of Gtsf1 in complex with tRNA
Having characterized both Gtsf1 and its RNA ligands in several contexts, we next aimed to determine a structure of the protein-RNA complex. Initial NMR experiments on Gtsf1 reconstituted with RNA ligands showed evidence of binding, but were hampered by poor quality spectra which likely resulted from slow tumbling of the complex. Attempts at crystallization met with similar difficulties, presumably due to the inherent flexibility present in the protein structure. Although the molecular weight for the complex is a mere ~45 kDa (19 kDa for Gtsf1 and 25 kDa for a typical tRNA), we speculated that the density of the bound RNA nevertheless could allow for structure determination using cryo-electron microscopy (cryo-EM).
We subjected recombinantly expressed mouse Gtsf1 from Sf9 cells, which as mentioned co-purifies with endogenous RNA, to cryo-EM. Given the relatively small size of this complex, the presence of disordered regions in the protein, and the fact that the sample included a heterogeneous population of RNAs, we opted to image this material at 200 keV (rather than the customary 300 keV) to increase contrast and aid in particle picking. Nearly 5,000 micrographs were collected and resulted in almost 500,000 particles (see Methods).
From these data, we were able to obtain a low-resolution reconstruction (Fig. 3C, Supplemental Fig. 7A–B) which had the dimensions and shape of a tRNA with two additional domains. To more accurately orient the Gtsf1 structure into the reconstruction, we applied a similar workflow to an even smaller complex, comprising only ZnF1 in complex with co-purifying RNAs (estimated total molecular weight of 31 kDa) (Fig. 3D, Supplemental Fig. 7C). By comparing the two reconstructions, we were able to generate a difference map to unambiguously deduce the location of ZnF2 (Fig. 3E, fuchsia surface).
Ultimately, we were able to place tRNA and the zinc finger domains of mouse Gtsf1 into the cryo-EM map, with little residual density, resulting in a low-resolution structure of the complex. Consistent with the biochemical analysis, ZnF1, the domain primarily responsible for binding RNA, formed an interface with most probable crosslinking tRNA nucleotides. The second zinc finger extended toward the tRNA acceptor stem.
Asterix knockout predominantly affects LTR-class transposons
To understand how binding of Asterix/Gtsf1 to tRNA might be involved in piRNA silencing and repression of transposon expression, we noted that certain groups of retroviruses and retrotransposons require host tRNAs as primers for their replication by reverse transcription (Martinez, 2017; Schorn et al., 2017). Such retrotransposons belong to the LTR (long terminal repeat) family and are characterized by the presence of repeated DNA sequences that flank the transposon body.
In order to transpose, LTR transposon transcripts must be reverse-transcribed. The reverse transcriptase enzyme requires priming, which is most often accomplished using host tRNAs recognizing a primer binding site (PBS) immediately downstream of the 5’ LTR. This dependence on host tRNA recognition thus makes the PBS a conspicuous feature of LTR transposons, which can indeed be exploited for LTR recognition, as has been shown with tRNA fragments (Schorn et al., 2017; Schorn and Martienssen, 2018).
We reasoned that if Asterix/Gtsf1 is indeed using tRNAs to recognize LTR transposon transcripts, then this class of transposons should be highly affected by Asterix/Gtsf1 knockdown. Re-analysis of RNA sequencing data from Asterix knockout flies (Muerdter et al., 2013) supported this finding and indicated that both in absolute read counts and in distributions of fold changes among loci, LTR retrotransposons were indeed the most affected transposon class (Fig. 4A–B).
Figure 4. LTR transposons (a class that relies on tRNAs for retrotransposition), are preferentially de-repressed upon Asterix knockout.
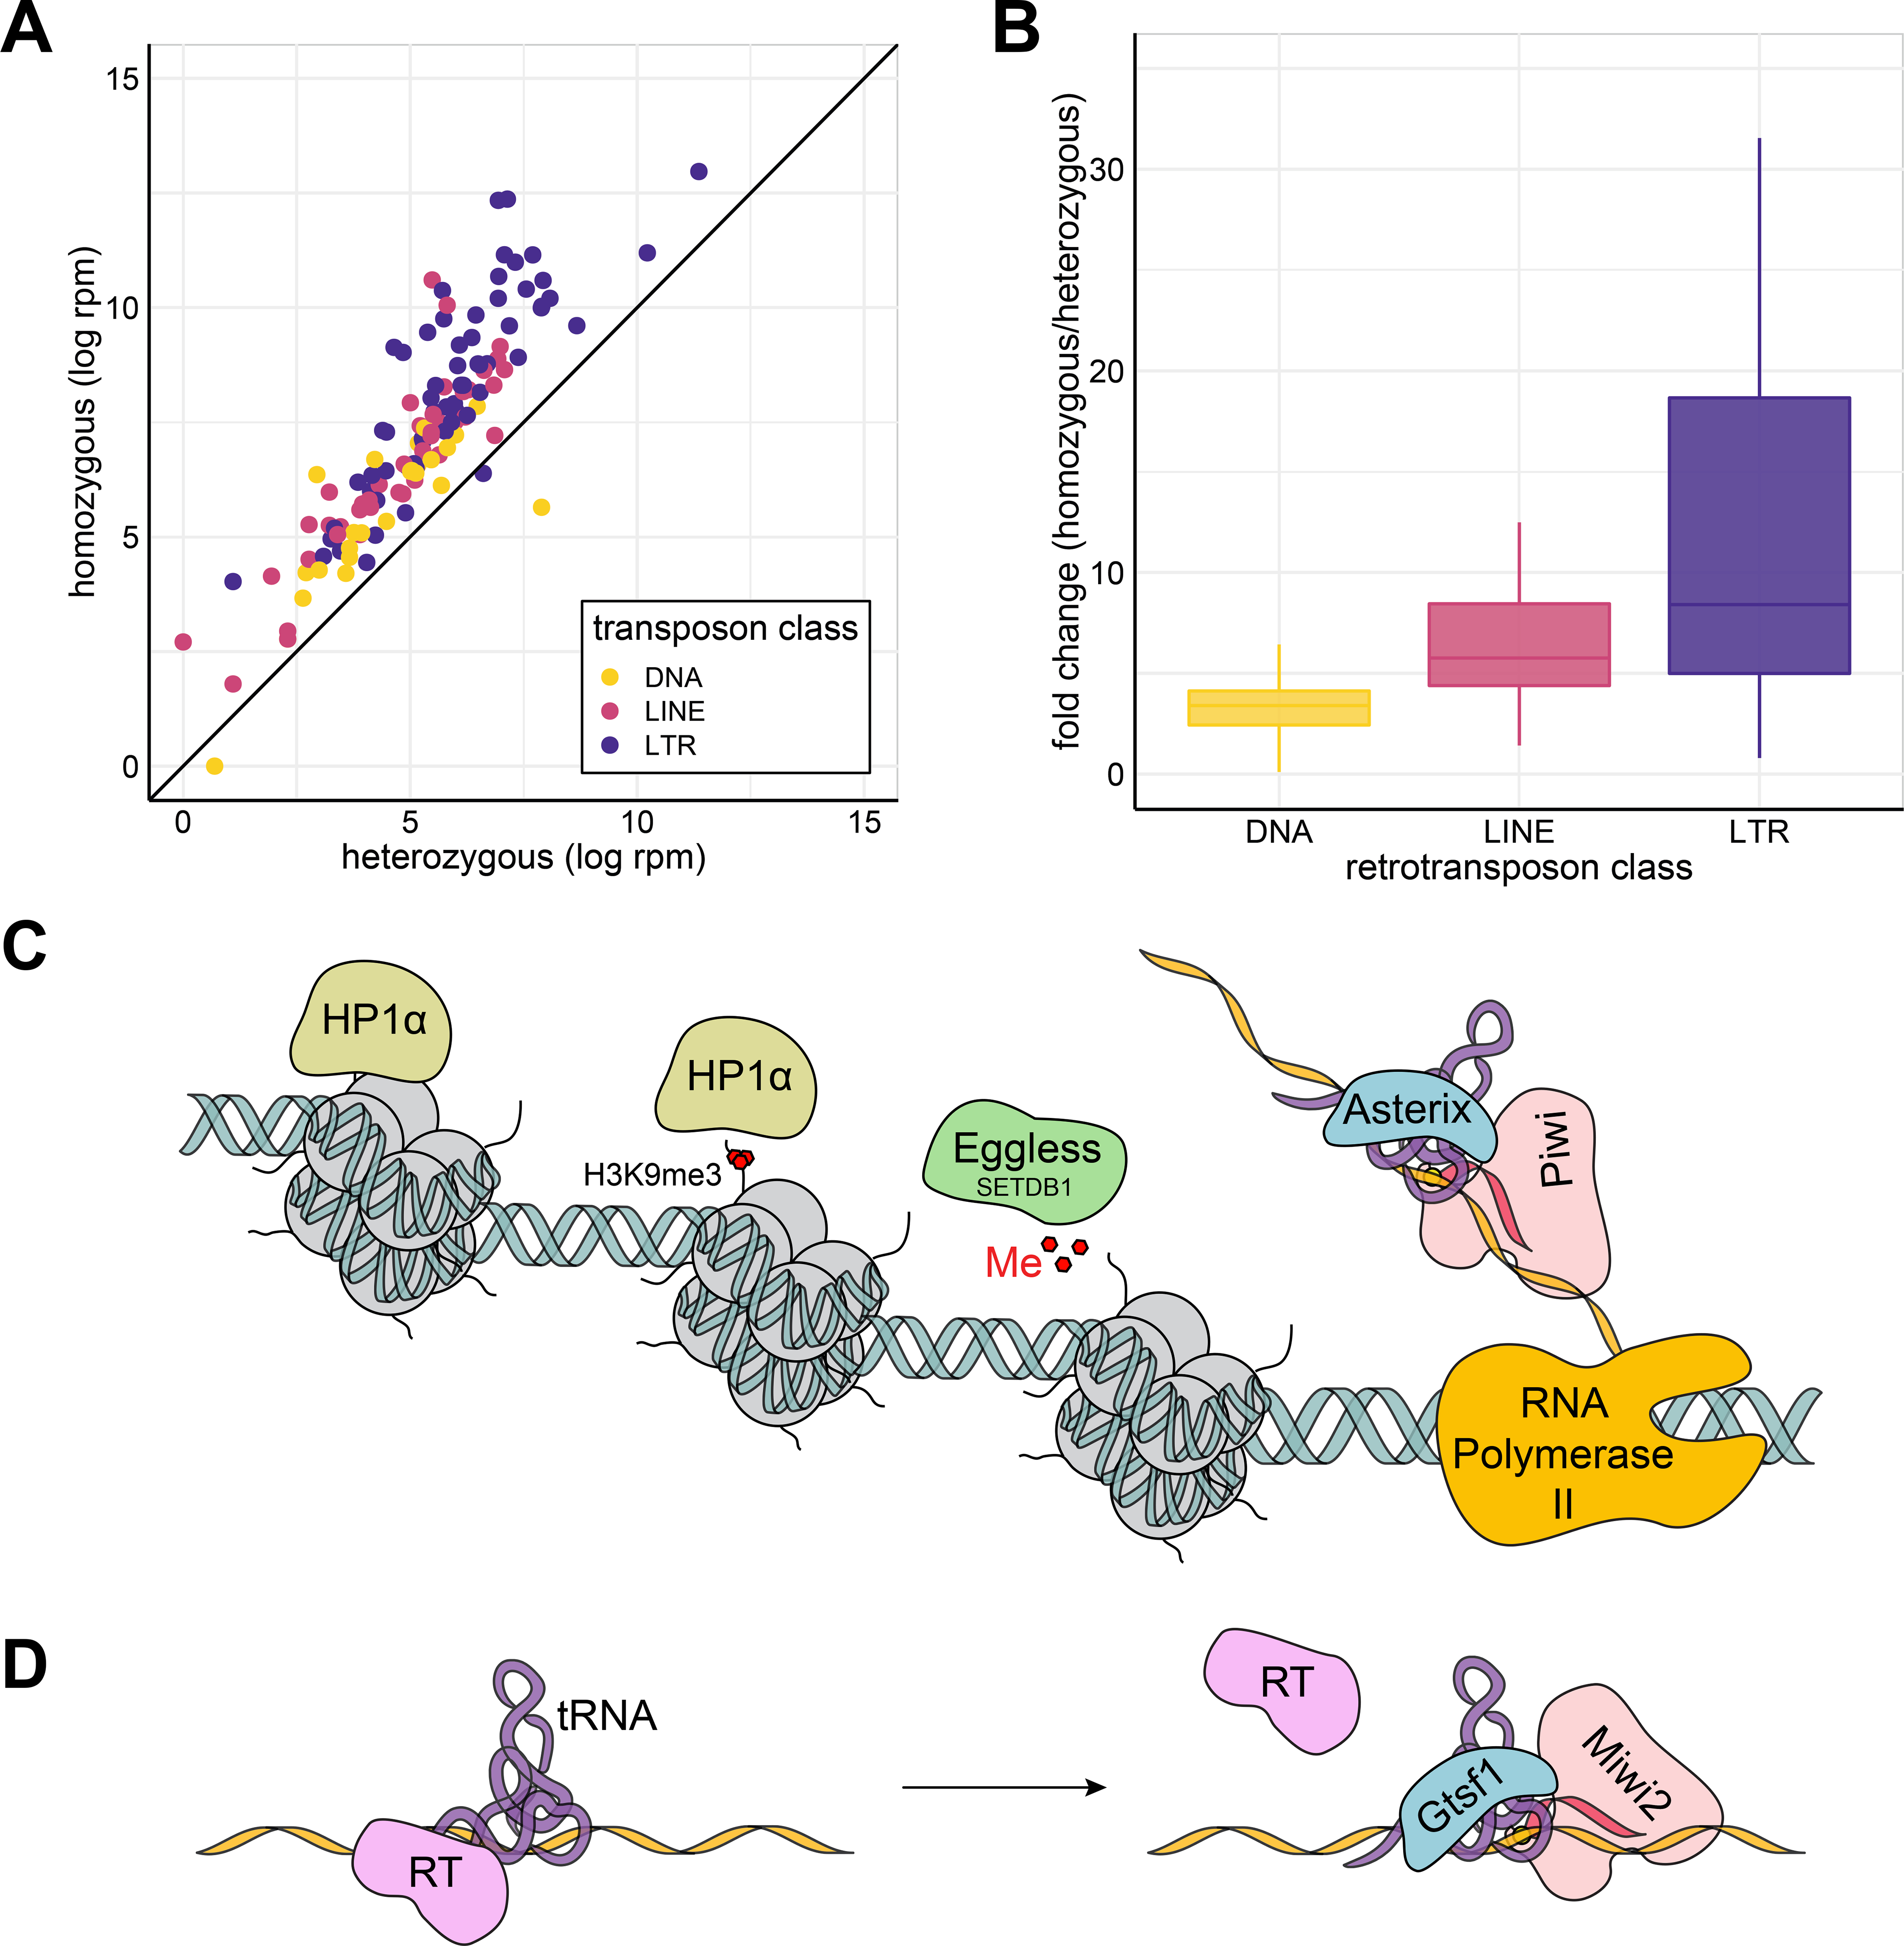
(A) Comparison of transposon levels in Asterix knockout versus Asterix heterozygous flies. Transposon expression as determined by RNA-seq in mutant versus heterozygous flies is plotted, color-coded by transposon class. (B) Transposon fold change distribution plots. Fold changes among gene annotations within each transposon class from are displayed as box plots. (C, D) Models for the role of Asterix/Gtsf1 in silencing. (C) In the nucleus, Asterix may utilize tRNAs to recognize primer binding sites in nascent transposon transcripts. Enhanced recruitment of piRISCs (pink) could then be achieved through interactions with Asterix’s C-terminal tail in addition to the protein-protein interactions between Asterix and Piwi, and the piRNA with the transcript. This leads to further recruitment of histone modification enzymes (such as Eggless/SETDB1; green) and eventual binding of HP1α (beige) to establish heterochromatin. (D) In the cytoplasm, similar interactions between Gtsf1, tRNAs, transposons, and Piwi proteins may also occur to displace reverse transcriptase and/or enhance the slicing activity of cytoplasmic piRISCs. See also Supplemental Figure 8.
Discussion
Several lines of evidence now establish Asterix/Gtsf1 as a bona fide tRNA-binding protein: the presence of CHHC zinc fingers that in other proteins bind structured RNAs, co-purification of tRNAs from the recombinant expression of Gtsf1, the ability to abolish these interactions with individual Gtsf1 point mutants, and direct-binding of Gtsf1 to tRNAs in multiple relevant cell culture systems.
Taken together with the marked effects of Asterix knockout on LTR retrotransposons and the evolutionary history that LTR retrotransposons share with tRNAs, tRNA-binding by Asterix/Gtsf1 suggests that these proteins are co-opting molecular epitopes of tRNAs to facilitate transposon silencing.
In the nucleus, where Asterix/Gtsf1 localizes in both mice and flies, LTR tRNA primer binding could be used to augment the specificity of Piwi/MIWI2 (both of which have identified as binding partners (Donertas et al., 2013)) through piRNA base-pairing interactions with transposons (Fig. 4C). The interactions between Asterix/Gtsf1 and Piwi/MIWI2, Asterix/Gtsf1 and tRNA, tRNAs and transposon transcripts, and piRISCs with nascent transcripts could reinforce one another, thereby enhancing target recognition. In the cytoplasm, Gtsf1 could likewise assist in the recruitment of Piwi partners—in this case for ping-pong processing—while potentially acting simultaneously to interfere with tRNA-primer/reverse transcriptase engagement and limit retrotransposon replication (Fig. 4D). Initial direction of Asterix/Gtsf1 to the appropriate cellular compartment could be accomplished by its known association with cognate Piwi proteins (Donertas et al., 2013; Yoshimura et al., 2018) after which Asterix/Gtsf1 aids in enhancing target recognition. Collectively, the interactions between Asterix/Gtsf1 and Piwi/MIWI2, Asterix/Gtsf1 and tRNA, tRNAs and transposon transcripts, and piRISCs with nascent transcripts could reinforce one another thereby enhancing target recognition.
Given that the precise ordering of complex formation is presently unknown, an attractive possibility is that tRNAs engaged with PBS sites could recruit Asterix/Gtsf1 more effectively than free tRNAs and in doing so, assist in Piwi/MIWI2 target recognition. Such an assembly mechanism effectively narrows the pool of tRNAs recognized by Asterix/Gtsf1, which is likely important given the high concentration of cellular tRNAs and the known observation that certain tRNAs are favored in reverse transcription of particular retroelements. It remains to be understood however, both in typical retroelement replication and in its inhibition through the mechanisms proposed, how tRNA unwinding is accomplished, whether it be by additional co-factors or simply part of the dynamic nature of the acceptor stem (Chan et al., 2019). One noteworthy observation from the cryo-EM reconstruction is the placement of the second zinc finger, and by extension the intrinsically disordered C-terminus of the protein: projecting toward the tRNA acceptor stem (and thus the tRNA primer for reverse transcription). While our biochemical data support that only the first zinc finger is necessary and sufficient for binding tRNAs in vitro, it is possible that more elaborate interactions between the tRNA and an engaged transposon target could be recognized by the second zinc finger. This sort of interaction would be reminiscent of those observed in the related CHHC zinc finger protein U11-K48 from the minor spliceosome (Tidow et al., 2009).
As RNA interference pathways are studied across many species and cell types, variations on several themes continue to emerge. In addition to the most obvious presence of a small-RNA loaded RISC as the central component of the pathway, complexes that establish multivalent interactions with silencing targets are also prevalent—GW182-mediated recruitment of Ago2 in humans, and the RITS complex in S. pombe are prime examples (Debeauchamp et al., 2008; Elkayam et al., 2017; Motamedi et al., 2004) (Supplemental Fig. 8). Moreover, GTSF-1 in C. elegans has been demonstrated as critical in the formation of a functional RNA-dependent RNA Polymerase Complex (RDRP) where it is believed to aid in the assembly of RNA silencing complexes (Almeida et al., 2018). These multipartite binding platforms confer enhanced molecular specificity while also allowing flexibility in the repertoire of silencing targets. In this case, our findings suggest that Gtsf1/Asterix exploits a key vulnerability in many retroelements: their dependence on host tRNAs for their replication.
STAR METHODS
Resource Availability
Lead Contact
Requests for resources, reagents, or further information should be directed to and will be fulfilled by Leemor Joshua-Tor (leemor@cshl.edu).
Materials Availability
Plasmids generated in this study are available upon request.
Data and Code Availability
Coordinates and NMR data have been deposited in the Protein Data Bank (PDB: 6X46) and the Biological Magnetic Resonance Bank (BMRB: 30754). Cryo-electron microscopy maps for complexes isolated from full-length MmGtsf1 protein and ZnF1 domain pull-downs have been deposited in the EMDB (EMD-22040 and EMD-22041, respectively). Sequencing data have been deposited in Gene Expression Omnibus (GEO) repository with accession numbers GSE151110 (Sf9 RNA pull-down), GSE151108 (eCLIP data from P19 cells), GSE151107 (eCLIP data from OSS cells), GSE151109 (eCLIP data from OSS cells using CRISPR-tagged Asterix). Custom gene annotation files and data processing scripts are available on GitHub (https://github.com/jonipsaro/asterix_gtsf1). Intermediate files used for generating gene annotations or processing of the data are available upon request.
Experimental Models and Subject Details
Sf9 cell culture.
Sf9 (Spodoptera frugiperda pupal ovarian; RRID: CVCL_0549; female) cells were maintained in CCM3 medium (Cytiva). Cells were cultured at 27°C ambient atmosphere with orbital at 115 rpm. Cultures were monitored for Mycoplasma contamination using the MycoAlert Mycoplasma Detection Kit (Lonza). Mycoplasma contamination was not detected.
P19 cell culture.
P19 (mouse embryonal carcinoma; ATCC: CRL-1825; RRID: CVCL_2153; male) cells were maintained in minimum essential medium with ribonucleosides and deoxribonucleosides (Gibco), supplemented with bovine calf serum and fetal bovine serum (7.5% and 2.5% final concentration, respectively) (Seradigm). Cells were cultured at 37°C in a 5% CO2 atmosphere. Cultures were monitored for Mycoplasma contamination using the MycoAlert Mycoplasma Detection Kit (Lonza). Mycoplasma contamination was not detected. The identity of the cultured cells was confirmed by short tandem repeat (STR) profiling, serviced by ATCC.
OSS cell culture.
Drosophila OSS (ovarian somatic sheath; RRID: CVCL_1B46; female) cells were maintained in OSS medium (Shields and Sang M3 Insect Medium [Sigma-Aldrich] supplemented with approximately 5 mM potassium glutamate, 5 mM potassium bicarbonate, 10% heat-inactivated fetal bovine serum [Seradigm], 10% fly extract [Drosophila Genomics Resource Center], 2 mM reduced glutathione [Sigma-Aldrich], 1x GlutaMAX [Gibco], 0.01 mg/mL human insulin [Sigma-Aldrich], and an antibiotic-antimycotic [Gibco] consisting of penicillin, streptomycin, and Amphotericin B). Cells were cultured at ~23°C. Cultures were monitored for Mycoplasma contamination using the MycoAlert Mycoplasma Detection Kit (Lonza). Mycoplasma contamination was not detected. OSS cells with Asterix C-terminally FLAG-tagged at its native locus (Asterix-GFP-FRT-Precission-V5-FLAG3-P2A) were provided by the lab of J. Brennecke and cultured in the same way as unmodified OSS cells.
Method Details
Cloning
Overview.
In order to screen for well-behaved targets for recombinant protein expression, a panel of constructs was generated from H. sapiens, M. musculus, and D. melanogaster Gtsf1 cDNAs (codon-optimized for expression in Sf9) by SLIC (sequence- and ligation-independent cloning) in DH5α cells (Invitrogen). These constructs presented various N- or C-terminal tags for enhanced expression and purification using either E. coli or insect cell culture systems. In addition, natural sequences of the D. melanogaster and M. musculus proteins were used for transfection in eCLIP experiments. The sequence of each construct was verified by GenScript. Constructs presented in this work are described in further detail below and summarized at the end of this section.
Constructs for structure determination by NMR.
To obtain sufficient quantities of isotopically-labeled, purified protein, numerous MmGtsf1 constructs were screened for high expression in E. coli. A fragment corresponding to the first 115 residues of MmGtsf1 with a C-terminal TEV-His6-tag showed highest expression and produced sufficiently soluble material for structure determination by NMR. To prevent aggregation over the duration of NMR data collection, four of the cysteines (those not involved in zinc chelation) were mutated to serine. These constructs were cloned into the vector pET-22 and also included TEV-cleavable linker for His6-tag removal (MmGtsf1–115-TEV-His and MmGtsf1–115-TEV-His C28S, C76S, C100S, C103S).
Constructs for RNA binding studies.
Constructs were similarly screened for expression in Sf9 cells. Data presented for RNA interaction studies include the full-length protein (167 residues), point mutants, and truncations as indicated in each figure. All Sf9-derived material included a C-terminal Strep2-tag and TEV-cleavable linker and was cloned in to the vector pFL for baculoviral-induced insect cell culture.
Constructs for eCLIP.
MmGtsf1 cDNA (not codon-optimized) was obtained from GensScript (Accession Number NM_028797.1; Clone ID: OMu06141D) and subcloned by SLIC into the vector pEFα under the control of the EF1α promoter. A C-terminal TEV-Strep2 tag was included to allow for affinity pull-down during eCLIP processing. pmaxGFP (Lonza) was used as a transfection control. pEFα plasmid was a kind gift from A. Schorn and R. Martienssen. Drosophila Asterix cDNA (cDNA codon-optimized for expression in Sf9) was synthesized in-house and cloned into the vector pAWG (Drosophila Genome Resource Center) under the control of the actin promoter. A C-terminal TEV-Strep2 tag was included to allow for affinity pull-down during eCLIP processing. pAGW (Drosophila Genome Resource Center) was used as a transfection control.
Expression and Purification
Recombinant expression in E. coli.
To generate isotopically-labeled, purified protein, target constructs were transformed into BL21-CodonPlus (DE3)-RIPL (Agilent). Cultures were then grown in M9 media supplemented with 15NH4Cl and/or 13C-labeled glucose (Cambridge Isotopes) at 37°C to a culture density of approximately 0.7. Protein expression was induced with 1 mM IPTG (final concentration) and proceeded for 3.5 hours.
Purification.
Cells were harvested by centrifugation at 4000g, resuspended in lysis buffer (50 mM sodium phosphate, pH 8.0, 50 mM NaCl, 10 mM imidazole; ~20 mL per liter culture), and lysed by sonication. The cell lysate was clarified by ultracentrifugation at 125,000g for 1 h after which the supernatant applied to a Ni-NTA column equilibrated with lysis buffer. The column was washed (50 mM sodium phosphate, pH 8.0, 300 mM NaCl, 40 mM imidazole) and the protein then eluted (50 mM sodium phosphate, pH 8.0, 300 mM NaCl, 200 mM imidazole). To prevent precipitation and proteolysis, DTT was added to the elution at a final concentration of 10 mM and EDTA at a final concentration of 1 mM. The C-terminal His6-tag was then removed by overnight treatment with TEV protease (1:25 mass ratio of protease:target) at 4°C. The cleaved protein was further purified by ion-exchange chromatography (MonoQ column) in a buffer of 25 mM Tris, pH 8.0, and 2 mM DTT with a NaCl gradient from 0 to 1 M. MmGtsf1–115 eluted approximately between 17 and 24 mS. Peak fractions were pooled, concentrated, and used for further purification by gel filtration chromatography (Superdex75 increase) in 50 mM MES, pH 6.5, 200 mM NaCl, and 5 mM TCEP. Peak fractions were pooled, concentrated and mixed with ZnCl2 (2:1 molar ratio Zn2+:protein) and MgCl2 (4:1 molar ratio Mg2+:protein). Upon addition of ZnCl2, the protein solution became temporarily turbid, but clarified upon gentle mixing. For NMR structure determination, sodium azide was added at a final concentration of 0.02% as a preservative. Typical yields were 2–3 mg of purified protein (>98% pure as assessed by SDS-PAGE) per liter culture.
Expression in Sf9 and RNA pull-down.
Constructs (each with a C-terminal TEV-Strep2 tag) were cloned into the vector pFL then integrated into bacmids using DH10MultiBac cells (Geneva Biotech). Isolated bacmids were then transfected into Sf9 cells for baculoviral-driven expression. For details regarding growth and maintenance of Sf9, refer to the Experimental Models and Subject Details. After expression, cells were harvested by centrifugation at 1000g, resuspended in lysis buffer (50 mM Tris, pH 8.0, 100 mM KCl, 1 mM DTT) (~20 mL per liter culture), and lysed by sonication. The cell lysate was then clarified by ultracentrifugation at 125,000g for 1 h and the supernatant applied to a Strep-Tactin (IBA) column equilibrated with lysis buffer. The bound MmGtsf1 proteins were subsequently washed with lysis buffer, further washed with lysis buffer containing 2 mM ATP, and finally eluted in lysis buffer containing 5 mM D-desthiobiotin. Protein purity was assessed by SDS-PAGE. Co-purifying nucleic acids were isolated by phenol:choloform extraction, precipitated with ethanol, then assessed by Urea-PAGE.
Characterization of Co-purifying Sf9 RNAs
Initial nucleic acid characterization.
After phenol:chloroform extraction and alcohol precipitation, pulled-down nucleic acids were characterized by treatment with RNase, DNase, or by alkaline hydrolysis. For each treatment, approximately 50 ng of nucleic acid was mixed with either RNase A (Ambion; 1 μg), DNase I (Zymo Research; 0.1 units), or 1 μL of 1 M sodium hydroxide in total volume of 40 μL under suitable buffer conditions (10 mM Tris, pH 8.0, 1 mM EDTA for RNase A treatment; no added buffer for alkaline hydrolysis treatment; 10 mM Tris, pH 7.6, 2.5 mM MgCl2, 0.5 mM CaCl2 for DNase I treatment). Murine RNase inhibitor (NEB; 40 units) was included in all conditions with the exception of the RNase A treatment. Samples were incubated for 15 minutes at 37°C for nuclease treatments or 70°C for alkaline hydrolysis. After treatment, the sodium hydroxide was neutralized by the addition of 1 μL of 1 M hydrochloric acid. As a control, a 50 nucleotide DNA duplex was treated under the same set of conditions. All samples were the denatured and assessed by 12% Urea-PAGE.
sRNA library preparation.
Affinity co-purifying nucleic acids which bound to MmGtsf1 during expression in Sf9 were separated from the protein by ion exchange chromatography (Mono Q column, as described above, eluting between 45 and 55 mS). Peak fractions were pooled, and the RNA isolated by phenol:chloroform extraction and alcohol precipitation. Small RNA libraries were prepared using the SMARTer smRNA-Seq Kit for Illumina sequencing (Takara). Size-selection was performed using Blue Pippin 2% agarose gel cassettes (Sage Science). All libraries were assessed by fluorometric quantification (Qubit 3.0) and by Bioanalyzer chip-based capillary electrophoresis. The average fragment size was 228 bp with most insert sizes ranging from 20–100 bp. Libraries were pooled in equimolar ratios according to their quantification (determined above). Single-end reads with two 8-basepair barcodes were generated on an Illumina NextSeq resulting in approximately 10 million reads per library. Base calling was performed with Illumina bcl2fastq2 v2.19 software.
sRNA library data processing.
Owing to the incomplete assembly of the Sf9 genome and the lack of annotations, processing for sRNA was straightforward, but limited. Reads were first trimmed to remove sequences appended during library preparation (adapters, polyA sequences at the 3’ end, as well as the first three nucleotides after the adapter at the 5’ end). Removal of the polyA sequence was performed using a custom script (polyA_trim.py). Reads were then filtered based on size and quality scores. Reads in the processed libraries were collapsed and the most abundant sequences were manually inspected.
eCLIP Library Generation
Cell Culture.
For details regarding growth and maintenance of P19 (mouse embryonal carcinoma) cells and OSS (Drosophila ovarian somatic sheath) cells, refer to the Experimental Models and Subject Details.
P19 cell transfection of MmGtsf1-TEV-Strep.
P19 cells were grown to 75% confluency in 150 mm culture dishes. Four hours prior to transfection, the medium was refreshed. To transfect, 30 μg of DNA (either MmGtst1-TEV-Strep in pEF or eGFP in pMAX [transfection control]) was premixed with 60 μL of X-tremeGENE HP DNA transfection reagent (Roche) in serum-free medium for 15 minutes. After a 15-minute incubation, this mixture was added to the cultures. Sixteen hours post-transfection, the cells were visibly perturbed and the medium was again refreshed. Expression of eGFP in the transfection control was confirmed by UV microscopy. Forty-eight hours post-transfection, the cells were rinsed with ice-cold phosphate-buffered saline (PBS) and taken for processing.
OSS cell transfection of Asterix-TEV-Strep.
OSS cells were grown to 75% confluency in 150 mm culture dishes. Four hours prior to transfection, the medium was refreshed. To transfect, 50 μg of DNA (either Asterix-TEV-Strep in pAWG or pAGW [transfection control]) was premixed with 15 μL of Xfect Polymer transfection reagent (Takara) in 500 μL Xfect buffer. OSS medium was removed from the cells and replaced with Shields and Sang M3 Insect Medium supplemented only with potassium bicarbonate and potassium glutamate. After a 10-minute incubation of the DNA with the transfection reagent, the transfection mixture was added to the cultures. Two hours post-transfection, the M3 medium was removed and replaced with fully-supplemented OSS medium. Expression of GFP in the transfection control was confirmed by UV microscopy. Seventy-two hours post-transfection, the cells we rinsed with ice-cold phosphate-buffered saline (PBS) and taken for processing.
Library preparation.
eCLIP Libraries were prepared essentially as in Van Nostrand et al. (Van Nostrand et al., 2016) with the following parameters and modifications. UV cross-linking was performed at 254 nm for ~45 seconds (400 mJ) in an HL-2000 Hybrilinker. For MmGtsf1-TEV-Strep in P19 cells and Asterix-TEV-Strep in OSS cells, protein pull-down was accomplished using MagStrep “type 3” XT beads (IBA) with 50 μL of bead resuspension used per sample. Asterix-GFP-FRT-Precission-V5-FLAG3-P2A, pull-down was similarly accomplished with Anti-FLAG M2 magnetic beads (Sigma-Aldrich). The suppliers of molecular reagents used in the eCLIP procedure (ExoSAP-IT, FastAP, Proteinase K, RNase I, RNase inhibitor, T4 PNK, T4 RNA ligase, TURBO DNase), commercial kits (Nucleospin cleanup kit, PrimeScript RT-PCR kit, RNA Clean & Concentrator-5 kit, and SYBR Green master mix), and antibodies using in Western blotting (mouse ANTI-FLAG M2 primary, mouse StrepMAB-Classic primary, and goat anti-Mouse IgG IRDYE 800CW secondary) are detailed in the Key Resources Table. Library adapter oligonucleotide sequences are also provided.
Final libraries were amplified and barcoded using Illumina compatible primers as described below.
| Non-crosslinked input | D504, D701 |
| Crosslinked input (replicate 1) | D504, D702 |
| Crosslinked input (replicate 2) | D501, D703 |
| Non-crosslinked IP (background) | D503, D701 |
| Crosslinked IP (replicate 1) | D502, D703 |
| Crosslinked IP (replicate 2) | D503, D704 |
For samples from mouse P19 cells, 8 amplification cycles were used for the inputs and 14 cycles for the IPs. For samples from Drosophila OSS cells, 13 amplification cycles were used for the inputs and 18 cycles for the IPs.
For quality control, all libraries were assessed by fluorometric quantification (Qubit 4.0) and by Bioanalyzer chip-based capillary electrophoresis. The average fragment size was typically 240–250 bp with most insert sizes ranging from 15–200 bp. A detailed version of the complete eCLIP library preparation is available upon request.
Next-generation sequencing.
Libraries were pooled in equimolar ratios according to their quantification (determined above). Paired-end reads with two, 8-basepair barcodes were generated on an Illumina NextSeq resulting in approximately 100 million paired-end reads (~15–20 million reads per library). Base calling was performed with Illumina bcl2fastq2 v2.19 software.
eCLIP Processing
Rationale.
Based on our previous findings when sequencing endogenous Sf9 RNAs copurifying with recombinantly-expressed MmGtsf1, we surmised that it would be necessary to include multi-mapping reads in our analysis pipeline. This stems from the fact that many of the RNA species of interest arise from known multi-mapping regions (tRNAs, transposable elements, and piRNA clusters).
Summary.
The pipeline begins with demultiplexed paired-end libraries. Given that most all of the paired-end reads were short enough to overlap, they were joined into single sequences using FLASH (Magoc and Salzberg, 2011). Sequencing adapters were then trimmed, PCR duplicates removed, and the reverse complement of the read (corresponding to the sense strand of the original RNA) was taken for downstream processing. Identical reads were collapsed and counted, then mapped to the genome using STAR (Dobin et al., 2013). The aligned reads were then annotated and filtered based on feature type using a combination of custom scripts and bedtools (Quinlan, 2014). Full descriptions of custom scripts accompany the deposited code (see Resource Availability).
Gene Annotations
As many of the gene classes of interest have dedicated communities of their own (tRNAs, miRNAs, piRNAs, and transposons), we incorporated these multiple annotation sources into the workflow. The sources of annotations are listed below for both the mouse and Drosophila analyses. In brief, annotations from each source were compared, matched when possible, and if matched the outer bounds of each annotation were taken. The resulting composite annotations have been deposited (see Resource Availability).
Mouse:
Gencode version M21 (Frankish et al., 2019), miRBase release 22.1 (Kozomara et al., 2019), piRNA cluster DB (Rosenkranz, 2016), TEtranscripts (Jin et al., 2015), tRNA DB (Chan and Lowe, 2016), UCSC rRNA annotations (Kent et al., 2002)
Fly:
FlyBase (Thurmond et al., 2019), miRBase release 22.1 (Kozomara et al., 2019), piRNA cluster DB (Rosenkranz, 2016), custom annotations provided by A. Haase for piRNAs, TEtranscripts (Jin et al., 2015), tRNA DB, UCSC (Kent et al., 2002)
tRNA Analysis
Following multi-mapping normalization, reads belonging to the tRNA annotation class were further characterized. To begin, the size of each tRNA annotation was scaled to a “model tRNA” size of 73 nucleotides. Each tRNA read was then re-mapped to its annotation, now scaled to the model tRNA length. By aggregating all tRNA-mapping reads, we were able to generate histograms of read statistics (5’ end, 3’ end, read length, and nucleotides covered). It is expected that eCLIP reads will have a pileup at their 5’ end corresponding to the cross-linking site. We scored this pileup by determining the fold enrichment for each metric (essentially calculated as [IP – background] / input) and weighting it by its Z-score.
NMR Spectroscopy
Instrumentation.
NMR spectroscopy was performed using Bruker AVANCE500 (New York Structural Biology Center, NYSBC), DRX600 (Columbia University), AVANCE700 (NYSBC), AVANCE800 (NYSBC), and AVANCE900 (NYSBC) NMR spectrometers equipped with 5 mm cryoprobes.
Sample preparation.
MmGtsf1 samples were prepared in 50 mM MES, pH 6.5, 200 mM NaCl, 5 mM TCEP, and 2:1 stoichiometric ZnCl2, 4:1 stoichiometric MgCl2, and 0.02% azide. For data acquisition, samples were either supplemented with a final concentration of 10% D2O or lyophilized and resuspended in 99% D2O. Sample concentrations were 0.5 mM for the [U-15N]-labelled protein and 0.8 mM for the [U-13C, U-15N]-labelled protein. The sample temperature was calibrated to 298 K using 98% 2H4-methanol (Findeisen et al., 2007). 100 μM DSS was included in samples for internal referencing of 1H chemical shifts, followed by indirect referencing for 13C and 15N chemical shifts (Cavanagh et al., 2007).
Resonance assignments.
Backbone resonance assignments were obtained using 1H-15N HSQC, 1H-13C HSQC, HNCA, HN(CO)CA, HNCO, HN(CA)CO, HNCACB, and HN(COCA)CB experiments (Cavanagh et al., 2007). Side chain resonance assignments were obtained using HCCH-TOCSY, HBHA(CO)NH, H(CCO)NH, and (H)C(CO)NH experiments (Cavanagh et al., 2007). Spectra were processed using NMRPipe (Delaglio et al., 1995) and analyzed using NMRFAM-SPARKY (Lee et al., 2015).
Distance restraints.
Distance restraints for structure determination were obtained from 1H-15N NOESY-HSQC, 1H-13C NOESY-HSQC, and 1H-13C NOESY-HSQC (with spectral parameters optimized for detection of aromatic spins) (Cavanagh et al., 2007). 1H-13C NOESY experiments were performed for samples prepared in 99% D2O.
Zinc coordination.
Protonation states of histidine residues were determined by long-range HMQC experiments together with the empirical correlation between the chemical shift difference 13Cε1 - 13Cδ2 (Barraud et al., 2012). H23 and H57 are designated with Nδ1 coordination, and H33 and H67 are designated with Nε2 coordination to the Zn2+ ion.
Relaxation parameter determination.
Backbone 15N R1 relaxation rate constants, 15N R2 relaxation rate constants, and the steady-state {1H}−15N NOE were measured at 500 MHz (NYSBC) using the pulse sequences of Lakomek et al. (Lakomek et al., 2012). R1 measurements used relaxation delays of 24 (×2), 176, 336 (×2), 496, 656, 816, 976, and 1200 ms. R2 measurements used relaxation delays of 16.3 (×2) 32.6, 49.0 (×2), 65.3, 97.9, 130.6, 163.2, and 195.8 ms. NOE measurements used a recycle delay of 7 s for the control experiment and 2 s of recovery followed by 3 s of saturation for the saturated experiment. Duplicate relaxation delays were used for error estimation for measurement of 15N R1 and R2 relaxation rate constants. Duplicate experiments were used for error estimation for the steady-state {1H}−15N NOE experiment.
Structure determination.
Automatic NOESY cross-peak assignments and structure calculations were performed with ARIA 2.3 (Ambiguous Restraints for Iterative Assignment) (Linge et al., 2003) using an eight step iteration scheme supported by partial manual assignments of aliphatic/aromatic 13C-edited NOESY-HSQC and amide 15N-edited NOESY-HSQC spectra, respectively. Less than 10% of all assignments were labelled ambiguous after initial and final ARIA structure calculations. The unambiguous distance restraints output from the automation run was recalibrated by increasing all the upper distance limits by ~10% and further elimination of lone and consistent NOE violations by manually inspecting the lower quality peak assignments. Dihedral angle restraints for residues in the structured zinc finger domains were derived from the analysis of the backbone chemical shifts in TALOS (Shen et al., 2009). Structure calculations were performed in two stages by initially excluding Zn2+ during automated NOESY cross-peak assignments followed by water refinement of the Zn2+-bound structures. The tetrahedral Zn2+ metal ion coordination was implemented in CNS 1.1 by adding a CHHC patch with the experimentally verified tautomeric states for the two histidine side chains in the topallhdg5.3.pro file (Bersch et al., 2013; Tidow et al., 2009). Bond lengths and angles used to define the Zn2+-bound CHHC motif in the parallhdg5.3.pro file was obtained from the published structure (PDB 2VY4) of the homologous ribonuclear protein U11-K48 (Tidow et al., 2009). The final ensemble of 20 representative Zn2+-bound structures was generated by calculating 500 structures with water refinement in CNS 1.2 (Brunger et al., 1998). Supplemental Table 1 summarizes the final restraints used in the calculations, NMR ensemble statistics, and the overall quality of the structures determined by MolProbity (Davis et al., 2007).
Local variability analysis.
A sliding window of ±3 amino acids was used to align the 20 lowest energy structures to one another in all combinations at each residue. Average RMSDs were calculated for each window’s alignment, then mapped onto the central residue in the window. Residues near the termini included as many residues as possible while maintaining up to 3 residues on either side of the queried residue (e.g. the score for residue 1 derived from RMSDs using residues 1–4 for alignment; the score for the final residue, 115 derived from RMSDs using residues 112–115).
Cryo-electron Microscopy
Sample preparation.
Affinity-purified MmGtsf1-TEV-Strep constructs from Sf9 (which included co-purified RNAs) at ~0.25 mg/mL in elution buffer (50 mM Tris, pH 8.0, 100 mM KCl, 1 mM DTT, 5 mM d-desthiobiotin) were first cross-linked at 254 nm for ~45 seconds (400 mJ) in an HL-2000 Hybrilinker. It should be noted however, that assessment of RNAs by Urea-PAGE following this treatment did not seem to result in significant covalent cross-linking. For cryo-EM grid preparation, 4 μL of solution was applied to a glow-discharged Lacey carbon grid, incubated for 10 seconds at 25°C and 95% humidity, blotted for 2.5 seconds, then plunged into liquid ethane using an Automatic Plunge Freezer EM GP2 (Leica).
Data acquisition.
Data were acquired on Titan Krios transmission electron microscope (ThermoFisher) operating at 200 keV. Dose-fractionated movies were collected using a K2 Summit direct electron detector (Gatan) operating in electron counting mode. In total, 32 frames were collected ov22er a 4 second exposure. The exposure rate was 7.6 e−/pixel/second (approximately 19 e−/Å2/second), which resulted in a cumulative exposure of approximately 76 e−/Å2. EPU data collection software (ThermoFisher) was used to collect micrographs at a nominal magnification of 215,000x (0.6262 Å/pixel) and defocus range of −1.0 to −3.0 μm. For the full-length protein construct sample (MmGtsf1-TEV-Strep with RNA), 4,849 micrographs were collected. For the construct containing only the first zinc finger (MmGtsf1-[1,45]-TEV-Strep with RNA), 2,461 micrographs were collected.
Micrograph processing and 3D reconstruction.
Real-time image processing (motion correction, CTF estimation, and particle picking) was performed concurrently with data collection using WARP (Tegunov and Cramer, 2019). Automated particle picking was initiated with the BoxNet pretrained deep convolutional neural network bundle included with WARP that implemented in TensorFlow. Following this first round of particle picking, the particle selections on ~20 micrographs were manually inspected and adjusted. This process was iterated one additional time. For the full-length construct, a particle diameter of 100 Å and a threshold score of 0.6 yielded 495,299 particle coordinates for the full-length construct. These particles were then subjected to a 2D classification in cisTEM (Grant et al., 2018) after which a subset of 346,643 particles were used for ab initio reconstruction and autorefinement in cisTEM. For the truncation construct, a particle diameter of 100 Å and a threshold score of 0.5 yielded 159,646 particle coordinates. These were then taken for 2D classification in cisTEM (Grant et al., 2018) after which a subset of 96,036 particles were used for ab initio reconstruction and autorefinement. After refinement, structures of tRNA—modelled incorporating the sequence of the most abundantly pulled-down RNA from Sf9 expression of MmGtsf1-TEV-Strep (Supplemental Table 2) and generated with RNAComposer (Antczak et al., 2016; Popenda et al., 2012)—and the zinc finger domains of MmGtsf1 were manually placed in the reconstructed volume based on the molecular shapes and the likely interaction surfaces as defined by mutagenesis data and most probable eCLIP cross-linking sites.
Difference map calculation.
Reconstructed volumes for the full-length and truncated MmGtsf1 constructs (both with co-purifying RNA as described above) were filtered to 10 Å with cisTEM (Grant et al., 2018). Using SPIDER (Shaikh et al., 2008), a 90 pixel (~56 Å) radius mask was applied to the filtered volumes after which each was normalized and aligned. This map for the truncation construct was then subtracted from the corresponding full-length map (MmGtsf1-TEV-Strep with RNA).
Figures
Figures of molecular models were generated using PyMOL (Schrodinger, 2019). Electrostatic surface calculations were performed with APBS (Jurrus et al., 2018) with a solvent ion concentration of 0.15 M using the AMBER force field. Superpositioning of structural homologs was performed by the DALI server (Holm, 2019). Conservation analysis was performed using the Consurf server (Ashkenazy et al., 2016). Co-evolution analysis was performed using the Gremlin server (Ovchinnikov et al., 2014). Graphs were produced in R (Team, 2019) using the ggplot2 package (Hadley, 2016).
Quantification and Statistical Analysis
Statistical parameters are described in the corresponding figure legends. All data presented for eCLIP experiments are from two replicate library preparations.
Additional Resources
In addition to custom gene annotations and data processing scripts, extended readme documentation is provided for running and modifying the analysis code at https://github.com/jonipsaro/asterix_gtsf1/.
Supplementary Material
Key Resources Table.
| REAGENT or RESOURCE | SOURCE | IDENTIFIER |
|---|---|---|
| Antibodies | ||
| ANTI-FLAG® M2 antibody (produced in mouse) | Sigma-Aldrich | Cat#F1804 |
| IRDye® 800CW Goat anti-Mouse IgG secondary antibody | LI-COR | Cat#926-32210 |
| StrepMAB-Classic (murine Strep-tag® II specific monoclonal) | IBA | Cat#2-1507-001 |
| Bacterial and Virus Strains | ||
| BL21-CodonPlus (DE3)-RIPL (E. coli) | Agilent | Cat#230280 |
| DH10MultiBac™ (E. coli) | Geneva Biotech | Cat#DH10MultiBac |
| MAX Efficiency™ DH5α competent cells (E. coli) | Invitrogen | Cat#18258012 |
| Chemicals, Peptides, and Recombinant Proteins | ||
| Ammonium chloride (15N, 99%) | Cambridge Isotope Laboratories, Inc. | Cat#NLM-467-10 |
| Antibiotic-antimycotic | Gibco / ThermoFisher Scientific | Cat#15-240-062 |
| D-desthiobiotin | Sigma-Aldrich / MilliporeSigma | Cat#D1411 |
| D-glucose, (U-13C6, 99%) | Cambridge Isotope Laboratories, Inc. | Cat#CLM-1396-1 |
| Deuterium oxide (D2O, 99%) | Cambridge Isotope Laboratories, Inc. | Cat#DLM-4-100 |
| DNase I | Zymo Research | Cat#E1010 |
| ExoSAP-IT™ PCR product cleanup reagent | Applied Biosystems / ThermoFisher Scientific | Cat#78200.200.UL |
| FastAP thermosensitive alkaline phosphatase | Thermo Scientific / ThermoFisher Scientific | Cat#EF0654 |
| Fetal Bovine Serum (FBS), Heat Inactivated | Seradigm / VWR or Gibco / ThermoFischer Scientific | Cat#97068-091 or Cat#16140063 |
| Fly Extract | Drosophila Genomics Resource Center | Stock#1645670 |
| GlutaMAX™ supplement | Gibco / ThermoFisher Scientific | Cat#35050061 |
| HyClone™ Insect Cell Culture Media (CCM3) | Cytiva / VWR | Cat#16777-272 |
| Insulin solution (human) | Sigma-Aldrich / MilliporeSigma | Cat#I9278 |
| IPTG | Gold Biotechnology | Cat#I2481C50 |
| Iron Supplemented Bovine Calf Serum (BCS) | Seradigm / VWR | Cat#10158-358 |
| L-glutathione (reduced) | Sigma-Aldrich / MilliporeSigma | Cat#G6013 |
| Minimum Essential Medium a, nucleosides | Gibco / ThermoFisher Scientific | Cat#12-571-063 |
| Proteinase K | NEB | Cat#P8107S |
| RNase A | Ambion / Invitrogen / ThermoFisher Scientific | Cat#AM2271 |
| RNase I, cloned | Ambion / Invitrogen / ThermoFisher Scientific | Cat#AM2294 |
| RNase inhibitor, murine | NEB | Cat#M0314L |
| Shields and Sang M3 Insect Medium | Sigma-Aldrich / MilliporeSigma | Cat#S8398 |
| T4 polynucleotide kinase (PNK) | NEB | Cat#M0201S |
| T4 RNA ligase 1 (ssRNA Ligase) | NEB | Cat#M0437M |
| TEV protease | Produced in-house | N/A |
| TURBO™ DNase | Invitrogen / ThermoFisher Scientific | Cat#AM2238 |
| X-tremeGENE HP DNA transfection reagent | Roche/ MilliporeSigma | Cat#6366236001 |
| Xfect™ transfection reagent | Takara | Cat#631317 |
| Critical Commercial Assays | ||
| MycoAlert™ Mycoplasma Detection kit | Lonza | Cat#LT07-118 |
| Nucleospin gel and PCR cleanup | Takara | Cat#740971.50 |
| PowerUp™ SYBR™ Green master mix | Applied Biosystems / ThermoFisher Scientific | Cat#A25776 |
| PrimeScript™ RT-PCR kit | Takara | Cat#RR014B |
| RNA Clean & Concentrator™-5 | Zymo Research | Cat#R1013 |
| SMARTer® smRNA-Seq kit for Illumina® | Takara | Cat#635030 |
| Deposited Data | ||
| Annotations: Custom composite annotations | This paper | https://github.com/jonipsaro/asterix_gtsf1 |
| Annotations: miRNAs | miRBase release 22.1 | http://www.mirbase.org/ |
| Annotations: piRNA clusters | piRNA Cluster Database | https://www.smallrnagroup.uni-mainz.de/piCdb/ |
| Annotations: rRNAs | UCSC Genome Browser | http://genome.ucsc.edu/ |
| Annotations: transposable elements | TEtranscripts | http://hammelllab.labsites.cshl.edu/software/#TEtranscripts |
| Annotations: tRNAs | Genomic tRNA database release 17 | http://gtrnadb.ucsc.edu/GtRNAdb_archives/release17/ |
| Genome: Drosophila reference genome and annotations, dm6 | Flybase, release 6.27 | https://flybase.org/ |
| Genome: Mouse reference genome and annotations version M21, GRCm38 | GENCODE | https://www.gencodegenes.org/ |
| Scripts: Custom processing scripts | This paper | https://github.com/jonipsaro/asterix_gtsf1 |
| Sequencing: eCLIP of Drosophila Asterix/Gtsf1 (endogenous promoter) in Drosophila ovarian somatic sheath (OSS) cells | This paper | GEO: GSE151109 |
| Sequencing: eCLIP of Drosophila Asterix/Gtsf1 transfected in Drosophila ovarian somatic sheath (OSS) cells | This paper | GEO: GSE151107 |
| Sequencing: eCLIP of mouse Asterix/Gtsf1 transfected in mouse P19 embryonal teratoma cells | This paper | GEO: GSE151108 |
| Sequencing: RNA-sequencing data of homozygous and heterozygous Asterix knock-out D. melogaster | Muerdter, Guzzardo et al. (2013) | GEO: GSE46009 |
| Sequencing: Small RNA sequencing of Gtsf1-bound RNAs from Sf9 | This paper | GEO: GSE151110 |
| Structure: Asterix/Gtsf1 from mouse (full-length protein) bound to co-purifying tRNA | This paper | EMDB: EMD-22040 |
| Structure: Asterix/Gtsf1 from mouse (residues 1–45; zinc finger 1) bound to co-purifying tRNA | This paper | EMDB: EMD-22041 |
| Structure: NMR solution structure of Asterix/Gtsf1 from mouse (CHHC zinc finger domains) | This paper | PDB: 6X46; BMRB: 30754 |
| Structure: U11-48K CHHC Zn-Finger Domain | Tidow et al. (2009) | PDB: 2VY4 |
| Experimental Models: Cell Lines | ||
| Drosophila melanogaster: ovarian somatic sheath cells (OSS) | Drosophila Genomics Resource Center | RRID: CVCL_1B46 |
| Mus musculus: embryonal teratocarcinoma (P19) | ATCC | ATCC: CRL-1825; RRID: CVCL_2153 |
| Spodoptera frugiperda: pupal ovarian cells (Sf9) | Gibco / ThermoFisher Scientific | Cat#11496015; RRID: CVCL_0549 |
| Oligonucleotides | ||
| eCLIP oligos 1a: RNA linker ligation RNA_X1A: AUAUAGGNNNNNAGAUCGGAAGAGCGUCGUGUAG | Van Nostrand et al. (2016) | N/A |
| eCLIP oligos 1b: RNA linker ligation RNA_X1B: AAUAGCANNNNNAGAUCGGAAGAGCGUCGUGUAG | Van Nostrand et al. (2016) | N/A |
| eCLIP oligos 1c: RNA linker ligation RNA_RiL19: AGAUCGGAAGAGCGUCGUG | Van Nostrand et al. (2016) | N/A |
| eCLIP oligo 2: reverse transcription primer DNA_AR17: ACACGACGCTCTTCCGA | Van Nostrand et al. (2016) | N/A |
| eCLIP oligo 3: DNA linker ligation DNA_rand103Tr3: NNNNNNNNNNAGATCGGAAGAGCACACGTCTG | Van Nostrand et al. (2016) | N/A |
| Recombinant DNA | ||
| DmGtsf1, codon-optimized for expression in Sf9; pAWG backbone | This paper | Synthesized in-house |
| DmGtsf1, codon-optimized for expression in Sf9; pFL backboone | This paper | Synthesized in-house |
| MmGtsf1 for expression in P19 cells (wildtype codon usage); pEF backbone | This paper | Subcloned from GenScript Accession# NM_028797.1; Clone ID: OMu06141D |
| MmGtsf1, codon-optimized for expression in Sf9, various constructs and truncations; pFL backbone | This paper | Synthesized in-house |
| pAGW transfection control | Drosophila Genomics Resource Center | Stock Number: 1071 |
| pmaxGFP transfection control | Lonza | Based on Cat#VDC-1040 |
| Software and Algorithms | ||
| ARIA version 2.3 | Linge et al. (2003) | http://aria.pasteur.fr/ |
| bedtools version 2.29.0 | Quinlan (2014) | https://bedtools.readthedocs.io/ |
| cisTEM version 1.0.0 | Grant et al. (2018) | https://cistem.org/ |
| Crystallography and NMR System version 1.2 | Brunger et al. (1998) | https://www.mrc-lmb.cam.ac.uk/public/xtal/doc/cns/cns_1.3/installation/frame.html |
| DALI | Holm (2019) | http://ekhidna2.biocenter.helsinki.fi/dali/ |
| DESeq2 version 1.24.0 | Love et al. (2014) | http://www.bioconductor.org/packages/release/bioc/html/DESeq2.html |
| FLASH version 1.2.11 | Magoc and Sazberg (2011) | http://www.cbcb.umd.edu/software/flash |
| Gremlin | Ovchinnikov et al. (2014) | http://gremlin.bakerlab.org/ |
| Illumina bcl2fastq2 version 2.19 | Illumina | https://support.illumina.com/sequencing/sequencing_software/bcl2fastq-conversion-software/downloads.html |
| MolProbity | Davis et al. (2007) | http://molprobity.biochem.duke.edu/ |
| NMRFAM-SPARKY | Lee et al. (2015) | http://pine.nmrfam.wisc.edu/download_packages.html |
| NMRPipe | Delaglio et al. (1995) | https://www.ibbr.umd.edu/nmrpipe/install.html |
| PyMOL version 2.0 | Schrodinger, LLC (2019) | https://www.schrodinger.com/pymol |
| RNA Composer version 1.0 | Antczak et al. (2016) | http://rnacomposer.cs.put.poznan.pl/ |
| SPIDER version UNIX 24.01 | Shaikh et al. (2008) | https://spider.wadsworth.org/spider_doc/spider/docs/spider.html |
| STAR version 2.5.2b | Dobin et al. (2012) | https://github.com/alexdobin/STAR |
| TALOS | Shen et al. (2009) | https://spin.niddk.nih.gov/NMRPipe/talos/ |
| WARP version 1.0.6 | Tegunov and Cramer (2019) | http://www.warpem.com/warp/ |
| Other | ||
| Agencourt AMPure XP beads | Beckman Coulter / ThermoFisher Scientific | Cat#A63880 / Cat#NC9959336 |
| Anti-FLAG M2 Magnetic Beads | Sigma-Aldrich | Cat#M8823-1ML |
| Blue Pippin 2% agarose gel cassette | Sage Science | Cat#BDF2010 |
| Dynabeads™ MyOne™ Silane | Invitrogen / ThermoFisher Scientific | Cat#37002D |
| Lacey carbon grids | Electron Microscopy Sciences | Cat#LC325-Cu |
| MagStrep “type3” XT beads | IBA | Cat#2-4090-002 |
| Mono Q 5/50 GL | Cytiva (formerly GE Healthcare) | Cat#17516601 |
| Ni-NTA Agarose | Qiagen | Cat#30250 |
| Phenol:Chloroform:IAA, 25:24:1, pH 6.6 | Invitrogen / ThermoFisher Scientific | Cat#AM9732 |
| Strep-Tactin® Superflow® high capacity resin | IBA | Cat#2-1208-025 |
| Superdex 75 Increase 10/300 GL | Cytiva (formerly GE Healthcare) | Cat#29148721 |
Acknowledgements
We thank Sonam Bhatia, Sara Ballouz, Sarah Diermeier, Paloma Guzzardo, Matt Jaremko, Justin Kinney, Molly Gale Hammell, Greg Hannon, Katie Meze, Felix Muerdter, Kathryn O’Neill, Nikolay Rozhkov, David Spector, and Dennis Thomas for advice. Astrid Haase provided custom piRNA cluster gene annotations for D. melanogaster. CRISPR-tagged Asterix OSS cells were gifted by Julius Brennecke. P19 cells and advice were provided by Andrea Schorn and Rob Martienssen. We thank Amanda Epstein and visiting students Michael Jacobs, Edward Twomey, and Dexter Adams for technical assistance. The 600 and 800 MHz NMR spectrometers were supported by NIH grants S10RR026540 and S10OD016432, respectively, and The Center on Macromolecular Dynamics by NMR Spectroscopy at the New York Structural Biology Center is supported by NIH grant P41 GM118302. This work was performed with assistance from the CSHL Next-generation Sequencing, Sequence Technologies and Analysis, and Mass Spectrometry Shared Resources, which are supported by the Cancer Center Support Grant 5P30CA045508. Cryo-electron microscopy was performed at the CSHL cryo-EM facility. OSS cells, medium components, and selected plasmids were acquired from the Drosophila Genomics Resource Center which is supported by NIH grant 2P40OD010949. We thank Life Science Editors for editorial assistance. This work was supported by National Institutes of Health (NIH) grants F32GM097888 (J.J.I.), R01GM050291 (A.G.P.), R35GM130398 (A.G.P.) and T32 GM008281-28 (P.A.O). L.J. is an Investigator of the Howard Hughes Medical Institute.
Footnotes
Declaration of Interests
The authors declare no conflicts of interest in association with this work.
References
- Almeida MV, Dietz S, Redl S, Karaulanov E, Hildebrandt A, Renz C, Ulrich HD, Konig J, Butter F, and Ketting RF (2018). GTSF-1 is required for formation of a functional RNA-dependent RNA Polymerase complex in Caenorhabditis elegans. EMBO J 37. [DOI] [PMC free article] [PubMed] [Google Scholar]
- Andreeva A, and Tidow H (2008). A novel CHHC Zn-finger domain found in spliceosomal proteins and tRNA modifying enzymes. Bioinformatics 24, 2277–2280. [DOI] [PMC free article] [PubMed] [Google Scholar]
- Antczak M, Popenda M, Zok T, Sarzynska J, Ratajczak T, Tomczyk K, Adamiak RW, and Szachniuk M (2016). New functionality of RNAComposer: an application to shape the axis of miR160 precursor structure. Acta Biochim Pol 63, 737–744. [DOI] [PubMed] [Google Scholar]
- Ashkenazy H, Abadi S, Martz E, Chay O, Mayrose I, Pupko T, and Ben-Tal N (2016). ConSurf 2016: an improved methodology to estimate and visualize evolutionary conservation in macromolecules. Nucleic Acids Res 44, W344–350. [DOI] [PMC free article] [PubMed] [Google Scholar]
- Barraud P, Schubert M, and Allain FH (2012). A strong 13C chemical shift signature provides the coordination mode of histidines in zinc-binding proteins. J Biomol NMR 53, 93–101. [DOI] [PubMed] [Google Scholar]
- Batki J, Schnabl J, Wang J, Handler D, Andreev VI, Stieger CE, Novatchkova M, Lampersberger L, Kauneckaite K, Xie W, et al. (2019). The nascent RNA binding complex SFiNX licenses piRNA-guided heterochromatin formation. Nat Struct Mol Biol 26, 720–731. [DOI] [PMC free article] [PubMed] [Google Scholar]
- Bersch B, Bougault C, Roux L, Favier A, Vernet T, and Durmort C (2013). New insights into histidine triad proteins: solution structure of a Streptococcus pneumoniae PhtD domain and zinc transfer to AdcAII. PLoS One 8, e81168. [DOI] [PMC free article] [PubMed] [Google Scholar]
- Brennecke J, Aravin AA, Stark A, Dus M, Kellis M, Sachidanandam R, and Hannon GJ (2007). Discrete small RNA-generating loci as master regulators of transposon activity in Drosophila. Cell 128, 1089–1103. [DOI] [PubMed] [Google Scholar]
- Brunger AT, Adams PD, Clore GM, DeLano WL, Gros P, Grosse-Kunstleve RW, Jiang JS, Kuszewski J, Nilges M, Pannu NS, et al. (1998). Crystallography & NMR system: A new software suite for macromolecular structure determination. Acta Crystallogr D Biol Crystallogr 54, 905–921. [DOI] [PubMed] [Google Scholar]
- Cavanagh J, Fairbrother WJ, Palmer AG, Rance M, and Skelton NJ (2007). Protein NMR Spectroscopy: Principles and Practice, 2nd edn (San Diego, CA: Academic Press; ). [Google Scholar]
- Chan CW, Badong D, Rajan R, and Mondragon A (2019). Crystal structures of an unmodified bacterial tRNA reveal intrinsic structural flexibility and plasticity as general properties of unbound tRNAs. RNA. [DOI] [PMC free article] [PubMed] [Google Scholar]
- Chan PP, and Lowe TM (2016). GtRNAdb 2.0: an expanded database of transfer RNA genes identified in complete and draft genomes. Nucleic Acids Res 44, D184–189. [DOI] [PMC free article] [PubMed] [Google Scholar]
- Czech B, and Hannon GJ (2016). One Loop to Rule Them All: The Ping-Pong Cycle and piRNA-Guided Silencing. Trends Biochem Sci 41, 324–337. [DOI] [PMC free article] [PubMed] [Google Scholar]
- Czech B, Preall JB, McGinn J, and Hannon GJ (2013). A transcriptome-wide RNAi screen in the Drosophila ovary reveals factors of the germline piRNA pathway. Mol Cell 50, 749–761. [DOI] [PMC free article] [PubMed] [Google Scholar]
- Davis IW, Leaver-Fay A, Chen VB, Block JN, Kapral GJ, Wang X, Murray LW, Arendall WB 3rd, Snoeyink J, Richardson JS, et al. (2007). MolProbity: all-atom contacts and structure validation for proteins and nucleic acids. Nucleic Acids Res 35, W375–383. [DOI] [PMC free article] [PubMed] [Google Scholar]
- Debeauchamp JL, Moses A, Noffsinger VJ, Ulrich DL, Job G, Kosinski AM, and Partridge JF (2008). Chp1-Tas3 interaction is required to recruit RITS to fission yeast centromeres and for maintenance of centromeric heterochromatin. Mol Cell Biol 28, 2154–2166. [DOI] [PMC free article] [PubMed] [Google Scholar]
- Delaglio F, Grzesiek S, Vuister GW, Zhu G, Pfeifer J, and Bax A (1995). NMRPipe: a multidimensional spectral processing system based on UNIX pipes. J Biomol NMR 6, 277–293. [DOI] [PubMed] [Google Scholar]
- Dobin A, Davis CA, Schlesinger F, Drenkow J, Zaleski C, Jha S, Batut P, Chaisson M, and Gingeras TR (2013). STAR: ultrafast universal RNA-seq aligner. Bioinformatics 29, 15–21. [DOI] [PMC free article] [PubMed] [Google Scholar]
- Donertas D, Sienski G, and Brennecke J (2013). Drosophila Gtsf1 is an essential component of the Piwi-mediated transcriptional silencing complex. Genes Dev 27, 1693–1705. [DOI] [PMC free article] [PubMed] [Google Scholar]
- Elkayam E, Faehnle CR, Morales M, Sun J, Li H, and Joshua-Tor L (2017). Multivalent Recruitment of Human Argonaute by GW182. Mol Cell 67, 646–658 e643. [DOI] [PMC free article] [PubMed] [Google Scholar]
- Fabry MH, Ciabrelli F, Munafo M, Eastwood EL, Kneuss E, Falciatori I, Falconio FA, Hannon GJ, and Czech B (2019). piRNA-guided co-transcriptional silencing coopts nuclear export factors. Elife 8. [DOI] [PMC free article] [PubMed] [Google Scholar]
- Findeisen M, Brand T, and Berger S (2007). A 1H-NMR thermometer suitable for cryoprobes. Magnetic resonance in chemistry : MRC 45, 175–178. [DOI] [PubMed] [Google Scholar]
- Frankish A, Diekhans M, Ferreira AM, Johnson R, Jungreis I, Loveland J, Mudge JM, Sisu C, Wright J, Armstrong J, et al. (2019). GENCODE reference annotation for the human and mouse genomes. Nucleic Acids Res 47, D766–D773. [DOI] [PMC free article] [PubMed] [Google Scholar]
- Grant T, Rohou A, and Grigorieff N (2018). cisTEM, user-friendly software for single-particle image processing. Elife 7. [DOI] [PMC free article] [PubMed] [Google Scholar]
- Gunawardane LS, Saito K, Nishida KM, Miyoshi K, Kawamura Y, Nagami T, Siomi H, and Siomi MC (2007). A slicer-mediated mechanism for repeat-associated siRNA 5’ end formation in Drosophila. Science 315, 1587–1590. [DOI] [PubMed] [Google Scholar]
- Hadley W (2016). ggplot2: Elegant Graphics for Data Analysis.
- Handler D, Meixner K, Pizka M, Lauss K, Schmied C, Gruber FS, and Brennecke J (2013). The genetic makeup of the Drosophila piRNA pathway. Mol Cell 50, 762–777. [DOI] [PMC free article] [PubMed] [Google Scholar]
- Holm L (2019). Benchmarking Fold Detection by DaliLite v.5. Bioinformatics. [DOI] [PubMed] [Google Scholar]
- Jin Y, Tam OH, Paniagua E, and Hammell M (2015). TEtranscripts: a package for including transposable elements in differential expression analysis of RNA-seq datasets. Bioinformatics 31, 3593–3599. [DOI] [PMC free article] [PubMed] [Google Scholar]
- Jurrus E, Engel D, Star K, Monson K, Brandi J, Felberg LE, Brookes DH, Wilson L, Chen J, Liles K, et al. (2018). Improvements to the APBS biomolecular solvation software suite. Protein Sci 27, 112–128. [DOI] [PMC free article] [PubMed] [Google Scholar]
- Kent WJ, Sugnet CW, Furey TS, Roskin KM, Pringle TH, Zahler AM, and Haussler D (2002). The human genome browser at UCSC. Genome Res 12, 996–1006. [DOI] [PMC free article] [PubMed] [Google Scholar]
- Klenov MS, Sokolova OA, Yakushev EY, Stolyarenko AD, Mikhaleva EA, Lavrov SA, and Gvozdev VA (2011). Separation of stem cell maintenance and transposon silencing functions of Piwi protein. Proc Natl Acad Sci U S A 108, 18760–18765. [DOI] [PMC free article] [PubMed] [Google Scholar]
- Kozomara A, Birgaoanu M, and Griffiths-Jones S (2019). miRBase: from microRNA sequences to function. Nucleic Acids Res 47, D155–D162. [DOI] [PMC free article] [PubMed] [Google Scholar]
- Krotz SP, Ballow DJ, Choi Y, and Rajkovic A (2009). Expression and localization of the novel and highly conserved gametocyte-specific factor 1 during oogenesis and spermatogenesis. Fertil Steril 91, 2020–2024. [DOI] [PMC free article] [PubMed] [Google Scholar]
- Lakomek NA, Ying J, and Bax A (2012). Measurement of (1)(5)N relaxation rates in perdeuterated proteins by TROSY-based methods. J Biomol NMR 53, 209–221. [DOI] [PMC free article] [PubMed] [Google Scholar]
- Le Thomas A, Rogers AK, Webster A, Marinov GK, Liao SE, Perkins EM, Hur JK, Aravin AA, and Toth KF (2013). Piwi induces piRNA-guided transcriptional silencing and establishment of a repressive chromatin state. Genes Dev 27, 390–399. [DOI] [PMC free article] [PubMed] [Google Scholar]
- Lee W, Tonelli M, and Markley JL (2015). NMRFAM-SPARKY: enhanced software for biomolecular NMR spectroscopy. Bioinformatics 31, 1325–1327. [DOI] [PMC free article] [PubMed] [Google Scholar]
- Linge JP, Habeck M, Rieping W, and Nilges M (2003). ARIA: automated NOE assignment and NMR structure calculation. Bioinformatics 19, 315–316. [DOI] [PubMed] [Google Scholar]
- Love MI, Huber W, and Anders S (2014). Moderated estimation of fold change and dispersion for RNA-seq data with DESeq2. Genome Biol 15, 550. [DOI] [PMC free article] [PubMed] [Google Scholar]
- Magoc T, and Salzberg SL (2011). FLASH: fast length adjustment of short reads to improve genome assemblies. Bioinformatics 27, 2957–2963. [DOI] [PMC free article] [PubMed] [Google Scholar]
- Martinez G (2017). tRNAs as primers and inhibitors of retrotransposons. Mob Genet Elements 7, 1–6. [DOI] [PMC free article] [PubMed] [Google Scholar]
- Motamedi MR, Verdel A, Colmenares SU, Gerber SA, Gygi SP, and Moazed D (2004). Two RNAi complexes, RITS and RDRC, physically interact and localize to noncoding centromeric RNAs. Cell 119, 789–802. [DOI] [PubMed] [Google Scholar]
- Muerdter F, Guzzardo PM, Gillis J, Luo Y, Yu Y, Chen C, Fekete R, and Hannon GJ (2013). A genome-wide RNAi screen draws a genetic framework for transposon control and primary piRNA biogenesis in Drosophila. Mol Cell 50, 736–748. [DOI] [PMC free article] [PubMed] [Google Scholar]
- Murano K, Iwasaki YW, Ishizu H, Mashiko A, Shibuya A, Kondo S, Adachi S, Suzuki S, Saito K, Natsume T, et al. (2019). Nuclear RNA export factor variant initiates piRNA-guided co-transcriptional silencing. EMBO J 38, e102870. [DOI] [PMC free article] [PubMed] [Google Scholar]
- Ohtani H, Iwasaki YW, Shibuya A, Siomi H, Siomi MC, and Saito K (2013). DmGTSF1 is necessary for Piwi-piRISC-mediated transcriptional transposon silencing in the Drosophila ovary. Genes Dev 27, 1656–1661. [DOI] [PMC free article] [PubMed] [Google Scholar]
- Ovchinnikov S, Kamisetty H, and Baker D (2014). Robust and accurate prediction of residue-residue interactions across protein interfaces using evolutionary information. Elife 3, e02030. [DOI] [PMC free article] [PubMed] [Google Scholar]
- Popenda M, Szachniuk M, Antczak M, Purzycka KJ, Lukasiak P, Bartol N, Blazewicz J, and Adamiak RW (2012). Automated 3D structure composition for large RNAs. Nucleic Acids Res 40, e112. [DOI] [PMC free article] [PubMed] [Google Scholar]
- Quinlan AR (2014). BEDTools: The Swiss-Army Tool for Genome Feature Analysis. Curr Protoc Bioinformatics 47, 11 12 11–34. [DOI] [PMC free article] [PubMed] [Google Scholar]
- Rosenkranz D (2016). piRNA cluster database: a web resource for piRNA producing loci. Nucleic Acids Res 44, D223–230. [DOI] [PMC free article] [PubMed] [Google Scholar]
- Rozhkov NV, Hammell M, and Hannon GJ (2013). Multiple roles for Piwi in silencing Drosophila transposons. Genes Dev 27, 400–412. [DOI] [PMC free article] [PubMed] [Google Scholar]
- Schorn AJ, Gutbrod MJ, LeBlanc C, and Martienssen R (2017). LTR-Retrotransposon Control by tRNA-Derived Small RNAs. Cell 170, 61–71 e11. [DOI] [PMC free article] [PubMed] [Google Scholar]
- Schorn AJ, and Martienssen R (2018). Tie-Break: Host and Retrotransposons Play tRNA. Trends Cell Biol 28, 793–806. [DOI] [PMC free article] [PubMed] [Google Scholar]
- Schrodinger LLC (2019). The PyMOL Molecular Graphics System, Version 2.0.
- Shaikh TR, Gao H, Baxter WT, Asturias FJ, Boisset N, Leith A, and Frank J (2008). SPIDER image processing for single-particle reconstruction of biological macromolecules from electron micrographs. Nat Protoc 3, 1941–1974. [DOI] [PMC free article] [PubMed] [Google Scholar]
- Shen Y, Delaglio F, Cornilescu G, and Bax A (2009). TALOS+: a hybrid method for predicting protein backbone torsion angles from NMR chemical shifts. J Biomol NMR 44, 213–223. [DOI] [PMC free article] [PubMed] [Google Scholar]
- Sienski G, Donertas D, and Brennecke J (2012). Transcriptional silencing of transposons by Piwi and maelstrom and its impact on chromatin state and gene expression. Cell 151, 964–980. [DOI] [PMC free article] [PubMed] [Google Scholar]
- Siomi MC, Sato K, Pezic D, and Aravin AA (2011). PIWI-interacting small RNAs: the vanguard of genome defence. Nat Rev Mol Cell Biol 12, 246–258. [DOI] [PubMed] [Google Scholar]
- Team, R.C. (2019). R: A Language and Environment for Statistical Computing. [Google Scholar]
- Tegunov D, and Cramer P (2019). Real-time cryo-electron microscopy data preprocessing with Warp. Nat Methods 16, 1146–1152. [DOI] [PMC free article] [PubMed] [Google Scholar]
- Thurmond J, Goodman JL, Strelets VB, Attrill H, Gramates LS, Marygold SJ, Matthews BB, Millburn G, Antonazzo G, Trovisco V, et al. (2019). FlyBase 2.0: the next generation. Nucleic Acids Res 47, D759–D765. [DOI] [PMC free article] [PubMed] [Google Scholar]
- Tidow H, Andreeva A, Rutherford TJ, and Fersht AR (2009). Solution structure of the U11–48K CHHC zinc-finger domain that specifically binds the 5’ splice site of U12-type introns. Structure 17, 294–302. [DOI] [PubMed] [Google Scholar]
- Van Nostrand EL, Pratt GA, Shishkin AA, Gelboin-Burkhart C, Fang MY, Sundararaman B, Blue SM, Nguyen TB, Surka C, Elkins K, et al. (2016). Robust transcriptome-wide discovery of RNA-binding protein binding sites with enhanced CLIP (eCLIP). Nat Methods 13, 508–514. [DOI] [PMC free article] [PubMed] [Google Scholar]
- Wilkinson ML, Crary SM, Jackman JE, Grayhack EJ, and Phizicky EM (2007). The 2’-O-methyltransferase responsible for modification of yeast tRNA at position 4. RNA 13, 404–413. [DOI] [PMC free article] [PubMed] [Google Scholar]
- Yoshimura T, Toyoda S, Kuramochi-Miyagawa S, Miyazaki T, Miyazaki S, Tashiro F, Yamato E, Nakano T, and Miyazaki J (2009). Gtsf1/Cue110, a gene encoding a protein with two copies of a CHHC Zn-finger motif, is involved in spermatogenesis and retrotransposon suppression in murine testes. Dev Biol 335, 216–227. [DOI] [PubMed] [Google Scholar]
- Yoshimura T, Watanabe T, Kuramochi-Miyagawa S, Takemoto N, Shiromoto Y, Kudo A, Kanai-Azuma M, Tashiro F, Miyazaki S, Katanaya A, et al. (2018). Mouse GTSF1 is an essential factor for secondary piRNA biogenesis. EMBO Rep 19. [DOI] [PMC free article] [PubMed] [Google Scholar]
- Yu Y, Gu J, Jin Y, Luo Y, Preall JB, Ma J, Czech B, and Hannon GJ (2015). Panoramix enforces piRNA-dependent cotranscriptional silencing. Science 350, 339–342. [DOI] [PMC free article] [PubMed] [Google Scholar]
Associated Data
This section collects any data citations, data availability statements, or supplementary materials included in this article.
Supplementary Materials
Data Availability Statement
Coordinates and NMR data have been deposited in the Protein Data Bank (PDB: 6X46) and the Biological Magnetic Resonance Bank (BMRB: 30754). Cryo-electron microscopy maps for complexes isolated from full-length MmGtsf1 protein and ZnF1 domain pull-downs have been deposited in the EMDB (EMD-22040 and EMD-22041, respectively). Sequencing data have been deposited in Gene Expression Omnibus (GEO) repository with accession numbers GSE151110 (Sf9 RNA pull-down), GSE151108 (eCLIP data from P19 cells), GSE151107 (eCLIP data from OSS cells), GSE151109 (eCLIP data from OSS cells using CRISPR-tagged Asterix). Custom gene annotation files and data processing scripts are available on GitHub (https://github.com/jonipsaro/asterix_gtsf1). Intermediate files used for generating gene annotations or processing of the data are available upon request.