

Abstract
Background.
A toe-extension movement pattern may contribute to metatarsophalangeal joint deformity and ulceration in people with diabetes. We sought to quantify the relationship between toe extension magnitude and variability during three functional tasks (ankle range of motion, sit to stand, walking) with metatarsophalangeal joint deformity, and identify potential mechanisms associated with a toe-extension movement pattern.
Methods.
Individuals with diabetes and peripheral neuropathy were included (n=60). Metatarsophalangeal joint deformity was assessed using computed tomography (CT). Toe-extension movement was quantified using 3-dimensional motion capture. Linear regression was used to investigate the role of toe-extension movement pattern on metatarsophalangeal joint deformity. Regression analysis was used to identify mechanisms (neuropathy severity, foot intrinsic muscle deterioration ratio, ankle dorsiflexion range of motion) contributing to toe-extension movement pattern.
Findings.
Toe extension with each functional task as well as the mean and coefficient of variation across all tasks were significantly related to metatarsophalangeal joint deformity (range of correlation coefficients= (−0.386, 0.692), p≤0.001). Ankle dorsiflexion range of motion was associated with mean toe extension across all tasks (rsp= −0.282, p=0.029). Neuropathy severity and foot intrinsic muscle deterioration ratio were associated with toe extension variability (rsp= −0.373, p=0.003 and rsp= −0.266, p=0.043; respectively).
Interpretation.
Greater magnitude and lower variability of a toe-extension movement pattern was found to be associated with metatarsophalangeal joint deformity. These findings may support clinical assessment and treatment of movement across more than one task.
Keywords: neuropathy, biomechanics, gait, rehabilitation, foot, ankle
1.0. Introduction
There are 34.2 million people with diagnosed diabetes mellitus (DM) in the United States, representing 10.5% of the population (Centers for Disease Control and Prevention, 2020). Foot ulceration is a substantial problem for individuals with DM, with between 19 and 34% of people with DM affected by ulceration (Armstrong et al., 2017). Reulceration occurs in 65% of individuals within 5 years (Armstrong et al., 2017). Foot deformity is one of several factors associated with reulceration. In the forefoot, presence of metatarsophalangeal joint (MTPJ) hyperextension deformity is common and can lead to ulceration under the metatarsal head or the toe (Lavery et al., 1998; Robertson et al., 2002). Preventing and reducing MTPJ hyperextension deformity is, therefore, of great interest in slowing the trajectory toward ulceration.
Toe-extension movement during common tasks has been found to relate to MTPJ hyperextension deformity (Cheuy et al., 2016b; Zellers et al., 2020). Weak to moderate relationships have been reported between 2nd MTPJ hyperextension deformity and toe-extension movement during common tasks (i.e., active ankle dorsiflexion range of motion, sit to stand transfer, and swing phase of gait) (Cheuy et al., 2016b; Zellers et al., 2020). However, it is unknown whether consistently using a toe-extension movement pattern across tasks bears a stronger association with 2nd MTPJ hyperextension deformity than demonstrating this movement pattern during a single task.
Whether higher movement variability is adaptive or maladaptive depends on the context. High variability in task outcome has been found to be undesirable (Hamill et al., 2012). For example, individuals with a history of falls or neuropathy demonstrate greater variability in certain output gait parameters (e.g., stride length, toe clearance) than healthy control participants (Hausdorff, 2007; Suda et al., 2019). However, variability in movement trajectory – the variability of joint movements contributing to how a given task is accomplished – appears to be adaptive (Hamill et al., 2012; Latash, 2012; Latash et al., 2002; Lipsitz, 2002). For example, with motor learning, experts skilled in a particular task will demonstrate less variability in task outcome but greater variability in movement trajectory than novices (Hamacher and Zech, 2018). In a sports medicine context, lack of variability in movement trajectory has been associated with lower extremity overuse conditions (Hamill et al., 2012). Similar to individuals with overuse conditions, a lack of variability of foot joint movement in people with DM, particularly of joints positioned at extreme range of motion as is the case with MTPJ hyperextension deformity, could be detrimental for foot health.
There are a variety of mechanisms proposed to underlie a toe-extension movement pattern in individuals with DM. Peripheral neuropathy is a dysfunction of the peripheral nerves, affecting up to about half of people with DM (Kärvestedt et al., 2011; Soheilykhah et al., 2013; Young et al., 1993). Peripheral neuropathy results in sensory, motor, and autonomic changes that begin distally in the hands and feet and progress proximally. Toe-extension movement pattern could possibly be associated with both sensory and motor changes impacting motor planning. Atrophy of the foot intrinsic muscles can occur with peripheral neuropathy and has been previously found to relate to 2nd MTPJ hyperextension deformity (Cheuy et al., 2013b). The activation of the more proximal toe extensors combined with the absence of the foot intrinsic muscles has been proposed to result in toe extension during functional tasks (Zellers et al., 2020). Finally, restricted ankle range of motion has been proposed to relate to toe-extension movement (Cheuy et al., 2016a). With walking, toe extension may be compensating for a lack of ankle dorsiflexion to clear the foot in swing phase (Cheuy et al., 2016b). The association of these factors – neuropathy, muscle deterioration, and restricted ankle range of motion – with the variability of task performance across multiple motor tasks are unknown.
The purpose of this study was to (1) quantify the relationship between toe-extension movement pattern magnitude and variability during a combination of tasks and MTPJ deformity; and (2) identify potential mechanisms associated with toe-extension movement pattern magnitude and variability. We hypothesized that (1) toe extension across several tasks would be more strongly related to MTPJ deformity than toe extension on a single task; and (2) high neuropathy severity, high foot intrinsic muscle deterioration ratio (fat to muscle volume), and restricted ankle dorsiflexion range of motion would be associated with high-magnitude and low-variability toe-extension movement pattern.
2.0. Methods
2.1. Study Design and Participants
Baseline time point data from participants included in an ongoing longitudinal study (ClinicalTrials.gov: NCT02616263) were included in this cross-sectional, retrospective analysis. Individuals with type 2 DM and peripheral neuropathy were included in this study. Presence of peripheral neuropathy was defined as an inability to sense a 5.07 Semmes-Weinstein monofilament on at least one of six locations on the plantar aspect of the foot, a vibration perception threshold greater than 25V on the plantar aspect of the great toe (Armstrong et al., 1998), or an examination score greater than or equal to 2 on the Michigan Neuropathy Screening Instrument (Moghtaderi et al., 2006). Exclusion criteria were peripheral neuropathy with a causal factor other than DM, severe arterial disease (defined as an ankle-brachial index less than 0.9 or greater than 1.3) (American Diabetes Association, 2003; Brooks et al., 2001), lower extremity amputation involving multiple toes, acute shoulder injury (relevant for the longitudinal study but not the present analysis, as an upper extremity intervention was provided), pregnancy, weight greater than 180 kg due to magnetic resonance scanner restrictions, presence of a neuropathic ulcer, or age greater than 75. This study was approved by the Institutional Review Board (Washington University School of Medicine in St. Louis, St. Louis, Missouri, USA).
All tests and measures were completed on one lower limb in each individual. The limb of interest was selected based on the side with fewest complications unrelated to DM, the most consistent toe-extension movement with dorsiflexion (on visual observation), and the most metatarsophalangeal joint extension at rest (on visual observation).
All participants were assessed for height, weight, and glycemic status via hemoglobin A1c (HbA1c).
2.2. MTPJ Deformity Assessment
Second MTPJ hyperextension was quantified using computed tomography (CT) (Siemens Biograph 40 CT, Siemens Medical Systems, Inc., Iselin, New Jersey, USA). The supplement of the angle between the long axis of the 2nd metatarsal and its corresponding proximal phalanx is reported, with greater values indicating greater MTPJ extension (Cheuy et al., 2016a). Participants were positioned in supine with the ankle in a resting neutral position (30 degrees of plantarflexion). Scan parameters were 40 images per rotation, 370 ms rotation time, 24 mm collimation, 0.6 mm slice thickness, 220 mAs, and 120kVp.
2.3. Movement Assessment
Toe-extension movement was measured using 3D motion capture during three tasks –ankle plantar flexion/dorsiflexion active range of motion, sit to stand, and walking. For ankle plantar flexion/dorsiflexion active range of motion, participants were positioned in long-sitting on a plinth with the knee extended and foot off the end of the plinth. Participants were encouraged to actively move their ankle alternatively into maximal plantar flexion and dorsiflexion. Toe extension excursion was calculated as the difference between toe extension on static standing and peak toe extension during the ankle range of motion task. Participants performed 5 trials of active ankle range of motion, of which the 2 trials with the greatest toe extension were averaged and included in analysis.
For the sit to stand task (figure 1), participants were positioned in sitting with the hips and knees at approximately 90 degrees on an armless bench. Participants were instructed to stand within a count of three seconds without using their arms to assist. Toe extension excursion was calculated as the difference between toe extension on static standing and peak toe extension during the sit to stand task. Data from 3 trials were averaged.
Figure 1.
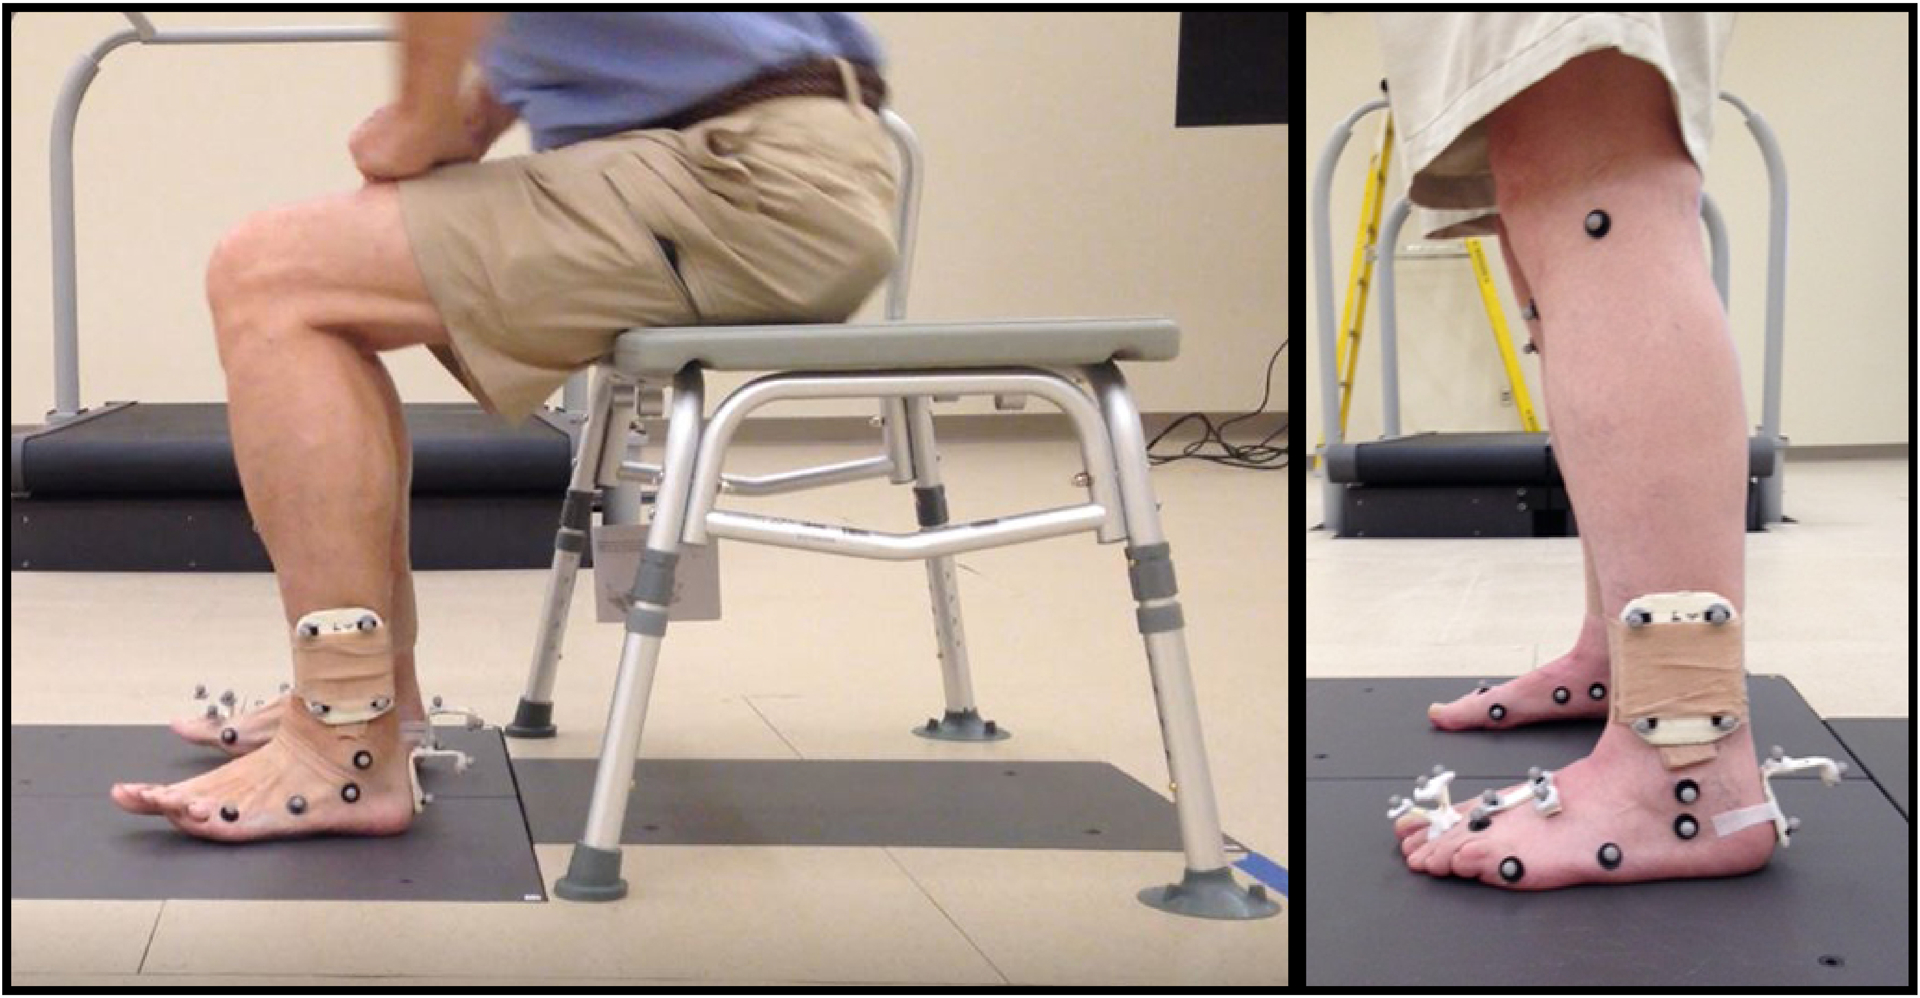
Sit to stand task. Example of toe extension movement pattern as participant moves from sitting to standing (left). Marker set (right).
For the walking task, participants were asked to walk at their self-selected speed over in-ground force plates. Each trial consisted of only 2 strides for foot safety, as participants are at high risk of skin breakdown on their feet and were being tested barefoot. Trials were repeated until 6 steps were obtained with clean foot contacts on the force plates. Toe extension excursion was calculated as the difference between toe extension on static standing and toe extension at 50% of swing phase. Data from 6 steps were averaged.
A ten camera system (Vicon MX, Los Angeles, California, USA) collecting at 100 Hz was used to record motion of the lower leg and foot using a modified Oxford marker set and three segment model (shank, hindfoot, forefoot) (Hastings et al., 2014; Wright et al., 2011). Kinematics were collected at 1000 Hz via in-ground force plates (FP4060–10, Bertec Corporation, Columbus, OH) and were used only to define events during the sit to stand and walking trials. Motion capture data was synchronized and post-processed using Vicon Nexus (Vicon Motion Systems Ltd, Oxford, United Kingdom) and Visual 3D software (C-Motion Inc, Germantown, Maryland, USA). Peak second toe extension angle (sagittal plane) was calculated. To adjust for any differences in positioning of the toe jig across participants, the toe extension angle used in data analysis was defined as peak toe extension angle minus toe extension angle during static standing.
2.4. Mechanisms Underlying Movement Pattern
Three mechanisms underlying toe-extension movement pattern were examined – neuropathy severity, foot intrinsic muscle deterioration ratio, and ankle dorsiflexion range of motion.
Neuropathy severity was assessed using the Michigan Neuropathy Screening Instrument (Moghtaderi et al., 2006). This instrument uses a series of objective clinical findings (e.g., skin changes on the feet, ankle reflexes, and vibration sensation at the great toe). Higher values indicate greater neuropathy severity, with a maximum score of 8 and a score greater or equal to 2.5 indicating presence of neuropathy (Moghtaderi et al., 2006).
Foot intrinsic muscle deterioration ratio was assessed using magnetic resonance imaging (MRI) (Siemens Prisma Fit 3T, Siemens Medical Systems, Malvern, PA) as previously described (Zellers et al., 2020). The participant was positioned in supine. An extremity coil was positioned around the foot. Images were segmented and quantified for muscle and fat (Cheuy et al., 2013a). A ratio of fat to muscle volume, or muscle deterioration ratio, was used for analysis with higher values indicating worse muscle deterioration.
Peak ankle dorsiflexion was obtained from CT using the scanning parameters described above. Participants were asked to maximally dorsiflex their ankles for the scan. Two lines were drawn – one from the bottom of the 2nd metatarsal head to the bottom of the posterior calcaneus and one down the middle of the tibia. The angle formed from the intersection of these lines is reported with higher values indicating greater dorsiflexion.
2.5. Statistical Analysis
Outcome data were checked via the Shapiro-Wilk test to ensure normality. The following variables did not meet the assumptions of normality on the Shapiro-Wilk test, and non-parametric statistics were used: diabetes duration, HbA1c, Michigan Score, foot intrinsic muscle deterioration ratio, ankle dorsiflexion angle on CT, and 2nd metatarsophalangeal joint excursion with ankle dorsiflexion/plantarflexion range of motion and coefficient of variation across all tasks. Descriptive statistics are reported as mean and standard deviation; for data that did not meet the normality assumption, median and inter-quartile range are reported. The 95% confidence interval (CI) is reported for descriptive analysis. Missing data is addressed by reporting the total number of participants included for each variable. Coefficient of variation (CoV) was calculated to quantify within-subject variability in toe-extension movement pattern between the three tasks. CoV was defined as the standard deviation divided by the mean across the three tasks within an individual.
Correlation analysis was used to determine the strength of relationship between 2nd MTPJ deformity and toe-extension movement during each of the three tasks (sit to stand, walking, ankle active range of motion), mean toe-extension movement during the three tasks, and CoV of toe-extension movement across the three tasks. Pearson correlation coefficient (r) is reported for data that met the normality assumption. Spearman’s rho (rsp) is reported for non-normal data. Effect size of correlation coefficients were interpreted as small (≥0.1), medium (≥0.3), and large (≥0.5) (Cohen J., 1992). In order to determine whether toe-extension movement during a single task was as strong of a predictor of MTPJ deformity as toe-extension across more than one task, we built a regression model predicting 2nd MTPJ deformity with toe-extension movement on each task, mean toe-extension movement during the three tasks, and CoV of toe-extension movement across the three tasks as independent variables. We anticipated that multicollinearity could be a concern, and determined a priori that a variance inflation factor greater than 10 would result in removal of that variable. A regression model was then built using backward model selection.
To investigate our question regarding mechanisms, correlation analysis was used to identify the strength of relationship between either mean or CoV of toe-extension movement pattern and the mechanism indicators (Michigan Neuropathy Screening Instrument score, foot intrinsic muscle deterioration ratio, peak ankle dorsiflexion on CT). Mechanism indicators with p < 0.2 on correlation analysis were then entered into a multiple linear regression model to predict either mean or CoV of toe-extension movement pattern. The cutoff p-value of 0.2 was used because the conventional level (such as 0.05) can fail in identifying variables known to be important (Mickey and Greenland, 1989). All the statistical tests were two-sided at a significance level 0.05.
3.0. Results
3.1. Participant Demographics
Sixty participants (26 males, 34 females) were included. Participant demographics are described in table 1.
Table 1.
Descriptive statistics for all included variables
| Variable | n | Descriptive Statistic* | 95% CI |
|---|---|---|---|
| Participant Demographics | |||
| Age (years) | 60 | 67±6 | 65–69 |
| Height (cm) | 60 | 168.8±9.5 | 165.6–170.7 |
| Weight (kg) | 60 | 99.6±20.9 | 93.1–103.9 |
| Body mass index (kg/m2) | 60 | 35±7 | 33–37 |
| Diabetes duration (years) | 60 | 12[7–20] | 12–17 |
| Hemoglobin A1c (%) | 59 | 6.8[6.1–7.8] | 6.7–7.4 |
| 2nd Metatarsophalangeal joint extension on CT (degrees) | 60 | 53.0±12.8 | 49.2–55.9 |
| Michigan Score | 60 | 5[4–6] | 4.2–5.0 |
| Foot intrinsic muscle deterioration ratio | 58 | 0.26[0.21–0.35] | 0.26–0.36 |
| Ankle dorsiflexion angle on CT (degrees) | 60 | 99.2[92.7–102.9] | 95.9–100.3 |
| 2nd Metatarsophalangeal joint excursion (degrees) | |||
| Ankle dorsiflexion/plantarflexion active range of motion | 58 | 44[36–54] | 42–50 |
| Sit to stand | 60 | 17±11 | 13–19 |
| Walking: 50% swing phase | 60 | 28±11 | 24–30 |
| Mean for all tasks | 60 | 30±10 | 27–32 |
| Coefficient of variation, within individual across all tasks | 60 | 0.50[0.37–0.71] | 0.49–0.64 |
CI: Confidence Interval.
Values are Median[inter-quartile range] for non-normal data or Mean±SD for normal data.
3.2. Relationship between toe-extension movement pattern and MTPJ deformity
MTPJ deformity was related to toe-extension movement pattern during sit to stand (p < 0.001), walking (p < 0.001), ankle range of motion (p < 0.001), the mean of all tasks (p < 0.001), and the CoV of all tasks (p = 0.002). Results of univariate analysis for toe-extension movement pattern and MTPJ deformity are displayed in Table 2.
Table 2.
Correlation coefficients for univariate analysis of toe-extension movement pattern on three functional tasks as it relates to metatarsophalangeal joint deformity.
| Toe-extension movement pattern variable | Relationship to metatarsophalangeal joint deformity (correlation coefficient, p-value) |
|---|---|
| Sit to stand | r=0.586, p<0.001 |
| Walk, 50% swing phase | r=0.650, p<0.001 |
| Ankle range of motion | rsp=0.539, p<0.001 |
| Mean toe-extension, all tasks | r=0.692, p<0.001 |
| Coefficient of variation across all tasks | rsp= −0.386, p=0.002 |
Multivariate analysis including all toe-extension movement pattern variables predicting MTPJ deformity was limited due to multicollinearity. The mean toe extension of all three tasks was removed as it had the largest variance inflation factor. Upon removal of mean toe extension of all three tasks, all independent variables had a variance inflation factor less than 10. Using backward model selection, the final model retained toe extension with sit to stand (regression coefficient = 0.326, p = 0.026) and toe extension with walking (regression coefficient = 0.541, p < 0.001) as independent variables accounting for 47% of the variance of MTPJ deformity (R2 = 0.471).
3.3. Variability of MTPJ extension movement and potential mechanisms
Results of correlation analysis are shown in Figure 2. For mean toe-extension movement pattern for the three tasks, only peak ankle dorsiflexion on CT scan had a statistically significant relationship (rsp = −0.282, p = 0.029), therefore, a multivariate model was not built. For CoV toe-extension movement pattern across the three tasks, both Michigan score (rsp = −0.373, p = 0.003) and foot intrinsic muscle deterioration ratio (rsp = −0.266, p = 0.043) had statistically significant relationships and were included in the multivariate regression. Together, Michigan score (regression coefficient = −0.049, p = 0.046) and foot intrinsic muscle deterioration ratio (regression coefficient = −0.411, p=0.032) accounted for 18.4% of the variation in CoV toe-extension movement pattern across three tasks (R2 = 0.184).
Figure 2.
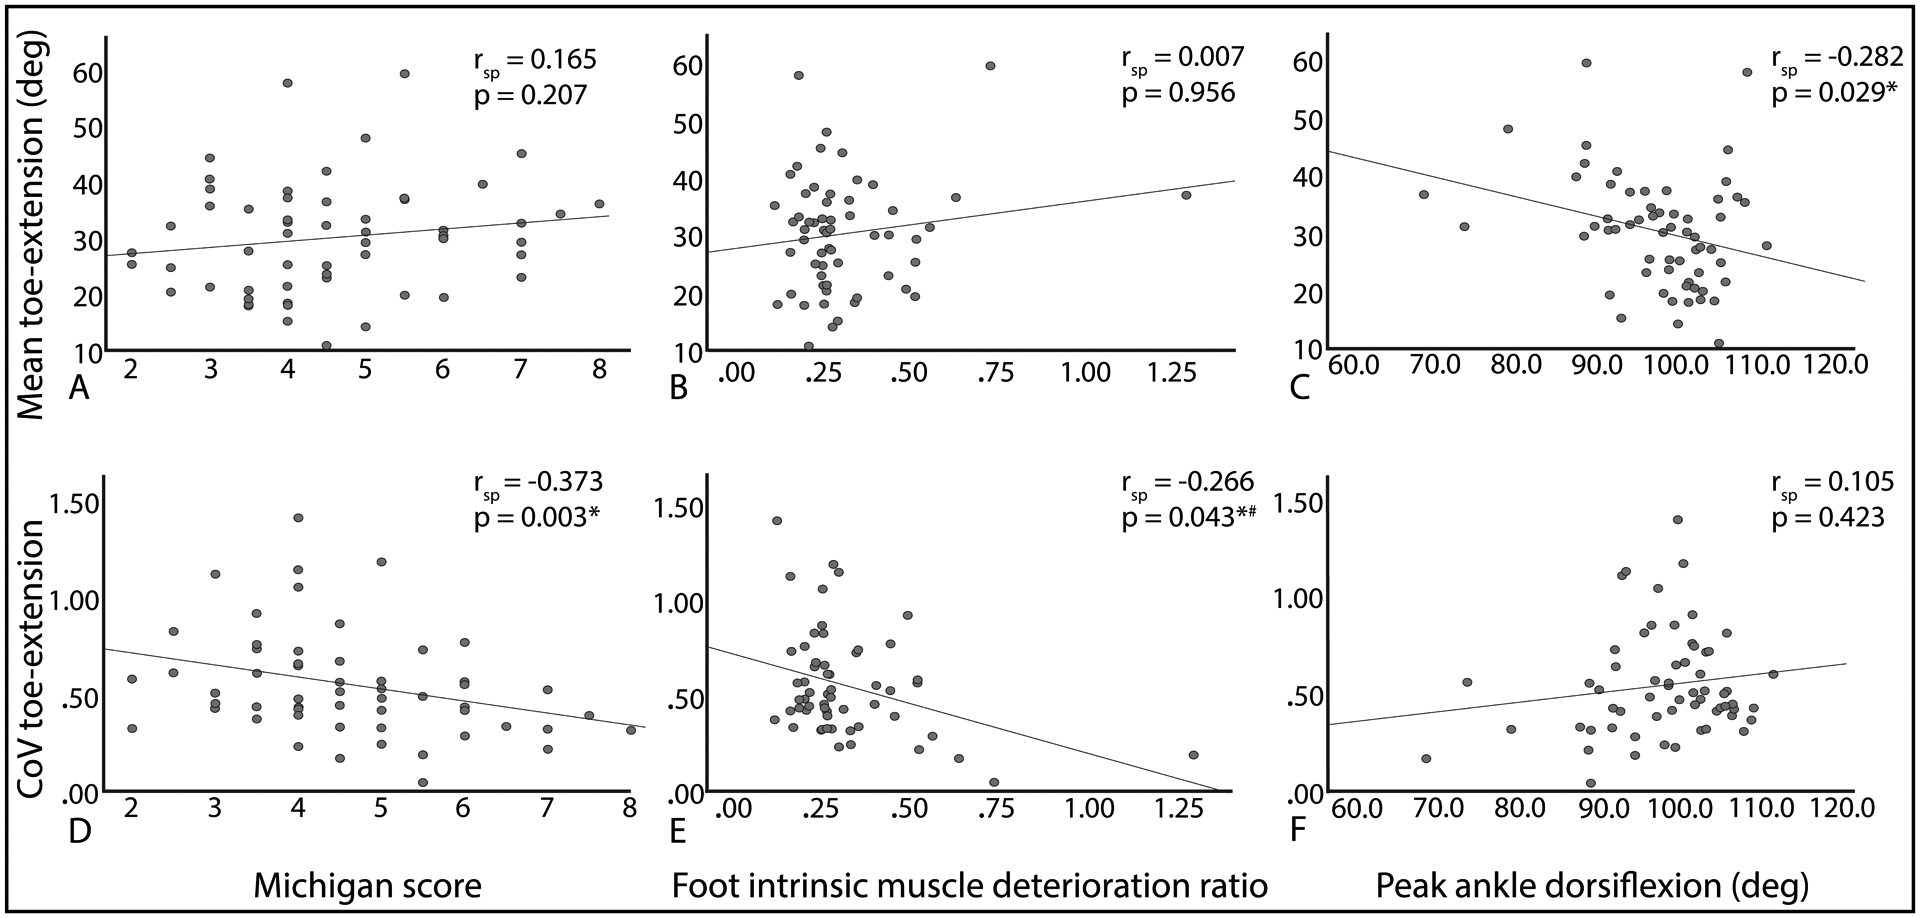
Scatterplots of relationship between toe-extension movement pattern mean (A-C) and coefficient of variation (CoV; D-F) mechanism indicators [Michigan score (A, D); foot intrinsic muscle deteroration ratio (B, E); and peak ankle dorsiflexion on CT (C, F)] on univariate analysis. deg: degree. #Outlier with muscle deterioration ratio of 1.30 is a physiologically reasonable value. With removal of this outlier, rsp = −0.227, p=0.089.
4.0. Discussion
This is the first study to investigate movement pattern variability across common functional tasks in individuals with DM. We found that assessing toe-extension movement pattern magnitude and variability across multiple tasks may be helpful to consider in individuals at risk for MTPJ hyperextension deformity and ulceration. A combination of toe-extension movement pattern magnitude on two functional tasks (sit to stand and swing phase of walking) predicted 47% of the variance in MTPJ deformity. A lack of ankle dorsiflexion appears to underlie toe-extension movement pattern magnitude as their relationship was weak yet statistically significant, suggesting other factors not investigated in this study (i.e. history of acute plantar plate injury, shoe wear, etc.) may also contribute to toe-extension movement pattern magnitude. Higher neuropathy severity and poor foot intrinsic muscle deterioration ratio had weak to moderate relationships with low toe-extension movement pattern variability. The findings of this study support the need to clinically assess movement across a variety of tasks. Interventions aimed at movement retraining may also need to promote carryover of training in one task to performance across a variety of tasks.
We observed stronger relationships between 2nd MTPJ hyperextension deformity and toe extension during ankle range of motion, at 50% swing phase of walking, and with sit to stand than those previously reported by Cheuy, et al. (r=0.35, 0.47, and 0.48, respectively) (Cheuy et al., 2016b). Additionally, we found stronger relationships for toe extension during ankle range of motion, toe extension during swing phase of walking, and sit to stand transfer than previously reported (Cheuy et al., 2016b). While we did not observe any one task or metric to be a significantly stronger predictor of foot deformity, we did find the addition of a second task improved a regression model to predict foot deformity. This finding highlights the potential value of assessing patient movement across a variety of tasks in clinical settings. Our anecdotal experience is that it is easier to observe a toe-extension movement pattern during a slower task, like the sit-to-stand transfer, than a faster task, like walking. Appreciating that all tasks were significantly related to foot deformity supports the idea that clinicians can use tasks where it may be easier to visualize a toe-extension movement pattern, when quantitative motion capture technologies are often unavailable. Additionally, relationships between toe-extension movement pattern and MTPJ hyperextension deformity suggest that reducing toe-extension movement may be a target for intervention and is an avenue for future investigation. Motor pattern retraining may be beneficial to consider across a variety of common, functional tasks (Ferreira et al., 2019; Sartor et al., 2014).
The pros and cons of movement variability have been explored within a single task in individuals with DM, however, variability across movement tasks is a novel area of investigation. We hypothesized that low variability of a toe-extension movement pattern would be problematic in this group of individuals with DM. The idea of low variability contributing to ulceration has been previously investigated in the context of plantar pressures (Cavanagh et al., 1998). The hypothesis that low-variability in plantar pressures during walking could contribute to development of plantar ulcers was not supported in this prior study because there were no differences observed in plantar pressure variability between people with and without DM (Cavanagh et al., 1998). To our knowledge, our study is the first to look at movement variability across tasks in individuals with DM. We found that toe-extension movement pattern variability has a weak relationship with MTPJ deformity.
Investigating MTPJ hyperextension deformity is of interest due to its association with ulceration (Lavery et al., 1998; Robertson et al., 2002). As only 5 individuals (8%) included in the study had a history of ulcer, we did not perform a quantitative analysis to determine whether mean or CoV of toe-extension movement pattern was observed in a greater number of individuals with history of ulceration. Rather, we qualitatively examined these data retrospectively using a dot plot (Figure 3). We found the CoV across the three tasks to cluster four of the five participants with a history of ulceration, but movement pattern magnitude (mean of the three tasks) did not. The four participants with low CoV and history of ulceration all reported a history of ulcers on the forefoot, whereas, the participant with higher CoV and history of ulceration reported a history of ulceration only on the heel. As this is an incidental finding, future studies with larger participant numbers should consider examining the association between variability of toe-extension movement across tasks and ulceration history.
Figure 3.
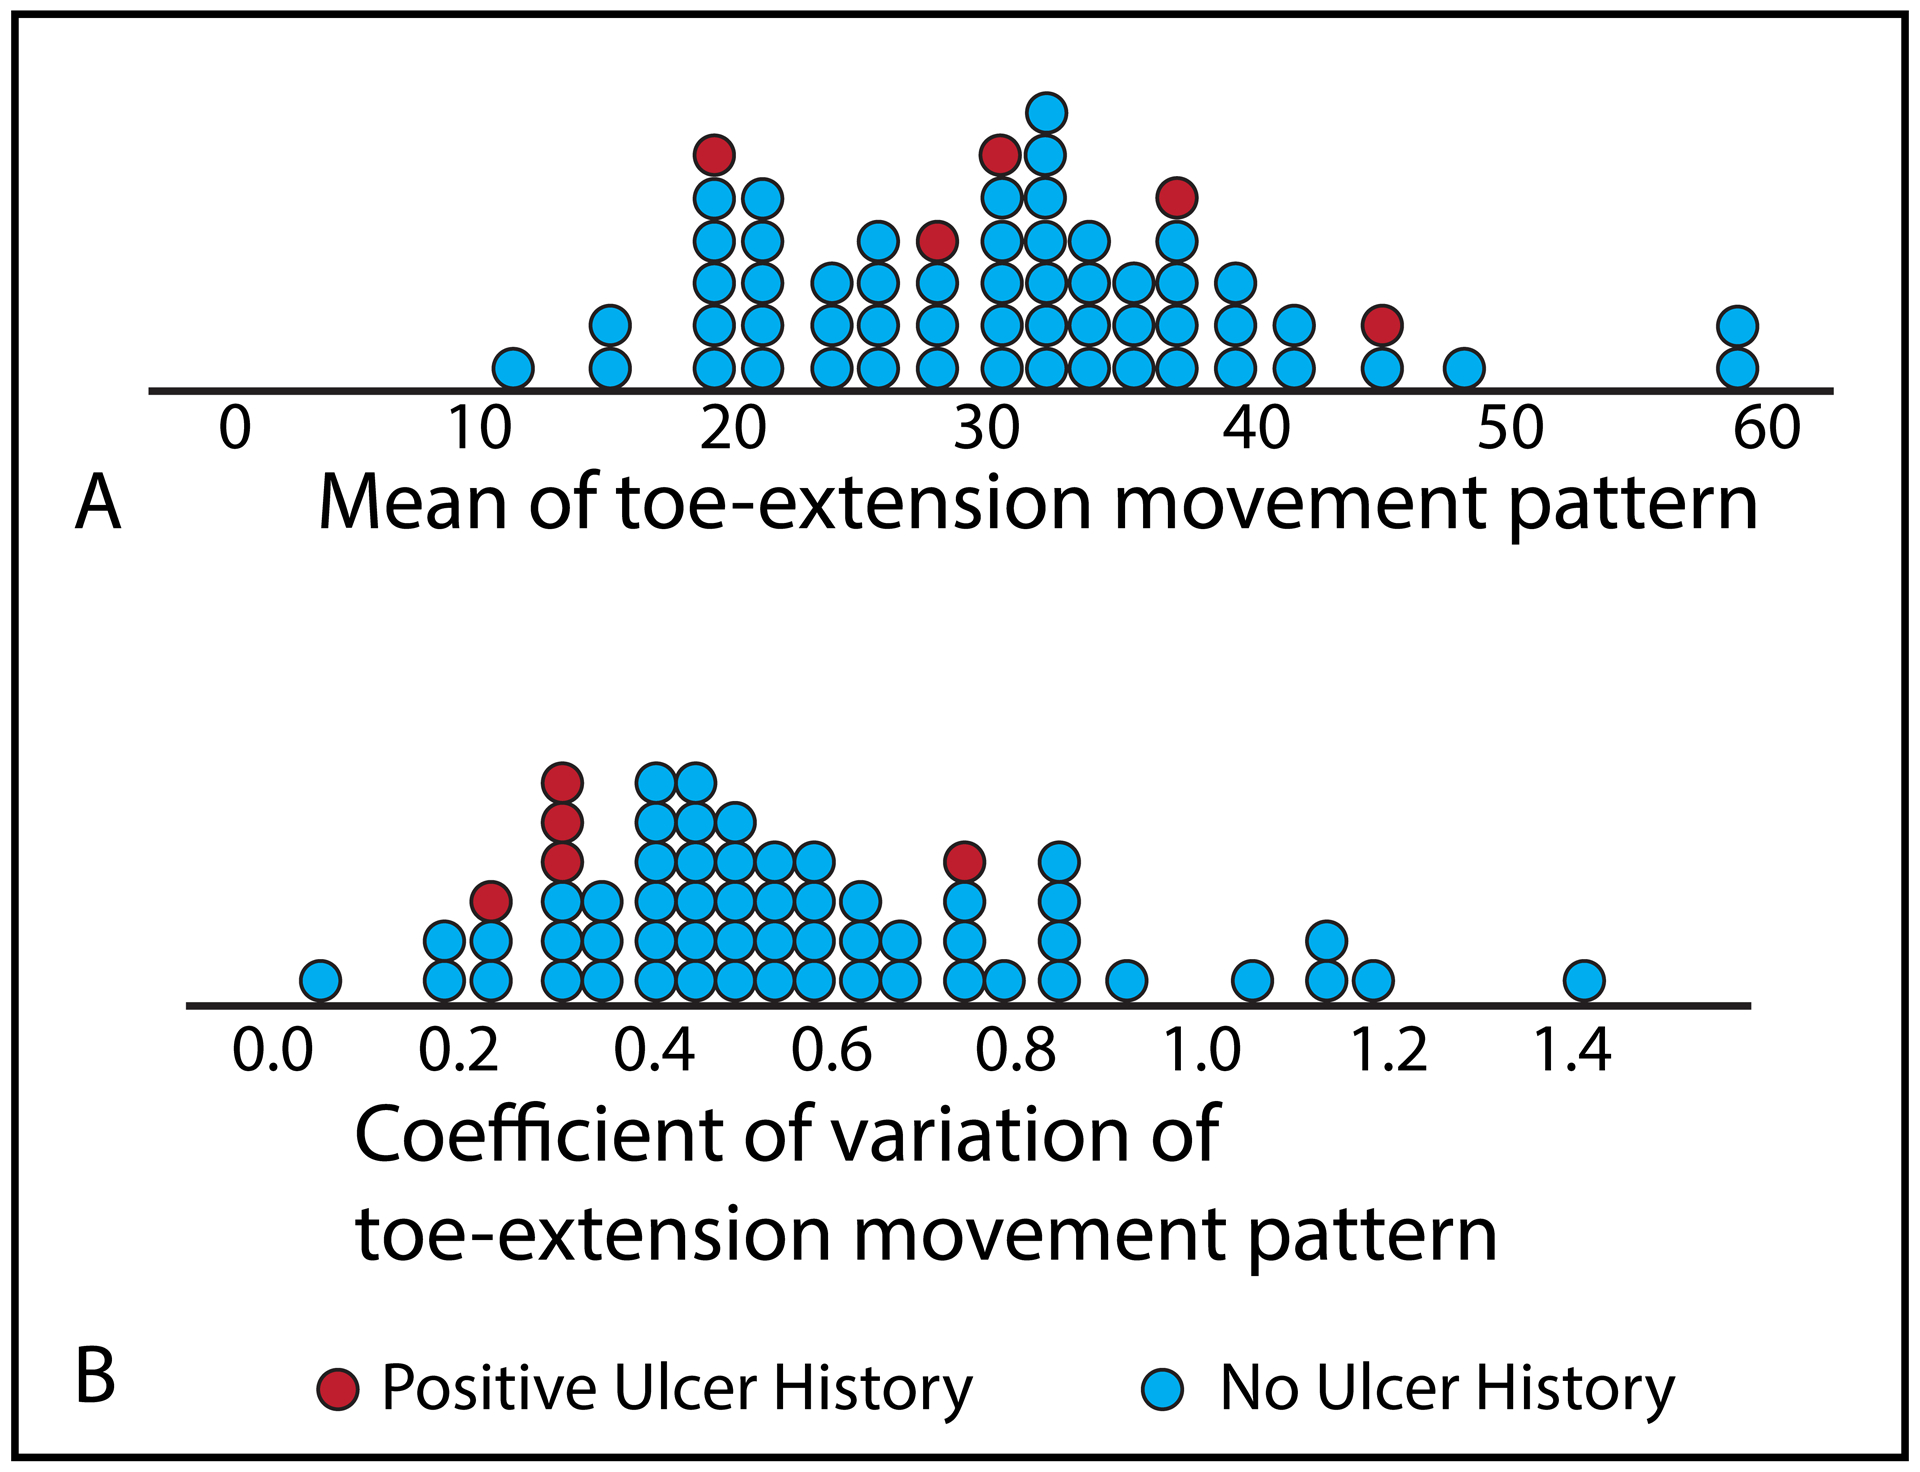
Dot plots of toe-extension movement pattern magnitude in degrees (A) and variability (B).
We hypothesized that toe-extension movement magnitude and variability could be due to several underlying factors, including neuropathy severity, foot intrinsic muscle deterioration, and ankle dorsiflexion range of motion. We observed that some of these factors have weak to moderate relationships to toe-extension movement pattern, with neuropathy severity and foot intrinsic muscle deterioration ratio relating to movement pattern variability and ankle dorsiflexion range of motion relating to movement pattern magnitude. Peripheral neuropathy leads to sensory and motor changes, particularly in the distal foot. Impaired afferent (i.e. sensory, including proprioceptive) neural input has been suggested to contribute to sagittal plane gait variability and impaired toe clearance (Dingwell et al., 1999; Suda et al., 2019). Additionally, peripheral neuropathy can result in atrophy of the distal foot muscles, which has been previously found to relate to MTPJ hyperextension deformity (Cheuy et al., 2013b; Zellers et al., 2020). Therefore, it is not surprising that both peripheral neuropathy severity and foot intrinsic muscle deterioration ratio would relate to movement variability. With regard to the relationship between ankle dorsiflexion and toe-extension movement pattern magnitude, a past study identified ankle dorsiflexion range of motion to inconsistently moderate the relationship between magnitude of toe extension movement and MTPJ deformity (Cheuy et al., 2016b). Together with our findings, toe extension may be a way of compensating for a lack of ankle dorsiflexion to clear the toes during gait or help bring the center of mass forward during sit to stand.
There are important study limitations to consider. This is a cross-sectional study, so causative relationships between toe-extension movement and MTPJ hyperextension deformity are speculative. Additionally, mechanisms underlying MTPJ hyperextension deformity are not mutually exclusive. For example, individuals with more severe peripheral neuropathy are likely to have consequent foot intrinsic muscle wasting. There were also relatively few participants with a history of ulceration limiting investigation into the association between movement variability and ulceration history. While beyond the scope of this study, it seems that toe-extension movement could be something that could be addressed through interventions aimed at motor retraining, and should be considered in future studies.
5.0. Conclusions
High magnitude, low variability toe-extension movement pattern during common, functional movements is associated with greater MTPJ hyperextension deformity. The combination of low-variability and high-magnitude toe extension across movements is also associated, respectively, with neuropathic changes in the lower limb and lack of ankle dorsiflexion. Future longitudinal studies, particularly investigating the ability to minimize a toe-extension movement pattern across multiple tasks and its effect on mitigating MTPJ hyperextension deformity and ulceration/reulceration would be helpful in providing guidance for the clinical care of individuals with DM and peripheral neuropathy.
Acknowledgements
The authors would like to acknowledge Kathryn Bohnert, Darrah Snozek, and Christopher Sorensen for their contributions to the subject recruitment and data collection and Haley Brogan, Jessica Stumpf, Kaitlyn Winter, Jadean Hoff, Nick Youmans, Mary Ellis, Whitney Korgan, and Nick Schroeder for their assistance with data processing.
Funding:
This work was supported by the National Institute of Diabetes and Digestive and Kidney Diseases of the National Institutes of Health (grant numbers R01 DK107809, F32 DK123916) and the National Institutes of Health (award T32 HD007434).
Declaration of interest:
The authors report grant funding from the National Institutes of Health, but have no additional conflicts of interest.
References
- American Diabetes Association, 2003. Peripheral arterial disease in people with diabetes. Diabetes Care 26, 3333–3341. [DOI] [PubMed] [Google Scholar]
- Armstrong D, Lavery L, Vela S, Quebedeaux T, Fleischli J, 1998. Choosing a practical screening instrument to identify patients at risk for diabetic foot ulceration. Arch. Intern. Med 158, 289–292. [DOI] [PubMed] [Google Scholar]
- Armstrong DG, Boulton AJM, Bus SA, 2017. Diabetic foot ulcers and their recurrence. N. Engl. J. Med 376, 2367–2375. [DOI] [PubMed] [Google Scholar]
- Brooks B, Dean R, Patel S, Wu B, Molyneaux L, Yue DK, 2001. TBI or not TBI: That is the question. Is it better to measure toe pressure than ankle pressure in diabetic patients? Diabet. Med 18, 528–532. [DOI] [PubMed] [Google Scholar]
- Cavanagh PR, Perry JE, Ulbrecht JS, Derr JA, Pammer SE, 1998. Neuropathic diabetic patients do not have reduced variability of plantar loading during gait. Gait Posture 7, 191–199. [DOI] [PubMed] [Google Scholar]
- Centers for Disease Control and Prevention, 2020. National Diabetes Statistics Report 2020 [WWW Document]. Natl. Diabetes Stat. Rep URL https://www.cdc.gov/diabetes/data/statistics/statistics-report.html
- Cheuy VA, Commean PK, Hastings MK, Mueller MJ, 2013a. Reliability and validity of a magnetic resonance-based volumetric analysis of the intrinsic foot muscles. J. Magn. Reson. Imaging 38, 1083–1093. [DOI] [PMC free article] [PubMed] [Google Scholar]
- Cheuy VA, Hastings MK, Commean PK, Mueller MJ, 2016a. Muscle and joint factors associated with forefoot deformity in the diabetic neuropathic foot. Foot Ankle Int. 37, 514–521. 10.1177/1071100715621544 [DOI] [PMC free article] [PubMed] [Google Scholar]
- Cheuy VA, Hastings MK, Commean PK, Ward SR, Mueller MJ, 2013b. Intrinsic foot muscle deterioration is associated with metatarsophalangeal joint angle in people with diabetes and neuropathy. Clin. Biomech 28, 1055–1060. [DOI] [PMC free article] [PubMed] [Google Scholar]
- Cheuy VA, Hastings MK, Mueller MJ, 2016b. Metatarsophalangeal hyperextension movement pattern related to diabetic forefoot deformity. Phys. Ther 96, 1143–1151. [DOI] [PMC free article] [PubMed] [Google Scholar]
- Cohen J, 1992. A Power Primer. Psychol. Bull 112, 155–159. [DOI] [PubMed] [Google Scholar]
- Dingwell JB, Ulbrecht JS, Boch J, Becker MB, O’Gorman JT, Cavanagh PR, 1999. Neuropathic gait shows only trends towards increased variability of sagittal plane kinematics during treadmill locomotion. Gait Posture 10, 21–29. [DOI] [PubMed] [Google Scholar]
- Ferreira JSSP, Sacco ICN, Siqueira AA, Almeida MHM, Sartor CD, 2019. Rehabilitation technology for self-care: Customised foot and ankle exercise software for people with diabetes. PLoS One 14, 1–15. [DOI] [PMC free article] [PubMed] [Google Scholar]
- Hamacher D, Zech A, 2018. Development of functional variability during the motor learning process of a complex cyclic movement. J. Biomech 77, 124–130. [DOI] [PubMed] [Google Scholar]
- Hamill J, Palmer C, Van Emmerik REA, 2012. Coordinative variability and overuse injury. Sport. Med. Arthrosc. Rehabil. Ther. Technol 4, 1. [DOI] [PMC free article] [PubMed] [Google Scholar]
- Hastings MK, Woodburn J, Mueller MJ, Strube MJ, Johnson JE, Beckert KS, Stein ML, Sinacore DR, 2014. Radiographic-directed local coordinate systems critical in kinematic analysis of walking in diabetes-related medial column foot deformity. Gait Posture 40, 128–133. [DOI] [PMC free article] [PubMed] [Google Scholar]
- Hausdorff JM, 2007. Gait dynamics, fractals and falls: Finding meaning in the stride-to-stride fluctuations of human walking. Hum. Mov. Sci 26, 555–589. [DOI] [PMC free article] [PubMed] [Google Scholar]
- Kärvestedt L, Mårtensson E, Grill V, Elofsson S, Von Wendt G, Hamsten A, Brismar K, 2011. The prevalence of peripheral neuropathy in a population-based study of patients with type 2 diabetes in Sweden. J. Diabetes Complications 25, 97–106. [DOI] [PubMed] [Google Scholar]
- Latash ML, 2012. The bliss (not the problem) of motor abundance (not redundancy). Exp. Brain Res 217, 1–5. [DOI] [PMC free article] [PubMed] [Google Scholar]
- Latash ML, Scholz JP, Schöner G, 2002. Motor control strategies revealed in the structure of motor variability. Exerc. Sport Sci. Rev 30, 26–31. [DOI] [PubMed] [Google Scholar]
- Lavery LAA, Armstrong DGG, Vela SAA, Quebedeaux TLL, Fleischli JGG, 1998. Practical criteria for screening patients at high risk for diabetic foot ulceration. Arch. Intern. Med 158, 157–162. [DOI] [PubMed] [Google Scholar]
- Lipsitz LA, 2002. Dynamics of stability: The physiologic basis of functional health and frailty. Journals Gerontol. 57a, B115–B125. [DOI] [PubMed] [Google Scholar]
- Mickey J, Greenland S, 1989. A study of the impact of confounder-selection criteria on effect estimation. Am. J. Epidemiol 129, 125–137. [DOI] [PubMed] [Google Scholar]
- Moghtaderi A, Bakhshipour A, Rashidi H, 2006. Validation of Michigan neuropathy screening instrument for diabetic peripheral neuropathy. Clin. Neurol. Neurosurg 108, 477–481. [DOI] [PubMed] [Google Scholar]
- Robertson DD, Mueller MJ, Smith KE, Commean PK, Pilgram T, Johnson JE, 2002. Structural changes in the forefoot of individuals with diabetes and a prior plantar ulcer. J. Bone Jt. Surg 84, 1395–1404. [DOI] [PubMed] [Google Scholar]
- Sartor CD, Hasue RH, Cacciari LP, Butugan MK, Watari R, Pássaro AC, Giacomozzi C, Sacco IC, 2014. Effects of strengthening, stretching and functional training on foot function in patients with diabetic neuropathy: Results of a randomized controlled trial. BMC Musculoskelet. Disord 15, 1–13. [DOI] [PMC free article] [PubMed] [Google Scholar]
- Soheilykhah S, Rashidi M, Dehghan F, Shojaoddiny-Ardekani A, Rahimi-saghand S, 2013. Prevalence of Peripheral Neuropathy in Diabetic Patients. Iran. J. Diabetes Obes 5, 107–113. [Google Scholar]
- Suda EY, Matias AB, Bus SA, Sacco ICN, 2019. Impact of diabetic neuropathy severity on foot clearance complexity and variability during walking. Gait Posture 74, 194–199. [DOI] [PubMed] [Google Scholar]
- Wright CJ, Arnold BL, Coffey TG, Pidcoe PE, 2011. Repeatability of the modified Oxford foot model during gait in healthy adults. Gait Posture 33, 108–112. [DOI] [PubMed] [Google Scholar]
- Young MJ, Boulton AJM, Macleod AF, Williams DRR, Sonksen PH, 1993. A multicentre study of the prevalence of diabetic peripheral neuropathy in the United Kingdom hospital clinic population. Diabetologia 36, 150–154. [DOI] [PubMed] [Google Scholar]
- Zellers JA, Mueller MJ, Commean PK, Chen L, Jeong H, Hastings MK, 2020. Multi-System factors associated with metatarsophalangeal joint deformity in individuals with type 2 diabetes. J. Clin. Med 9, 1012. [DOI] [PMC free article] [PubMed] [Google Scholar]