

Abstract
Electrochemical biosensors have extremely robust applications while offering ease of preparation, miniaturization, and tunability. By adjusting the arrangement and properties of immobilized probes on the sensor surface to optimize target–probe association, one can design highly sensitive and efficient sensors. In electrochemical nucleic acid biosensors, a self-assembled monolayer (SAM) is widely used as a tunable surface with inserted DNA or RNA probes to detect target sequences. The effects of inhomogeneous probe distribution across surfaces are difficult to study experimentally due to inadequate resolution. Regions of high probe density may inhibit hybridization with targets, and the magnitude of the effect may vary depending on the hybridization mechanism on a given surface. Another fundamental question concerns diffusion and hybridization of DNA taking place on surfaces and whether it speeds up or hinders molecular recognition. We used all-atom Brownian dynamics simulations to help answer these questions by simulating the hybridization process of single-stranded DNA (ssDNA) targets with a ssDNA probe on polar, nonpolar, and anionic SAMs at three different probe surface densities. Moreover, we simulated three tightly packed probe clusters by modeling clusters with different interprobe spacing on two different surfaces. Our results indicate that hybridization efficiency depends strongly on finding a balance that allows attractive forces to steer target DNA toward probes without anchoring it to the surface. Furthermore, we found that the hybridization rate becomes severely hindered when interprobe spacing is less than or equal to the target DNA length, proving the need for a careful design to both enhance target–probe association and avoid steric hindrance. We developed a general kinetic model to predict hybridization times and found that it works accurately for typical probe densities. These findings elucidate basic features of nanoscale biosensors, which can aid in rational design efforts and help explain trends in experimental hybridization rates at different probe densities.
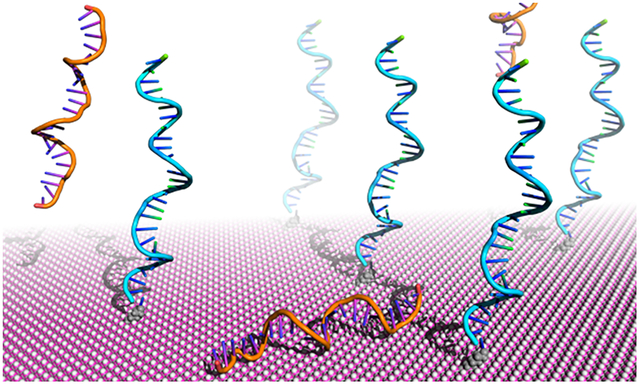
Graphical Abstract
1. INTRODUCTION
Nanoscale electrochemical sensors have seen extensive use for detecting a range of important biomolecules including viral DNA,1,2 drug-resistant genes,3 and dangerous damage or mutations in genetic material.4 Among them, electrochemical nucleic acid biosensors containing a self-assembled monolayer (SAM) of functionalized alkanethiols on gold or other substrates have proven to be excellent designs for detection of biomarkers because of their tunability, ease of miniaturization, and greater accuracy than current techniques.5–8 In this work, we studied an electrochemical DNA biosensor, in which immobilized single-stranded DNA (ssDNA) inserted into a SAM acts as a probe for its complementary sequence. The SAM consists of an alkane chain with a thiol headgroup that bonds to a gold substrate and a functional tail group on the solvent-exposed end. The tail group largely controls the surface properties of the SAM and can be selected to suit a number of possible applications, including adsorption or repulsion of specific molecules such as proteins or ions,5,9,10 modeling biological surfaces,11–13 and immobilization of DNA for controlled assembly.14,15 The sensor works by detecting the formation of double-stranded DNA from complementary single-stranded target and probe sequences—a process known as hybridization. Hybridization may occur through a bulk solvent diffusive encounter or through a surface-mediated mechanism.
Current techniques for characterizing the structure of SAMs, which plays a major role in determining the nature of DNA–SAM interactions, lack the resolution to describe nanoscale and subnanoscale features.16–18 Many unanswered questions remain about the organization of the DNA probes on SAMs and its effect on overall sensor function. For example, heterogeneity in the surface density of inserted DNA probes has been observed, and these differences in density may have a substantial effect on molecular recognition between the target and probe. Moreover, the nature of hybridization is believed to be much more complicated at a surface than in bulk solution because of the unique thermodynamic environment of probes concentrated on a surface.19 Interaction between probes and the monolayer or between neighboring individual probes can affect their ability to hybridize with incoming target strands. Indeed, Qiao et al. found evidence that hybridization on surfaces is slowed compared to in solution20 and that repulsions between neighboring probes can hinder hybridization.21 Understanding the effect of all these factors on the behavior of DNA on various surfaces can help steer rational design of nucleic acid biosensors.
Surface plasmon resonance, atomic force microscopy, and electrochemical measurements17,22,23 have been used to study the behavior of DNA on SAMs, but all have the drawback of detecting only the hybridized double-stranded DNA and provide little to no information about the mechanism of hybridization. Computational modeling and simulation can be tremendously useful in this regard, especially for their ability to elucidate processes on spatial and temporal scales inaccessible to experimental techniques.24–28 Moreover, a computational approach allows for inexpensive study of many permutations of a system. This can play an explanatory role by systematically varying certain system properties or can be used to guide design toward optimal function. For example, simulation has been successfully used on its own and in conjunction with experimentation to elucidate SAM interactions with proteins,29,30 surface-bound receptors,31 biosensor dynamics,32 and protein–ligand interactions.33,34 One important question concerns the amount of two-dimensional (2D) hybridization, that is, surface-mediated diffusion of target DNA along the SAM leading to hybridization, versus the amount of three-dimensional (3D) hybridization, in which hybridization occurs by diffusion of targets through the solvent directly to probes. This property is relevant in many fields; genotyping and gene expression profiling take advantage of DNA microarrays utilizing special surfaces,35,36 and catalysis may utilize surfaces with immobilized catalysts to enhance reaction rates.37 Such processes can be directly observed through simulations to provide essential missing knowledge of sensor function.
We performed all-atom Brownian dynamics simulations to answer open questions about nanoscale features of these biosensors that can aid rational design. In total, 16 simulations were performed (Table 1). Ten of the simulations modeled a single probe inserted into one of three different SAMs (Figure 1a), and each SAM was studied at three different probe densities. Additionally, six other simulations studied effects of high probe density, in which a cluster of five probes on one of two different SAMs was modeled with three different interprobe spacings (Figure 1b). We found that the hybridization rate was highly dependent on the electrostatic interaction between the target and surface; attractive forces can drastically expedite the search for a probe but can also strongly inhibit hybridization by hindering target desorption from surfaces. Moreover, we show that the rate of hybridization eventually saturates and becomes severely hindered as interprobe spacing decreases below a certain threshold. These results indicate that efficiency of hybridization is greatest when surface attraction is weak, allowing an increased target concentration to form near the sensor without targets becoming strongly adsorbed. Furthermore, probe crowding energetically and sterically inhibits the accessibility of probes to incoming targets, resulting in greatly slowed hybridization kinetics on both a polar and hydrophobic surface. Finally, we develop a general model of hybridization kinetics that accurately matched simulations results on all surfaces but suffered slightly at low probe densities.
Table 1.
Summary of All Simulationsa
| single-probe simulations probe density (nm−2) | multiprobe simulations probe separation (nm) | |
|---|---|---|
| OH-SAM | 0.0005 | -- |
| 0.001 | -- | |
| 0.002 | -- | |
| CH3-SAM | 0.0005 | 5.0 |
| 0.001 | 10.0 | |
| 0.002 | 15.0 | |
| CH3-SAM (0.35 M) | 0.002 | -- |
| COO−-SAM | 0.0005 | 5.0 |
| 0.001 | 10.0 | |
| 0.002 | 15.0 |
In total, 16 simulations were performed. In the single-probe simulations, three different SAMs were used, and each was simulated at three different probe surface densities. In the multiprobe simulations, two different SAMs with a cluster of five probes were used, and each was simulated with three different interprobe separations.
Figure 1.
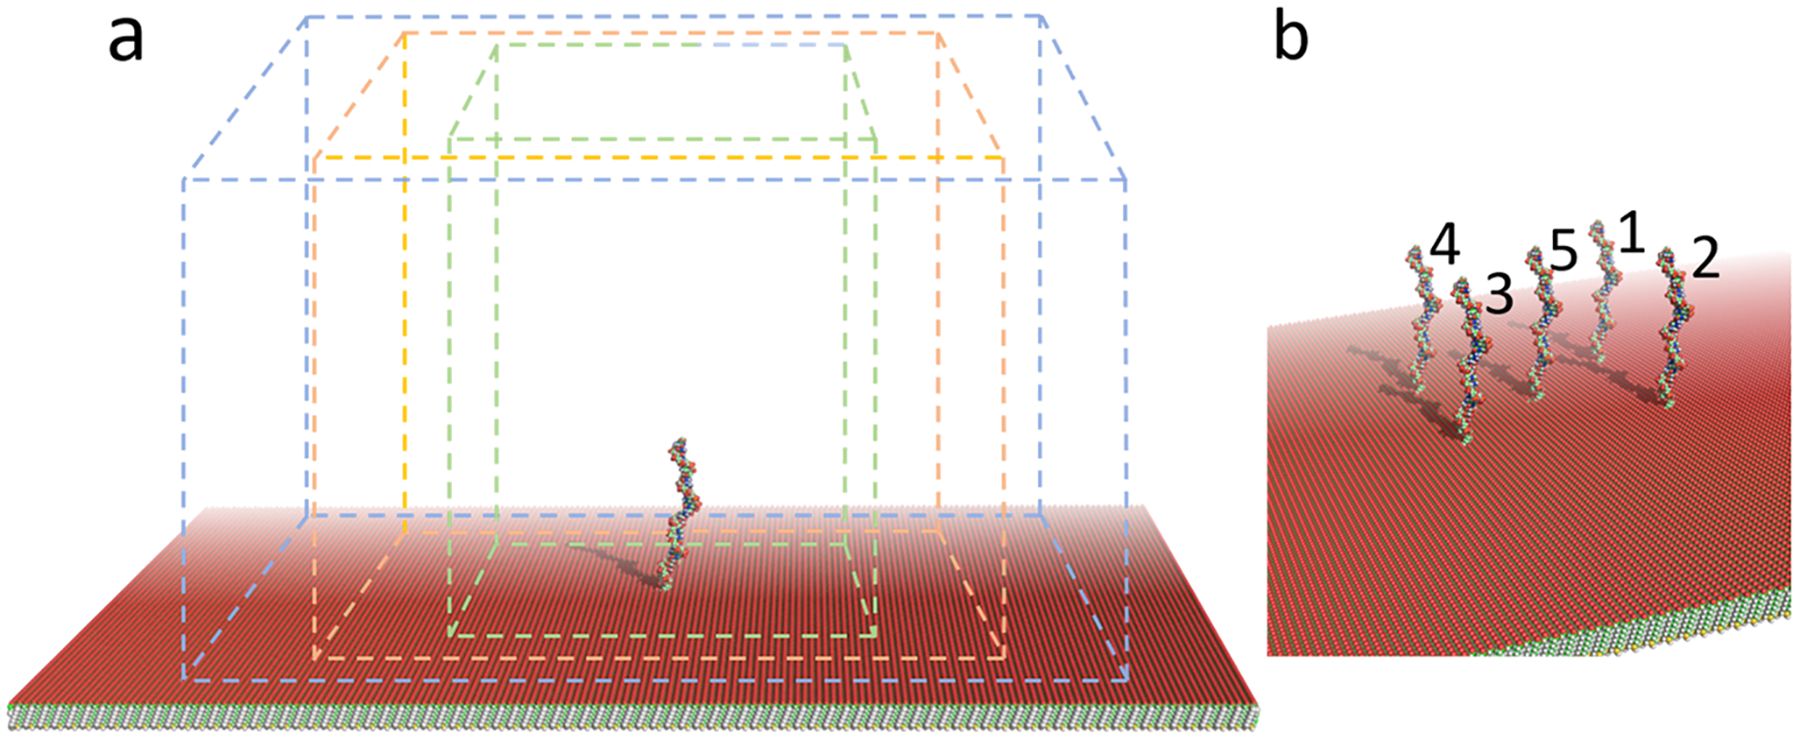
GeomBD3 simulation space. (a) The SAM with an inserted ssDNA probe is surrounded by a cuboid simulation box with periodic walls at the sides and a hard boundary at the top. Three different sized boxes were used to simulate the different probe surface densities: 0.002 (green), 0.001 (orange), and 0.0005 nm−2 (blue). The SAM extends past the walls enough to prohibit targets from hanging off any edges. (b) High-probe-density simulations used the same conditions as stated above but contained a cluster of five probes space either 5.0, 10.0, or 15.0 nm apart. The simulation box size was the same for all three cluster spacings.
2. METHODS
2.1. Sensor and ssDNA Target Structure.
Simulations were performed with the updated version of the GeomBD2 Brownian dynamics simulation program,33 available on our group Web site: http://chemcha-gpu0.ucr.edu/software/. All molecules in the simulations are rigid, containing no internal degrees of freedom. During simulations, one molecule is allowed to diffuse with full translational and rotational degrees of freedom, while another is held stationary. In the present case, the 24-base ssDNA sequence 5′-CGTACTGACTGCTCACGAGGTAGC-3 (hereafter the “target”) diffused from a randomly selected position on a plane positioned 42.5 nm above the biosensor surface until it achieved hybridization. The biosensor consisted of a SAM with one or more inserted ssDNA probe(s) (hereafter the “sensor”). All portions of the sensor remained stationary during the simulations. The probe was the 29-base ssDNA sequence 5′- GCTACCTCGTGAGCAGTCAGTACGTTTTT-3′, where the first 24 bases were complementary to the target sequence. The probe extended approximately 10.0 nm above the SAM, which was a 100 × 100 nm square slab (Figure 1). The three SAM surfaces used were undecanethiol (hydrophobic), 11-mercapto-1-undecanol (polar), or 11-mercaptoundecanoic acid (anionic) on a gold substrate. We refer to these as the CH3−, OH−, or COO−-SAM, respectively. On the COO−-SAM, all carboxylic acid tail groups were in the anionic COO− form to model the surface at pH 7.
The simulation space was constructed as follows. The sensor was placed in the bottom of a rectangular prism extending 50.0 nm in the z-dimension (perpendicular to the surface). A hard boundary was used at the top face of the prism, which, if passed, resulted in a target molecule being returned to its previous position and a new random component of force being generated. The side faces of the prism used periodic walls, which were placed such that the accessible SAM surface area yielded the desired probe surface density (Figure 1a). Target trajectories originated from a random point on a plane spanning the entire simulation space parallel to the SAM positioned 42.5 nm above it so that they began diffusion free from intermolecular potential. All simulations began at this height regardless of box size so that the only factor being varied was the probe surface density. The length and width of the SAM extended well beyond the periodic walls in all simulations, so no targets could move below the SAM nor come close to the edges.
2.2. Simulation Protocol.
Simulations include a stationary grid representation of the sensor’s volume, electric field, and the van der Waals-like 12–6 Lennard-Jones (LJ) potential. The grid spacing for all three grids was 0.05 nm. A screened Coulomb potential was used to model implicit monovalent salt concentrations of 0.50 and 0.35 M. The electric field and LJ grids extend 4.0 and 1.5 nm, respectively, beyond all edges of the sensor. Atomic charges and LJ parameters for DNA were derived from the AMBER ff14SB force field.38 Atomic charges for the SAM molecules were calculated using AMBER’s antechamber program39 with the AM1-BCC semiempirical charge method, and LJ parameters were taken from AMBER ff14SB. The AMBER force fields have been used successfully in several previous studies of nucleic acids and organic surfaces.40–42 During simulation, targets diffuse in implicit water solvent according to the overdamped Langevin equation
where Di is the translational or rotational diffusion coefficient, kB is Boltzmann’s constant, T is the temperature (298.15 K), is the potential energy gradient, Δt is a distance-dependent variable time step between 0.1 and 1.0 ps, and R is a zero-mean, stationary Gaussian process.43 Translational and rotational diffusion coefficients are calculated from the Stokes–Einstein equation. Additional details on the simulation protocol are given in the Supporting Information (SI).
2.3. Definition of Hybridization Conditions.
When a target satisfied any one of three hybridization conditions, its trajectory was terminated, and its lifetime was saved to a log file before a new trajectory was started. The average lifetime, or average hybridization time (τsim), was recalculated after each new hybridizing trajectory. When the relative standard deviation of the last 100 τsim values was less than 0.01, a simulation was considered as converged. One hybridization condition required the centers of mass of the target and probe to come within 0.7 nm (Figure 2a). Another condition was designed to mimic native base pair formation between a target and probe by requiring a base on the target to come within 0.7 nm of its native Watson–Crick base-pairing partner on the probe. The 0.7 nm threshold ensures that this condition is only met if the hydrogen bonding atoms on each base are adjacent (Figure 2b). The third and final condition required end-to-end overlap of five or more bases on either end of the target and probe strands, satisfied when the first and fifth overlapping bases were both within 0.7 nm of the probe. (Figure 2c). All three conditions were selected to represent formation of a target–probe complex that would likely lead to full hybridization based on results from prior coarse-grained DNA hybridization simulations.44,45
Figure 2.
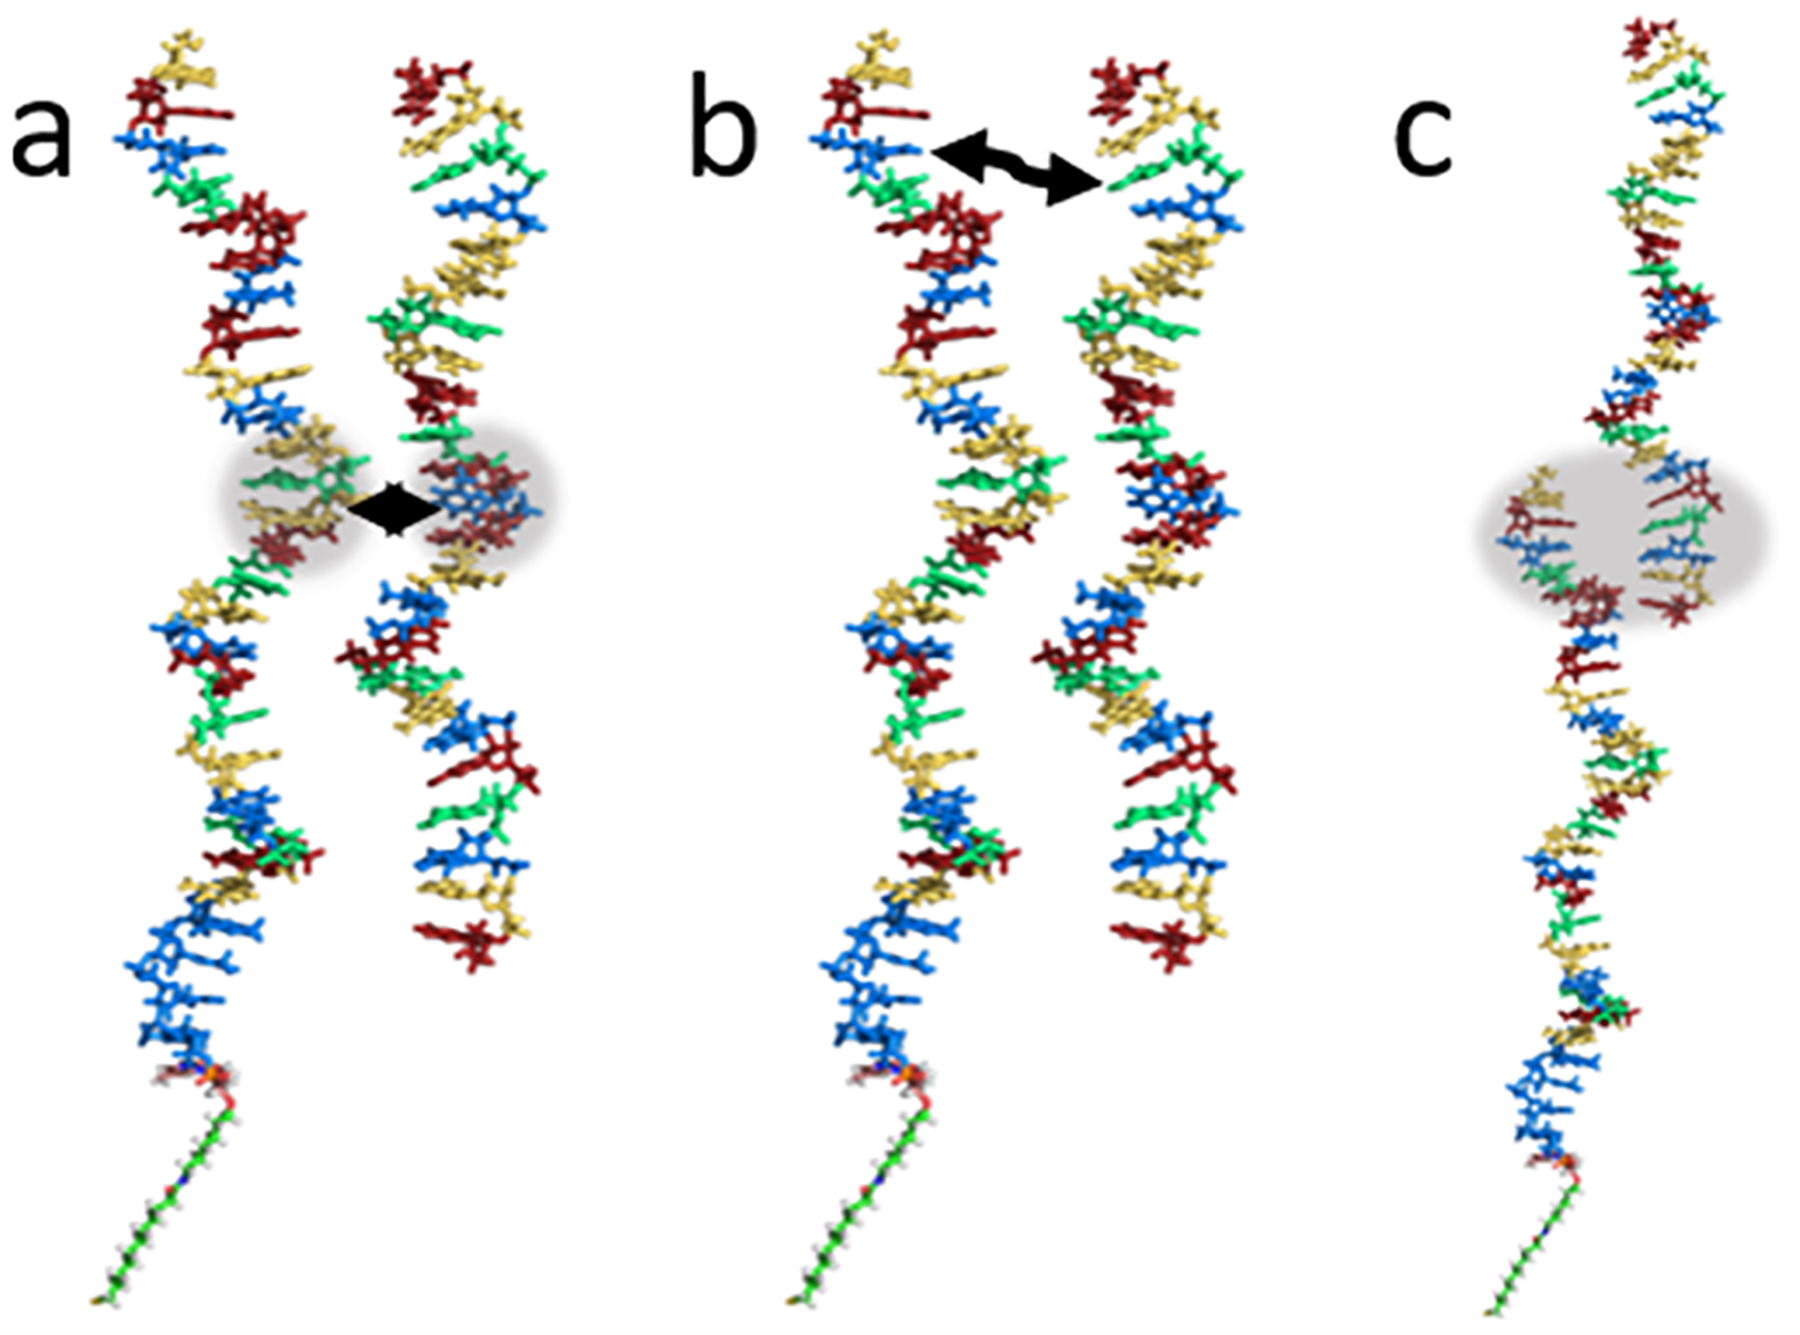
ssDNA probe (left strand, SAM not pictured) and ssDNA target (right strand) in the three possible hybridization conditions: (a) the centers of mass are less than 0.7 nm apart, (b) any two native Watson–Crick base-pairing partners (indicated by the black arrow), such as the thymine (blue) and adenine (green), are less than 0.7 nm apart, and (c) any end-to-end overlap of five or more bases.
2.4. Classification of 2D and 3D Hybridization.
To label trajectories as 2D or 3D hybridizers, we used an in-house program to label each hybridization event based on the pathway of the DNA target just prior to associating with the probe. If targets were adsorbed to the SAM (<0.4 nm between atomic centers of any SAM atom and any DNA atom) in 1 or more of the 20 frames (~10 ns) prior to hybridization, they were considered 2D hybridizers. All others were labeled as 3D hybridizers.
3. RESULTS AND DISCUSSION
Two sets of simulations were performed. The set of single-probe simulations was done on three different SAM surfaces, the OH-SAM, CH3-SAM, and COO−-SAM. Each surface was simulated at three different probe densities. To achieve a specific probe density, the single probe was placed in the center of a SAM, while the length and width of the simulation box were varied to encompass the necessary SAM surface area (Figure 1a). A set of multiprobe simulations was also performed, which contained a cluster of five probes on the CH3-SAM or COO−-SAM (Figure 1b). On each SAM, the clustered probes were simulated with three different interprobe spacings of 5.0, 10.0, or 15.0 nm to elucidate the effect of tight probe packing, which may hinder target–probe recognition. All were performed with implicit 0.50 M monovalent salt concentrations except for one additional test with 0.35 M (Table 1). The additional simulation of the CH3-SAM with 0.002 nm−2 probe density was performed with a 0.35 M salt concentration to understand the effects of ionic screening of electrostatic forces on the dynamics and hybridization rates.
3.1. Single-Probe Simulations with Varied Surface Properties and Probe Densities.
3.1.1. OH-SAM.
On the polar OH-SAM, target–SAM electrostatic interaction was slightly repulsive (Table 2). Target adsorption to the SAM was very short-lived, lasting roughly 22 μs, and was maintained primarily by close-range vdW attractions. This is similar to our previous study, which showed transient adsorption of DNA on OH-SAMs using molecular dynamics simulations.32 Moreover, hydrophilic SAMs in general are known to resist nonspecific DNA adsorption.46,47 Because of the weak adsorption, most of the hybridization happened through a 3D mechanism, and no clear relationship can be seen between the mechanism and probe density (Table 2). One may expect a greater fraction of 3D hybridization as probe density increases, since there is less exposed surface per probe; however, this is not what we observed. We calculated the layer-wise distribution of targets (Figure S1 and Table S1) during the simulation to understand how the SAMs affect diffusion. This analysis shows a substantially increased concentration of targets near the SAM, 2.6-fold higher than would be expected if there were no target–SAM attractions (Figure 3a). The increased concentration near the surface coupled with the lack of 2D hybridization indicates that, overall, very weak vdW forces hold targets close to the SAM while allowing target DNA to diffuse freely just above it or two-dimensionally along its surface. The average hybridization time dropped sharply with increasing probe density, from about 70.3 to 22.7 μs.
Table 2.
Fraction of 2D Hybridizers (γ), Average Simulated Hybridization Time (τsim), Predicted Hybridization Time (τtheo), Ratio of the Simulated and Predicted Times, and Target–SAM Electrostatic (ΔEelec) and van der Waals (ΔEvdW) Interaction Energies for the Four Single-Probe Scenarios at Different Probe Densitiesa
| surface | probe density (nm−2) | γ | τsim (μs) | τtheo (μs) | τsim/τtheo | ΔEelec (kcal/mol) | ΔEvdw (kcal/mol) |
|---|---|---|---|---|---|---|---|
| OH-SAM | 0.0005 | 0.14 | 70.3 ± 1.5 | 52.7 | 1.33 | 0.22 ± 0.21 | −2.91 ± 2.20 |
| 0.001 | 0.11 | 38.1 ± 0.5 | 35.2 | 1.08 | |||
| 0.002 | 0.13 | 22.7 ± 0.1 | 23.4 | 0.97 | |||
| CH3-SAM (0.35 M) | 0.002 | 0.18 | 40.1 ± 2.5 | 37.0 | 1.08 | −0.96 ± 0.28 | −4.10 ± 1.34 |
| CH3-SAM | 0.0005 | 0.16 | 70.5 ± 1.9 | 53.1 | 1.32 | −0.35 ± 0.26 | −3.71 ± 1.60 |
| 0.001 | 0.17 | 36.4 ± 0.9 | 39.3 | 0.93 | |||
| 0.002 | 0.16 | 20.4 ± 0.2 | 28.8 | 0.71 | |||
| COO−-SAM | 0.0005 | 0.01 | 65.5 ± 1.5 | 57.6 | 1.47 | 0.21 ± 0.33 | 0.00 ± 0.00 |
| 0.001 | 0.01 | 36.2 ± 1.8 | 38.3 | 0.95 | |||
| 0.002 | 0.01 | 20.8 ± 0.4 | 25.3 | 0.82 |
τsim values with ±standard deviation were computed after completion of 500 replicates. ΔE values are ±standard deviation between each analyzed simulation frame.
Figure 3.

(a) Distribution of target ssDNA strands as a function of their distance above the SAM in the four different single-probe scenarios simulated at the 0.001 nm−2 probe density. The space was partitioned into equally sized slices with a height of 2.0 nm. A target was considered to reside in the closest slice to the SAM containing any of its atoms. The number of frames in which the target resided in a slice divided by the expected number of appearances in a slice (assuming totally random diffusion) is calculated for each replicate simulation. The final result is averaged over all replicates. This ratio (g(z)) is plotted on the y-axis. (b) Distributions of contact angles measured between surface-adsorbed ssDNA targets and the SAM for each different surface and for the two salt concentrations on the CH3-SAM. Angles were measured between the vector running from tip-to-tip of the DNA and the plane of the SAM (x–y-plane).
3.1.2. CH3-SAM.
Behavior on the hydrophobic CH3-SAM was largely similar to that on the OH-SAM. Here, vdW forces dominate, which depend less on target sequence or contact angle than the electrostatic interactions present on hydrophilic surfaces. Indeed, previous studies have shown that DNA interacts strongly with hydrophobic surfaces through “face-down” adsorption of nucleobases on the surface and that it diffuses across such surfaces at a rate nearly the same as in bulk water.32,48 Although the rigid-body DNA molecules used in our study cannot adopt such conformations to maximize intermolecular contacts, we observed similar behavior. Only on this surface did the target DNA adopt a surface-adsorbed orientation parallel to the surface, which is partly responsible for the stronger electrostatics and vdW interactions. Figure 3b shows the distribution of measured contact angles between the DNA and SAM, with the CH3–SAM showing a relatively high fraction of angles <20°, indicating the DNA is “laying down” almost parallel to the surface. Analysis of target distribution shows a 4-fold increase in concentration 0–2.0 nm above the CH3-SAM but only a 1.5-fold increase in the range 2.0–4.0 nm above, reflecting the dominance of short-ranged vdW forces (Figure 3a). Targets showed weak electrostatic attraction and greater vdW attraction on this surface than the OH-SAM, which resulted in a marginally higher fraction of 2D hybridization (Table 2). Notably, this higher 2D fraction corresponds with slightly faster hybridization times for the 0.001 and 0.002 nm−2 probe densities on this surface compared to the OH-SAM (Table 2), indicating that hybridization time was decreased by the high surface concentration of targets. This increased molecular association rate due to reduced search dimensionality has been demonstrated elsewhere both computationally29 and experimentally49 for other biomolecules so long as desorption from the surface is not impeded by attractive forces. Indeed, striking a balance between attractive forces that shuttle targets to a surface and subsequently to the probes, while allowing rapid 2D diffusion and desorption from the surface, is the key factor if the goal is to expedite association kinetics. Our simulations of the same CH3–SAM system at a lower salt concentration of 0.35 M provide strong evidence for this point, which is discussed in a later subsection.
3.1.3. COO−-SAM.
The COO−-SAM is a negatively charged surface, as the carboxylic acid tail groups are in a deprotonated carboxylate form near pH 7. Since DNA carries a net negative charge of about −1 e per nucleotide, electrostatic repulsion between the SAM and incoming targets results in almost entirely 3D hybridization (Table 2). The repulsion is also evident in the target distribution, which shows that most probes resided in the range 2.0–4.0 nm above the SAM. The range 0–2.0 nm above the SAM had a concentration equal to the bulk (Figure 3a). However, the high target concentration in the second layer indicates that there was still a greatly increased concentration near the surface, which effectively channeled targets to probes to the same degree as the other SAMs. Despite the discrepancy in the hybridization mechanism compared to the others, the average hybridization time was quite similar to that on the OH− and CH3-SAMs and exhibited the same increasing trend as probe density decreased (Table 2). The weak repulsion of 0.21 kcal/mol, or roughly 0.35 kT, which is within the range of thermofluctuation, did not significantly affect τsim. Hybridization time at the lowest probe density was faster than that on the other SAMs and, notably, had the greatest 3D hybridization fraction of the three densities simulated (Table 2).
3.2. Effect of Ionic Strength on DNA Hybridization.
Because DNA is a highly charged biomolecule, we examined the effect of ionic concentration on hybridization. We ran a second simulation on the CH3–SAM at the 0.002 nm−2 probe density with the same settings except that the implicit ion concentration was lowered from 0.50 to 0.35 M. Because the electrostatic interactions are less screened, the target–SAM electrostatic attraction (ΔEelec) was strengthened from −0.35 kcal/mol (0.5 M) to −0.96 kcal/mol (0.35 M), and ΔEvdw was ~0.4 kcal/mol stronger with a 0.35 M ionic concentration (Table 2). These stronger attractions nearly doubled the target concentration in the range 0–2.0 nm above the SAM (Figure 3a). Interestingly, despite the high surface concentration of targets, the target–SAM interaction is still insufficient to attract the ssDNA to produce more 2D hybridization. As a result, the 2D hybridizing fraction increased negligibly (Table 2). Moreover, the stronger electrostatics induced more of the targets to adopt a side-on adsorption orientation, as opposed to end-on, which can be seen in the strikingly high fraction of DNA making a small contact angle with this surface (Figure 3b). These orientations contribute to the increased strength of attraction anchoring targets to the SAM. This, coupled with the increased concentration of targets near SAM, resulted in longer times needed for the targets to overcome the energy barrier associated with leaving the surface and reorienting for hybridization, causing τsim to nearly double relative to the 0.50 M simulation (Table 2). This highlights the importance of the balance between long-range attractive steering forces and the mobility of targets once they reach the surface. Steering target DNA toward probes is obviously helpful for fast kinetics, as shown in the 0.50 M single-probe simulations. However, the same forces responsible for steering may be disruptive. Adsorption of targets to a surface can increase their hybridization rate as long the desorption energy is not prohibitively high. Otherwise, the attractive forces originating from the sensor surface actually hinder the rate dramatically.
3.3. High-Probe-Density Multiprobe Simulations.
While a higher density of probes increases the chances of a target–probe encounter, there may be a density beyond which hybridization becomes sterically or energetically hindered by neighboring probes. To study hybridization at tightly packed probes, we ran multiprobe simulations that included a cluster of five probes on either the CH3− or COO−-SAM spaced 5.0, 10.0, or 15.0 nm apart in simulation boxes of identical volume (Figure 1b). These were performed to test the effect of interprobe spacing on hybridization. The trend in hybridization time with decreasing separation shows that the hybridization rate has already saturated at interprobe spacings of 15.0 nm, and hybridization becomes hindered at interprobe spacings of 5.0 nm or less (Table 3). We saw no change in hybridization time between the 15.0 and 10.0 nm separation cases but observed a roughly 1.5-fold increase from 10.0 to 5.0 nm, indicating that hybridization is inhibited in such highly crowded probe environments. To understand the source of the inhibition, we counted the total number of trajectories that hybridized with each of the five different probes (labeled 1–5, Figure 1b), to elucidate how the neighboring probes affect one another’s availability for hybridization. The result shows an unequal distribution of hybridization events. Specifically, hybridization at the central probe is severely limited at the 10.0 and 5.0 nm spacings, and the effect is greater for the smaller spacing (Table 3). In that case, only about 2% of the hybridization happened at the central probe for both the CH3− and COO−-SAMs, while the outer probes experienced a much more equal share. This effect was less pronounced, but still substantial, at the 10.0 nm spacing. The high negative charge of the DNA molecule makes it difficult for targets to adopt an energetically favorable orientation in the crowded probe environment. Steric limitations may begin to play a role here as well, especially when then target length is approximately equal to the probe spacing, as the target may adsorb to multiple probes at the same time. This was the case in our 5.0 nm spacing simulation and was partially responsible for the sharply increased hybridization time observed on both surfaces. Notably, the target and probe are both roughly 10 nm long, indicating that, more generally, tight probe clustering may become an obstacle as the spacing nears the length of the target DNA. The layer-wise distribution of targets in the multiprobe scenarios was virtually the same as in the single-probe scenarios. Overall, both the CH3− and COO−-SAM sensors showed inhibited hybridization when the probe spacing was equal to or smaller than the target DNA length. We should also note that the cluster of probes here differs from what would exist on a real biosensor surface in an important way: a real surface of the same probe density would present essentially a periodic array of such clusters, in which virtually all the probes would be analogous to the central probe (probe 5, Figure 1b). Hence, the present simulations contain an unrealistic amount of space surrounding the cluster, and the hybridization times measured for these scenarios should only be compared relative to the other simulated clusters.
Table 3.
Interprobe Separation, Average Hybridization Time (τsim), Percentage of Hybridization at Each Probea, and Fraction of 2D Hybridization (γ) for Multiprobe Simulations on the CH3− and COO−-SAMsb
| hybridizing probe (%) | ||||||||
|---|---|---|---|---|---|---|---|---|
| separation (nm) | τsim (μs) | 1 | 2 | 3 | 4 | 5 | γ | |
| CH3-SAM | 5.0 | 22.6 ± 0.7 | 23 | 23 | 26 | 26 | 2 | 0.13 |
| 10.0 | 14.4 ± 0.1 | 22 | 20 | 27 | 23 | 7 | 0.20 | |
| 15.0 | 15.7 ± 0.4 | 21 | 13 | 24 | 27 | 14 | 0.24 | |
| COO−-SAM | 5.0 | 20.6 ± 0.4 | 15 | 30 | 29 | 24 | 2 | 0.03 |
| 10.0 | 15.4 ± 0.2 | 23 | 19 | 28 | 26 | 4 | 0.03 | |
| 15.0 | 16.1 ± 0.5 | 15 | 19 | 24 | 22 | 20 | 0.04 | |
Labeled 1–5; see Figure 1b.
Probes 1–4 are the outer probes of the cluster and should be energetically and sterically equivalent for incoming targets. Probe 5 is at the center of the cluster and shows greatly reduced accessibility dependent on the probe separation.
3.4. Phenomenological Model and Comparison with Simulation Results.
A model that relates hybridization time to a sensor’s basic properties can aid in the rational design of high-performance biosensors. Real-time hybridization kinetics can be measured experimentally,49 but it is impossible to determine the mechanism of hybridization, and the details of target interactions with surfaces and probes cannot be discerned. Here, we developed a model using a kinetic theory of particle association and the simulated percentage of 2D hybridization to predict the average hybridization time, τtheo. We adopt the theoretical framework for predicting the rate of collisions, α, between a diffusing molecule and a spherical target containing a small reactive patch. This sphere can also be imagined as a flat surface containing a small reactive hemispherical bump,50 where in the present case, the flat surface is the SAM and the hemispherical bump is the probe. In that case, α is the rate of collisions with the SAM
| (1) |
where D is the 3D diffusion coefficient, a is the radius of the diffusing molecule, b is the radius of the surface or reactive patch of the surface, and r is the distance between them. U(r) is the potential energy between the two molecules. For diffusion from the bulk to the SAM, the driving force is the long-range Coulombic potential
| (2) |
After integration, eq 1 becomes
| (3) |
Multiplying eq 3 by Avogadro’s number gives units of M−1 s−1. The distance r here is the sum of the relevant radii (a + b in eq 1). Since DNA has a rod-like geometry, the radius of the target DNA, rdna, is approximated as
| (4) |
where s1 and s2 are the major and minor semiaxes.51 In studies of molecular association with surface-bound receptors, it has been shown that short-range (vdW) forces that hold the diffusing molecules to the surface can result in molecular association rates as if the entire surface were reactive. This is because an encounter with the secondary search target (probe) is very likely and happens rapidly compared to an encounter with the primary target (SAM surface).52 Adopting this idea, our model uses the radius of the SAM as b in eq 1, which is taken as the radius of a sphere having equal surface area. Our results show that this model works well for the present system (Table 2). As a comparison, if it is assumed that hybridization times will correspond to the rate of target DNA collision with the probe rather than with any portion of the surface, then the times are overestimated more than 2-fold in most cases (see the SI for additional details).
Some fraction of targets will encounter the probe while diffusing two-dimensionally. This fraction must then overcome an energy barrier associated with desorbing from the surface before hybridizing, and the time of this process is added to the time to diffuse from the bulk to the SAM. The barrier is determined primarily by the strength of short-range forces holding targets to the SAM (Table 2). Borrowing ideas from Kramers’ theory for diffusion across an energy barrier, in which there is an exponential dependence on barrier height E† and a dependence on the diffusion coefficient D along the reaction coordinate,47 we approximate the time to cross the barrier, τb,
| (5) |
The term before the exponential gives the time needed to diffuse a distance b, which we take as 1.0 nm, since at this distance above the SAM, all short-range vdW forces are broken. We analyzed all hybridizing simulation trajectories and labeled each as either a 2D or 3D hybridization event according to a simple criterion related to the diffusional pathway taken by the target. While the hybridization time from 3D diffusion can be directly approximated using the collision rate α (eqs 1 and 3), the average hybridization time for surface-adsorbed DNA needs to consider the barrier height (eq 5) to account for the extra time spent desorbing from a surface. As a result, the overall τtheo for all trajectories is
| (6) |
where C is the target DNA concentration in mol/L, and γ is the fraction of trajectories that hybridized two-dimensionally. A fully detailed calculation is shown in the SI. In all but one case, the predicted hybridization times τtheo agree quite closely with simulations for probe densities of 0.001 and 0.002 nm−2; however, they are underestimated when the probe surface density is low (Figure 4). Eq 6 relies on the prior assumption that the time spent on or near the surface before achieving 2D hybridization is negligible. This assumption holds when probe density is high and most targets diffusing on the SAM rapidly undergo 2D hybridization, but it becomes less applicable as probe density decreases. Notably, at normal densities used in biosensors, typically >0.001 nm−2, the assumption holds reasonably well. On all surfaces, predictions have similar accuracy and suffer from much larger error at the lowest probe density of 0.0005 nm−2. Results from the 0.35 M CH3–SAM simulation demonstrate the importance of capturing surface interactions in models of hybridization. While the 0.5 M simulation at the 0.002 nm−2 density yielded τsim = 20.4 μs, the stronger target–SAM attraction at 0.35 M resulted in τsim doubling to 40.1 μs. The model seems to have difficulty capturing such effects. The green points in Figure 4 correspond to the CH3–SAM, which had the most attractive potential with the target DNA. They show that τsim was overestimated, estimated accurately, and then underestimated by the model as probe density decreased. The same trend can be seen for the anionic COO−-SAM, indicating that some of this error is due to the changing probe density. However, the fact that it is more pronounced on the CH3-SAM is an indication that the amount of surface interaction has still not been well measured. An improved method for estimating the amount of 2D hybridization could vastly improve such measurements. Additionally, target–probe interactions that form as targets desorb from a surface need to be characterized in detail to allow accurate estimation of the 2D hybridization time scale. Despite this, the model’s overall accuracy is still reasonable, which highlights the major influence that surface interactions play in the hybridization process. In summary, this model of hybridization works well under the assumption that the search for a probe is dominated by the 3D part, which is true under typical conditions. As probe density decreases, the model suffers from larger inaccuracy as 2D search time becomes non-negligible. Additionally, accurately estimating the amount of 2D hybridization and strength of surface interactions is essential for accurate predictions of hybridization rates, as 2D hybridization can take considerably longer than 3D hybridization.
Figure 4.

Comparison of simulated (τsim) and predicted (τtheo) hybridization times for the single-probe scenarios at 0.002 nm−2 (circles), 0.001 nm−2 (squares), and 0.0005 nm−2 (triangles) probe densities. Error bars are ±standard deviation of τsim to show that the value has converged after 500 replicate simulations are completed; some error bars are too small to be displayed.
4. CONCLUSIONS
High-performance biosensors require specific and efficient target–probe association, which depends highly on the surrounding surface properties, probe surface density, and the ionic strength of the solution. In this study, across three surfaces with anionic, polar, or hydrophobic nature, the rate of target DNA hybridization with the probes was largely unchanged at a 0.5 M monovalent salt concentration. However, upon decreasing the ionic strength of solution to levels where target DNA attraction to the sensor surface was significant, hybridization was markedly slowed as DNA desorption form the surface was impeded, which in turn inhibits hybridization with probes. On the polar and hydrophobic surfaces, a significant fraction of the hybridization took place two-dimensionally, through a surface-mediated mechanism. Simulation of three probe clusters with different interprobe spacings revealed that the hybridization rate eventually reverses as probe density increases, since incoming target DNA becomes sterically and energetically hindered from hybridizing with tightly packed probes. Shrinking the probe spacing from 10.0 to 5.0 nm resulted in a doubling of the average hybridization time, revealing that clusters of high probe density in biosensors can severely disrupt hybridization, especially when the spacing is equal to or less than the target DNA length.
We have developed a model DNA of hybridization rate and found that the key parameter is the fraction of surface-mediated hybridization, since this requires a significant energy barrier to be crossed prior to hybridization. The model accurately predicted hybridization times across all surfaces at typical probe densities but suffered slightly at low densities where certain assumptions fail to hold. The greatest hybridization efficiency requires striking a balance between attractive forces that enhance target DNA concentration near probes without inhibiting the process by anchoring DNA to the surface. Due to the generality of the model, it can be applied to a variety of other natural or engineered systems to aid in rational design or to help explain experimentally measured reaction rates.
Supplementary Material
ACKNOWLEDGMENTS
This study was supported by the US National Science Foundation (MCB-1932984) and NSF national supercomputer centers (TG-CHE130009). We thank Dr. Joachim Dzubiella for discussion relating to molecular diffusion and associations. We thank Dr. Tao Ye and Qufei Gu for helpful discussions regarding the SAM and biosensor structure. Finally, we thank Kevin Maltz for his contributions to the GeomBD source code.
Footnotes
Supporting Information
The Supporting Information is available free of charge at https://pubs.acs.org/doi/10.1021/acs.jpcb.0c09723.
Explanation of target DNA diffusion coefficient calculation, details for simulation equation of motion, additional details on simulation protocol and models, explanation for analysis of target distribution above the surfaces, full calculation and discussion of modeled hybridization times and comparison to simulated results (PDF)
Complete contact information is available at: https://pubs.acs.org/10.1021/acs.jpcb.0c09723
The authors declare no competing financial interest.
Contributor Information
Timothy Cholko, Department of Chemistry, University of California, Riverside, Riverside, California 92507, United States;.
Chia-en A. Chang, Department of Chemistry, University of California, Riverside, Riverside, California 92507, United States;.
REFERENCES
- (1).Faria HAM; Zucolotto V Label-free Electrochemical DNA Biosensor for Zika Virus Identification. Biosens. Bioelectron 2019, 131, 149–155. [DOI] [PubMed] [Google Scholar]
- (2).Dong S; Zhao R; Zhu J; Lu X; Li Y; Qiu S; Jia L; Jiao X; Song S; Fan C; et al. Electrochemical DNA Biosensor Based on a Tetrahedral Nanostructure Probe for the Detection of Avian Influenza A (H7N9) Virus. ACS Appl. Mater. Interfaces 2015, 7, 8834–8842. [DOI] [PubMed] [Google Scholar]
- (3).Peng H-P; Hu Y; Liu P; Deng Y-N; Wang P; Chen W; Liu A-L; Chen Y-Z; Lin X-H Label-free Electrochemical DNA Biosensor for Rapid Detection of Multidrug Resistance Gene Based on Au Nanoparticles/Toluidine Blue–Graphene Oxide Nanocomposites. Sens. Actuators, B 2015, 207, 269–276. [Google Scholar]
- (4).Hájková A; Barek J; Vyskočil V Electrochemical DNA Biosensor for Detection of DNA Damage Induced by Hydroxyl Radicals. Bioelectrochemistry 2017, 116, 1–9. [DOI] [PubMed] [Google Scholar]
- (5).Zhou Y; Tang L; Zeng G; Zhang C; Zhang Y; Xie X Current Progress in Biosensors for Heavy Metal Ions Based on DNAzymes/DNA Molecules Functionalized Nanostructures: A Review. Sens. Actuators, B 2016, 223, 280–294. [Google Scholar]
- (6).Ferapontova EE DNA Electrochemistry and Electrochemical Sensors for Nucleic Acids. Annu. Rev. Anal. Chem 2018, 11, 197–218. [DOI] [PubMed] [Google Scholar]
- (7).Drummond TG; Hill MG; Barton JK Electrochemical DNA sensors. Nat. Biotechnol 2003, 21, 1192–1199. [DOI] [PubMed] [Google Scholar]
- (8).Kavita V DNA Biosensors-A Review. J. Bioeng. Biomed. Sci 2017, 7, 222. [Google Scholar]
- (9).Jarczewska M; Kierzkowska E; Ziółkowski R; Górski Ł; Malinowska E Electrochemical Oligonucleotide-based Biosensor for the Determination of Lead Ion. Bioelectrochemistry 2015, 101, 35–41. [DOI] [PubMed] [Google Scholar]
- (10).Sun J; Gan Y; Liang T; Zhou S; Wang X; Wan H; Wang P Signal Enhancement of Electrochemical DNA Biosensors for the Detection of Trace Heavy Metals. Curr. Opin. Electrochem 2019, 17, 23–29. [Google Scholar]
- (11).Sassolas A; Blum LJ; Leca-Bouvier BD Immobilization Strategies to Develop Enzymatic Biosensors. Biotechnol. Adv 2012, 30, 489–511. [DOI] [PubMed] [Google Scholar]
- (12).Fan C; Plaxco KW; Heeger AJ Electrochemical Interrogation of Conformational Changes as a reagentless Method for the Sequence-specific Detection of DNA. Proc. Natl. Acad. Sci. U. S. A 2003, 100, 9134–9137. [DOI] [PMC free article] [PubMed] [Google Scholar]
- (13).Lin M; Song P; Zhou G; Zuo X; Aldalbahi A; Lou X; Shi J; Fan C Electrochemical Detection of Nucleic Acids, Proteins, Small Molecules and Cells Using a DNA-Nanostructure-Based Universal Biosensing Platform. Nat. Protoc 2016, 11, 1244–1263. [DOI] [PubMed] [Google Scholar]
- (14).Rashid JIA; Yusof NA The Strategies of DNA Immobilization and Hybridization Detection Mechanism in the Construction of Electrochemical DNA Sensor: A Review. Sens. Biosens. Res 2017, 16, 19–31. [Google Scholar]
- (15).Wang S; Cai X; Wang L; Li J; Li Q; Zuo X; Shi J; Huang Q; Fan C DNA Orientation-Specific Adhesion and Patterning of Living Mammalian Cells on Self-assembled DNA Monolayers. Chem. Sci 2016, 7, 2722–2727. [DOI] [PMC free article] [PubMed] [Google Scholar]
- (16).Kelley SO; Mirkin CA; Walt DR; Ismagilov RF; Toner M; Sargent EH Advancing the Speed, Sensitivity and Accuracy of Biomolecular Detection Using Multi-Length-scale Engineering. Nat. Nanotechnol 2014, 9, 969–980. [DOI] [PMC free article] [PubMed] [Google Scholar]
- (17).Josephs EA; Ye T Nanoscale Spatial Distribution of Thiolated DNA on Model Nucleic Acid Sensor Surfaces. ACS Nano 2013, 7, 3653–3660. [DOI] [PubMed] [Google Scholar]
- (18).Luo X; Davis JJ Electrical Biosensors and the Label Free Detection of Protein Disease Biomarkers. Chem. Soc. Rev 2013, 42 (13), 5944–5962. [DOI] [PubMed] [Google Scholar]
- (19).Gong P; Levicky R DNA Surface Hybridization Regimes. Proc. Natl. Acad. Sci. U. S. A 2008, 105, 5301–5306. [DOI] [PMC free article] [PubMed] [Google Scholar]
- (20).Qiao W; Chiang H-C; Xie H; Levicky R Surface vs. Solution Hybridization: Effects of Salt, Temperature, and Probe Type. Chem. Commun 2015, 51, 17245–17248. [DOI] [PMC free article] [PubMed] [Google Scholar]
- (21).He Y; Zhang J; Ruffin S; Ji L; Wang K; Levicky R; Xia X An Electrochemical Study of the Surface Hybridization Process of Morpholino-DNA: Thermodynamics and Kinetics. Electroanalysis 2016, 28, 1647–1653. [Google Scholar]
- (22).Seifpour A; Dahl SR; Lin B; Jayaraman A Molecular Simulation Study of the Assembly of DNA-functionalised Nanoparticles: Effect of DNA Strand Sequence and Composition. Mol. Simul 2013, 39, 741–753. [Google Scholar]
- (23).Noh H; Hung AM; Cha JN Surface-Driven DNA Assembly of Binary Cubic 3D Nanocrystal Superlattices. Small 2011, 7, 3021–3025. [DOI] [PubMed] [Google Scholar]
- (24).Mereghetti P; Kokh D; McCammon JA; Wade RC Diffusion and Association Processes in Biological Systems: Theory, Computation and Experiment. BMC Biophys 2011, 4, 2. [DOI] [PMC free article] [PubMed] [Google Scholar]
- (25).Pastor RW; Zwanzig R; Szabo A Diffusion Limited First Contact of the Ends of a Polymer: Comparison of Theory with Simulation. J. Chem. Phys 1996, 105, 3878–3882. [Google Scholar]
- (26).Ando T; Skolnick J Sliding of Proteins Non-specifically Bound to DNA: Brownian Dynamics Studies with Coarse-Grained Protein and DNA models. PLoS Comput. Biol 2014, 10, e1003990. [DOI] [PMC free article] [PubMed] [Google Scholar]
- (27).Sprenger K; He Y; Pfaendtner J Probing How Defects in Self-assembled Monolayers Affect Peptide Adsorption with Molecular Simulation. Foundations of Molecular Modeling and Simulation 2016, 21–35. [Google Scholar]
- (28).Venable RM; Ingólfsson HI; Lerner MG; Perrin BS Jr; Camley BA; Marrink SJ; Brown FL; Pastor RW Lipid and Peptide Diffusion in Bilayers: The Saffman–Delbrück Model and Periodic Boundary Conditions. J. Phys. Chem. B 2017, 121, 3443–3457. [DOI] [PMC free article] [PubMed] [Google Scholar]
- (29).Cholko T; Barnum J; Chang C-EA Amyloid-Beta (Aβ42) Peptide Aggregation Rate and Mechanism on Surfaces with Widely Varied Properties: Insights from Brownian Dynamics Simulations. J. Phys. Chem. B 2020, 124, 5549–5558. [DOI] [PMC free article] [PubMed] [Google Scholar]
- (30).Liu J; Yu G; Zhou J Ribonuclease A Adsorption onto Charged Self-assembled Monolayers: A Multiscale Simulation Study. Chem. Eng. Sci 2015, 121, 331–339. [Google Scholar]
- (31).Bell S; Terentjev EM Kinetics of Tethered Ligands Binding to a Surface Receptor. Macromolecules 2017, 50, 8810–8815. [Google Scholar]
- (32).Cholko T; Kaushik S; Chang C.-e. A. Dynamics and Molecular Interactions of Single-stranded DNA in Nucleic Acid Biosensors with Varied Surface Properties. Phys. Chem. Chem. Phys 2019, 21, 16367–16380. [DOI] [PubMed] [Google Scholar]
- (33).Roberts CC; Chang C.-e. A. Analysis of Ligand–Receptor Association and Intermediate Transfer Rates in Multienzyme Nanostructures with All-Atom Brownian Dynamics Simulations. J. Phys. Chem. B 2016, 120, 8518–8531. [DOI] [PubMed] [Google Scholar]
- (34).Mishra G; Bigman LS; Levy Y ssDNA Diffuses Along Replication Protein A via a Reptation Mechanism. Nucleic Acids Res 2020, 48, 1701–1714. [DOI] [PMC free article] [PubMed] [Google Scholar]
- (35).Graves DJ Powerful Tools for Genetic Analysis Come of Age. Trends Biotechnol 1999, 17, 127–134. [DOI] [PubMed] [Google Scholar]
- (36).Schena M; Heller RA; Theriault TP; Konrad K; Lachenmeier E; Davis RW Microarrays: Biotechnology’s Discovery Platform for Functional Genomics. Trends Biotechnol 1998, 16, 301–306. [DOI] [PubMed] [Google Scholar]
- (37).Sheldon RA Enzyme Immobilization: The Quest for Optimum Performance. Adv. Synth. Catal 2007, 349, 1289–1307. [Google Scholar]
- (38).Maier JA; Martinez C; Kasavajhala K; Wickstrom L; Hauser KE; Simmerling C ff14SB: Improving the Accuracy of Protein Side Chain and Backbone Parameters from ff99SB. J. Chem. Theory Comput 2015, 11, 3696–3713. [DOI] [PMC free article] [PubMed] [Google Scholar]
- (39).Jakalian A; Bush BL; Jack DB; Bayly CI Fast, Efficient Generation of High-Quality Atomic Charges. AM1-BCC Model: I. Method. J. Comput. Chem 2000, 21, 132–146. [DOI] [PubMed] [Google Scholar]
- (40).Domínguez CM; Ramos D; Mendieta-Moreno JI; Fierro JL; Mendieta J; Tamayo J; Calleja M Effect of water-DNA interactions on elastic properties of DNA self-assembled monolayers. Sci. Rep 2017, 7 (1), 536. [DOI] [PMC free article] [PubMed] [Google Scholar]
- (41).Elder RM; Jayaraman A Structure and Thermodynamics of ssDNA Oligomers Near Hydrophobic and Hydrophilic Surfaces. Soft Matter 2013, 9, 11521–11533. [Google Scholar]
- (42).Park JH; Aluru NR Water film thickness-dependent conformation and diffusion of single-strand DNA on poly(ethylene glycol)-silane surface. Appl. Phys. Lett 2010, 96, 123703. [DOI] [PMC free article] [PubMed] [Google Scholar]
- (43).Northrup SH; Allison SA; McCammon JA Brownian Dynamics Simulation of Diffusion-Influenced Bimolecular Reactions. J. Chem. Phys 1984, 80, 1517–1524. [Google Scholar]
- (44).Srinivas N; Ouldridge TE;Šulc P; Schaeffer JM; Yurke B; Louis AA; Doye JP; Winfree E On the Biophysics and Kinetics of Toehold-Mediated DNA Strand Displacement. Nucleic Acids Res 2013, 41, 10641–10658. [DOI] [PMC free article] [PubMed] [Google Scholar]
- (45).Ouldridge TE;Šulc P; Romano F; Doye JP; Louis AA DNA Hybridization Kinetics: Sippering, Internal Displacement and Sequence Dependence. Nucleic Acids Res 2013, 41, 8886–8895. [DOI] [PMC free article] [PubMed] [Google Scholar]
- (46).Cha T-W; Boiadjiev V; Lozano J; Yang H; Zhu X-Y Immobilization of Oligonucleotides on Poly (Ethylene Glycol) Brush-Coated Si Surfaces. Anal. Biochem 2002, 311, 27–32. [DOI] [PubMed] [Google Scholar]
- (47).Kastantin M; Schwartz DK DNA Hairpin Stabilization on a Hydrophobic Surface. Small 2013, 9, 933–941. [DOI] [PMC free article] [PubMed] [Google Scholar]
- (48).Lin Y-C; Petersson EJ; Fakhraai Z Surface Effects Mediate Self-Assembly of Amyloid-β Peptides. ACS Nano 2014, 8, 10178–10186. [DOI] [PMC free article] [PubMed] [Google Scholar]
- (49).Xu S; Zhan J; Man B; Jiang S; Yue W; Gao S; Guo C; Liu H; Li Z; Wang J; et al. Real-time reliable determination of binding kinetics of DNA hybridization using a multi-channel graphene biosensor. Nat. Commun 2017, 8, 14902. [DOI] [PMC free article] [PubMed] [Google Scholar]
- (50).Jackson MB Molecular and Cellular Biophysics; Cambridge University Press: New York, 2006. [Google Scholar]
- (51).Berg OG; von Hippel PH Diffusion-Controlled Macromolecular Interactions. Annu. Rev. Biophys. Biophys. Chem 1985, 14, 131–158. [DOI] [PubMed] [Google Scholar]
- (52).Adam G; Delbrück M Reduction of Dimensionality in Biological Diffusion Processes. Struc. Chem. Mol. Biol 1968, 198–215. [Google Scholar]
Associated Data
This section collects any data citations, data availability statements, or supplementary materials included in this article.