

Abstract
Pancreatic ductal adenocarcinoma (PDAC) is the third leading cause of cancer death in the United States. Pancreatic tumors are minimally infiltrated by T cells and are largely refractory to immunotherapy. Accordingly, the role of T-cell immunity in pancreatic cancer has been somewhat overlooked. Here, we hypothesized that immune resistance in pancreatic cancer was induced in response to antitumor T-cell immune responses, and that understanding how pancreatic tumors respond to immune attack may facilitate the development of more effective therapeutic strategies. We now provide evidence that T cell-dependent host immune responses induce a PDAC-derived myeloid mimicry phenomenon and stimulate immune resistance. Three KPC mouse models of pancreatic cancer were employed: the mT3–2D (Kras+/LSL-G12D; Trp53+/LSL-R172H; Pdx1-Cre) subcutaneous and orthotopic models, as well as the KP1 (p48-CRE/LSL-Kras/Trp53flox/flox) subcutaneous model. KPC cancer cells were grown in immunocompetent and immunodeficient C57BL/6 mice and analyzed to determine the impact of adaptive immunity on malignant epithelial cells, as well as on whole tumors. We found that induced T-cell antitumor immunity, via signal transducer and activator of transcription 1 (STAT1), stimulated malignant epithelial pancreatic cells to induce the expression of genes typically expressed by myeloid cells and altered intratumoral immunosuppressive myeloid cell profiles. Targeting the Janus Kinase (JAK)/STAT signaling pathway using the FDA approved drug ruxolitinib overcame these tumor-protective responses and improved anti-PD-1 therapeutic efficacy. These findings provide future directions for treatments that specifically disable this mechanism of resistance in PDAC.
Keywords: Pancreatic Cancer, T-cell immunity, Immune resistance, PDAC, Myeloid cells
Introduction
Worldwide, nearly half a million people are diagnosed with pancreatic cancer every year (1), and the mortality of these patients within 5 years is more than 90% (2). Therefore, there is an urgent need to develop more effective therapeutic strategies.
Pancreatic tumors typically have minimal infiltration of T cells, and thus pancreatic cancer is considered an immunologically cold neoplasm. When T cells infiltrate pancreatic tumors, they are generally skewed toward exhibiting pro-tumor properties rather than antitumor cytotoxic functions (3). Even when effective cytotoxic cells successfully infiltrate pancreatic tumors, they likely get suppressed or physically trapped within the stroma (4). The pancreatic cancer myelosuppressive microenvironment has been shown to be derived by tumor-intrinsic properties (5,6). Although these observations could suggest that T-cell immunity is not relevant to pancreatic cancer and that the pancreas has organ site-specific resistance to immunotherapy, studies have shown otherwise. Indeed, tumors of rare long-term pancreatic cancer survivors elicit more potent cytotoxic T-cell responses compared to the rest of pancreatic cancer patients (7). Immune checkpoint blockade, which promotes T-cell activity, has demonstrated efficacy in ~2% of pancreatic cancer patients that exhibit high microsatellite instability (MSI-high)(8). These findings suggest that when T-cell antitumor immune responses are sufficiently induced, T cells become effective weapons.
Many therapeutic interventions have been developed to target known immune escape routes in pancreatic cancer. However, the vast majority of pancreatic cancer immunotherapy clinical trials have failed (9). Hence, further resolution of the complex biology of pancreatic cancer immunity is needed. Here, we hypothesized that immune resistance in pancreatic cancer is induced in response to T-cell antitumor immunity, and that understanding how pancreatic tumors respond to immune attack may facilitate the development of more effective therapeutic strategies. To test this hypothesis, mT3–2D pancreatic tumors were grown subcutaneously in immunocompetent wild-type (WT) and severe combined immunodeficiency (SCID) C57BL/6 mice. Tumors were then analyzed to determine the impact of adaptive immunity on malignant epithelial cells and whole tumors. The major findings from this mouse model were then validated using the mT3–2D orthotopic model, as well as the KP1 subcutaneous model. First, we determined that despite the induction of T-cell immunity in immunocompetent mice bearing mT3–2D tumors, T cells failed to completely regulate tumor growth. Subsequently, we showed that stimulated antitumor T-cell responses, potentially via JAK/STAT signaling, induced the expression of myeloid-associated genes in malignant epithelial cells and stimulated the infiltration of PD-L1-expressing myeloid cells. Targeting the JAK/STAT signaling pathway using the FDA approved drug ruxolitinib inhibited the expression of myeloid cell-associated genes and improved anti-PD-1 therapeutic efficacy in mice. Together, these data suggest that some known features of the pancreatic cancer immunosuppressive microenvironment were driven in response to T-cell antitumor immunity. Disabling such responses offers new approaches to pancreatic cancer-directed immunotherapy.
Materials and Methods
Cell Lines
mT3–2D, mT4–2D and mT5–2D murine pancreatic cancer cell lines were gifts from David Tuveson, Cold Spring Harbor Laboratory, Laurel Hollow, NY (obtained in 2016) (10). The KP1 murine pancreatic cancer cell line was a gift from David DeNardo, Washington University Medical School, St. Louis, MO (obtained in 2016)(11). PANC02 murine pancreatic cancer cells were a gift from Jill Smith, Georgetown University Lombardi Comprehensive Cancer Center, Washington, DC (obtained in 2015). mT3–2D GFP cell line was a gift from Chunling Yi, Georgetown University Lombardi Comprehensive Cancer Center, Washington, DC (obtained in 2018). Briefly, pHAGE PGK-GFP-IRES-LUC-W (addgene, #46793) was transfected into 293T cells to generate the virus. The virus was infected into mT3–2D cells. For infection, 1 × 10⁵/well mT3–2D cells were cultured in 6-well plates and the MOI was 0.1–1. GFP+ cells were sorted as described below. All cell lines are syngeneic in C57BL/6 mice. HEK293T cells, C3H/10T 1/2 Clone 8, and RAW 264.7 cell lines were obtained from the Georgetown Lombardi Comprehensive Cancer Center Tissue Culture Shared Resource (TCSR), Georgetown University, Washington, DC). All cell lines, except C3H/10T 1/2 Clone 8, were grown in standard conditions and maintained in Dulbecco’s Modified Eagle Medium (DMEM)(Fisher Scientific, # SH30022LS) supplemented with heat-inactivated fetal bovine serum (HI-FBS) to a final concentration of 10% and 2 mM L-glutamine. C3H/10T 1/2 Clone 8 was cultured in Eagle’s Basal medium (Thermofisher, #21010–046) supplemented with HI-FBS to a final concentration of 10% and 2 mM L-glutamine. Mouse short tandem repeat profiling was done in 2017, which validated the mouse origin of the cell lines, and no contamination with any human or non-human primate cells. All cell lines were tested and determined to be free of Mycoplasma and other rodent pathogens (IMPACT II profile was done several times before using the cells for animal experiments). All cell lines were used for in vivo and in vitro experiments within the 3rd and 10th passage.
Animal Studies
All mice used in the study were 6–8 weeks of age. C57BL/6J wild-type (WT) and SCID mice were purchased from The Jackson Laboratory (Bar Harbor, ME). All studies involving animals were reviewed and approved by the Georgetown University Institutional Animal Care and Use Committee (GU IACUC). 1 × 10⁵ mT3–2D or mT3–2D-GFP cells were injected subcutaneously into the right flank of WT, WT with T-cell depletion (T-cell depletion; details in next section), or B6.CB17-Prkdcscid/SzJ (SCID) mice. 2 × 10⁵ of KP1 cells were injected subcutaneously into the right flank of C57BL/6J WT or T-cell depleted mice. 2 × 10⁶ of PANC02 cells were injected subcutaneously into the right flank of WT and SCID mice.
For in vivo ruxolitinib (LC laboratories, Woburn, MA) experiments, WT mice were first randomized into groups based on their tumor size. Mice were then treated with ruxolitinib daily by oral gavage at a dose of 50 mg/kg. Anti-PD-1 (clone: RMP1–14, BioXcell) was used at a dose of 200 μg/IP injection twice per week. Both ruxolitinib and anti-PD-1 treatment started when tumors reached about 50–100 mm3 and continued for 4 weeks. All tumors were measured twice weekly using calipers. Volume was calculated using (length × width2)/2. When tumors reached 1–2 cm3, or when mice showed signs of pain or distress, mice were euthanized using CO2 inhalation. For orthotopic experiments, 5 × 10⁴ mT3–2D cells expressing GFP and luciferase (mT3–2D-GFP/Luc) were orthotopically implanted into the tail of the pancreas. Tumor growth was monitored weekly using the IVIS imaging system (Xenogen Corp, Alameda, CA). 30 mg/kg luciferin (Nanolight Technology) was administered to mice i.p. to image tumors.
Mice were euthanized using CO2 inhalation when orthotopic tumors reached total flux of 1X 10¹⁰ or when mice showed signs of pain or distress. After euthanization, tumors were excised, and spleens were collected for downstream analysis.
In vivo T-cell Depletion
For the subcutaneous mouse models, T-cell depletion started 1 week before tumor cell inoculation. 1 × 10⁵ of mT3–2D cells or 2 × 10⁵ of KP1 cells were then injected subcutaneously in the right flank of C57BL/6J mice. For the orthotopic mT3–2D mouse model, T-cell depletion started 4 days after 5 × 10⁴ mT3–2D-GFP/Luc cells were implanted in the pancreas. For depletion of CD4+ and CD8+ T cells, each mouse was given 200 μg of anti-mouse CD4 (GK1.5, rat IgG2b; BioXCell) + 200 μg anti-CD8 (2.43, rat IgG2b; BioXCell) i.p., and the treatment continued twice weekly until the mice were sacrificed. After euthanizing the mice, splenocytes were collected to evaluate T-cell depletion by flow cytometry.
Preparation of Solid Tumor Tissue for Single-Cell Suspension
Tumors were chopped into small pieces and transferred into gentleMACS C tubes (MACS Miltenyi Biotec, #130-093-237), containing 10 mL of DMEM media and collagenase D (1 mg/mL; Sigma-Aldrich, COLLD-RO Roche, #11088866001). The tubes were placed on a gentleMACS Dissociator (MACS Miltenyi Biotec, #130-095-937), and the program 37_m_TDK2 was used. After dissociation, cells were filtered using 70 μm cell strainer and recovered by centrifugation.
Preparation of Splenocytes for Single-Cell Suspension
Spleen tissue was gently ground between frosted glass microscope slides (Corning, #2948). The tissue was passed 10x through a 1000 μL pipette tip. Red cells were removed by incubating the splenocytes for 3 minutes with 3 mL eBioscience™ 1X RBC Lysis Buffer (Invitrogen, ThermoFisher, #00-4333-57). Cells were pelleted by centrifugation, and then recovered in 10 mL RPMI media with 10% HI-FBS, and filtered using a 70 μm cell strainer.
NanoString nCounter Mouse PanCancer Immune Profiling Screen
5 WT mice and 5 SCID mice were injected with 1 × 10⁵ of mT3–2D cells subcutaneously. When tumors reached 1 cm3, mice were euthanized, and tumor tissues were collected. Then, RNA was extracted from the whole tumor tissue of the 5 WT tumor samples, the 5 SCID tumor samples, and the mT3–2D cell line using the PureLink RNA Mini Kit (Ambion). RNA concentration and quality were assessed using the Agilent BioAnalyzer (RINs between 5.9–9.7). 50 ng of total RNA from each sample was obtained and gene expression was measured on the NanoString nCounter Analysis System (NanoString Technologies). The NanoString PanCancer Immune CodeSet (#XT-CSO-MIP1–12) was used to perform the nCounter Gene-Expression Assay, and no custom probes were added. Samples were processed on the NanoString Technologies nCounter Sprint Profiler according to NanoString protocols in the Georgetown University Genomics and Epigenomics Shared Resource (GESR). Data from the NanoString nCounter system were normalized to the internal positive controls and housekeeping genes (Rpl19, Abcf1, Hdac3, Oaz1, Sap130, Ppia, Eef1g, Polr2a, Tbp, Polr1b, Edc3, Sdha, Gusb, Nubp1, Eif2b4, Alas1, Sf3a3 and Hprt) using the recommended settings in the nSolver 4.0 software normalization module (NanoString Technologies). Normalized data were also used with NanoString Advanced Analysis Module 2.0 (NanoString Technologies). For the summary heatmap analysis, all normalized genes of the cell line, WT tumor and SCID tumor samples were included in the analysis, and the cell line sample was used as the reference. For the differential gene expression analysis, the expression of all normalized genes in WT tumor samples were compared to the expression of all normalized genes in SCID tumor samples, and the SCID samples were used as the reference. The data obtained from the PanCancer Immune CodeSet were deposited on the public database GEO under the accession number GSE165165.
Whole Exome Sequencing (WES) and Neoantigen Prediction
5 WT mice and 5 SCID mice were injected with 1 × 10⁵ of mT3–2D cells subcutaneously. When tumors reached 1 cm3, mice were euthanized, and tumor tissues were collected. Then, DNA was extracted from the whole tumor tissue of the 5 WT mT3–2D subcutaneous tumors, the 5 SCID mT3–2D subcutaneous tumors, and the mT3–2D cell line using a DNeasy Blood and Tissue Kit (Qiagen, #69504). Indexed, paired-end whole exome libraries were constructed from 1.0 μg gDNA using the Agilent SureSelect XT HS Mouse All Exon Library Kit. Libraries were sequenced on an Illumina HiSeq 4000 using PE 150 bp (300 cycle) chemistry to a mean depth of 200x per sample. Raw and processed WES data were deposited on the public database GEO under the accession number GSE165167. For Sanger sequencing, Genewize (www.genewiz.com) was used to design primers that target the neoepitope regions. Each targeted region was amplified with PCR and sequenced with Sanger sequencing. These targeted regions are shown in Supplementary Table S1.
Reads were aligned to the mm10 reference genome using the Burrows–Wheeler Alignment tool version 0.7.17 (12). Genome Analysis Toolkit (GATK) best practices were used for sorting, duplicate marking, and variant calling with the HaplotypeCaller (13). Variants were annotated using Ensemble-VEP version 90.9 (14), and all possible 9-mer peptides that included a missense variant were identified using pVACtools version 1.0.8 (15). MHC-I binding affinities (H-2-Db and H-2-Kb) were then predicted for each wild-type and corresponding mutant peptide with NetMHC 4.0 (16). The following filtering steps were performed. Mutant peptides with predicted binding affinity > 500 nM were removed. Peptides from olfactory genes were excluded because they are prone to somatic mutations, are not highly expressed, and yield false-positives as cancer-associated genes (17). Mutations that corresponded to known polymorphic genes were also excluded. Peptides with low predicted agretopic indices (18), i.e., ratio of mutant to wild-type binding affinity < 4, were removed.
Sorting Malignant Epithelial Cells
For the RNA-seq experiments, six mT3–2D-GFP WT and 5 SCID tumors were processed into single-cell suspensions as described above. The cells were stained with Helix NP Blue (Biolegend, #425305) and live GFP+ cells were isolated using a BD FACSAria IIu fluorescence-activated cell sorting (FACS) cytometer. Sorted cells were then snap frozen in liquid nitrogen. For sorting mT3–2D-GFP/Luc malignant cells from the tumors, Sytox Blue (Thermofisher Scientific, #34857) staining was used, and live GFP+ cells were isolated via FACS. To sort KP1 cells, tumors were processed into single-cell suspensions as stated. Cells were then stained with Sytox Blue (Thermofisher Scientific, #34857), CD45 (clone 30-F11; BioLegend #103115), and CD44 (clone IM7; BioLegend #103047), and Live CD44+CD45− cells were selected.
RNA-seq
RNA was extracted from WT GFP+ sorted cells, SCID GFP+ sorted cells, and the mT3–2D-GFP cell line using the RNeasy Micro Kit (Qiagen). RNA concentration and quality were assessed using an Agilent BioAnalyzer (RINs >7). Equal amounts of RNA from each corresponding group were combined as one sample (1 WT sample, 1 SCID sample, and 1 cell line). Indexed, paired-end sequencing libraries were prepared from 1.0 μg total RNA using the Illumina TruSeq Stranded mRNA Library Preparation Kit (polyA cDNA synthesis) in the Genomics and Epigenomics Shared Resource (GESR) in the Lombardi Comprehensive Cancer Center at Georgetown University Medical Center. Libraries were sequenced on an Illumina NextSeq550 using 75 bp (150 cycle) paired-end chemistry to a mean depth of 40M reads per sample. Raw reads were aligned to the mm9 reference genome with BWA (12,19) and quantified into read counts with the annotation model (Partek E/M). All subsequent RNA-seq analyses were performed in R version 3.5.1. Read counts were variance-stabilized with the regularized log (rlog) function in the R/Bioconductor package DESeq2 version 1.20.0 (20). Log fold-changes were computed on the rlog-transformed expression data, and genes with absolute log fold-changes greater than or equal to one were retained as significant. One-sided gene set statistics were performed for log fold-changes on Hallmark version 6.2 pathways from MSigDB (21) and KEGG pathways (22) from the R/Bioconductor package KEGG.db version 3.2.3, and sets with FDR adjusted p-values below 0.05 were considered statistically significant. Raw and processed RNA-seq data were deposited on the public database GEO under the accession number GSE165166.
Sample Preparation for Global Proteomics Profiling
Solid mT3–2D tumor tissue was ground with a mortar and pestle in the presence of liquid nitrogen to create a powdered tissue. The powdered tumor tissue or cell pellets in the case of the cell line sample were resuspended in lysis buffer containing 50 mM Tris HCl pH 7.5, 100 mM NaCl, 1% Triton X-100 (Fisher Scientific, #BP151–100), 10 mmol/L EDTA (VWR, #VW3654–1), 1 mmol/L phenylmethylsulfonyl fluoride (PMSF) (Crystalgene, #225–011), 1mL/10mL 1× Protease Inhibitor Cocktail (Roche, #04693132001), and 100ul/10mL 1x Phosphatase Inhibitor Cocktail (Sigma, # P5726). The single-cell suspensions were vortexed vigorously for 5 minutes, sonicated using a probe-tip ultrasonic processor (Vibra Cell™; with the AMPL setting of 30%), and then maintained in agitation for 30 minutes at 4°C. The suspension was centrifuged at 12,000 × g for 15 minutes. The supernatant was collected, and samples were processed for NanoUPLC-MS/MS and analyzed as described previously (23).
Western Blotting
Solid mT3–2D tumor tissue was ground with a mortar and pestle in the presence of liquid nitrogen to create a powdered tissue. Lysis buffer was added to the powdered tissue or cell pellets and maintained in agitation for 30 minutes at 4°C. The lysis buffer consists of RIPA Buffer (Thermo Scientific™, #89900), 1mL/10mL 10x Protease Inhibitor (Sigma, #S8820), and 100ul/10mL 1x Phosphatase Inhibitor Cocktail (Sigma, #P5726–1ML). Western blotting was done as described previously (24). The antibodies used, with dilutions, are listed in Supplementary Table S2
RNA Isolation and Quantitative Reverse-Transcription PCR (RT-qPCR)
RNA extraction and RT-qPCR were performed using mT3–2D, mT4–2D, mT5–2D, RAW264.7 and KP1 cell lines, as well as using the mT3–2D, mT3–2D-GFP/Luc and KP1 tumor tissue. For the solid tumor samples, the tissue was ground with a mortar and pestle in the presence of liquid nitrogen to create a powdered tissue. Then, the powdered tumor tissue or cell pellets in the case of the cell lines were resuspended in lysis buffer. RNA extraction and RT-qPCR were performed as described previously (24). Gene expression was normalized to Hrpt or Gapdh and analyzed using the ΔCт or 2−ΔΔCт method in triplicate. The primer sequences are listed in Supplementary Table S3. For lipopolysaccharide (LPS) treatment, 1×10⁵ RAW264.7 cells/mL (2 × 10⁵ cells/well of a 6-well plate) were treated with 1 μg/ml LPS (Sigma-Aldrich, # L3129) for 24 hours. For in vitro ruxolitinib treatment, cells were treated with ruxolitinib (1 μg/mL; MCE, #HY-50856) for the indicated time periods.
Immunohistochemistry (IHC)
For solid mT3–2D tumors, tissues were fixed in 10% formalin overnight at room temperature and then stored in 70% ethanol until paraffin embedding. For HistoGel sample preparation, 1–5 million cells were fixed in 10% formalin overnight at 4°C. Cells were washed with PBS and then left in HistoGel for 2–5 minutes, followed by the addition of 100% ethanol. Samples were sent to the Georgetown University Histopathology and Tissue Shared Resource for embedding, sectioning, and staining. The hematoxylin and eosin (H&E) staining was scored blinded by the histopathologist in the Georgetown University Histopathology and Tissue Shared Resource. For Masson’s trichrome, Ki67, CD4, CD8, S100a8, and S100a9 IHC, ImageJ (v1.48) and FIJI (v2.0.0-rc-69/1.52n) were used for the analysis. ImageJ and FIJI allowed for automated unbiased quantification of the staining intensity and cell count for all slides from both groups. The antibodies are listed in Supplementary Table S4.
Arginase Activity Assay
Arginase activity was measured colorimetrically using Abcam’s Arginase Activity Assay Kit (#ab180877). 5×10⁶ cells of mT3–2D, mT4–2D, mT5–2D, KP1 and CH3/10T1/1 Clone8 were lysed with 100 μL of the kit’s lysis buffer (2×10⁶ cells per well) in duplicate in a flat-bottom, low-retention plate. Samples were processed and analyzed per the manufacturer’s instructions. Briefly, samples were incubated for 20 minutes at 37°C with H2O2 substrate solution, while background wells were incubated with additional buffer. Standards were prepared per kit instructions, and the enzymatic reaction mixture was prepared and added to all wells. Absorbance values were immediately obtained over a 60-minute period using a plate reader (The 2104 EnVision® Multilabel Plate Reader) at OD=570nm.
Crystal Violet Staining
Crystal violet staining was done as described previously (24). Briefly, 1 × 10³ mT3–2D cells per well were cultured in 96-well plates. At indicated time points, cells were rinsed and subjected to 0.52% Crystal Violet (Fisher Scientific, C581–100) in 25% methanol. For quantitative analysis, cells were dissolved in 100mM Sodium Citrate with 50% ethanol. Then, the absorbance was measured using a plate reader (The 2104 EnVision® Multilabel Plate Reader) at OD=570nm.
Multiparametric Flow Cytometry Analysis of Intratumoral Immune Cell Infiltrates
Single-cell suspensions from mT3–2D tumors harvested from WT and SCID mice were generated as outlined above. 2×10⁶ cells were prepared for staining as described previously (24). Briefly, cells were labeled with Live/Dead (Invitrogen, Thermofisher, Ref: l-23105). Subsequently, cells were washed and incubated for 10 minutes with CD16/CD32 (clone 2.4G2; 553141) to block Fc receptors before adding a cocktail of surface monoclonal antibodies (mAbs): anti-mouse-CD45 (clone 30-F11, #564590), NK-1.1(clone PK136, #562864), B220 (clone RA3–6B2, # 563103), CD3e (clone 145–2C11, #564661), CD4 (clone RM4–5, #563151), CD8a (clone 53–6.7, #564920), PD-1 (clone J43 #744549), PD-L1 (clone MIH5, #564715), CD25 (clone PC61, #565134), I-A/I-E (clone M5/114.15.2, #563415), CD11b (clone M1/70, #564443), CD11c (clone N418, #565452), all from BD Biosciences, and F480 (BM8, #123114), Gr-1 (clone RB6–8C5, #108428), Ly6G (Clone 1A8; #127645), and Ly6C (Clone HK1.4, #128030) from BioLegend. After 30 minutes of staining, cells were washed, and samples were acquired with a FACS Symphony cytometer (BD Biosciences).
For the analysis, cells were manually gated on size and granularity. Dead cells and doublets were excluded, and CD45+ cells were selected. Three thousand CD45+ live cells from each WT (n=5) and SCID mouse (n=5) were concatenated. A total of 30,000 CD45+ cells were analyzed using unsupervised t-SNE (T-distributed stochastic neighbor embedding), FlowSOM (Flow Self-Organizing Map, FlowJo), ClusterExplorer, and PhenoGraph algorithms using Flow Jo software (version 10.5.3) (FlowJo, LLC).
For FlowSOM analysis, Ly6C, Ly6G, F480, PD-L1, and MHCII were evaluated. The same FlowSOM map was applied to WT and SCID groups. In this analysis, visualized cell clusters were distributed in a minimal spanning tree. Each cluster was colored and contained nodes, where the size of each node corresponded with the number of cells represented by the node. These nodes connected to others with the greatest similarities, but the analysis also considered the multidimensional topology of the data. Inside each node, a pie chart indicated the mean fluorescence intensities of the selected markers (25). t-SNE clustering was done based on CD45, NK1.1, CD3, Gr-1, CD11b, CD11c, MHC II, Ly6C, Ly6G, B220, CD4, CD8, PD1, PD-L1, CD25, and F4/80. To determine the enrichment of generated clusters, CD45+ cells from WT tumors and SCID tumors were overlaid on the generated t-SNE map. These clusters were further analyzed based on their phenotypic similarities, using PhenoGraph. ClusterExplorer analysis was done based on the median fluorescent intensity of selected surface markers expressed by each of the studied clusters. Here, the expression of CD45, CD3, CD4, CD8, CD25, PD1, Ly6C in T cells was evaluated.
Flow Cytometry Analysis and Sorting
For CCR1 myeloid cell analysis of the mT3–2D tumor model, and for CD11b+Ly6G−Ly6Clow/- and CD11b+Ly6G+ Ly6Cint splenocyte myeloid cell sorting from WT tumor-free/naïve mice, cells were labeled with either a Zombie NIR™ Fixable Viability Kit (BioLegend, #423105) before Fc blocking and cocktail antibody staining, or with Helix NP Green (Biolegend, #425303) after cocktail antibody staining. Cells were washed and incubated for 10 minutes with CD16/CD32 (clone 2.4G2; 553141) to block Fc receptors. Cells were then washed, and a cocktail of antibodies was added: CD11b (Biolegend, clone M1/70 #101207), Ly-6C (Biolegend, clone HK1.4, #128015), Ly-6G (Biolegend, clone 1A8, #127627) with and without CCR1 (Biolegend, clone S15040E, #152505). After staining, cells were acquired with a BD LSRFortessa Cell Analyzer (BD Biosciences) and analyzed with FlowJo, or CD11b+Ly6G−Ly6Clow/- and CD11b+Ly6G+ cells were isolated using a BD FACSAria IIu cytometer.
For PD-L1-expressing tumor-associated macrophages (TAMs)(CD11b+PD-L1+F480+) flow cytometric analysis, cells were labeled with LIVE/DEAD™ Fixable Violet Dead Cell Stain Kit (Invitrogen, #L34964) in PBS before Fc blocking and cocktail antibody staining. Cells were then washed with 1% BSA in 1X PBS and incubated for 20 minutes with TruStain fcX™ (anti-mouse CD16/CD32, clone 93; BioLegend, #101320) to block Fc receptors. Cells were washed, and a cocktail of antibodies was added: CD45 (clone 30-F11; BioLegend #103115), CD11b (Biolegend, clone M1/70 #101255), F4/80 (clone BM8; BioLegend #123110), PD-L1 (clone MIH5; BD Biosciences, #564715). After staining, cells were fixed in 1% paraformaldehyde in 1X PBS and then acquired with a BD LSRFortessa Cell Analyzer (BD Biosciences) and analyzed with FlowJo.
For flow cytometric analysis of CD45.2 in the mT3–2D GFP cell line, RAW264.7 cell line, and WT mT3–2D-GFP tumors, cells were stained with Helix NP Blue (Biolegend, #425305) and anti-CD45.2 (Militenyi Biotec, clone 104–2, #130-102-471). After staining, cells were acquired with a BD FACSAria IIu cytometer and analyzed with FlowJo.
Statistical analysis
Statistical analyses were done for in vivo tumor growth, in vitro cell proliferation, flow cytometry analysis, RT-qPCR analysis, global proteomics profiling, Western blot analysis, NanoString nCounter analysis, IHC analysis and RNA-seq analysis. Differences in variables were assessed using GraphPad Prism version 8.2.1 by performing Mann-Whitney test or Student t test for two groups, one-way ANOVA or Kruskal-Wallis test for three groups, or two-way ANOVA followed by a multiple comparison test for multiple groups. Kaplan-Meier survival analyses were done using the Human Protein Atlas online tool (https://www.proteinatlas.org/). Differential gene expression analysis and Hallmark pathway analysis for the RNA-seq data were conducted using R (version 3.5.1). Statistical analyses of the RNA-seq data are described in detail above in the “RNA-seq” section.
Results
T-cell Immunity Incompletely Regulates Pancreatic Cancer Tumor Growth
To determine if T-cell immunity can control pancreatic tumor growth, mT3–2D cells were inoculated into syngeneic WT and SCID C57BL/6 mice. mT3–2D tumors in SCID mice grew more rapidly than did mT3–2D tumors in WT mice (Figure 1A, Supplementary Figure S1A). A similar tumor growth pattern was observed in the PANC02 model (Supplementary Figure S1B–C). Using H&E, Masson’s trichrome, and Ki67 IHC staining, no apparent difference in the histology, fibrosis, or the cellular proliferation rate was observed between mT3–2D WT and SCID tumors, respectively (Supplementary Figure S2).
Figure 1. T-cell immunity incompletely regulates pancreatic cancer tumor growth.
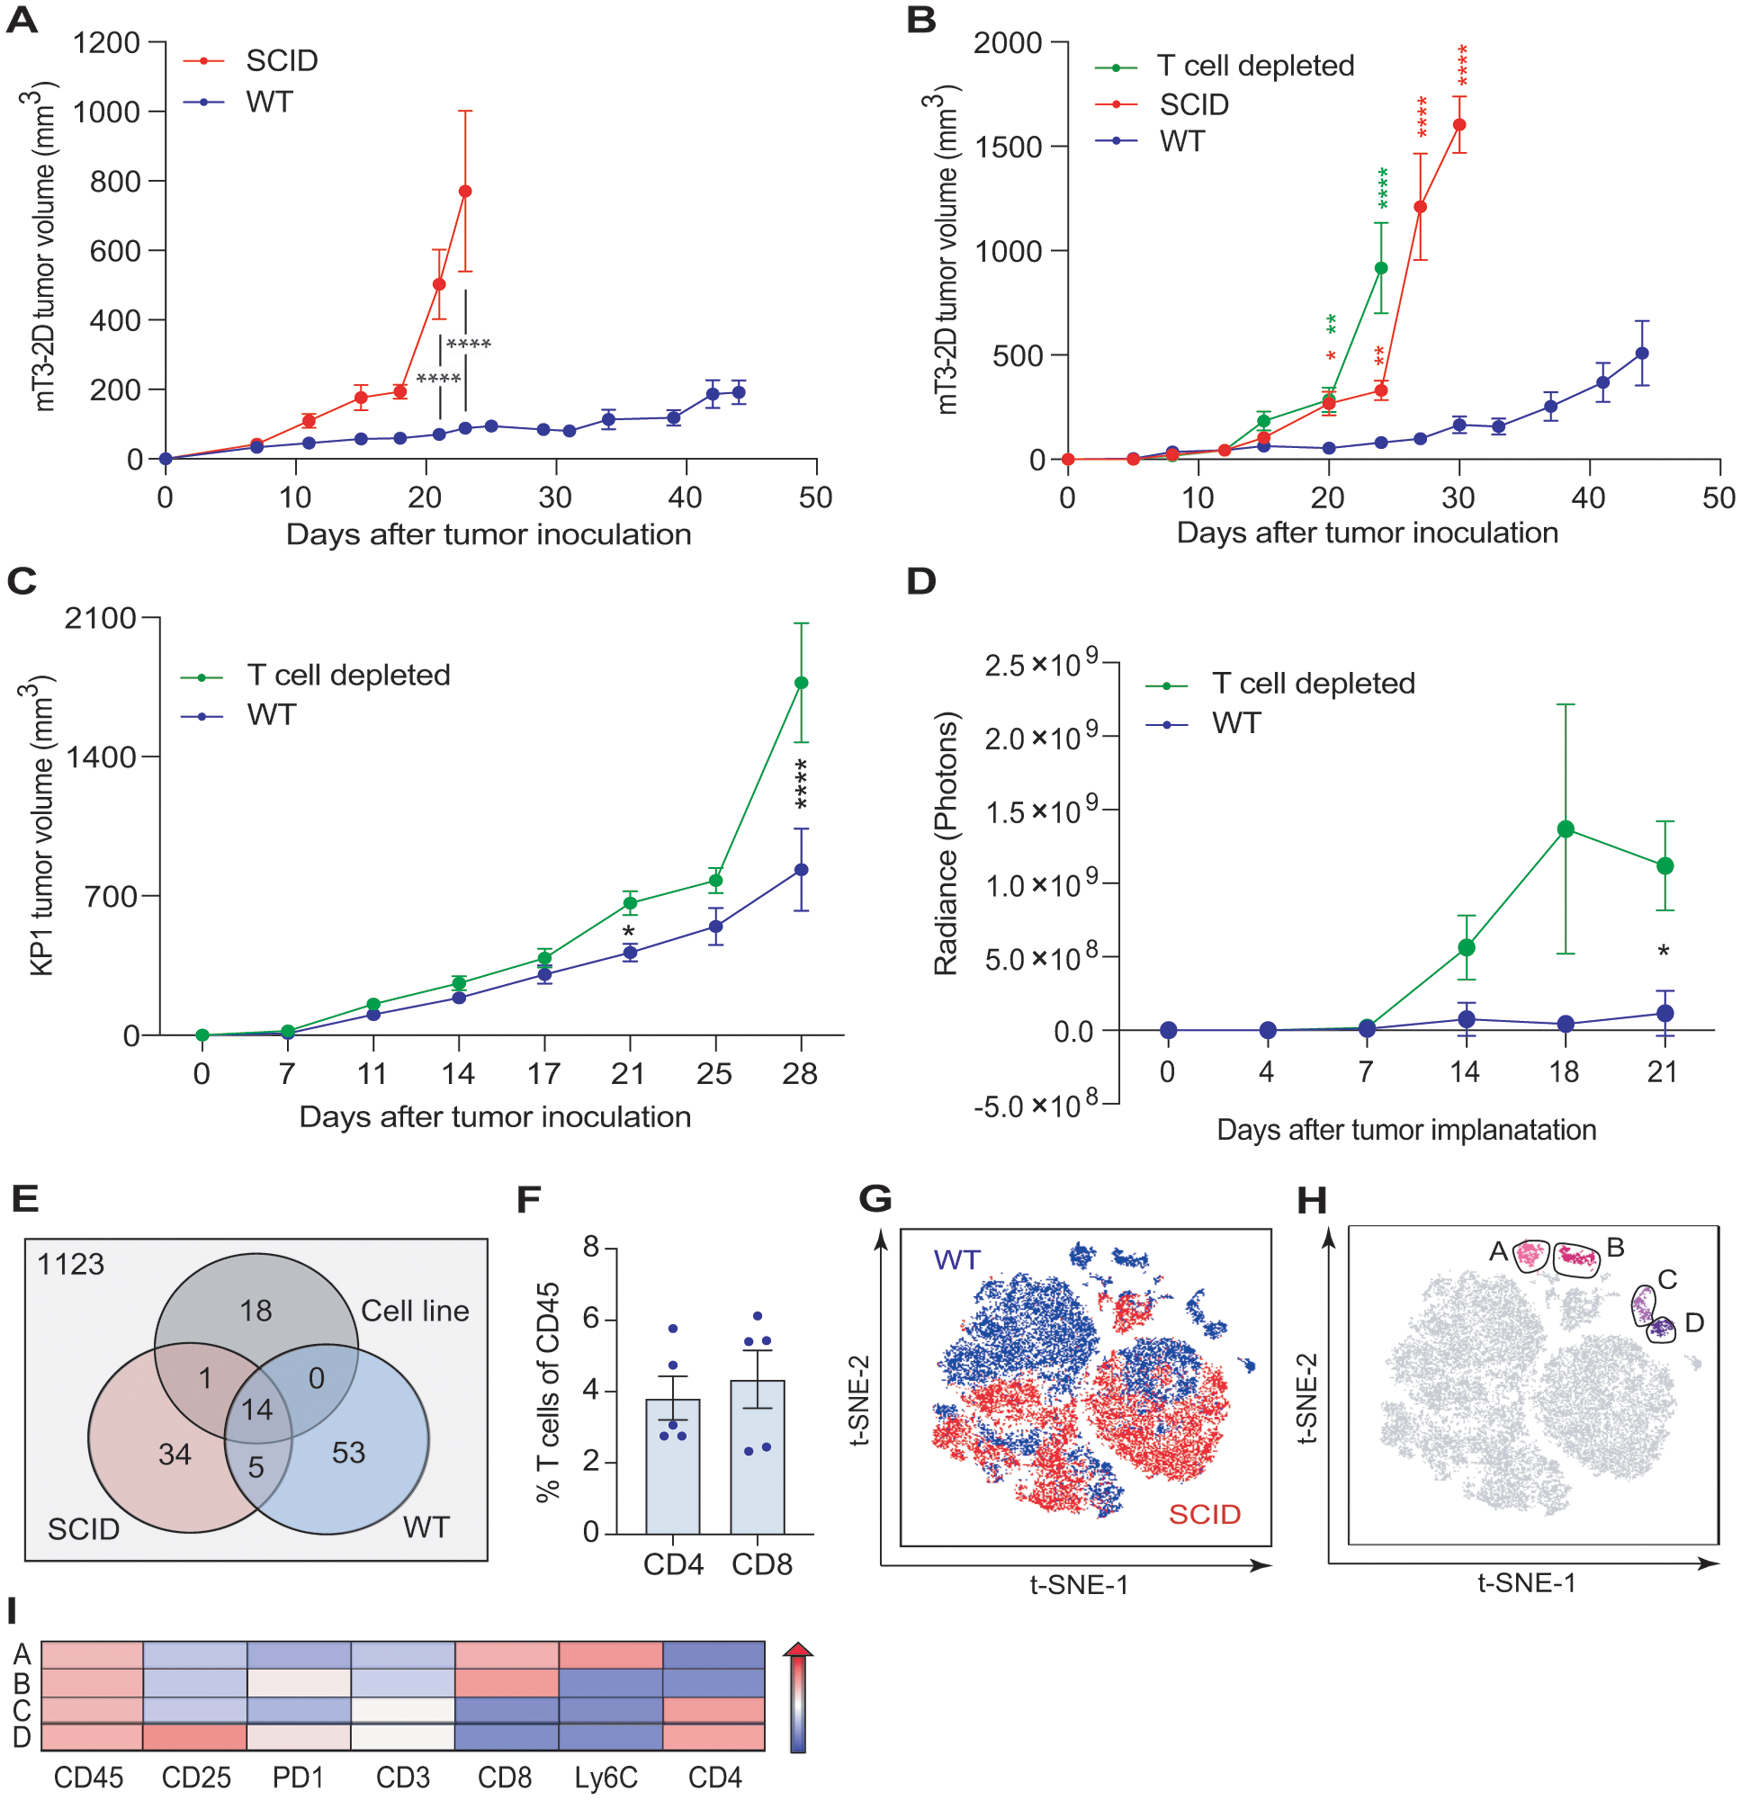
(A) Growth curves depicting average subcutaneous mT3–2D tumor volumes (±SEM) grown in syngeneic WT (n=9) and SCID (n=13) C57BL/6J mice. Two-way ANOVA followed by Bonferroni multiple comparison test was used for the analysis. Representative of two experiments. (B) Growth curves depicting average subcutaneous mT3–2D tumor volumes (±SEM) grown in WT, SCID, and T-cell depleted C57BL/6J mice (n=10/group). Two-way ANOVA followed by Tukey multiple comparison test was used for the analysis up to the time point day 24. Two-way ANOVA followed by Bonferroni multiple comparison test was used for the analysis of day 27 and day 30. Green asterisks: statistical significance between WT and T-cell depleted tumors; red asterisks: statistical significance between WT and SCID tumors. Representative of two experiments. (C) Growth curves depicting average subcutaneous KP1 tumor volumes (±SEM) grown in syngeneic WT (n=15) and T-cell depleted (n=15) C57BL/6J mice. Two-way ANOVA followed by Bonferroni multiple comparison test was used for the analysis. Representative of two experiments. (D) Analysis of the IVIS images revealing the average orthotopic mT3–2D tumor growth (±SEM) in WT (n=15) and T-cell depleted (n=15) C57BL/6J mice. Two-way ANOVA followed by Bonferroni multiple comparison test was used for the analysis. Representative of two experiments. (E) Number of neoepitopes predicted by pVACtools for the mT3–2D cells, combined 5 SCID tumors, and combined 5 WT tumors. (F) Percentage of T cells (CD3+CD4+CD8− or CD3+CD4−CD8+ cells) in immunocompetent tumors detected by flow cytometry and represented as mean±SEM frequency of CD45+ cells (n=5). Representative of two experiments. (G) t-SNE plot of immune cells from WT (blue) and SCID (red) tumors. Live/CD45+ cells from WT and SCID tumors were used to generate a t-SNE map, clustering cells based on the expression of their surface markers, as described in the Methods section (n=5/group). (H) Cells in the t-SNE plot were sub-clustered using PhenoGraph. CD8+ T-cell clusters in pink (Clusters A and B) and CD4+ T-cell clusters in purple (Clusters C and D)(n=5/group). (I) T-cell clusters were further characterized using ClusterExplorer analysis, representing the median fluorescence intensity of the selected markers in a heatmap format. *p<0.05, **p<0.01, ***p<0.005, ****p<0.001.
To validate that the reduced mT3–2D tumor growth rate in WT mice was T cell-dependent, we depleted CD4+ and CD8+ T cells. We observed that mT3–2D tumors in T-cell depleted mice grew similarly to those in SCID mice (Figure 1B, Supplementary Figure S3A–B). To demonstrate that this observation was not limited to the mT3–2D model nor to subcutaneous models, we utilized the KP1 KPC (p48-CRE/LSL-KRas/p53flox/flox) subcutaneous mouse model, as well as the mT3–2D orthotopic model. In both mouse models, tumor growth rate was slower in the immunocompetent mice compared to T-cell depleted mice (Figure 1C–D, Supplementary Figure S3C–F).
Because missense mutations may generate T-cell neoepitopes that can drive antitumor T-cell responses, we performed whole exome sequencing (WES). To determine the influence of in vivo tumor growth and antitumor immune responses on the generation of tumor neoepitopes, we analyzed the mT3–2D cell line, 5 WT tumors, and 5 SCID tumors. In total, we identified 1248 peptides with predicted binding affinities >500 nM. After filtering, 125 of these mutations were predicted to be putative cancer neoantigens (Figure 1E, Supplementary Table S5). Among the fourteen potential neoepitopes that were shared among the three groups, 13 belong to unique genes and 7 were validated by Sanger sequencing (Supplementary Table S1). We also observed that many mutations were generated during in vivo tumor growth compared to the mT3–2D cell line. However, the majority of these mutations were not shared between the tumor samples (Supplementary Table S5). These observations suggest that antitumor T-cell responses in WT mice were likely tumor neoantigen-specific.
To evaluate intratumoral T-cell infiltration, we used flow cytometry and IHC. A modest infiltration of T cells was observed (Figure 1F, Supplementary Figure S4A). To comprehensively assess the immune milieu of mT3–2D WT and SCID tumors, we employed NanoString nCounter immune profiling and multiparametric flow cytometry. The NanoString heatmap analysis showed a clear separation of the WT and SCID samples and indicated greater upregulation of immune-related genes in mT3–2D WT tumors than in SCID tumors (Supplementary Figure S4B). NanoString nCounter Cell Type Score analysis showed that “T cell” and “cytotoxic cell” scores were significantly higher in the WT tumors (Supplementary Figure S4C–D). In line with that observation, the analysis further indicated that IFNγ (Ifng) expression was induced at significantly higher levels in the WT group than in the SCID group (Supplementary Figure S5A). This was confirmed using RT-qPCR (Supplementary Figure S5B). In addition to Ifng, NanoString nCounter analysis indicated that several genes associated with T-cell activation and exhaustion were induced in WT tumors compared to SCID tumors and the mT3–2D cell line (Supplementary Figure S5C). However, unlike Ifng, no significant differential expression of the type I interferon genes Ifna1, Ifna4 and Ifnb1 between the two groups was detected, except Ifna2 (Supplementary Figure S6).
Consistent with the NanoString nCounter analysis, t-SNE analysis of multiparametric flow cytometry data indicated that cells from WT and SCID tumors were well-separated, suggesting that WT and SCID intratumoral immune profiles were different (Figure 1G). PhenoGraph analysis showed that intratumoral T cells were heterogenous and clustered into two CD8+ T-cell subsets (Clusters A and B) and two CD4+ T-cell subsets (Clusters C and D)(Figure 1H). ClusterExplorer analysis was used to generate a heatmap to determine the distinct phenotypes of the CD8+ and CD4+ T-cell subsets (Figure 1I), which were likely to possess different effector functions.
These findings suggest that mT3–2D WT and SCID tumors exhibited distinct immune profiles. Although T-cell immunity was clearly induced in immunocompetent mice, T cell-based anti-tumor responses incompletely regulated KPC tumor growth.
Anti-Tumor T-cell Responses Induce Myeloid Mimicry by Malignant Cells
We hypothesized that T-cell immunity failed to completely control tumor growth because malignant pancreatic epithelial cells deployed immunosuppressive mechanisms. To investigate how these cells specifically responded to anti-tumor T-cell immune responses, GFP-labeled mT3–2D cells were grown in C57BL/6J WT and SCID mice. RNA-seq was used to examine the gene expression profiles of the mT3–2D-GFP cell line and sorted mT3–2D-GFP cancer cells isolated from the WT and SCID tumors. 52 genes were differentially expressed between the WT and SCID malignant epithelial pancreatic cells (Figure 2A–B, listed in Supplementary Table S6). Among the genes that were upregulated in sorted WT cancer cells compared to SCID cancer cells were genes for CCL9 (Ccl9), arginase (Arg1), and CD68 (Cd68). The selective upregulation of Ccl9, Arg1, and Cd68 in the WT malignant cells was validated by RT-qPCR (Figure 2C). Because these genes are typically expressed by myeloid cells, using RT-qPCR and flow cytometry, we confirmed that the sorted tumor cells did not express CD45 (Supplementary Figure S7A–C). In line with that observation, protein tyrosine phosphatase, receptor type, C (Ptprc) mRNA expression was below the detection limit by RNA-seq in sorted malignant cells, as well as in the mT3–2D cell line. We then validated that induced expression of these myeloid-associated genes in response to T cell immunity was not limited to the mT3–2D subcutaneous model. A similar pattern was seen in both the mT3–2D orthotopic and KP1 subcutaneous models (Supplementary Figure S7D–G). Due to the limited number of sorted cells, it was technically challenging to evaluate CCL9, ARG1, and CD68 protein expression. However, we validated that the mT3–2D cell line, as well as three additional murine KPC cell lines (mT4–2D, mT5–2D and KP1), possessed basal expression of CCL9, ARG1, and CD68 at the mRNA and protein levels (Supplementary Figure S8). These observations suggest no apparent stromal contamination and no immune cell-cancer cell fusion. Because the expression of Cd68 was very low in sorted malignant cells, only Ccl9 and Arg1 were investigated in subsequent experiments. Together, these results suggest that malignant epithelial pancreatic cells expressed some genes associated with myeloid cells in response to anti-tumor T-cell immunity.
Figure 2. WT malignant epithelial pancreatic cells have higher expression of genes associated with myeloid cells compared to SCID malignant cells.

(A) Number of differentially expressed genes between the mT3–2D-GFP cell line and tumor-derived sorted mT3–2D-GFP cells isolated from WT and SCID tumors identified by RNA-seq (RNA from FACS malignant cells isolated from 6 mT3–2D-GFP WT tumors were combined as one WT sample, and RNA from FACS malignant cells isolated from 5 mT3–2D-GFP SCID tumors were combined as one SCID sample). Differential gene expression analysis was conducted for genes possessing a log2 fold-change (FC) of at least 1. (B) Heatmap of the 52 differentially expressed genes between tumor-derived sorted mT3–2D-GFP cells isolated from WT and SCID tumors. Differential gene expression analysis was conducted for genes possessing an absolute log2 FC of at least 1. Hierarchical clustering based on samples (columns) and genes (rows). (C) qRT-PCR of Ccl9, Arg1 and Cd68 expression in sorted mT3–2D-GFP WT cancer cells (n=6) and sorted mT3–2D-GFP SCID cancer cells (n=5–6). Two independent experiments were performed. Data are represented as mean FC±SEM, and the Mann-Whitney test was used; *p<0.05, **p<0.01.
Anti-tumor T-cell Immunity Induces Intratumoral PD-L1-Expressing Myeloid Cells
To determine the overall impact of anti-tumor T-cell immune responses on mT3–2D tumors, including cancer cells and the surrounding stroma, we employed unbiased global proteomics and multiparametric flow cytometry analyses. Global proteomics profiling of WT and SCID tumors indicated that S100a8 and S100a9 proteins, which are typically associated with myeloid cells, were higher in the WT tumors than in the SCID tumors (Figure 3A). We validated this observation using IHC (Supplementary Figure S9A–B).
Figure 3. WT and SCID tumors have distinct myeloid cell profiles.

(A) A scatter plot of paired relative protein intensities of WT and SCID tumors. Each dot represents a protein, and the identity line that passes through the origin is shown. (10 tumor samples/corresponding group were combined as one biological replicate, and 2 technical replicates for each biological replicate were used). (B) Percentage of CD11b+PD-L1+ cells in WT and SCID tumors detected by flow cytometry and represented as frequency of CD45+ cells (n=5/group). Samples were gated as shown in Supplementary Figure S9D–E. Data represented as mean±SEM, and Mann-Whitney test was used for the analysis. One independent experiment was performed. (C) Multidimensional single-cell analysis was performed by FlowSOM. 30,000 events of CD45+ cells from WT and SCID tumors were concatenated and then analyzed, which identified 8 clusters (colored). Clustering was based on the expression of Ly6G, Ly6C, PD-L1, F4/80, and MHCII, (n=5/group) (D) Percentage of PD-L1-expressing TAMs (CD11b+PD-L1+F4/80+Ly6Clow/-) in WT and SCID mT3–2D subcutaneous tumors detected by flow cytometry data and represented as frequency of CD45+ cells (n=5/group). Samples were gated as shown in Supplementary Figure S9D–E. Data represented as mean±SEM, and Mann-Whitney test was used for the analysis. One independent experiment was performed. (E) Percentage of PD-L1-expressing TAMs (CD11b+PD-L1+F4/80+) in WT and T-cell depleted KP1 subcutaneous tumors detected by flow cytometry data and represented as frequency of CD45+ cells (n=11–12/group). Samples were gated as shown in Supplementary Figure S10C. Data represented as mean±SEM, and Mann-Whitney test was used for the analysis. Two independent experiment were performed. (F) Percentage of PD-L1-expressing TAMs (CD11b+PD-L1+F4/80+) in WT and T cell depleted mT3–2D orthotopic tumors detected by flow cytometry data and represented as frequency of CD45+ cells (n=7–8/group). Samples were gated as shown in Supplementary Figure S10C. Data represented as mean±SEM, and Mann-Whitney test was used for the analysis. ns=not significant, *p<0.05, **p<0.01. One independent experiment was performed.
Flow cytometry analysis of the immune infiltrates determined that CD11b+ myeloid cells accounted for approximately 80% of total leukocytes in WT and SCID tumors (Supplementary Figure S9C–D). The frequency of CD11b+ cells expressing PD-L1 was significantly higher in the WT tumors (Figure 3B). To better characterize intratumoral myeloid cell populations, we performed an unsupervised multidimensional single-cell analysis on CD45+ cells using the FlowSOM clustering approach (Supplementary Figure S9E). Based on the expression of Ly6C, Ly6G, F480, PD-L1 and MHC II, eight clusters were identified. Among these eight clusters, most cells segregated into 2 clusters: Cluster 1 and Cluster 3 (Figure 3C).
The cells segregated in Cluster 3 were F480+PD-L1+ MHCIIlow, suggesting that they were PD-L1-expressing tumor-associated macrophages (TAMs). This cluster was predominantly noted in the WT group. A standard flow cytometry gating strategy was used to confirm this FlowSOM observation (Supplementary Figure S9F). Consistent with the FlowSOM analysis, the percentage of PD-L1-expressing TAMS (CD11b+F480+PD-L1+Ly6G−Ly6Clow/-MHCII−) was significantly higher in WT tumors (Figure 3D). To validate this observation in the context of anti-tumor T-cell immunity, intratumoral PD-L1-expressing TAMs were induced, and we compared the frequency of this population in immunocomptenet tumors and T-cell deficient tumors using the KP1 subcutaneous model, as well as the mT3–2D orthotopic model. In both mouse models, the frequency of PD-L1-expressing TAMs (CD11b+F480+PD-L1+) were significantly higher in WT tumors compared to T-cell depleted tumors (Figure 3E–F, Supplementary Figure S10A–C).
The cells segregated in Cluster 1 were characterized by Ly6Ghigh and intermediate Ly6C expression (Ly6Cint). This cluster was predominantly in the SCID group. Cluster 1 contained heterogenous populations, and nodes containing PD-L1+ cells were similar in WT and SCID tumors (Figure 3C). This FlowSOM observation was validated using standard flow cytometry gating strategies (Supplementary Figure S9F). The percentage of CD11b+Ly6G+Ly6Cint cells was significantly higher in mT3–2D subcutaneous SCID tumors (Supplementary Figure S10D), but no significant difference in the frequency of CD11b+Ly6G+Ly6Cint cells expressing PD-L1 was seen between groups (Supplementary Figure S10E). In line with literature (26), the frequency of conventional dendritic cells (cDCs, CD45+CD11c+MHCII+) cells was also significantly higher in mT3–2D subcutaneous SCID tumors compared to WT tumors (Supplementary Figure S11).
The expression of CCL9 in cancer cells is known to be associated with immune evasion and resistance via the recruitment of C-C motif chemokine receptor 1 (CCR1)-expressing immunosuppressive myeloid cells into the tumors (27–31). Hence, we evaluated the expression of CCR1 in intratumoral CD11b+ cells using flow cytometry. We determined that the average of CD11b+ cells expressing CCR1 in WT tumors was 44.5% (Supplementary Figure S12A–B). To evaluate the expression of S100a8 and S100a9 in myeloid cell populations, we sorted CD11b+Ly6G−Ly6Clow/- and CD11b+Ly6G+Ly6Cint splenocytes, and performed RT-qPCR. We determined that both myeloid cell populations had high expression of S100a8 and S100a9 (Supplementary Figure S12C). Collectively, these observations suggest that the anti-tumor T-cell immune responses altered intratumoral myeloid cell profiles. These alterations included induction of intratumoral PD-L1-expressing CD11b+ myeloid cells, potentially via CCL9/CCR1 signaling.
Induction of STAT1 Expression in Tumors and Malignant Epithelial Pancreatic Cells
To identify the molecular determinants of immune resistance in mT3–2D tumors, differentially regulated genes and pathways between immunocompetent and immunodeficient tumors were examined. NanoString nCounter analysis identified nine genes that were upregulated in the WT tumors compared to SCID tumors (Figure 4A). The common upstream regulator of all of these genes, except chitinase-like protein 3 (Chil3), an M2 macrophage marker, is Stat1 (Figure 4B). The analysis of Stat1 expression by NanoString nCounter analysis (Figure 4C) was validated by Western blot (Figure 4D), and a similar pattern was shown by mass spectrometry (Figure 4E).
Figure 4. STAT1 expression is selectively more highly induced in immunocompetent tumors than in immunodeficient tumors.

(A) Volcano plot of NanoString nCounter differential gene expression of all pairwise comparisons. The plot displays the relationship between fold-change and p-value between the WT and SCID groups using a scatterplot view. Each dot represents the average expression of a gene in the WT samples in reference to the SCID samples (n=5/group). (B) Direct interaction analysis by Pathway Studio® software (Ariadne Genomics, Rockville, MD, USA) for eight out of the nine differentially expressed genes identified in (A). The Pathway Studio figure was adapted by the authors to include a blue arrow that shows the link between STAT1 and ZBP1 that was reported in the literature but was not identified by Pathway Studio (55). (C) STAT1 RNA counts determined using the NanoString nSolver software (n=2 technical replicates for the cell line, n=5 biological replicates for the tumor samples). Data represented as mean±SEM, and a Kruskal-Wallis test was used. (D) Western blot of STAT1, phospho-STAT1 (p-STAT1)(Y701) and GAPDH in the mT3–2D cell line, 4 WT tumor samples, and 4 SCID tumor samples. Densitometry values of expression relative to GAPDH are indicated above the Western blot and shown in the bar plot to the right. Data represented as mean±SEM, and a Kruskal-Wallis test was used. (E) Relative STAT1 protein intensity detected by mass spectrometry (For the cell line, n=2 technical replicates. For tumor samples, 10 tumor samples/corresponding group were combined as one biological replicate, and 2 technical replicates for each sample were used). (F) qRT-PCR of STAT1 expression in sorted mT3–2D-GFP WT cancer cells (n=11) and sorted mT3–2D-GFP SCID cancer cells (n=6). Data represented as mean fold-change (FC)±SEM, and a Mann-Whitney test was used, 3 independent experiments were performed. (G) Kaplan-Meier plot showing STAT1 pancreatic cancer survival using the Human Protein Atlas survival analysis. The cut off=33.2 years (The best expression cut-off was selected, which represents the FPKM (fragments per kilobase of exon model per million reads mapped) value that yields maximal difference with regard to survival between the two groups of patients at the lowest log-rank P-value), the 5-year survival for patients with high expression (>33.2) was 18%, and the 5-year survival for patients with low expression (<33.2) was 37%. *p<0.05, **p<0.01, ***p<0.005.
In addition to tumor analysis, RNA-seq Hallmark pathway analysis of the mT3–2D-GFP cell line and sorted mT3–2D-GFP cancer cells isolated from WT and SCID tumors was used to identify pathways that were modified specifically in the malignant cells. IFNγ response and IFNα responses were the most significantly enriched pathways in sorted mT3–2D-GFP cancer cells isolated from tumors grown in WT mice compared to tumors grown in SCID mice (FDR adjusted p-values of 1.72×10⁻¹¹ and 1.29×10−06, respectively) (Supplementary Table S7). Malignant epithelial cell Stat1 was selectively induced in the WT malignant cells (Supplementary Table S6), which was validated by RT-qPCR (Figure 4F). Using the Human Protein Atlas online tool (https://www.proteinatlas.org/), it was found that high STAT1 expression was significantly associated with shorter overall survival for all pancreatic cancer patients (Figure 4G), suggesting a potential role for STAT1 in resistance to human pancreatic cancer immune control.
Differences in the induction of other Stat genes (Stat2, Stat3, Stat4, Stat5b, and Stat6) were less prominent between WT and SCID tumors compared to Stat1 by NanoString nCounter analysis (Supplementary Figure S13A–E). Similarly, using mass spectrometry, none of the other STAT proteins were selectively induced in the WT tumors compared to the SCID tumors (Supplementary Figure S13F). Also, Human Protein Atlas survival analysis of the TCGA data indicated that although STAT2, STAT3, STAT5A and STAT6 were not significant prognostic factors, high STAT4 and STAT5B expression were associated with longer overall survival in pancreatic cancer (Supplementary Figure S14). Together, these results suggest that STAT1 was selectively induced both in WT malignant cells and in WT tumor microenvironments compared to SCID samples, and that STAT1 may play a role in immune resistance.
Ruxolitinib Downregulates CCL9 and ARG1 Expression and Promotes Anti-PD1 Efficacy
It has been reported that STAT1 signaling regulates TAM-mediated T-cell inhibition by regulating arginase activity and nitric oxide production (32). CCL9 expression is induced by the interferon consensus sequence-binding protein (ICSBP)(33). To investigate the effect of JAK/STAT signaling on the expression of Ccl9 and Arg1, we treated mT3–2D cells in vitro with ruxolitinib for up to 12 hours. Using RT-qPCR, we determined that the expression of Ccl9 and Arg1 were downregulated upon ruxolitinib treatment (Supplementary Figure S15A–B). The effect was not unique to mT3–2D cells, as the effect was reproduced in multiple murine KPC cell lines (Supplementary Figure S15C–D).
To determine if the ruxolitinib-mediated inhibition of CCL9 and ARG1 was maintained in vivo and if ruxolitinib had anti-tumor effects, we treated mT3–2D immunocompetent mice with either PBS, ruxolitinib, anti-PD-1, or the combination of anti-PD1 and ruxolitinib. Although ruxolitinib monotherapy did not result in significant tumor growth inhibition, ruxolitinib improved the anti-tumor efficacy of anti-PD-1 treatment. In fact, although anti-PD-1-treated mice had an initial reduction in tumor size, the majority of the tumors eventually progressed. However, all tumors in the combination group were completely rejected (Figure 5A, Supplementary Figure S16). Using Western blotting, CCL9 protein was reduced in tumors from the ruxolitinib-treated mice compared to the control group (Figure 5B), which was consistent with the expression of S100a9 (S100a8 was not detectable by Western blot in both groups)(Figure 5C). A similar but less consistent pattern of inhibition was also seen in ARG1 protein expression (Figure 5D). Ruxolitinib did not affect the cellular proliferation rate of mT3–2D cells in vitro even at high concentrations (Supplementary Figure S17A), suggesting that the ruxolitinib effect was host immunity-dependent. Knowing that JAK/STAT signaling is essential for T-cell differentiation (34), the impact of ruxolitinib in vivo on T-cell frequency was evaluated using flow cytometry. No significant difference in the frequency of intratumoral CD4+ and CD8+ T cells was detected (Supplementary Figure S17B–C). The effect of ruxolitinib on the major CD11b+ myeloid cell populations expressing PD-L1 was also evaluated and showed a trend toward lower frequencies in the ruxolitinib monotherapy group compared to the control group (Supplementary Figure S17D–E).
Figure 5. Ruxolitinib downregulates CCL9 and ARG1 expression in vivo and improves the anti-tumor efficacy of anti-PD-1 treatment.

(A) Tumor growth curve depicting the average (±SEM) volume of mT3–2D tumors grown in C57BL/6J immunocompetent mice treated with PBS (n=5), ruxolitinib (n=5), anti-PD-1 (n=7), or combination anti-PD-1 and ruxolitinib (n=5). Two-way ANOVA followed by Tukey multiple comparison test was used for up to day 34, and two-tailed t-test was used for days 36 and 39. *p<0.05, **p<0.01, ***p< 0.005, ****p<0.0001. Dark pink asterisks (*): comparison between combination and ruxolitinib groups. Purple asterisks (*): comparison between anti-PD-1 and ruxolitinib groups. Dark pink asterisks in circles: comparison between combination and PBS groups. Purple asterisks in circles: comparison between anti-PD-1 and PBS groups. (B-D) Western blot of CCL9, tubulin, S100a9, ARG1, and GAPDH in the indicated samples. The dark pink band for the S100a9 recombinant protein (RP) indicates saturation. Densitometry values of expression relative to either tubulin or GAPDH indicated above the Western blot and shown in the bar plot to the right. Data represented as mean±SEM. Rux.: ruxolitinib, Ctrl.: control.
Discussion
The goal of this study was to determine the extent to which anti-tumor T cell immunity shapes the immunosuppressive tumor microenvironment (TME) in murine models of pancreatic ductal adenocarcinoma (PDAC). Here, we demonstrated that, despite the clear induction of T-cell responses in syngeneic mT3–2D and KP1 PDAC-bearing immunocompetent WT mice, T-cell immunity incompletely regulated tumor growth. Stimulated anti-tumor T-cell responses induced a myeloid mimicry phenomenon by malignant epithelial pancreatic cells and stimulated intratumoral infiltration of PD-L1-expressing myeloid cells. These tumor cell-based responses to anti-tumor immunity promoted immune escape in these model systems, which could be reversed by inhibiting JAK/STAT signaling (Figure 6).
Figure 6. Anti-tumor T-cell immunity induces pancreatic cancer immune suppression.

(A) Graphical representation of the linkages between anti-tumor immunity and tumor-derived immunosuppression. (B) Graphical representation of how targeting JAK/STAT signaling using ruxolitinib reduces the expression of CCL9, S100a9, and ARG1, which are associated with immune resistance. Arrows indicate induction and blunted lines indicate inhibition. The red line indicates the effect of ruxolitinib and the red “X”s indicate the molecules that were targeted by ruxolitinib.
T cells in human pancreatic tumors are generally infrequent and incapable of eliciting anti-tumor immunity (3,9). Thus, T-cell immunity has been considered irrelevant to pancreatic cancer, and it has been argued that the pancreas might have organ site-specific resistance to immunotherapy. This hypothesis was supported by the observation that the vast majority of pancreatic cancer immunotherapy clinical trials have failed (9). However, studies show that tumors of long-term pancreatic cancer survivors exhibit potent cytotoxic T-cell responses (7). Immune checkpoint inhibitors, which promote T-cell responses, have demonstrated efficacy in pancreatic cancer patients with MSI-high tumors (8).Induced T-cell immunity has also been shown to be associated with the induction of a fibro-inflammatory microenvironment that drives pancreatic cancer disease progression and metastasis in mouse models (26). Hence, T-cell immunity is likely to play a critical role in pancreatic cancer biology, but further resolution of the molecular determinants of immune resistance and evasion in pancreatic malignancy is needed. The goal of this study was to address the extent to which immune resistance in pancreatic cancer is a tumor-intrinsic property and if it is induced in response to anti-tumor T-cell responses. If the latter is true, identifying immunosuppressive mechanisms that cancer cells employ in order to survive in the face of T-cell recognition and attack may facilitate the development of novel immunotherapies and improve responses to currently available treatment strategies.
To address this goal, we investigated the effects of T-cell anti-tumor response on pancreatic cancer using the mT3–2D subcutaneous murine model, the mT3–2D orthotopic model, and the KP1 subcutaneous model. Two types of analysis were performed: (i) malignant epithelial cell analysis and (ii) whole tumor analysis. The former determined how malignant cells specifically responded to anti-tumor immune responses, whereas the latter determined the effect of anti-tumor immunity on the TME, including cancer cells and non-cancer stromal elements. Combining these two approaches provided a comprehensive understanding of the complex interactions between cancer cells and the immune system.
The mT3–2D cell line may reflect the immunogenicity of human PDAC. In this mouse model, we identified 125 putative cancer neoantigens within 11 samples, with only 14 potential neoepitopes predicted to be shared between the three groups, half of which were validated by Sanger sequencing. The slow tumor growth rate in immunocompetent mice suggested that at least some of these mutations stimulated T-cell responses. However, it is likely that T-cell responses were also directed against tumor-associated antigens (35). Although pancreatic cancers generally have lower mutational load compared to other cancers, such as melanoma, several comprehensive genomic analyses have shown that human pancreatic tumors exhibit a considerable number of mutations. For example, Waddell et al. report that the average number of mutations/Mb in 100 human PDAC samples is 2.64, ranging from 0.65 to 28.2 mutations/Mb. per Mega base. More importantly, pancreatic cancers are also likely to express immunogenic mutations (36). Balachandran et al. reported that the median number of putative neoantigens detected per pancreatic cancer patient is 38 in the MSKCC cohort and 32 in the ICGC cohort (7). Bailey et al. demonstrate that the number of neoantigen-related mutations in human PDAC ranges from 4 to 4000 neoantigens per sample (37,38). As a result, the detection of 125 putative cancer neoantigens within 11 samples suggested that the mT3–2D mouse model was reminiscent of human disease, supporting the notion that pancreatic tumors may employ mechanisms to evade anti-tumor T-cell immunity even when PDAC tumors exhibit sufficient immunogenicity. We were able to validate our major findings using the KP1 KPC model, suggesting that our observations were not limited to tumors derived from the mT3–2D cell line.
The myeloid mimicry phenomenon in cancer cells has been reported previously in several cancer types, including breast cancer, colorectal cancer, and pancreatic cancer, and it is associated with advanced disease and worse outcomes (39–41). Some studies determined that the expression of myeloid markers by cancer cells was a result of cancer cell-immune cell fusion, and thus created hybrids that express characteristics of both cellular origins (42–44). In our study, we determined that sorted malignant epithelial cells and murine KPC cell lines expressed chemokine CCL9, ARG1, and CD68, but did not express CD45, the transmembrane protein expressed by all hematopoietic cells, suggesting that the myeloid mimicry phenomenon we reported here was not a consequence of cell fusion. Our data suggest that anti-tumor immune responses play an important role in regulating this phenomenon.
Whole tumor analysis using global proteomics profiling and multiparametric flow cytometry revealed selective increases of the myeloid cell-associated proteins S100a8 and S100a9 and increased infiltration of PD-L1+ myeloid cells in WT compared to SCID and T-cell depleted tumors, respectively, potentially via CCL9/CCR1 signaling. CCL9 induction by cancer cells is shown to be associated with the recruitment of CCR1-expressing immunosuppressive myeloid cells, and that targeting CCL9/CCR1 interaction limited tumor growth in mice. However, the phenotype of these CCR1-expressing myeloid cell populations varies among cancer models (27–31). Together, our findings suggest that anti-tumor T-cell immunity, potentially through myeloid mimicry, was associated with the infiltration of PD-L1-expressing myeloid cells that contributed to establishing an immunosuppressive pancreatic TME.
Whole tumor analysis consistently indicated upregulation of STAT1 protein in WT tumors compared to SCID tumors, but other STAT proteins were less different between the two groups. The upregulation of STAT1 expression in the TME of immunocompetent tumors compared to tumors from T-cell deficient SCID mice is expected, and is likely caused by the induction of IFNγ signaling in response to T-cell immunity. However, we found that STAT1 expression was also upregulated selectively in epithelial cells isolated from WT tumors, suggesting a role for STAT1 as an orchestrator of this myeloid mimicry phenomenon. Interestingly, a study has identified an interferon-stimulated gene (ISG) resistance signature (ISG.RS), predominantly expressed in human cancer cells and associated with resistance to immune checkpoint blockade. STAT1, but not any other STAT genes, is a component of this ISG.RS signature (45). We found that JAK/STAT signaling regulated the expression of CCL9 and ARG1, which were reduced in mT3–2D cells following ruxolitinib exposure. Although in vivo ruxolitinib treatment targets malignant cells as well as the tumor stroma, the reduction of CCL9 in tumors from ruxolitinib-treated mice compared to control tumors suggests that the ruxolitinib effect involved targeting the malignant cells. Muthalagu et al. describe a role for mutant KRAS and MYC cooperation in suppressing STAT1 signaling in a murine model of pancreatic cancer (46). In contrast to our study, they did not examine the impact of anti-tumor immunity on these molecular interactions. STAT1 overexpression was an adverse prognostic factor in human pancreatic cancer. Together, these data suggest that potentially immunosuppressive CCL9 and ARG1 expression in cancer cells was elicited in response to the anti-tumor immune responses through JAK/STAT signaling.
We found that ruxolitinib treatment improved anti-PD-1 therapeutic effects in immunocompetent mice bearing mT3–2D subcutaneous tumors. A similar observation was reported in a study by Lu et al. using the PANC02 orthotopic murine pancreatic cancer model (47). Lu et al. also demonstrate that ruxolitinib induces cytotoxic T-cell frequency and activity in the TME. In a related study, Nagathihalli et al. report that AZD1480 (a JAK inhibitor) can improve survival in several PDAC mouse models (48). Mace et al. show a benefit of blocking IL6, which leads to the activation of JAK/STAT signaling, in combination with PD-1 blockade in mouse models of pancreatic cancer (49). Hence, our findings may be generally applicable and translatable into the clinical trial setting.
Myeloid cell populations are highly heterogenous (50,51). Although many myeloid cell populations can stimulate immune evasion and resistance via a wide range of immunosuppressive mechanisms, some myeloid cells have anti-tumor properties (52). We found that PD-L1-expressing myeloid cells, mainly TAMs, were selectively induced in WT tumors compared to SCID and T-cell depleted tumors in the mT3–2D subcutaneous and orthotopic models, as well as the KP1 subcutaneous model. Consistent with this observation, PD-L1-expressing myeloid cells have been reported to promote immune escape (53,54). Thus, our observations suggest that the anti-tumor T-cell immune responses altered intratumoral myeloid cell profiles that likely contributed to immune resistance in PDAC.
Despite the induction of tumor-directed T-cell immunity in multiple immunocompetent models, T-cell immunity incompletely controlled tumor growth. We have shown that the anti-tumor immune responses, via JAK/STAT signaling, stimulated a myeloid mimicry phenomenon, and this was potentially associated with the intratumoral infiltration of PD-L1-expressing myeloid cells that likely played an important role in immune resistance. These observations could be relevant to human pancreatic cancer and potentially other malignancies. Future studies will further elucidate the specific role of STAT1 signaling using genetically engineered mouse models that permit study of the influence of immune selection pressure on the evolution of tumor-derived immunosuppression.
Supplementary Material
Acknowledgments
This research was supported by NCI R01 CA50633 (LMW) and National Institutes of Health (NIH)/National Cancer Institute (NCI) Grant P30-CA051008 (LMW). Lombardi Comprehensive Cancer Center Shared Resources supporting this study included: The Genomics & Epigenomics Shared Resource, the Flow Cytometry & Cell Sorting Shared Resource, the Tissue Culture Shared Resource, Proteomics & Metabolomics Shared Resource, Biostatistics & Bioinformatics Shared Resource, and Histopathology & Tissue Shared Resource. RA was supported by King Saud bin Abdulaziz University for Health science (KSAU-HS) and the Saudi Arabian Cultural Mission (SACM). This research was sponsored by the Laboratory Directed Research and Development Program at Oak Ridge National Laboratory (ORNL), which is managed by UT-Battelle, LLC, for the U.S. Department of Energy (DOE) under Contract No. DE-AC05-00OR22725. C.J.C. was supported by NIH/NIGMS- IMSD grant R25GM086761 (JMP). This research was supported by Lustgarten Foundation, the Emerson Foundation (640183), the Allegheny Foundation (EJF). This research was supported by Leidos Biomedical Research, Inc., and has been funded in whole or in part with federal funds from the National Cancer Institute, NIH, under Contract HHSN261200800001E (MC and MM) and R01AI145549-02 (MC).
Footnotes
| Name of Entity | Nature of Interest or Relationship | Expiration Date |
|---|---|---|
| Financial Interests | ||
Celldex Therapeutics,
|
Scientific Advisory Board | N/A |
CytomX Therapeutics, Inc.
|
External Advisory Board | N/A |
Jounce Therapeutics
|
Scientific Advisory Board, Co-Founder | N/A |
Targeted Diagnostic and Therapeutics, Inc.
|
Investment/Stock | N/A |
Immunome, Inc.
|
Scientific Advisory Board | N/A |
Klus Pharmaceuticals, Inc.
|
Scientific Advisory Board | N/A |
Bioxcel Therapeutics, Inc.
|
Clinical Advisory Board | N/A |
Forty-Seven, Inc.
|
Scientific Advisory Board | N/A |
Origin Commercial Ventures
|
Consultant | N/A |
Tessa Therapeutics
|
Scientific Advisory Board | N/A |
Samyang Biopharm USA Inc.
|
Scientific Advisory Board | N/A |
References
- 1.Bray F, Ferlay J, Soerjomataram I, Siegel RL, Torre LA, Jemal A. Global cancer statistics 2018: GLOBOCAN estimates of incidence and mortality worldwide for 36 cancers in 185 countries. CA Cancer J Clin. 2018; [DOI] [PubMed] [Google Scholar]
- 2.American Cancer Society. Facts & Figures 2019. American Cancer Society. 2019. [Google Scholar]
- 3.Ino Y, Yamazaki-Itoh R, Shimada K, Iwasaki M, Kosuge T, Kanai Y, et al. Immune cell infiltration as an indicator of the immune microenvironment of pancreatic cancer. Br J Cancer. 2013; [DOI] [PMC free article] [PubMed] [Google Scholar]
- 4.Masugi Y, Abe T, Ueno A, Fujii-Nishimura Y, Ojima H, Endo Y, et al. Characterization of spatial distribution of tumor-infiltrating CD8+ T cells refines their prognostic utility for pancreatic cancer survival. Mod Pathol. 2019; [DOI] [PubMed] [Google Scholar]
- 5.Li J, Byrne KT, Yan F, Yamazoe T, Chen Z, Baslan T, et al. Tumor Cell-Intrinsic Factors Underlie Heterogeneity of Immune Cell Infiltration and Response to Immunotherapy. Immunity. 2018; [DOI] [PMC free article] [PubMed] [Google Scholar]
- 6.Collins MA, Bednar F, Zhang Y, Brisset JC, Galbán S, Galbán CJ, et al. Oncogenic Kras is required for both the initiation and maintenance of pancreatic cancer in mice. J Clin Invest. 2012; [DOI] [PMC free article] [PubMed] [Google Scholar]
- 7.Balachandran VP, Łuksza M, Zhao JN, Makarov V, Moral JA, Remark R, et al. Identification of unique neoantigen qualities in long-term survivors of pancreatic cancer. Nature. 2017; [DOI] [PMC free article] [PubMed] [Google Scholar]
- 8.Marabelle A, Le DT, Ascierto PA, Di Giacomo AM, de Jesus-Acosta A, Delord JP, et al. Efficacy of pembrolizumab in patients with noncolorectal high microsatellite instability/mismatch repair–deficient cancer: Results from the phase II KEYNOTE-158 study. J Clin Oncol. 2020; [DOI] [PMC free article] [PubMed] [Google Scholar]
- 9.Balachandran VP, Beatty GL, Dougan SK. Broadening the Impact of Immunotherapy to Pancreatic Cancer: Challenges and Opportunities. Gastroenterology. 2019; [DOI] [PMC free article] [PubMed] [Google Scholar]
- 10.Boj SF, Hwang C Il, Baker LA, Chio IIC, Engle DD, Corbo V, et al. Organoid models of human and mouse ductal pancreatic cancer. Cell. 2015; [DOI] [PMC free article] [PubMed] [Google Scholar]
- 11.Zhu Y, Knolhoff BL, Meyer MA, Nywening TM, West BL, Luo J, et al. CSF1/CSF1R blockade reprograms tumor-infiltrating macrophages and improves response to T-cell checkpoint immunotherapy in pancreatic cancer models. Cancer Res. 2014; [DOI] [PMC free article] [PubMed] [Google Scholar]
- 12.Li H, Durbin R. Fast and accurate short read alignment with Burrows-Wheeler transform. Bioinformatics. 2009; [DOI] [PMC free article] [PubMed] [Google Scholar]
- 13.Van der Auwera GA, Carneiro MO, Hartl C, Poplin R, del Angel G, Levy-Moonshine A, et al. From fastQ data to high-confidence variant calls: The genome analysis toolkit best practices pipeline. Curr Protoc Bioinforma. 2013; [DOI] [PMC free article] [PubMed] [Google Scholar]
- 14.McLaren W, Gil L, Hunt SE, Riat HS, Ritchie GRS, Thormann A, et al. The Ensembl Variant Effect Predictor. Genome Biol. 2016; [DOI] [PMC free article] [PubMed] [Google Scholar]
- 15.Hundal J, Kiwala S, McMichael J, Miller CA, Xia H, Wollam AT, et al. pVACtools: a computational toolkit to identify and visualize cancer neoantigens. Cancer Immunol Res. 2020; [DOI] [PMC free article] [PubMed] [Google Scholar]
- 16.Andreatta M, Nielsen M. Gapped sequence alignment using artificial neural networks: Application to the MHC class i system. Bioinformatics. 2016; [DOI] [PMC free article] [PubMed] [Google Scholar]
- 17.Lawrence MS, Stojanov P, Polak P, Kryukov GV., Cibulskis K, Sivachenko A, et al. Mutational heterogeneity in cancer and the search for new cancer-associated genes. Nature. 2013; [DOI] [PMC free article] [PubMed] [Google Scholar]
- 18.Duan F, Duitama J, Al Seesi S, Ayres CM, Corcelli SA, Pawashe AP, et al. Genomic and bioinformatic profiling of mutational neoepitopes reveals new rules to predict anticancer immunogenicity. J Exp Med. 2014; [DOI] [PMC free article] [PubMed] [Google Scholar]
- 19.Li H, Durbin R. Fast and accurate long-read alignment with Burrows-Wheeler transform. Bioinformatics. 2010; [DOI] [PMC free article] [PubMed] [Google Scholar]
- 20.Love MI, Huber W, Anders S. Moderated estimation of fold change and dispersion for RNA-seq data with DESeq2. Genome Biol. 2014; [DOI] [PMC free article] [PubMed] [Google Scholar]
- 21.Liberzon A, Birger C, Thorvaldsdóttir H, Ghandi M, Mesirov JP, Tamayo P. The Molecular Signatures Database Hallmark Gene Set Collection. Cell Syst. 2015; [DOI] [PMC free article] [PubMed] [Google Scholar]
- 22.Kanehisa M, Sato Y, Furumichi M, Morishima K, Tanabe M. New approach for understanding genome variations in KEGG. Nucleic Acids Res. 2019; [DOI] [PMC free article] [PubMed] [Google Scholar]
- 23.Aldeghaither DS, Zahavi DJ, Murray JC, Fertig EJ, Graham GT, Zhang YW, et al. A mechanism of resistance to antibody-targeted immune attack. Cancer Immunol Res. 2019; [DOI] [PMC free article] [PubMed] [Google Scholar]
- 24.Ajina R, Zamalin D, Zuo A, Moussa M, Catalfamo M, Jablonski SA, et al. SpCas9-expression by tumor cells can cause T cell-dependent tumor rejection in immunocompetent mice. Oncoimmunology. 2019; [DOI] [PMC free article] [PubMed] [Google Scholar]
- 25.Van Gassen S, Callebaut B, Van Helden MJ, Lambrecht BN, Demeester P, Dhaene T, et al. FlowSOM: Using self-organizing maps for visualization and interpretation of cytometry data. Cytom Part A. 2015; [DOI] [PubMed] [Google Scholar]
- 26.H S, K VE, H BH, Z C, B MA, K BL, et al. Dendritic Cell Paucity Leads to Dysfunctional Immune Surveillance in Pancreatic Cancer. Cancer Cell. 2020; [DOI] [PMC free article] [PubMed] [Google Scholar]
- 27.Kitamura T, Fujishita T, Loetscher P, Revesz L, Hashida H, Kizaka-Kondoh S, et al. Inactivation of chemokine (C-C motif) receptor 1 (CCR1) suppresses colon cancer liver metastasis by blocking accumulation of immature myeloid cells in amouse model. Proc Natl Acad Sci U S A. 2010; [DOI] [PMC free article] [PubMed] [Google Scholar]
- 28.Kitamura T, Kometani K, Hashida H, Matsunaga A, Miyoshi H, Hosogi H, et al. SMAD4-deficient intestinal tumors recruit CCR1+ myeloid cells that promote invasion. Nat Genet. 2007; [DOI] [PubMed] [Google Scholar]
- 29.Rodero MP, Auvynet C, Poupel L, Combadière B, Combadière C. Control of both myeloid cell infiltration and angiogenesis by ccr1 promotes liver cancer metastasis development in mice. Neoplasia (United States). 2013; [DOI] [PMC free article] [PubMed] [Google Scholar]
- 30.Hirai H, Fujishita T, Kurimoto K, Miyachi H, Kitano S, Inamoto S, et al. CCR1-mediated accumulation of myeloid cells in the liver microenvironment promoting mouse colon cancer metastasis. Clin Exp Metastasis. 2014; [DOI] [PMC free article] [PubMed] [Google Scholar]
- 31.Li B, Zhang S, Huang N, Chen H, Wang P, Yang J, et al. CCL9/CCR1 induces myeloid-derived suppressor cell recruitment to the spleen in a murine H22 orthotopic hepatoma model. Oncol Rep. 2019; [DOI] [PubMed] [Google Scholar]
- 32.Kusmartsev S, Gabrilovich DI. STAT1 Signaling Regulates Tumor-Associated Macrophage-Mediated T Cell Deletion. J Immunol. 2005; [DOI] [PubMed] [Google Scholar]
- 33.Nardi V, Naveiras O, Azam M, Daley GQ. ICSBP-mediated immune protection against BCR-ABL-induced leukemia requires the CCL6 and CCL9 chemokines. Blood. 2009; [DOI] [PMC free article] [PubMed] [Google Scholar]
- 34.Ghoreschi K, Laurence A, O’Shea JJ. Janus kinases in immune cell signaling. Immunol Rev. 2009; [DOI] [PMC free article] [PubMed] [Google Scholar]
- 35.Feig C, Jones JO, Kraman M, Wells RJB, Deonarine A, Chan DS, et al. Targeting CXCL12 from FAP-expressing carcinoma-associated fibroblasts synergizes with anti-PD-L1 immunotherapy in pancreatic cancer. Proc Natl Acad Sci U S A. 2013; [DOI] [PMC free article] [PubMed] [Google Scholar]
- 36.Waddell N, Pajic M, Patch AM, Chang DK, Kassahn KS, Bailey P, et al. Whole genomes redefine the mutational landscape of pancreatic cancer. Nature. 2015; [DOI] [PMC free article] [PubMed] [Google Scholar]
- 37.Ajina R, Weiner LM. T-Cell Immunity in Pancreatic Cancer. Pancreas. 2020; [DOI] [PMC free article] [PubMed] [Google Scholar]
- 38.Bailey P, Chang DK, Forget MA, Lucas FAS, Alvarez HA, Haymaker C, et al. Exploiting the neoantigen landscape for immunotherapy of pancreatic ductal adenocarcinoma. Sci Rep. 2016; [DOI] [PMC free article] [PubMed] [Google Scholar]
- 39.Clawson GA, Kimchi E, Patrick SD, Xin P, Harouaka R, Zheng S, et al. Circulating tumor cells in melanoma patients. PLoS One. 2012; [DOI] [PMC free article] [PubMed] [Google Scholar]
- 40.Shabo I, Stål O, Olsson H, Doré S, Svanvik J. Breast cancer expression of CD163, a macrophage scavenger receptor, is related to early distant recurrence and reduced patient survival. Int J Cancer. 2008; [DOI] [PubMed] [Google Scholar]
- 41.Shabo I, Olsson H, Sun XF, Svanvik J. Expression of the macrophage antigen CD163 in rectal cancer cells is associated with early local recurrence and reduced survival time. Int J Cancer. 2009; [Google Scholar]
- 42.Shabo I, Midtbö K, Andersson H, Åkerlund E, Olsson H, Wegman P, et al. Macrophage traits in cancer cells are induced by macrophage-cancer cell fusion and cannot be explained by cellular interaction. BMC Cancer. 2015; [DOI] [PMC free article] [PubMed] [Google Scholar]
- 43.Pawelek JM, Chakraborty AK. Fusion of tumour cells with bone marrow-derived cells: A unifying explanation for metastasis. Nature Reviews Cancer. 2008. [DOI] [PubMed] [Google Scholar]
- 44.Terada N, Hamazaki T, Oka M, Hoki M, Mastalerz DM, Nakano Y, et al. Bone marrow cells adopt the phenotype of other cells by spontaneous cell fusion. Nature. 2002; [DOI] [PubMed] [Google Scholar]
- 45.Benci JL, Johnson LR, Choa R, Xu Y, Qiu J, Zhou Z, et al. Opposing Functions of Interferon Coordinate Adaptive and Innate Immune Responses to Cancer Immune Checkpoint Blockade. Cell. 2019; [DOI] [PMC free article] [PubMed] [Google Scholar]
- 46.Muthalagu N, Monteverde T, Raffo-Iraolagoitia X, Wiesheu R, Whyte D, Hedley A, et al. Repression of the type i interferon pathway underlies MYC-and KRAS-dependent evasion of NK and B cells in pancreatic ductal adenocarcinoma. Cancer Discov. 2020; [DOI] [PMC free article] [PubMed] [Google Scholar]
- 47.Lu C, Talukder A, Savage NM, Singh N, Liu K. JAK-STAT-mediated chronic inflammation impairs cytotoxic T lymphocyte activation to decrease anti-PD-1 immunotherapy efficacy in pancreatic cancer. Oncoimmunology. 2017; [DOI] [PMC free article] [PubMed] [Google Scholar]
- 48.Nagathihalli NS, Castellanos JA, Lamichhane P, Messaggio F, Shi C, Dai X, et al. Inverse correlation of STAT3 and MEK signaling mediates resistance to Ras pathway inhibition in pancreatic cancer. Cancer Res. 2018; [DOI] [PMC free article] [PubMed] [Google Scholar]
- 49.MacE TA, Shakya R, Pitarresi JR, Swanson B, McQuinn CW, Loftus S, et al. IL-6 and PD-L1 antibody blockade combination therapy reduces tumour progression in murine models of pancreatic cancer. Gut. 2018; [DOI] [PMC free article] [PubMed] [Google Scholar]
- 50.Peng J, Sun BF, Chen CY, Zhou JY, Chen YS, Chen H, et al. Single-cell RNA-seq highlights intra-tumoral heterogeneity and malignant progression in pancreatic ductal adenocarcinoma. Cell Res. 2019; [DOI] [PMC free article] [PubMed] [Google Scholar]
- 51.Bernard V, Semaan A, Huang J, Anthony San Lucas F, Mulu FC, Stephens BM, et al. Single-cell transcriptomics of pancreatic cancer precursors demonstrates epithelial and microenvironmental heterogeneity as an early event in neoplastic progression. Clin Cancer Res. 2019; [DOI] [PMC free article] [PubMed] [Google Scholar]
- 52.Quaranta V, Schmid MC. Macrophage-Mediated Subversion of Anti-Tumour Immunity. Cells. 2019; [DOI] [PMC free article] [PubMed] [Google Scholar]
- 53.Candido JB, Morton JP, Bailey P, Campbell AD, Karim SA, Jamieson T, et al. CSF1R+ Macrophages Sustain Pancreatic Tumor Growth through T Cell Suppression and Maintenance of Key Gene Programs that Define the Squamous Subtype. Cell Rep. 2018; [DOI] [PMC free article] [PubMed] [Google Scholar]
- 54.Winograd R, Byrne KT, Evans RA, Odorizzi PM, Meyer ARL, Bajor DL, et al. Induction of T-cell immunity overcomes complete resistance to PD-1 and CTLA-4 blockade and improves survival in pancreatic carcinoma. Cancer Immunol Res. 2015; [DOI] [PMC free article] [PubMed] [Google Scholar]
- 55.DeFilippis VR, Alvarado D, Sali T, Rothenburg S, Fruh K. Human Cytomegalovirus Induces the Interferon Response via the DNA Sensor ZBP1. J Virol. 2010; [DOI] [PMC free article] [PubMed] [Google Scholar]
Associated Data
This section collects any data citations, data availability statements, or supplementary materials included in this article.