Abstract
Cell migration is driven by local membrane protrusion via directed polymerization of F-actin at the front. However, F-actin next to the plasma membrane also tethers the membrane and thus resists outgoing protrusions. Here we developed a fluorescent reporter to monitor changes in the density of membrane proximal F-actin (MPA) during membrane protrusion and cell migration. Unlike total F-actin concentration, which was high in the front of migrating cells, MPA density was low in the front and high in the back. Back-to-front MPA density gradients were controlled by higher cofilin-mediated turnover of F-actin in the front. Furthermore, nascent membrane protrusions selectively extended outward from areas where MPA density was reduced. Thus, locally low MPA density directs local membrane protrusions and stabilizes cell polarization during cell migration.
One Sentence Summary:
Membrane protrusion and cell migration are directed by local decreases in the density of F-actin close to the cell membrane.
The cell cortex of eukaryotic cells is composed of a network of F-actin filaments below the plasma membrane (PM) (1). Changes in the organization, thickness, and contractility of the cortex modulates cell shape, and is important for a variety of cell processes such as cell signaling and cell migration (2–4). The PM is reversibly attached to the cortex by a number of linker mechanisms (Fig. S1A) including the binding of ezrin, radixin and moesin (ERM proteins) to both membrane and F-actin (5). Membrane attachment via linkers proteins is restricted to the outermost layer of the cell cortex, here termed membrane proximal F-actin (MPA), with the strength of attachment believed to be regulated by the distance or density of MPA (6).
The actin cortex has a role in directing migrating cells in part through regulating membrane tension (7, 8). The activities controlling severing, nucleation and contraction of F-actin are polarized and lead to both higher F-actin turnover and high F-actin density in the front (9, 10), while ERM proteins are enriched in the rear (11). A priori one would expect that the front of a cell should have high MPA density due to the higher F-actin concentration in lamellipodia (12). If true, however, increased MPA density could lead to stronger membrane attachment in the front, which would be expected to oppose rather than promote protrusion. Whether MPA density is polarized, how local MPA density is regulated, and if MPA density regulates local protrusion in the context of cell migration is unclear.
Cells migrating in 1D, 2D, and 3D have stable MPA gradients with low MPA density in the front
To test directly for spatial heterogeneity of MPA density, we developed a Membrane Proximal F-Actin reporter (termed MPAct) to monitor the local density of MPA. We designed the MPAct reporter by linking a fast-diffusing PM anchor (CaaX) (13) to a low-affinity F-actin binding domain (F-tractin) (14) and a fluorescent protein (XFP) (Fig. 1A). The membrane anchor allowed the reporter to diffuse rapidly along the inner leaflet of the PM and to enrich in regions with higher densities of F-actin near the membrane (Fig. 1A, B). Rapidly reversible binding of the reporter to F-actin ensured that fast changes in local F-actin density can be measured, because the cell cortex is continuously turned over (15). The reporter remains inserted into the PM with a limited search radius that restricted F-actin binding to a membrane-proximal attachment zone within 10 nm from the membrane, much shorter than the approximately 200 nm thick actin cortex (16).
Fig. 1. Development of a fluorescent reporter that measures the local density of membrane-proximal F-actin.
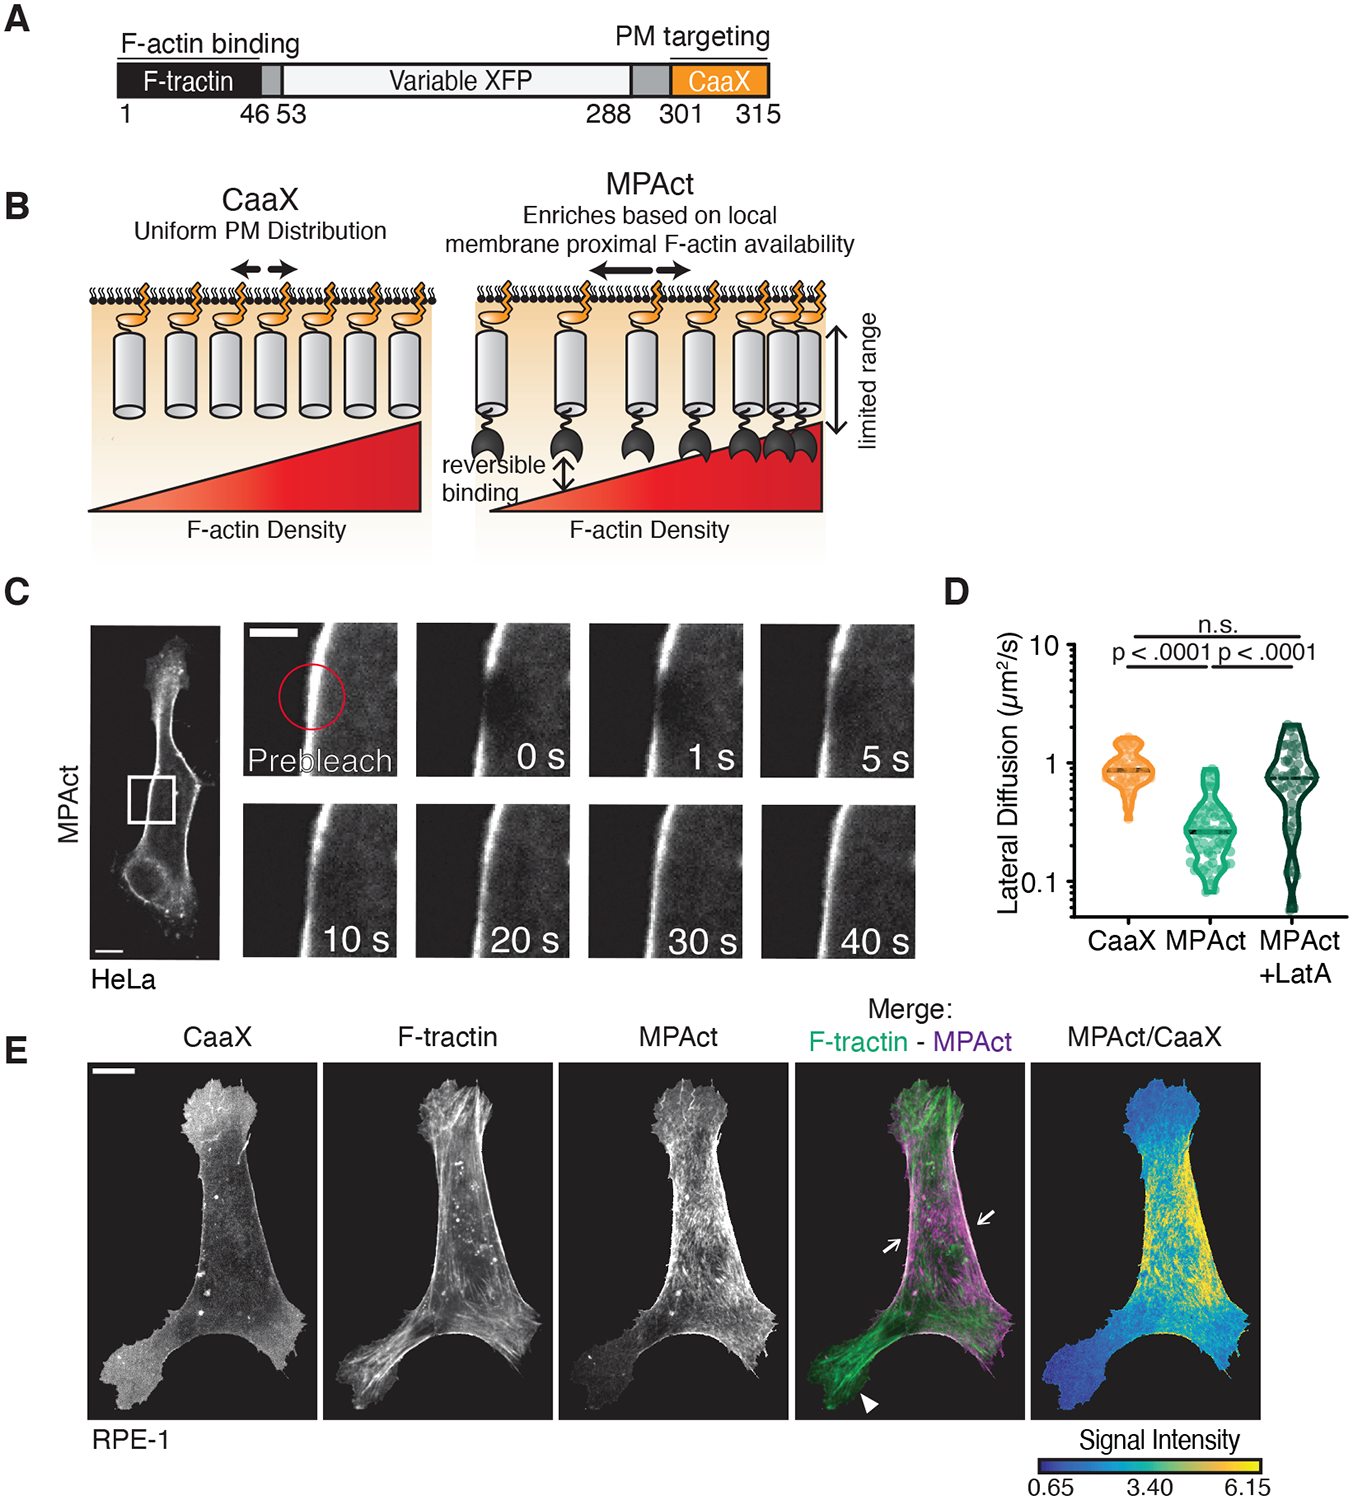
(A) Design of a membrane-proximal actin density (MPAct) reporter. (B) Ratiometric analysis of MPA density. MPAct signal normalized by CaaX PM marker. (C) FRAP analysis of lateral membranes of RPE-1 cells expressing MPAct-mCitrine. Scale bar = 5 μm. (D) Diffusion coefficients calculated from FRAP experiments in RPE-1 with and without 1 μM LatA. N =52, 69, 54 respectively, 2 independent experiments. Median shown. Dotted lines are quartiles. p-values from unpaired t-test. (E) RPE-1 cells expressing MPAct-mCitrine (magenta), CFP-CaaX, and F-tractin-mCherry (green). For all figures, scale bar = 10 μm, unless marked.
We validated that the reporter was exclusively membrane localized and measured local F-actin density near the surface membrane (Figs. S1–2). To determine the relative local MPA density along the PM surface, a ratiometric MPAct signal was measured by dividing the MPAct intensity over the intensity of a CaaX PM marker (here termed MPAct/CaaX or MPAct signal)(Figs. 1E, 2A, B).
Fig. 2. Migrating cells have stable back-to-front MPA density gradients with MPA density being lowest in the front independent of cell type and migration mode.
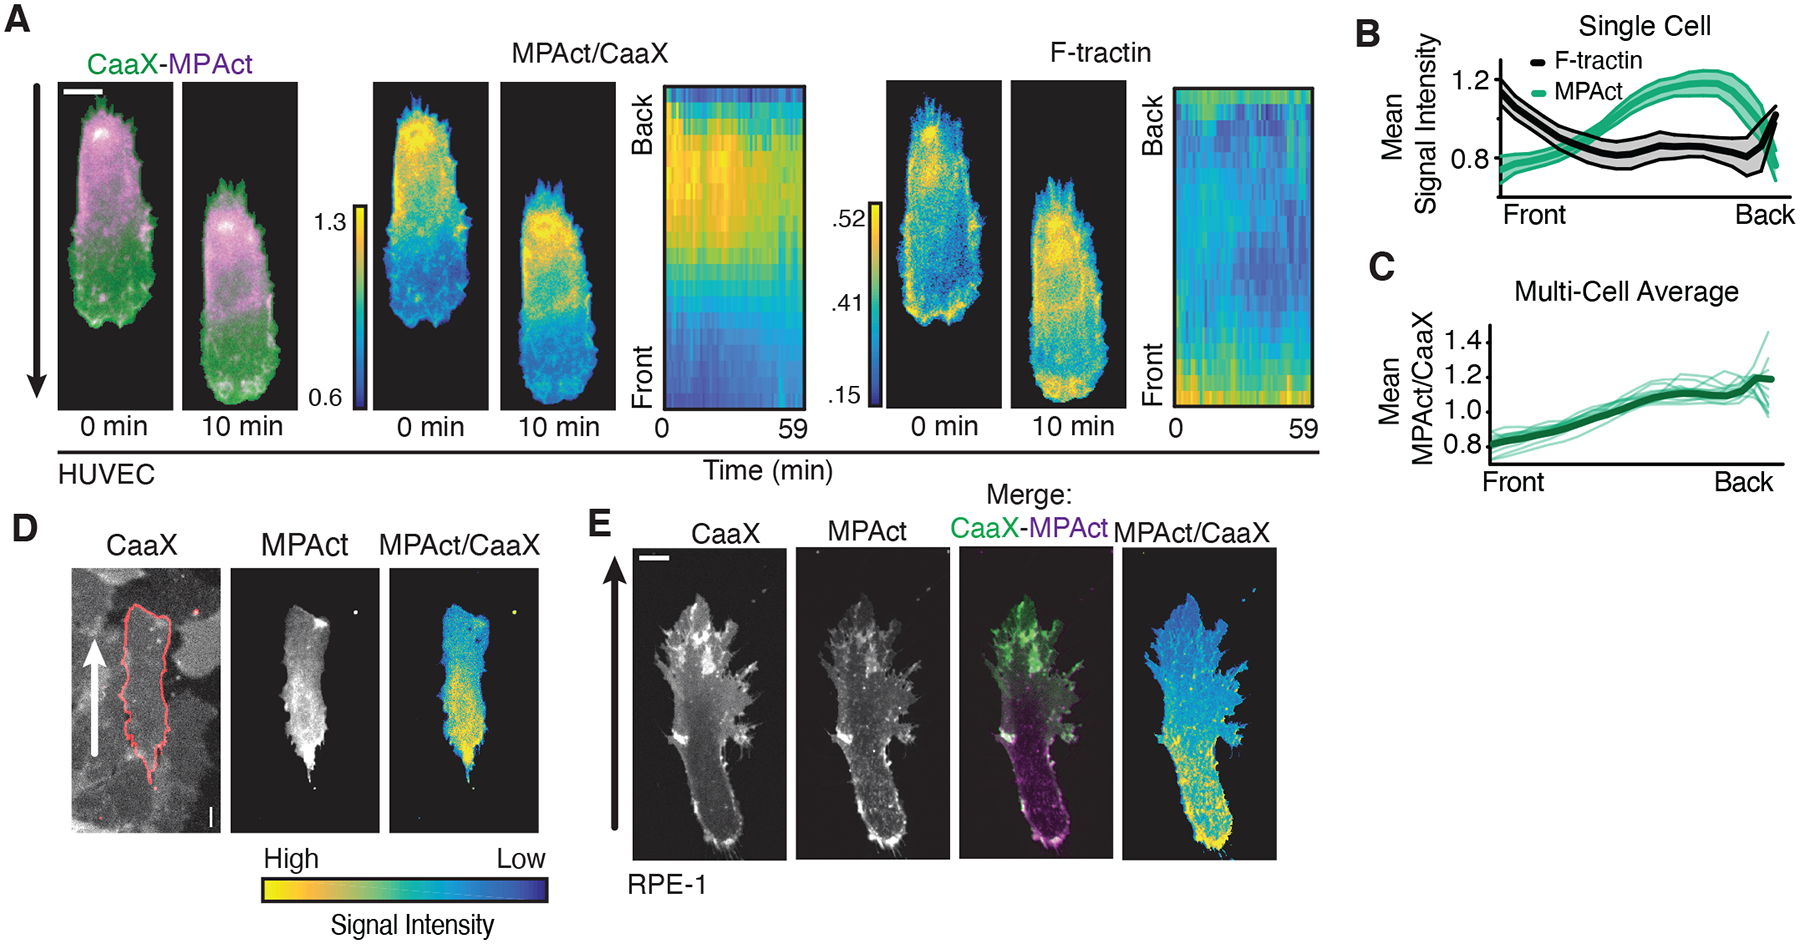
(A) (left) HT-HUVEC expressing MPAct-mCitrine (magenta) and iRFP-CaaX (green) migrating on 20 μm fibronectin stripes. MPAct/CaaX ratio (middle) and F-actin marker F-tractin (right) images shown at same time points. Kymographs of activity changes comparing front-to-back location. 2 min time points. (B) Quantification of activity profile changes over one hour for cell in (A). Error bars are standard deviation. (C) Average gradients of MPAct/CaaX ratio for 14 individual HT-HUVEC (green) and group average (black) migrating on stripes. (D) Example of MPAct/CaaX ratio image in collectively migrating HT-HUVEC monolayers with mosaic MPAct expression. (E) Image section of RPE-1 cells stably expressing iRFP-CaaX (green) and MPAct-mCitrine (magenta) migrating in 0.5 mg/mL collagen matrix. Scale of MPAct/CaaX normalized for maximal signal range. Migration directions indicated by arrows.
In migrating HT-HUVEC endothelial cells, we unexpectedly observed an MPAct signal gradient that was low in the front of migrating cells (Fig. 2A–C; Movie S1). This contrasted with an overall high global F-actin density in the same front region (Fig. 2A, right) (12, 17). Kymograph analysis of HT-HUVEC and RPE-1 epithelial cells showed that MPAct signal gradients were stable during migration (Figs. 2A, S3A–E). Furthermore, the same MPAct signal gradients were observed in single- and collectively migrating cells, cells migrating on collagen or fibronectin substrates, in different migration contexts (1D, 2D, 3D), and using different microscope modalities (confocal, TIRF, epifluorescence) (Figs. 2D–E, S2, S3F–J). Lower F-actin binding in the front resulted in a slower fluorescence recovery after photobleaching (FRAP) recovery in the back versus front (Fig. S4). We observed the same back-to-front MPAct gradient when we varied the type of F-actin binding motif or membrane anchor in the MPAct reporter, and when we used a different PM marker as a reference for normalization (Fig. S5). Finally, the MPAct gradient was identical when we varied the length and flexibility of the linker in the MPAct reporter (Fig. S6), suggesting that the MPAct reporter measures the averaged local MPA density. Thus, migrating cells have an underlying gradient of MPA density, with MPA density lowest in the front.
MPA density is locally decreased prior to membrane protrusion during de novo cell polarization.
When we monitored RPE-1 cells migrating on collagen-coated glass slides, cells frequently repolarized and the MPAct signal gradient formed in the new direction of migration (Fig. 3A–B, Movie S2). In contrast, a mutated MPAct reporter that could not bind F-actin failed to form gradients (Fig. S4D–F, Movie S2). Furthermore, the steepness of the MPAct gradient and average migration velocity were correlated (R2 = .430, N = 44 cells from 2 independent experiments, Fig. 3C–D, S7A–B). Thus, cells may need to decrease MPA density locally to protrude membranes, which in turn may direct and promote cell migration.
Fig. 3. MPA density is locally lowered prior to local Rac activation and local membrane protrusion.
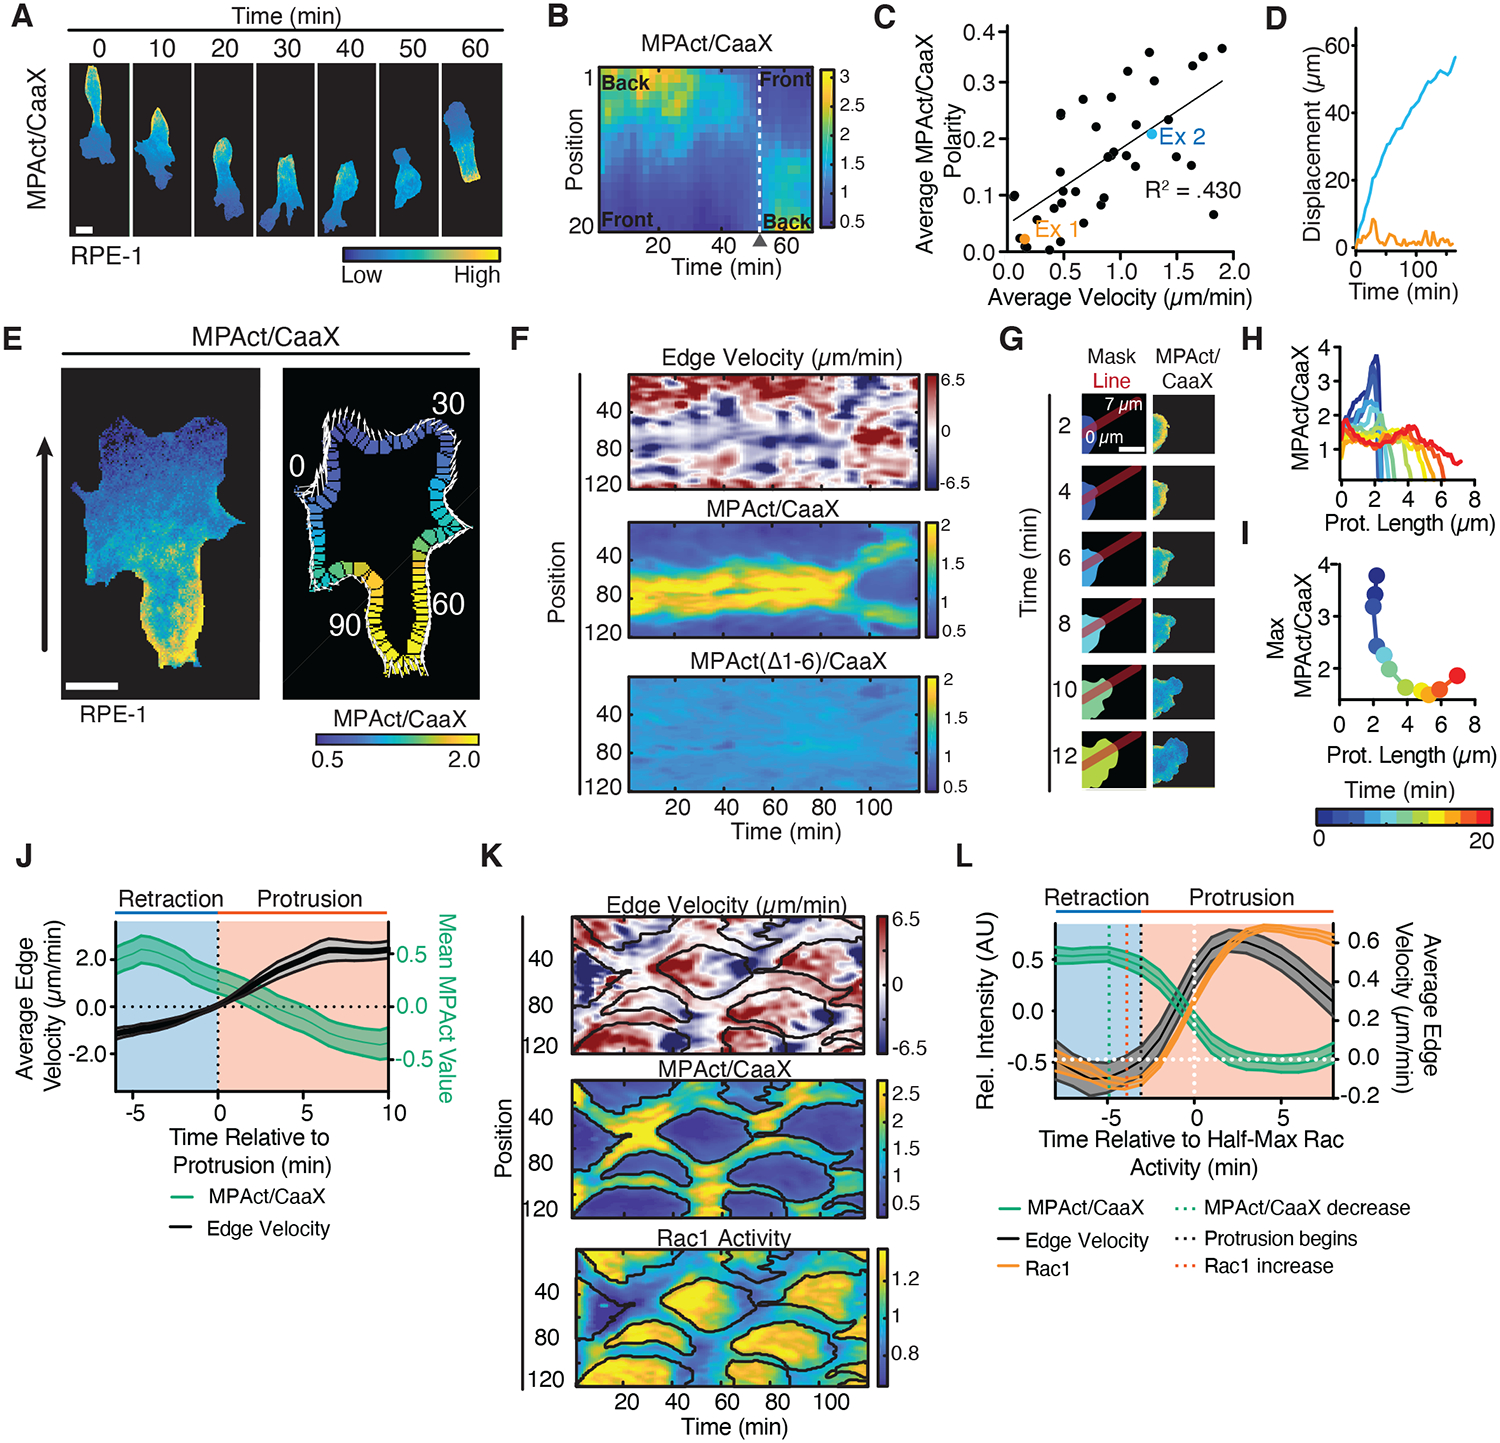
(A, B) Repolarization of migrating RPE-1, MPAct/CaaX image series (A). Kymograph analysis (B). (C-D) Mean MPAct/CaaX gradient steepness versus mean velocity for HT-HUVEC migrating on stripes over periods > 1 hour. Gradient steepness calculated as ratio of MPAct signal between back and front 10 % of cell. Average velocity is total displacement/time. Line of best fit shown. N = 43 cells from 2 independent experiments. (D) Centroid displacement for the two cells marked in (C). (E) Edge parametrization. Local protrusion direction and distance shown as white arrows, global direction as black arrow. (F) Comparison of local edge velocity (top), MPAct/CaaX (middle), MPAct(Δ1–6)/CaaX (bottom) signals versus time. Images taken every 1 minute. (G-I) MPAct signal change during local retraction and protrusion. Red line shows profile direction (G). Analysis of MPAct/CaaX line profile over time (H) and maximal MPAct signal as a function of time and protrusion length (I). Scale bar = 5 μm. (J) Comparison of mean protrusion edge velocity and local MPAct signal change. Traces aligned to time of protrusion. Mean and 95% CI, N = 25 repolarization events. (K) Kymograph of normalized edge velocity (top), MPAct/membrane (middle), and Raichu-Rac1 FRET (bottom) in RPE-1. Edge analysis as in (E-F). Black outlines marks areas of low MPAct signals. (L) In silico activity alignment to half-maximal Rac activation, comparing edge velocity (black, right y-axis), MPAct (green left y-axis), and Raichu-Rac1 (orange, left y-axis) signal time courses. Mean and 95% CI, N =30 events, 3 independent experiments.
To test for a suppressive role of local MPA density in membrane protrusion, we parameterized the edge of cells and correlated local MPAct signals with protrusion/retraction rates along the cell periphery (Fig. 3E, adapted from (18)). This analysis showed a close spatial anti-correlation between low MPAct level and protrusion that was not recapitulated by the control MPAct(Δ1–6) reporter construct (Fig. 3F, S7C–D). An in-silico alignment of the local edge velocity versus the local MPAct signal change during repolarization showed a decrease of MPAct signals approximately 4 minutes prior to protrusion (Figs. 3G–J, S7E–G). These results suggested that locally high MPA density inhibits membrane protrusions and MPA density has to be lowered to promote membrane protrusion.
Local MPA density controls Rac-induced local membrane protrusion
Rac activity increases F-actin polymerization and triggers broad membrane protrusions at the front of many migrating cell types (18). Using a fluorescence resonance energy transfer (FRET) reporter for Rac activity (19), we found that areas of high Rac activity and protrusion-retraction cycles were closely confined to areas of low MPAct signals (Figs. 3K, S7H–J). When aligning MPAct signals in-silico to the time of half-maximal Rac activation, Rac activity increased only after a reduction of MPAct signals (Fig. 3L). The prior reduction in MPA density suggested that high MPA density inhibits both local protrusion and Rac activation.
To directly test the hypothesis that high MPA density inhibits Rac-driven protrusion, we used a Lyn-FRB and Tiam1-FKBP activation system to activate endogenous Rac by rapamycin-induced translocation of the Rac GEF Tiam1 to the PM (20) (Fig. S8A). Rapid and uniform Tiam1 activation using this system triggered selective protrusions only from areas with low MPAct signals (Fig. 4A–D). Protrusions can also be triggered when cells are subjected to hypoosmotic shock (21). We lowered osmolarity by H2O addition and observed rapid membrane protrusions selectively from areas of low MPAct signals (Fig. 4E–F, Fig. S8B). Thus, multiple types of protrusions are directed to low MPA areas.
Fig. 4. Local sites with low MPA density direct local membrane protrusions by Racmediated actin polymerization and osmotic pressure.
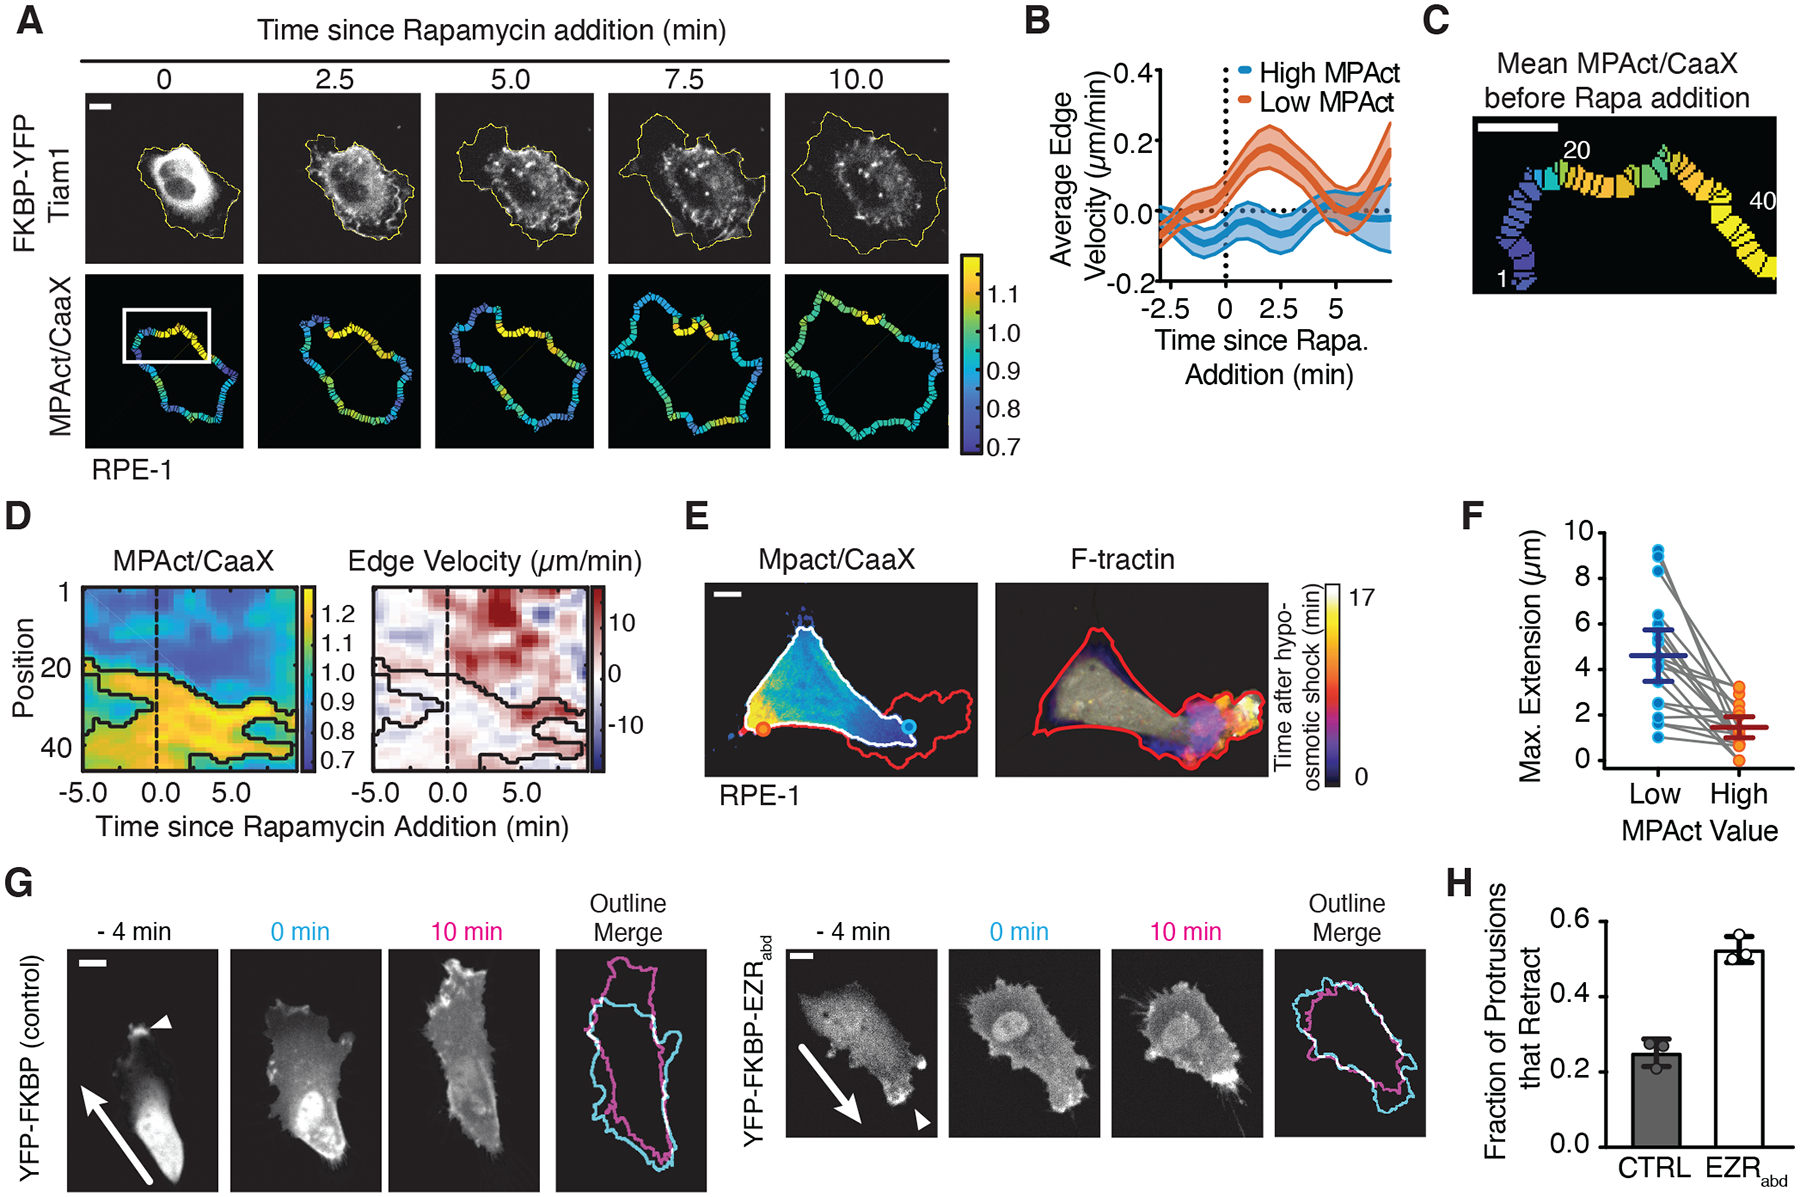
(A-D) Cell response after uniform acute Rac-GEF activation (TIAM). Membrane outline changes shown as yellow periphery (A). Induced edge velocity comparing areas of high (red) and low (blue) MPAct signal. N = 27 cells, 2 independent experiments (B). Kymograph focusing on white box (C) from image in (A) comparing MPAct/CaaX signal (left) and edge velocity (right). Black outlines marks areas of high MPAct signals. Scale bar = 5 μm. (E) (left) MPAct/CaaX image before hypoosmotic shock. Maximum future expansion (red), initial cell area (white). (right) F-tractin image showing progressive expansion after hypoosmotic shock. (F) Hypoosmotic membrane extension over 10 minutes, high versus low MPAct areas. Data from the same cell connected by gray lines. Mean and 95% CI shown. N = 20 cells. (G) Control FKBP-YFP (left) and FKBP-mCitrine-Ezrinabd (right) during rapamycin addition. Active protrusion marked by white arrow and outlines at 0- and 10-minute shown. (H) Mean fraction of retracting protrusions. N =109 (CTRL), 121 (EZRabd) cells from 3 separate experiments. Mean and standard deviation shown.
To directly test whether high MPA density suppressed local protrusion, we engineered a system to acutely increase MPA density using a FKBP construct containing the high affinity (~40 nM (22)) F-actin binding domain of Ezrin (Ezrinabd, Fig. S8C). Upon addition of rapamycin, FKBP-Ezrinabd was recruited to the membrane and increased MPAct signals, as expected (Fig. S8D–F). When compared to a control construct (Fig. 4G - left), recruitment of FKBP-Erzinabd (Fig. 4G - right) triggered increased membrane retraction (Fig. 4H). Thus, high MPA density prohibits membrane protrusions and lowering MPA density is required to sensitize areas for membrane protrusion.
High rates of cofilin regulated MPA disassembly controls locally low MPA density in the front
We next investigated how cells reduce MPA density in the front despite a higher overall F-actin density in the front. Low MPA density could be maintained dynamically by relatively higher F-actin disassembly, lower actin polymerization, lower numbers of F-actin linker proteins, or lower actomyosin contraction rates in the MPA attachment zone in the front (Fig. S9A). We performed a series of rapid perturbation experiments using inhibitors of F-actin regulators to distinguish potential mechanisms and found that most inhibitors show no significant short-term effects (Fig. S9B–E). Markedly, the low MPAct signal in the front was lost when we treated cells with a Jasplakinolide, Blebbistatin and Y-27632 cocktail to inhibit F-actin disassembly and contraction without preventing polymerization (Fig. 5A, S9F–G). In an orthogonal experiment, we used photoactivation of a GFP-tagged actin and monitored loss of the fluorescent signal along the axis of migration. Consistent with a relatively faster F-actin disassembly in the front (23), the GFP-actin fluorescence was lost faster in the front compared to the back (Fig. 5B–C, S9H–J). Thus, a primary mechanism controlling locally low MPA density is continued high F-actin disassembly in the front.
Fig. 5. Higher cofilin-mediated F-actin disassembly in the front versus back regulates the MPA density gradient during cell migration.
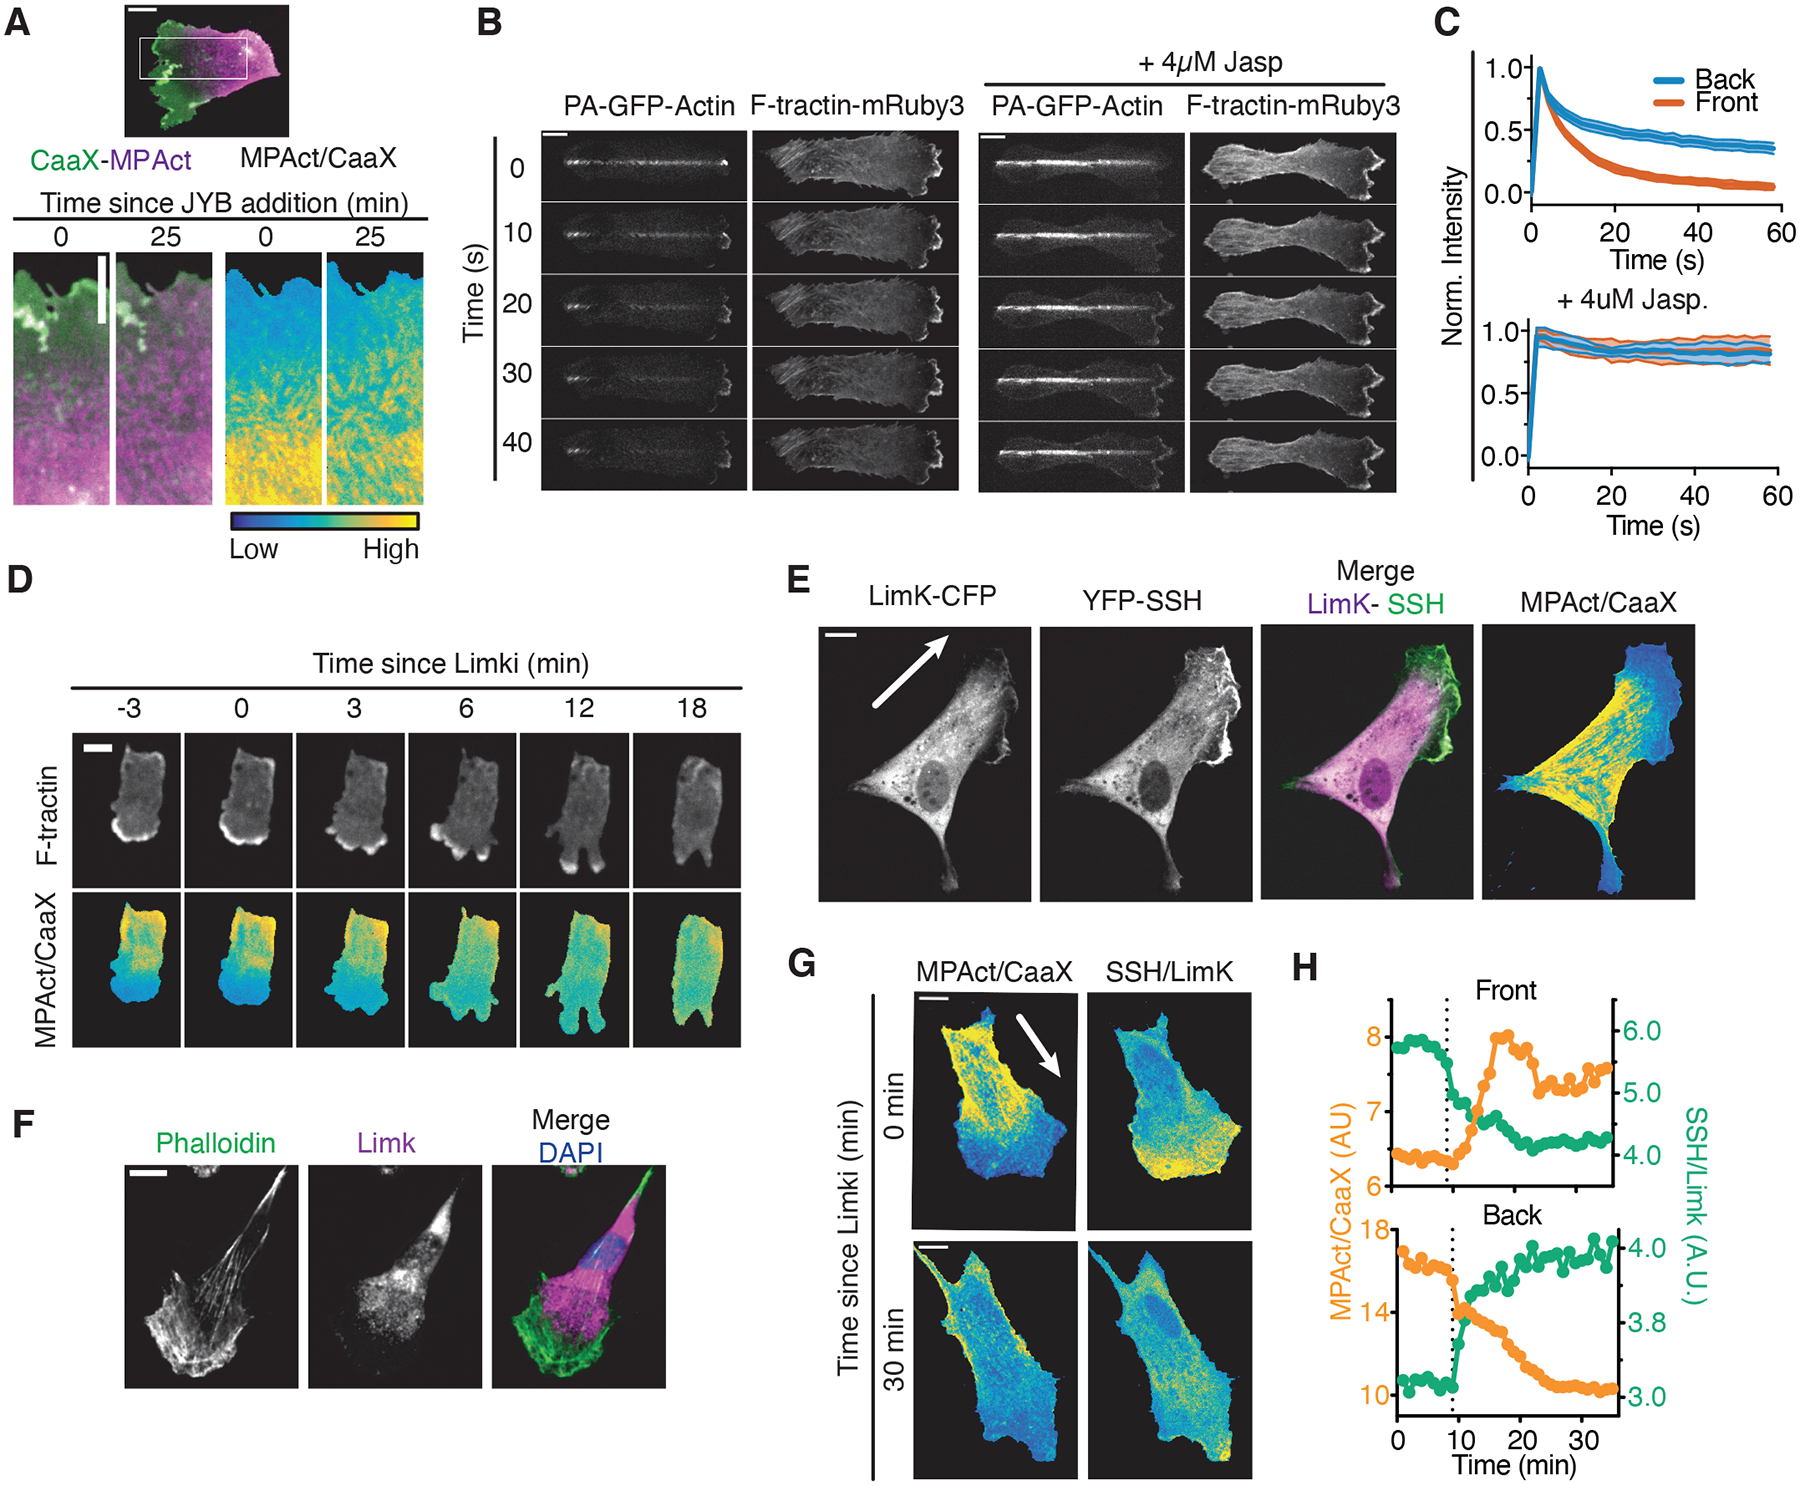
(A) (Top) Migrating RPE-1 before treatment with JBY cocktail. Boxed region is shown below, (Bottom) CaaX (green), MPAct (magenta), and MPAct/CaaX images shown before and after addition of JBY cocktail. (B) PA-GFP-actin and F-tractin dynamics after a PA-GFP-Actin line photoconversion in migrating RPE-1, in control (left), and after addition of 4 μM Jasplakinolide to stabilize F-actin (right). (C) Mean PA-GFP-Actin fluorescence loss at the front (red) and back (blue) of migrating RPE-1 with WT (top, N = 44 cells), 4 μM Jasplakinolide (bottom, N = 9 cells). Mean and 95% confidence intervals (CI) are shown. (D) F-tractin (top) and MPAct/CaaX (bottom) signal changes after addition of 20 μM Limki 3. (E) RPE-1 expressing Limk-CFP (magenta), YFP-SSH (green), MPact-mRuby3 and iRFP-CaaX. (F) RPE-1 stained with phalloidin, anti-αLimk antibody, and Hoechst. (G) Distribution of MPAct/CaaX versus SSH/Limk before and after 20 μM Limki addition (typical example, N = 10 cells). (H) MPAct/CaaX (orange, left y-axis) and SSH/Limk (green, right y-axis) signal changes in front and back for cell in (G). Dashed line, Limki addition.
The ubiquitous F-actin severing protein cofilin is known to have higher activity in the front of migrating cells (24). We hypothesized that cofilin activity could have a distinct effect on MPA versus global F-actin at the front. Cofilin is activated by Slingshot phosphatase (SSH)-mediated dephosphorylation and inactivated by Limk-mediated phosphorylation (Fig. S9L) (24). Treatment with the Limki 3 inhibitor triggered a rapid equilibration of the MPAct gradient between the front and back (Fig. 5D, S9K, Movie S3), and also caused an expected transient increase in the size of membrane protrusions by making more G-actin available for actin polymerization (Fig. S9M) (24). Among several inhibitors of F-actin regulatory processes that we tested (Fig. S9B–G, K), only inhibition of Limk and F-actin turnover resulted in a rapid loss of the MPAct gradient that preceded the overall cell polarity loss.
We confirmed that expressed fluorescently tagged SSH was enriched in the front while expressed Limk was generally enriched in the back (Fig. 5E–G, S9N–O) (9). Upon inhibition of Limk, both the gradient of MPAct and the enrichment of SSH in the front of the cells were largely lost (Fig. 5H). Ratio images of SSH/Limk showed an inverse spatial gradient from front-to-back that closely paralleled the MPAct gradient during cell migration (Fig. 5G, H). We conclude that cofilin-regulated local severing of MPA in the front is a critical mechanism establishing back-to-front gradients of MPA density.
Discussion
Here we developed a ratiometric MPAct reporter that monitors relative differences in local MPA density. In all migrating cell types examined, the reporter showed an unexpected back-to-front gradient in MPA density with the lowest MPA density at the front, despite a higher actin polymerization rate and higher overall F-actin density in the front. Furthermore, under conditions where cells locally protrude membranes, protrusions were invariably generated from sites with low MPA density. A consequence of having low MPA density and low MPA attachment is low membrane tension and local differences in MPA density can thus explain that membrane tension can be low in some areas of a cell and high in others (25). Thus, cells lower local MPA density to direct protrusions and cell movement, and stable back-to-front gradients of MPA density can function as a cytoskeletal “memory” in the face of fluctuating migratory signals to promote directional persistence.
A primary mechanism to lower MPA density was increased disassembly rates of MPA in the front versus back that has to overcome an also higher actin polymerization rate in the front. High cofilin activity in the front was required to establish and continuously maintain the MPA gradient during cell migration. It has previously been proposed that cofilin activation helps initiate protrusion by providing free G-actin monomers (24). Our data argues that cofilin has an additional role to lower local MPA density and thereby direct protrusions.
Low MPA density can direct Rac and osmotically driven protrusions, suggesting that MPA gradients have an analogous role in cells that migrate by polymerizing actin forward or protruding membrane blebs (26). MPA gradients therefore specify “frontness” versus “backness” during migration regardless of the migration modality, and the steepness of MPA gradients can function as a persistence mechanism that regulates cell speed. Finally, the MPAct reporter will likely be useful to investigate a wide range of cellular processes because MPA density is believed to regulate mechanotransduction (27) and the diffusion-reaction dynamics of GPCRs and other membrane proteins (28).
Supplementary Material
Acknowledgments:
We thank the Meyer lab for helpful comments and discussions, Yilin Fan and Nalin Ratnayeke for help with developing code and analysis methods, Olga Davydenko for help with the Leica TIRF system.
Funding: TM, GM127026 and S10OD018073. AB, NSF Graduate Research Fellowship. DG, GM116328. AH and DC, Stanford Center for Systems Biology Seed Grant.
Footnotes
Competing interests: Authors declare no competing interests.
Data and materials availability: Data from manuscript is available in supplementary material. Code is available on the Meyer Lab Github (https://github.com/orgs/MeyerLab, DOI: 10.5281/zenodo.3734171). Raw time-lapse images provided upon request.
References and Notes:
- 1.Salbreux G, Charras G, Paluch E, Actin cortex mechanics and cellular morphogenesis. Trends Cell Biol 22, 536–545 (2012). [DOI] [PubMed] [Google Scholar]
- 2.Chalut KJ, Paluch EK, The Actin Cortex: A Bridge between Cell Shape and Function. Developmental Cell 38, 571–573 (2016). [DOI] [PubMed] [Google Scholar]
- 3.Ostrowski PP, Grinstein S, Freeman SA, Diffusion Barriers, Mechanical Forces, and the Biophysics of Phagocytosis. Developmental Cell 38, 135–146 (2016). [DOI] [PubMed] [Google Scholar]
- 4.Freeman SA et al. , Transmembrane Pickets Connect Cyto- and Pericellular Skeletons Forming Barriers to Receptor Engagement. Cell 172, 305–317.e10 (2018). [DOI] [PMC free article] [PubMed] [Google Scholar]
- 5.Fritzsche M, Thorogate R, Charras G, Quantitative analysis of ezrin turnover dynamics in the actin cortex. Biophys. J 106, 343–353 (2014). [DOI] [PMC free article] [PubMed] [Google Scholar]
- 6.Clausen MP, Colin-York H, Schneider F, Eggeling C, Fritzsche M, Dissecting the actin cortex density and membrane-cortex distance in living cells by super-resolution microscopy. J. Phys. D: Appl. Phys 50, 064002–12 (2017). [DOI] [PMC free article] [PubMed] [Google Scholar]
- 7.Liu Y et al. , Constitutively active ezrin increases membrane tension, slows migration, and impedes endothelial transmigration of lymphocytes in vivo in mice. Blood 119, 445–453 (2012). [DOI] [PMC free article] [PubMed] [Google Scholar]
- 8.Diz-Muñoz A et al. , Control of Directed Cell Migration In Vivo by Membrane-to-Cortex Attachment. PLoS Biol 8, e1000544–12 (2010). [DOI] [PMC free article] [PubMed] [Google Scholar]
- 9.Nishita M et al. , Spatial and temporal regulation of cofilin activity by LIM kinase and Slingshot is critical for directional cell migration. J. Cell Biol 171, 349–359 (2005). [DOI] [PMC free article] [PubMed] [Google Scholar]
- 10.Bravo-Cordero JJ, Magalhaes MAO, Eddy RJ, Hodgson L, Condeelis J, Functions of cofilin in cell locomotion and invasion. Nat Rev Mol Cell Biol 14, 405–415 (2013). [DOI] [PMC free article] [PubMed] [Google Scholar]
- 11.Liu Y-J et al. , Confinement and Low Adhesion Induce Fast Amoeboid Migration of Slow Mesenchymal Cells. Cell 160, 659–672 (2015). [DOI] [PubMed] [Google Scholar]
- 12.Diz-Muñoz A et al. , Steering cell migration by alternating blebs and actin-rich protrusions. BMC Biology, 1–13 (2016). [DOI] [PMC free article] [PubMed] [Google Scholar]
- 13.Heo WD et al. , PI(3,4,5)P3 and PI(4,5)P2 Lipids Target Proteins with Polybasic Clusters to the Plasma Membrane. Science 314, 1458–1461 (2006). [DOI] [PMC free article] [PubMed] [Google Scholar]
- 14.Schell MJ, Erneux C, Irvine RF, Inositol 1,4,5-Trisphosphate 3-Kinase A Associates with F-actin and Dendritic Spines via Its N Terminus. Journal of Biological Chemistry 276, 37537–37546 (2001). [DOI] [PubMed] [Google Scholar]
- 15.Tinevez J-Y et al. , Role of cortical tension in bleb growth. Proc. Natl. Acad. Sci. U.S.A 106, 18581–18586 (2009). [DOI] [PMC free article] [PubMed] [Google Scholar]
- 16.Clark AG, Dierkes K, Paluch EK, Monitoring Actin Cortex Thickness in Live Cells. Biophysj 105, 570–580 (2013). [DOI] [PMC free article] [PubMed] [Google Scholar]
- 17.Wilson K et al. , Mechanisms of leading edge protrusion in interstitial migration. Nat Commun 4, 2896 (2013). [DOI] [PMC free article] [PubMed] [Google Scholar]
- 18.Yang HW, Collins SR, Meyer T, Locally excitable Cdc42 signals steer cells during chemotaxis. Nat Cell Biol 18, 191–201 (2015). [DOI] [PMC free article] [PubMed] [Google Scholar]
- 19.Komatsu N et al. , Development of an optimized backbone of FRET biosensors for kinases and GTPases. Mol. Biol. Cell 22, 4647–4656 (2011). [DOI] [PMC free article] [PubMed] [Google Scholar]
- 20.Inoue T, Heo WD, Grimley JS, Wandless TJ, Meyer T, An inducible translocation strategy to rapidly activate and inhibit small GTPase signaling pathways. Nature Methods 2, 415–418 (2005). [DOI] [PMC free article] [PubMed] [Google Scholar]
- 21.Gabella C et al. , Contact angle at the leading edge controls cell protrusion rate. Curr. Biol 24, 1126–1132 (2014). [DOI] [PubMed] [Google Scholar]
- 22.Yao X, Cheng L, Forte JG, Biochemical characterization of ezrin-actin interaction. Journal of Biological Chemistry 271, 7224–7229 (1996). [DOI] [PubMed] [Google Scholar]
- 23.Delorme V et al. , Cofilin Activity Downstream of Pak1 Regulates Cell Protrusion Efficiency by Organizing Lamellipodium and Lamella Actin Networks. Developmental Cell 13, 646–662 (2007). [DOI] [PMC free article] [PubMed] [Google Scholar]
- 24.Oser M, Condeelis J, The cofilin activity cycle in lamellipodia and invadopodia. J. Cell. Biochem 108, 1252–1262 (2009). [DOI] [PMC free article] [PubMed] [Google Scholar]
- 25.Shi Z, Graber ZT, Baumgart T, Stone HA, Cohen AE, Cell Membranes Resist Flow. Cell 175, 1769–1779.e13 (2018). [DOI] [PMC free article] [PubMed] [Google Scholar]
- 26.Bergert M, Chandradoss SD, Desai RA, Paluch E, Cell mechanics control rapid transitions between blebs and lamellipodia during migration. Proceedings of the National Academy of Sciences 109, 14434–14439 (2012). [DOI] [PMC free article] [PubMed] [Google Scholar]
- 27.Das T et al. , A molecular mechanotransduction pathway regulates collective migration of epithelial cells. Nat Cell Biol 17, 276–287 (2015). [DOI] [PubMed] [Google Scholar]
- 28.Mattila PK, Batista FD, Treanor B, Dynamics of the actin cytoskeleton mediates receptor cross talk: An emerging concept in tuning receptor signaling. J. Cell Biol 212, 267–280 (2016). [DOI] [PMC free article] [PubMed] [Google Scholar]
- 29.Hayer A et al. , Engulfed cadherin fingers are polarized junctional structures between collectively migrating endothelial cells. Nat Cell Biol 18, 1311–1323 (2016). [DOI] [PMC free article] [PubMed] [Google Scholar]
- 30.Wollman R, Meyer T, Coordinated oscillations in cortical actin and Ca2+ correlate with cycles of vesicle secretion. Nat Cell Biol 14, 1261–1269 (2012). [DOI] [PMC free article] [PubMed] [Google Scholar]
- 31.Ilani T, Khanna C, Zhou M, Veenstra TD, Bretscher A, Immune synapse formation requires ZAP-70 recruitment by ezrin and CD43 removal by moesin. J. Cell Biol 179, 733–746 (2007). [DOI] [PMC free article] [PubMed] [Google Scholar]
- 32.Hao J-J et al. , Phospholipase C-mediated hydrolysis of PIP2 releases ERM proteins from lymphocyte membrane. J. Cell Biol 184, 451–462 (2009). [DOI] [PMC free article] [PubMed] [Google Scholar]
- 33.Hancock JF, Paterson H, Marshall CJ, A polybasic domain or palmitoylation is required in addition to the CAAX motif to localize p21ras to the plasma membrane. Cell 63, 133–139 (1990). [DOI] [PubMed] [Google Scholar]
- 34.Oancea E, Teruel MN, Quest AF, Meyer T, Green fluorescent protein (GFP)-tagged cysteine-rich domains from protein kinase C as fluorescent indicators for diacylglycerol signaling in living cells. J. Cell Biol 140, 485–498 (1998). [DOI] [PMC free article] [PubMed] [Google Scholar]
- 35.Logue JS et al. , Erk regulation of actin capping and bundling by Eps8 promotes cortex tension and leader bleb-based migration. Elife 4, e08314 (2015). [DOI] [PMC free article] [PubMed] [Google Scholar]
- 36.Charras GT, Hu CK, Coughlin M, Mitchison TJ, Reassembly of contractile actin cortex in cell blebs. The Journal of Cell Biology 175, 477–490 (2006). [DOI] [PMC free article] [PubMed] [Google Scholar]
- 37.Belin BJ, Goins LM, Mullins RD, Comparative analysis of tools for live cell imaging of actin network architecture. BioArchitecture 4, 189–202 (2015). [DOI] [PMC free article] [PubMed] [Google Scholar]
- 38.Brückner BR, Pietuch A, Nehls S, Rother J, Janshoff A, Ezrin is a Major Regulator of Membrane Tension in Epithelial Cells. Sci. Rep 5, 1–16 (2015). [DOI] [PMC free article] [PubMed] [Google Scholar]
- 39.Bretscher A, Edwards K, Fehon RG, ERM proteins and merlin: integrators at the cell cortex. Nat Rev Mol Cell Biol 3, 586–599 (2002). [DOI] [PubMed] [Google Scholar]
- 40.Théry M, Piel M, Adhesive micropatterns for cells: a microcontact printing protocol. Cold Spring Harbor Protocols 2009, pdb.prot5255–pdb.prot5255 (2009). [DOI] [PubMed] [Google Scholar]
- 41.Peng GE, Wilson SR, Weiner OD, A pharmacological cocktail for arresting actin dynamics in living cells. Mol. Biol. Cell 22, 3986–3994 (2011). [DOI] [PMC free article] [PubMed] [Google Scholar]
- 42.Yan W, Imanishi M, Futaki S, Sugiura Y, Alpha-helical linker of an artificial 6-zinc finger peptide contributes to selective DNA binding to a discontinuous recognition sequence. Biochemistry 46, 8517–8524 (2007). [DOI] [PubMed] [Google Scholar]
Associated Data
This section collects any data citations, data availability statements, or supplementary materials included in this article.


