Abstract
Pseudomonas aeruginosa is an opportunistic pathogen that causes thousands of deaths every year in part due to its ability to form biofilms composed of bacteria embedded in a matrix of self-secreted extracellular polysaccharides (EPS), e-DNA, and proteins. In chronic wounds, biofilms are exposed to the host extracellular matrix, of which collagen is a major component. How bacterial EPS interacts with host collagen and whether this interaction affects biofilm viscoelasticity is not well understood. Since physical disruption of biofilms is often used in their removal, knowledge of collagen’s effects on biofilm viscoelasticity may enable new treatment strategies that are better tuned to biofilms growing in host environments. In this work, biofilms are grown in the presence of different concentrations of collagen that mimic in-vivo conditions. In order to explore collagen’s interaction with EPS, nine strains of P. aeruginosa with different patterns of EPS production were used to grow biofilms. Particle tracking microrheology was used to characterize the mechanical development of biofilms over two days. Collagen is found to decrease biofilm compliance and increase relative elasticity regardless of the EPS present in the system. However, this effect is minimized when biofilms overproduce EPS. Collagen appears to become a de-facto component of the EPS, through binding to bacteria or physical entanglement.
INTRODUCTION
Pseudomonas aeruginosa is an opportunistic pathogen that is prevalent in nature and often found in the form of multicellular aggregates, or biofilms.1, 2 Biofilms are bacteria communities embedded in a matrix of proteins and self-secreted extracellular polymeric substances (EPS), which determine a biofilm’s morphology, protect it from non-beneficial environmental conditions, and makes it viscoelastic. In comparison to genetically-identical planktonic (free-swimming) bacteria, bacteria in the biofilm are more virulent and resistant to the immune system.3–10
These viscoelastic properties increase bacterial survival by requiring physical disruption to remove a biofilm and/or to increase its susceptibility to treatment.4, 5, 11–13 In fact, biofilm viscoelasticity increases morbidity and mortality among patients with infected wounds,14, 15 lung infections due to cystic fibrosis,8, 9 and chronic infections in the elderly, diabetic, and obese.16–22 With the goal of developing new treatment approaches, researchers have investigated the mechanisms that control P. aeruginosa biofilms’ viscoelasticity23, 24 and methods to alter viscoelasticity.25–27 Due to viscoelasticity’s role in growth, stability, and virulence of P. aeruginosa biofilms, it is crucial to have a better understanding of the mechanisms that affect it.
However, it is unclear if the chronic wound environment affects the viscoelasticity of P. aeruginosa biofilms. Wounded tissue’s extracellular matrix has a high concentration of collagen,28 which is itself a viscoelastic material.29 Bacteria adhere to exposed collagen before forming a biofilm.30 In-vitro, P. aeruginosa readily adhere in collagenated areas.31 P. aeruginosa biofilms grown in semi-solid collagen gels form more reproducible biofilms based on measurements of colony forming unit density.32 These results suggest that collagen affects biofilm growth, which typically impacts viscoelasticity. Therefore, it is reasonable to believe in-vivo biofilms in the collagenated wound environment are different than biofilms grown in typical in-vitro studies that are collagen-free, but this has not been directly studied.
This gap in knowledge is significant because understanding how interactions between collagen, EPS, and bacteria impact biofilm viscoelasticity may indicate new ways to treat biofilms in chronic wounds. In this study, in-situ micro-rheological experiments measure how the presence of collagen impact P. aeruginosa biofilm formation. We show that due to its non-specific impact on biofilms with matrices dominated by various types of EPS, collagen appears to interact directly with bacteria and/or through physical entanglement with all EPS components. This results in less compliant and more relatively elastic biofilms in early development. We then further study if elevated EPS production affects this interaction, finding that increasing EPS production negates some effects of collagen on viscoelasticity. These results indicate that the role of collagen on the development of biofilms in-vivo is not replicated in many in-vitro experiments testing viscoelasticity.
BACKGROUND
Early studies of P. aeruginosa biofilms viscoelasticity characterized the effects of hydrodynamic shear during growth, establishing that the applied hydrodynamic shear encoded a yield stress like behavior into the growing biofilms, which acted like viscoelastic solids below this stress and viscoelastic fluids above it.12, 13 In general, P. aeruginosa biofilms were observed to behave like a power-law fluid.33 Previous studies of the mechanics of P. aeruginosa biofilms have found significant variability and/or heterogeneity. In bulk rheology, this can be due to sample preparation26, 34 or measurement technique.12, 25, 35–38 However, microrheological measurements have also shown there is considerable 2D and 3D spatial heterogeneity,23, 33, 39, 40 caused by local changes to microstructure, surface attachment, and/or bacterial density.
EPS plays a crucial role in determining overall viscoelastic response. Biologically, bacteria regulate EPS production using the Wsp chemosensory system. When through adhesion force sensing realize they are on a solid surface, planktonic P. aeruginosa use this system to eventually increase production of cyclic diguanylate monophosphate (c-di-GMP) that signals bacteria to transition to the sessile state. As concentration of c-di-GMP increases, more bacteria increase production of EPS to become “biofilm founders.”6, 41–43 Increasing expression of c-di-GMP results in thicker, faster-forming biofilms,44 whereas its absence prevents biofilm formation.45 How changes in c-di-GMP levels affect viscoelasticity has not been characterized.
EPS interaction can be weakened/altered using chemical perturbation to modify P. aeruginosa biofilm viscoelasticity during or after formation. Multivalent ions appear to increase association within the EPS by increasing cross-linking, and creating stronger biofilms.25, 46 Whereas, citric acid appears to breakdown EPS. However, such damage has been seen to recuperate slowly.46 EPS component specific enzymes have been shown to breakdown P. aeruginosa biofilms that are dominated by that specific EPS component and create weaker films.47
These above rheological behaviors are determined specifically by the interplay between EPS components and environment. The EPS of P. aeruginosa biofilms, as grown in standard in-vitro environments, is typically composed of extracellular DNA and up to three different polysaccharides: Pel, Psl, and alginate. Psl protects biofilms from drugs by means of chemical binding and aids in attachment to solid surfaces.48–50 Pel plays a role in antibiotic resistance.51 Alginate provides chemical protection against antibiotics and immune response.25, 52–54
The role of these EPS components on the rheological properties of P. aeruginosa biofilms is difficult to understand because their redundant functionality makes it difficult to isolate their individual effects.55 However, using mutant strains with EPS variations some conclusions about individual EPS effect’s viscoelasticity have been observed. Biofilms without Psl appear more viscous,23 because Psl increases elasticity present due to crosslinking with CdrA.34 Pel is believed to promote cell-cell binding and electrostatically associate with eDNA.51, 56 Biofilms without Pel have typically been observed to increase in stiffness.23, 34 Alginate, through physical entanglement, plays a role in crosslinking;25 in the alginate-dominate (mucoid bacterial strain) biofilms found in cystic fibrosis patients, this is seen to increase yield strain.34, 57
MATERIALS & METHODS
Bacterial strains and growth conditions
Nine P. aeruginosa strains based on the widely-used laboratory strain PAO1 (Table 1) were studied. All strains constitutively express green fluorescent protein. Each strain is referred to throughout the paper based on the genetic knockout that creates the description as provided in Table 1. Frozen bacterial stocks were stored at −20°C. Prior to culturing, 10 mL of freshly prepared sterile LB (Luria-Bertani, from LB powder, Fisher Scientific, Catalog# BP1426–2) liquid broth was added to a 100 mL Erlenmeyer flask. Using an inoculating loop, a small amount of frozen bacterial stock was added to the flask. Afterwards, the capped flask was incubated using a rotary shaker (Southwest Mini IncuShaker SH1000) at 200 rpm and 37°C for 20 hours. Following incubation, overnight P. aeruginosa cultures were diluted to an optical density of 0.6 at 600 nm (OD600) measured by spectrophotometer (Thermo Scientific GENESYS 20). 1mL of this bacterial culture was prepared by centrifugation (10,000XG for 5 minutes) then washed and resuspended in fresh LB broth. The optical density of 0.6 at 600 nm (OD600) was reconfirmed by spectrophotometer after resuspension.
Table 1:
Description of P. aeruginosa strains
| Strain | Description |
|---|---|
| WT PA01 | Wild type (WT) |
| Δpel | Produces no Pel |
| Δpsl | Produces no Psl |
| ΔmucA | Over-expresses Alginate |
| ΔpelΔpsl | Produces No Pel & Psl |
| ΔwspF | c-di-GMP overexpressed |
| ΔwspFΔpel | c-di-GMP overexpressed Produces no Pel |
| ΔwspFΔpsl | c-di-GMP overexpressed Produces no Psl |
| ΔwspFΔpelΔpsl | c-di-GMP overexpressed Produces no Pel & Psl |
Media for biofilm growth
Wound Like Media was prepared by mixing 50%(v/v) Bovine Plasma (Fisher, Cat# 50-643-121), 45%(v/v) Bolton Broth (Fisher, Cat# OXCM0983B), and 5%(v/v) freeze thaw laked horse blood (VWR Cat# 10052–640).22
1.0μm, carboxylate-modified, red fluorescent latex particles (Invitrogen, Catalog Number #F88414) were used as probes for microrheology. Use of red fluorescence allows probe particles to be easily distinguished from green fluorescent expressing bacteria. These particles’ size and surface coatings were chosen to allow them to embed into the biofilm matrix as it developed without passing through its pores. Particles come in solution which contains surfactant left over from manufacture. To remove and clean particles, they underwent several rounds of centrifuging, followed by removal of supernatant, and then suspension in clean deionized water. After cleaning, a final particle solution was made with a concentration of 2.0×10⁶ particles/mL.
Collagen solution was made with refrigerated Collagen I (Collagen I, Rat, Corning 354236). To prepare the solution, 16μL Phenol Red (ACS Cas# 143-74-8), 4μL Phosphate Buffer Saline (Fisher Cat# BP3991), and 4μL NaOH (to ensure neutral pH) was added to 140 μL of collagen. Deionized water was added to create a volume of 200μL.
To prepare the biofilm growth medium, wound like medium (50μL, 45μL, 40μL) and particle solution (1 μL) were combined individually, then this solution was combined with collagen (0μL, 5μL, 10μL) to create 0% collagen, 10% collagen, and 20% collagen solutions.
Cultivation of microchannel biofilms
Microfluidic channels (Figure 1) were fabricated using standard soft lithography.58 A high resolution transparency mask (CAD/ART Services Inc) was used to fabricate SU-8 (Su-8 2000, Microchem) molds on silicon wafers. The mask was printed emulsion side down and placed directly on the Su-8. The Su-8 was exposed with a UV flood exposure (Dymax, 2000-EC series) using a 380nm filter. Channels were fabricated by pouring polydimethylsiloxane (Sylgard 184, Dow Corning) over the molds, followed by degassing and crosslinking in a vacuum chamber overnight. The channels were removed from the mold and access ports were punched with a 0.75mm hole punch. The channel bottoms, made by spinning polydimethylsiloxane onto a glass slide, were bonded to channels using air plasma (Plasma Cleaner, Harrick Plasma), left overnight in an 80°C oven, and stored at 20°C until use.
Figure 1:

Microchannel schematic. Cross section of channel is 100×60 μm2. Channel length is 6 mm with reference locations 1mm apart.
To inoculate the channels, 1μL of diluted bacterial culture was added to 50μL of biofilm growth medium; 25μL of this resulting suspension was injected into the channels using a syringe. After inoculation, the inlets and outlets were sealed to prevent evaporation. These channels were kept inside the incubator at 37°C in static conditions to allow for biofilm growth. The biofilms were examined at 24 hour & 48 hour after the microchannels were inoculated.
Passive Particle Tracking Microrheology
Due to the importance of biofilm mechanics, a range of techniques have been applied to studying biofilm viscoelasticity. In general, due to the extreme spatiotemporal and environmental heterogeneity of biofilms, robust and reproducible characterization can be extremely difficult. This difficulty is compounded by differences in experimental procedures, growth conditions, and ambient conditions. A lack of standardized protocols and analyses can make characterization difficult to compare from one study to the next.59 Among the available rheometry tools, Particle Tracking Microrheology has become popular among scientists due to its efficacy in probing materials’ microscale spatio-temporal heterogeneity, low cost, ease, and ability to measure mechanics without affecting biofilm microstructure.60
Particle tracking microrheology tracks the motion of embedded particles within a specimen to recover rheological data by measuring time-dependent displacements which are then analyzed using the Generalized Stokes-Einstein relationship.61 When using passive microrheology, the inherent thermal energy (~kBT) of the material drives the probes; the mean square displacement (MSD) of the particles reflect strain arising from the thermal stress. From the MSD, several rheological parameters are obtained. The slope of the MSD-time (log-log) curve, , ranges from 0 to 1 and represents the relative viscoelasticity of the solution; α=1 represents purely viscous diffusion whereas α=0 is an elastic solid of the surrounding material.62 Therefore, α is a measure of relative elasticity with lower values indicating more elastic like behavior. Creep Compliance is proportional to the time-averaged MSD (on a log scale)
| (1) |
where, a = particle radius, kB = Boltzmann Constant, T= Temperature 〈r2(t)〉= ensemble time-averaged MSD.
Epifluorescent microscopy was employed to visualize fluorescent particles using a Nikon Eclipse TS 100-F (Nikon Instruments, Japan) with 20X objective. Images were captured at 50 fps using a high speed camera (IL5, Fastec). Particle locations and tracks from image sequences were found using the Fiji installation of ImageJ with the plugin TrackMate.63, 64 This plugin finds particle centroids using a Laplacian of Gaussian filter, which allows subpixel localization, and generates 2D tracks from positions utilizing a Simple Linear assignment algorithm. Particle tracking data is then imported to the MATLAB routine msdanalyzer65 for measurement of the MSD curves of individual particles and creating ensemble averages.
Linear fits (for the lowest 10% of lag times on each MSD curve66) were made to log-log plots of MSD vs. lag time to find α. Lines with R2>0.70 were considered for analysis. Both 10% and 20% collagen solutions without bacteria were characterized and found to have α10% =0.76 and α20% =0.66. These values were used along with fluorescence images to identify and exclude particles that were not embedded in the biofilm when examining biofilms with corresponding collagen concentrations.
For a particular system (bacterial strain and collagen concentration) particle tracking occurred at 4 locations within a microchannel where separate biofilms were observed to have grown. These locations were found by looking for the fluorescence signature of the bacteria. Due to the channel design (Figure 1), it was possible to index locations and gather data within the same biofilm at 24 and 48-hours. This process was triplicated in different microchannels. This results in 3 biological replicates of 4 technical replicates each for each strain/collagen combination. The number of particle tracks for each condition varies, and the overall number of traces is reported in Table 2.
Table 2:
Sample size (N) for each strain tested.
| 0% Collagen | 10% Collagen | 20% Collagen | ||||
|---|---|---|---|---|---|---|
| 24 h | 48 h | 24h | 48 h | 24 h | 48 h | |
| WT | 301 | 1233 | 294 | 764 | 226 | 280 |
| Δpel | 235 | 187 | 1096 | 938 | 667 | 754 |
| Δpsl | 177 | 439 | 475 | 186 | 794 | 686 |
| Δpel Δpsl | 954 | 1588 | 459 | 552 | 1034 | 1326 |
| ΔmucA | 396 | 629 | 804 | 1198 | 515 | 336 |
| ΔwspF | 179 | 1130 | 147 | 440 | 348 | 589 |
| ΔwspF Δpel | 1105 | 1882 | 1003 | 572 | 1161 | 523 |
| ΔwspF Δpel | 831 | 986 | 304 | 1064 | 162 | 156 |
| ΔwspF Δpel Δpsl | 485 | 543 | 284 | 578 | 255 | 549 |
Data Analysis
Two strains were used in comparison for statistical analysis. The WT strain was used as a baseline strain to compare EPS knockouts and overexpressers. The ΔwspF knockout, which upregulates c-di-GMP signaling and hence EPS production, was used as base strain for comparison for ΔwspF mutants that also had an EPS knockout. To examine the difference in α or compliance between a group of strains and their respective base strain, multiple comparisons using a post-hoc Dunn’s correction (Kruskal-Wallis, one-way, non-parametric ANOVA)67 were executed using GraphPad Prism 8. The null hypothesis tested was for equivalence in the mean ranks of distributions. To compare between any 2 strains, an unpaired Mann-Whitney (non-parametric) test was conducted. The null hypothesis tested was for equivalence in the mean ranks of distributions. Statistical significance is demarcated in figures by * for P≤0.05, ** for P≤0.01, and *** for P≤0.001.
Distribution of values are represented by box-whisker plots. The box represents the middle 50% of the data, the line in the box represents the median, the black dot represents the mean, the upper vertical line represents the upper quartile, and the lower vertical line represents the bottom quartile.
RESULTS
Effects of Collagen on Ensemble Viscoelasticity
We scrutinize the role of EPS components alone by first examining the ensemble MSD for all modified EPS strains without changes to c-di-GMP expression at both 24 and 48 hours in the absence of collagen (Figure 2, top row). In general, removing the expression of any single EPS component does not impact the ensemble average value of α significantly at the 24 hour mark in the absence of collagen.
Figure 2:
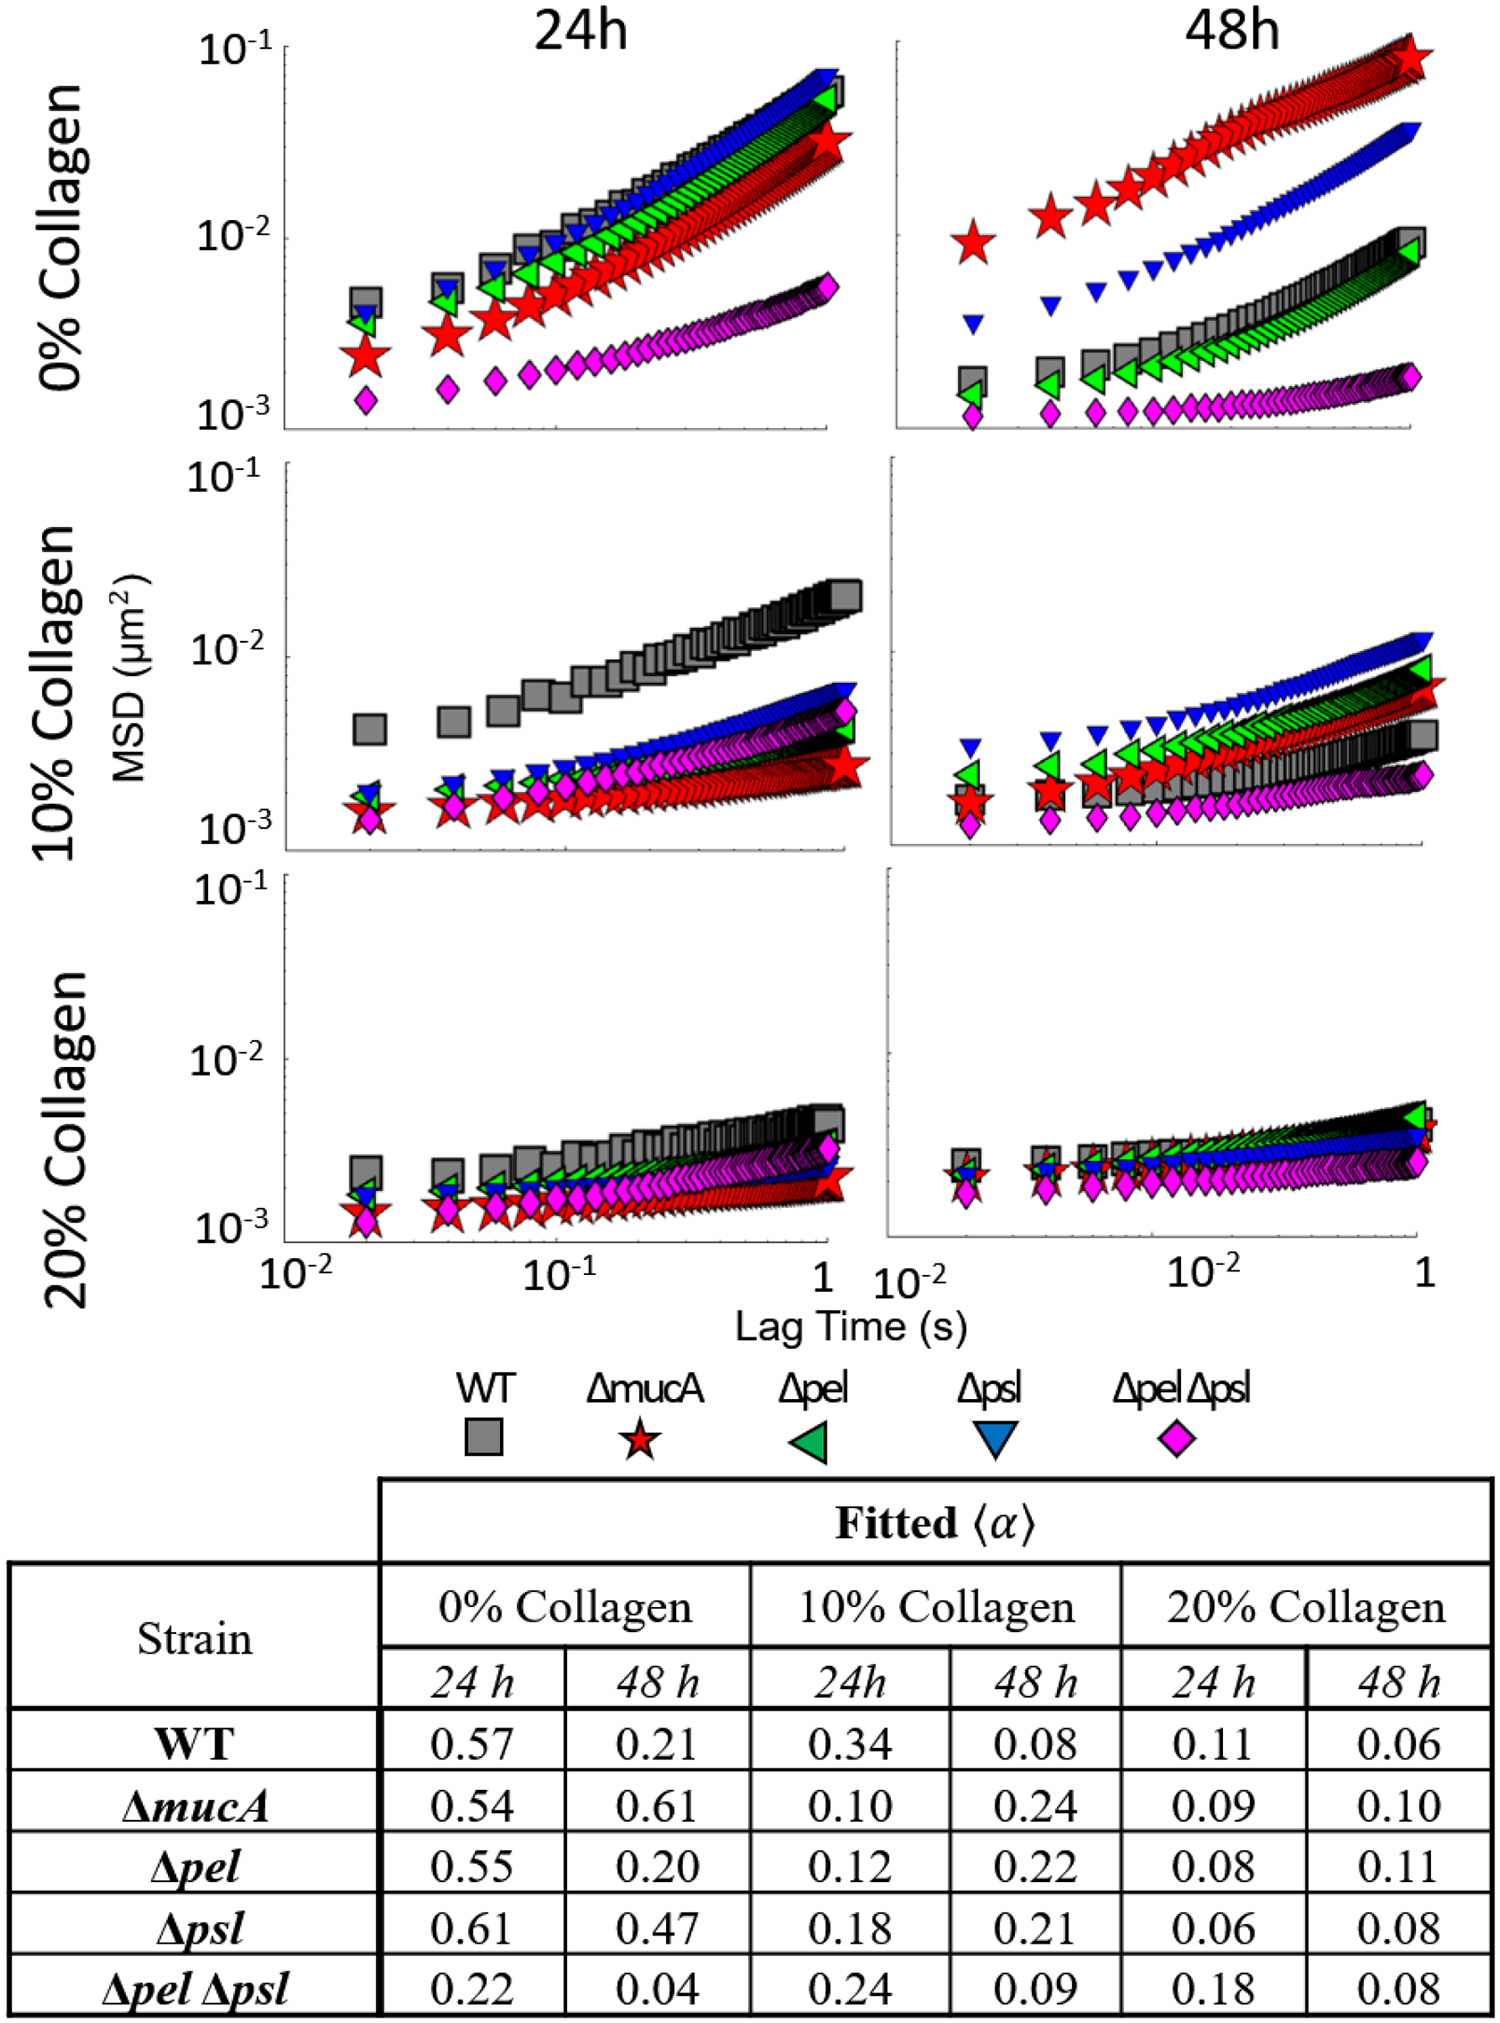
Ensemble mean squared displacement as a function of lag time for all WT derived strains for all times and collagen concentrations. Summary of slope values provided in table.
Looking at the Δpel strain in the absence of collagen, biofilms are nearly identical to the WT at 24 and 48 hours with relative elasticity increasing based on α decreasing from 0.57 to 0.21 for the WT and 0.55 to 0.2 for the Δpel. Biofilms grown by the Δpsl strain in the absence of collagen become more relatively elastic from 24 to 48 hours. However, they are more relatively viscous than biofilms grown by the WT strain at 48 hours (α’s 0.21 for the WT and 0.47 for the Δpsl), which is consistent with published results.23
We examine the role of alginate using two different strains, ΔpelΔpsl and ΔmucA. Biofilms formed by the ΔpelΔpsl strain, which lacks both Pel and Psl, should have EPS composed only of alginate, despite the fact that PA01 does not make significant amounts of alginate in-vitro.68 This strain’s relative elasticity increases over time, similar to WT strain. However, the ΔpelΔpsl is always more elastic than the WT with α values 39% and 19% lower than WT biofilms at 24 and 48 hours. After the 48 hours, the ΔmucA, which overproduces alginate, has changed minimally and is more relatively viscous than the WT. The ΔpelΔpsl results are consistent with increased resistance to yield of alginate-dominated (mucoid) biofilms,34, 57 whereas the ΔmucA are contrary to those results.
When collagen is added to the wound-like media, the rheological trends are quite different. Except for the ΔpelΔpsl strain, biofilms grown for 24 hours in 10% and 20% collagen concentrations are more relatively elastic than their counterparts grown in 0% collagen. Furthermore, at the 24 hour mark, the effect of collagen concentration above 10% is minimal; biofilms grown in the presence of 20% and 10% have similar values of α at 24 hours for the majority of the strains tested. At 48 hours, the biofilms grown in the presence of 10% collagen have become more relatively viscous except for the ΔpelΔpsl and the WT. The biofilms grown in the presence of 20% collagen show very minor changes in the ensemble α value at 48 hours.
Changes in distribution of α
As mentioned, P. aeruginosa biofilms’ mechanical properties have significant spatial heterogeneity.23, 33, 39 To better understand the heterogeneity, we present the distribution of α values from individual tracked particles using a box-whisker plot in Figure 3.
Figure 3:
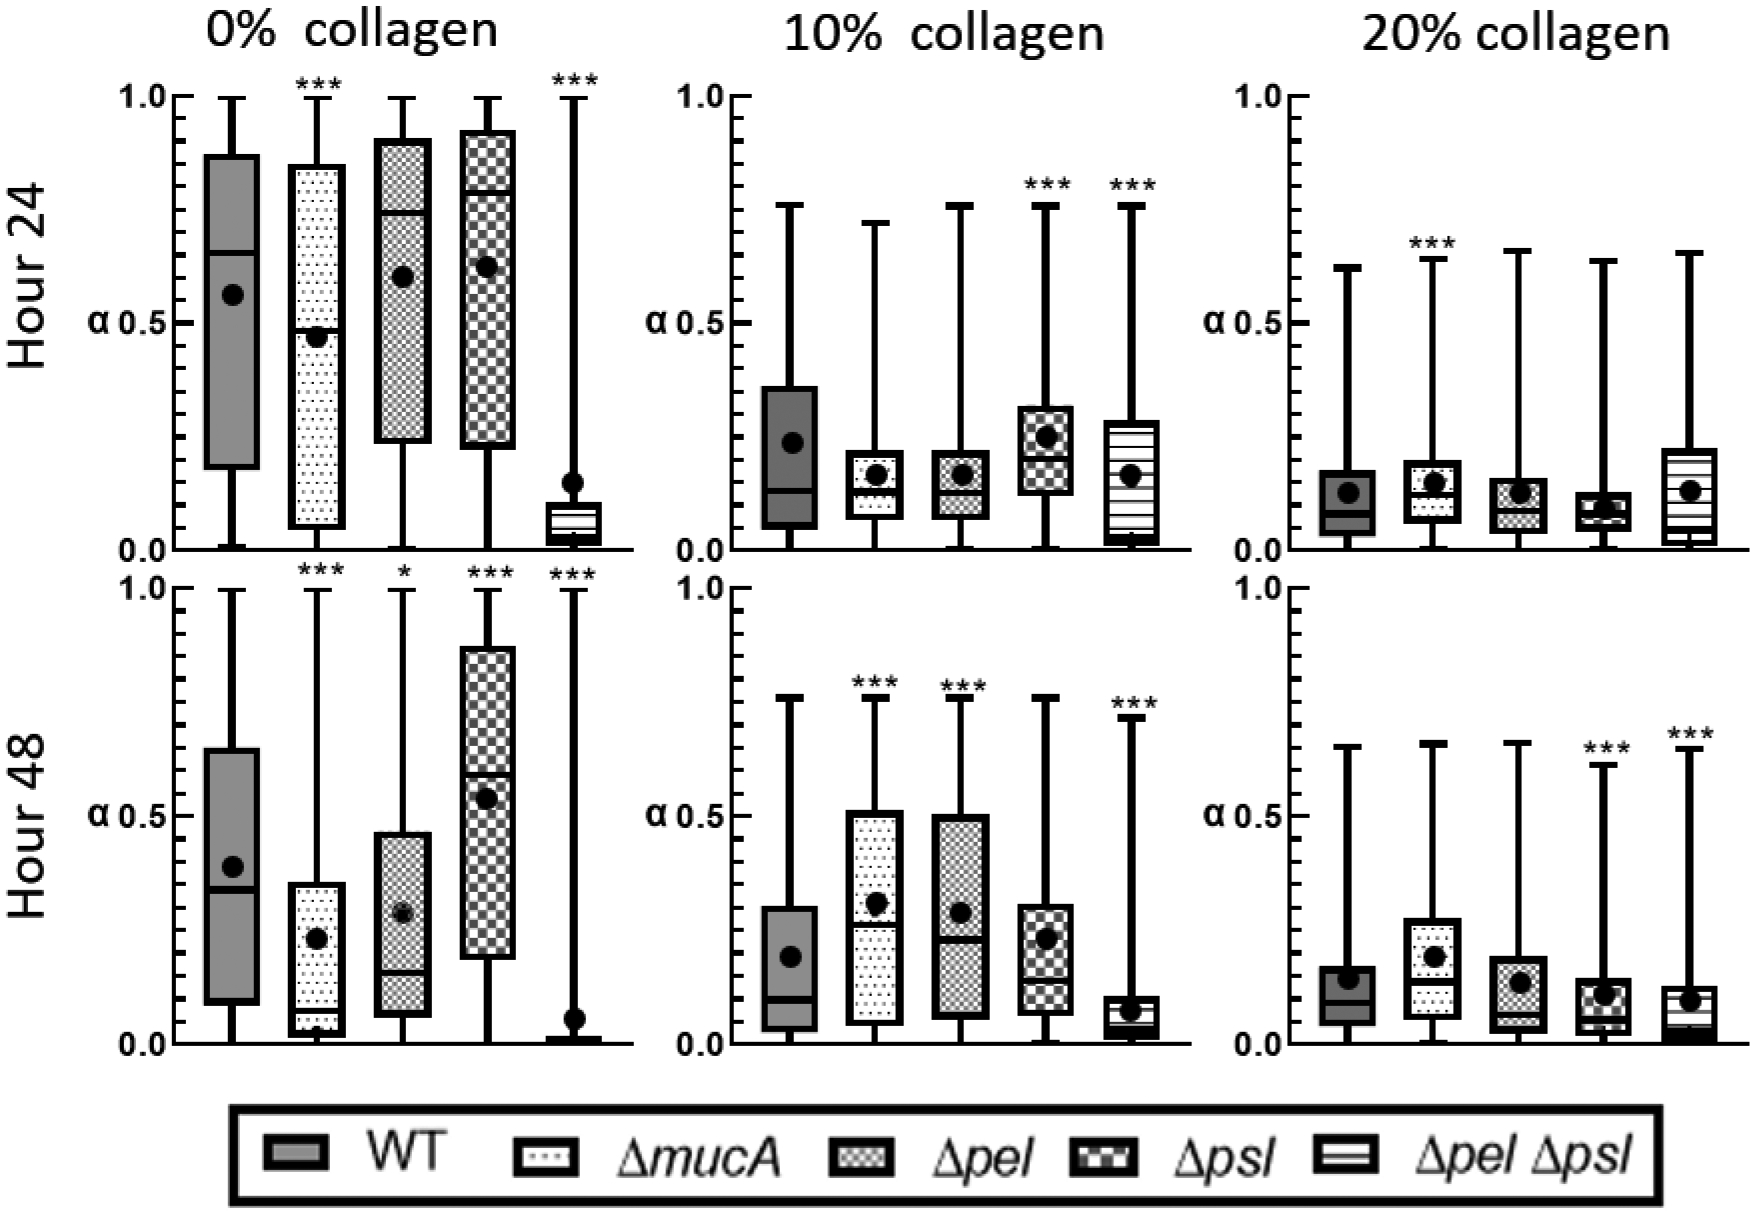
Distribution of alpha from individual particle tracks. The box represents the middle 50% of the data, the line within the box represents the median of the distribution, the black dot represents the mean, the upper vertical line represents the upper quartile, and the lower vertical line represents the bottom quartile. P≤0.05 demarcated with *, P≤0.01 demarcated with **, and P≤0.001 demarcated with ***.
For biofilms grown with 0% collagen at 24 hours, we see that mean α are consistent with the ensemble average data. However, based on the box sizes in Figure 3, we see a broad distribution of α, indicating significant heterogeneity in relative elasticity for all strains except ΔpelΔpsl. The alginate-dominated ΔmucA and ΔpelΔpsl biofilms have statistically different distributions than WT. Each strain’s distribution changes uniquely from 24 to 48 hours, indicating that individual EPS components are uniquely affecting the developing biofilms’ mechanics. At 48 hours, all strains have statistically different distributions in comparison to WT and have become more homogenous based on the 50% box sizes decreasing in size. The only outlier is the Δpsl biofilm. The mean α show similar trends to the ensemble α except ΔmucA’s mean, which is slightly lower than the ensemble average.
At 24 hours, biofilms grown in the presence of collagen are significantly different from the 0% collagen system. Both 10% and 20% biofilms exhibit lower values of α and tighter distributions than their 0% counterparts (Figure 3). Most of the strains grown in the presence of 10% and 20% collagen are statistically similar to the WT biofilm at 24 hours, and those strains that are statistically different to the WT are not consistent between the collagen concentrations. Unlike the ensemble averages, there is a clear difference between the 10% and 20% collagen systems at 24 hours: a narrowing of the distribution of α with increasing collagen.
At the 48 hour mark, most biofilms grown in the presence of 10% collagen are statistically different from WT and α values are higher than at 24 hours (Figure 3) but still smaller than the 0% collagen at 48 hours. This is consistent with ensemble α values. Additionally, all biofilms, except for the ΔpelΔpsl biofilms, exhibit increased heterogeneity as shown by the 50% box size. At 48 hours, biofilms grown in the presence of 20% collagen show little change from 24 hours (Figure 3).
We focus on the effects of collagen concentration for each individual strain in Figure 4. At 24 hours, the WT, Δpel, and Δpsl strains shows decreasing average α with increasing collagen. For these 3 strains, there is a statistically relevant difference in distribution of α grown in the presence of 10% collagen and those grown in the presence of 20% collagen at 24 hours. The Δpel, and Δpsl strains have narrower distributions of α than WT.
Figure 4:
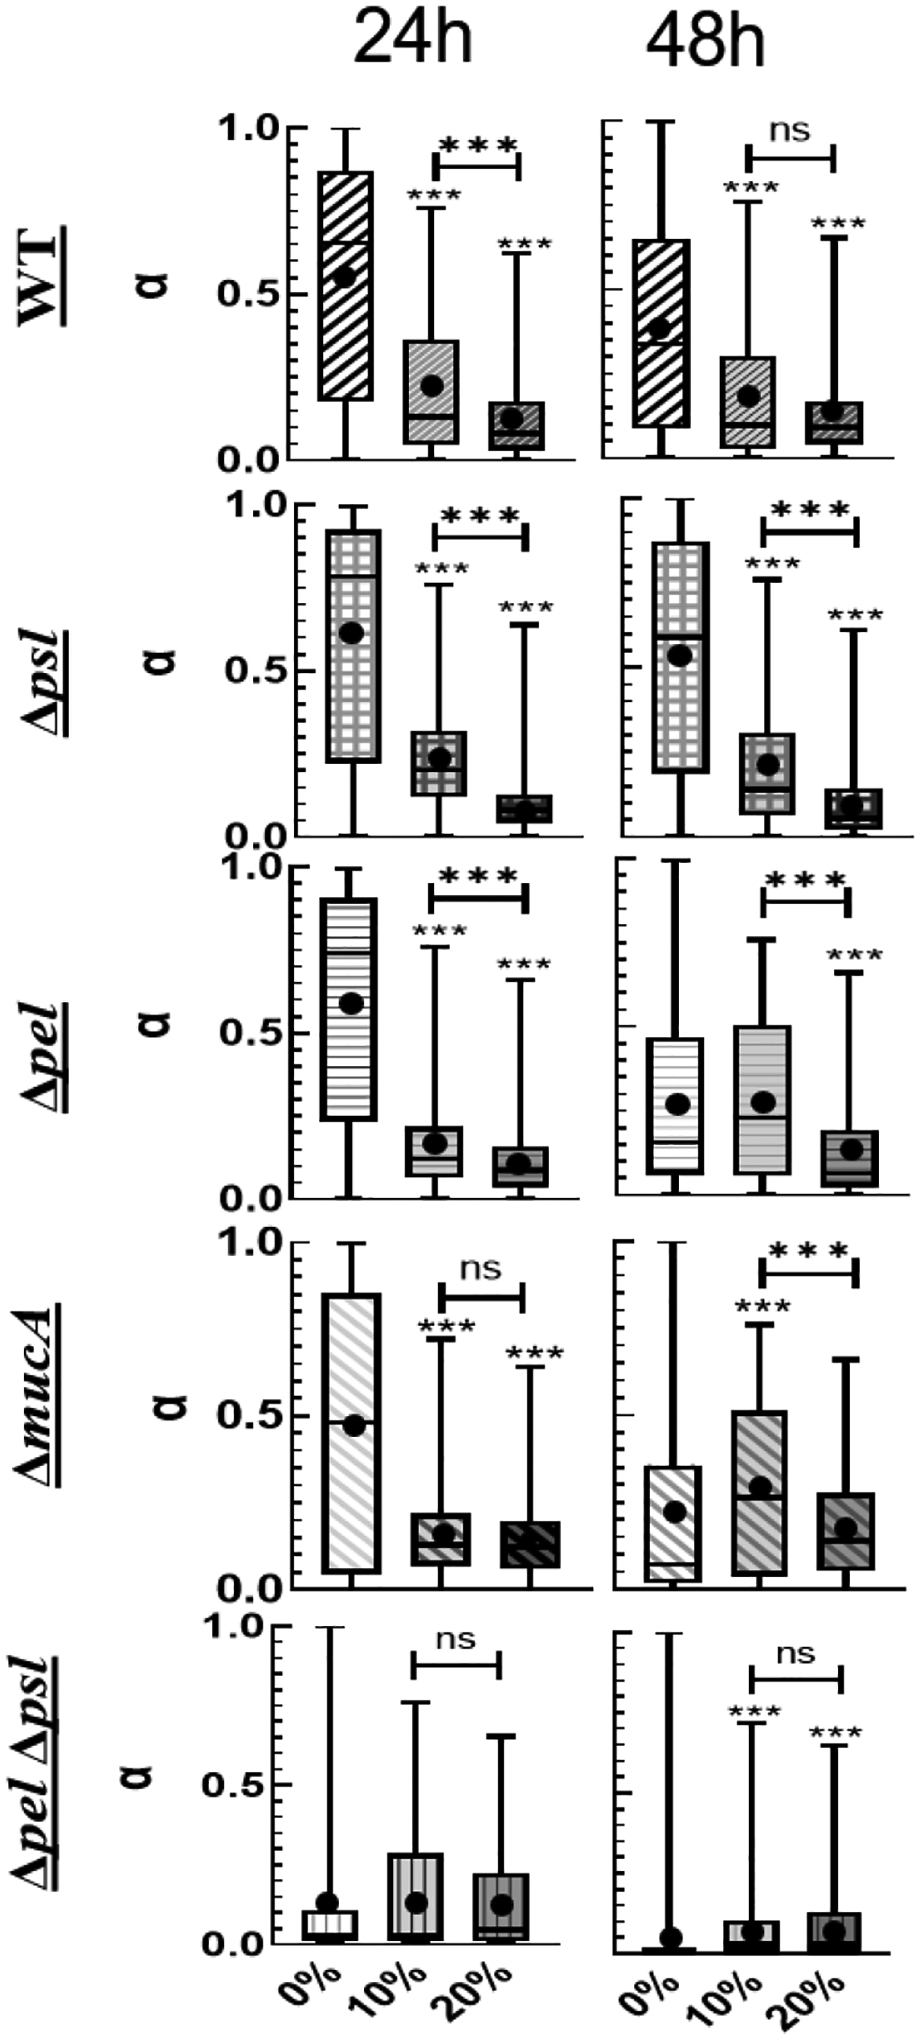
Distribution of α organized by strain as a function of collagen concentration. P≤0.05 demarcated with *, P≤0.01 demarcated with **, and P≤0.001 demarcated with ***.
At 48 hours, we see similar trends for both the WT and the Δpsl strains – decreasing average α, and narrowing distributions with increasing collagen. However, the Δpel biofilms grown in the presence of 0% and 10% collagen are statistically identical at 48 hours but statistically different from those grown in the presence of 20% collagen.
Examining the role of alginate, we look at the ΔpelΔpsl and ΔmucA. At 24 hours, the 10% and 20% ΔmucA biofilms are statistically different from the 0% but not from each other. At 48 hours, ΔmucA does not show consistent trends with increasing collagen. For the ΔpelΔpsl there is no effect of collagen at 24 hours, and a statistical difference between 10% and 20% films at 48 hours.
Effects on Compliance
Beyond the role of the EPS on the relative viscoelastic behavior as evaluated by α, we examine the creep compliance of the films. The creep compliance varies with time (equation (1)), so to find a common evaluation point to study distribution, the value at 0.2 s was compared.
At 24 hours and all collagen levels, biofilms grown from any EPS knockout have lower compliances than of WT and statistically different distributions. The compliances of biofilms grown from EPS knockout strains have median values ranging from 20 to 0.5 Pa−1, whereas WT biofilms have compliances with median values range from 80 to 20 Pa−1. This result is consistent with published observations for the Δpel strain which found biofilms without Pel are stiffer/less compliant than WT,23, 34 and for the alginate strains which are seen to increase resistance to yield.34, 57 The addition of collagen creates more homogeneous films with lower compliances, but there seems to be minimal effect of collagen concentration above 10%
After 48 hours, the biofilms become less compliant with mean values of 0.1 to 1 Pa−1 depending on the strain. Across all collagen concentrations, more strains are statistically the same as WT in comparison to 24 hours. There is no consistency as to which strains are statistically the same. Consistently the ΔpelΔpsl is always the least compliant for all conditions tested.
Role of Increased EPS Production on Elasticity
The protein c-di-GMP promotes biofilm growth, increasing EPS production.44, 45 It is unclear if this also affects viscoelasticity. We examine c-di-GMP overexpressers ΔwspF strains, which should have higher levels of EPS production than non-ΔwspF strains.
From the median α values in Figure 6, biofilms grown by the ΔwspF strain are always more relatively elastic than biofilms grown by the WT strain. Furthermore, from the size of the 50% box in Figure 6, the biofilms formed by the ΔwspF strain are more homogenous than WT. Comparing the difference between mean α of the WT vs. Δwspf for each collagen concentration, the 0% Δwspf are on average 0.3 lower than WT, the 10% is 0.13, and the 20% is 0.04. The effects of the ΔwspF mutation are least statistically significant for 20% collagen at 24 hours.
Figure 6:
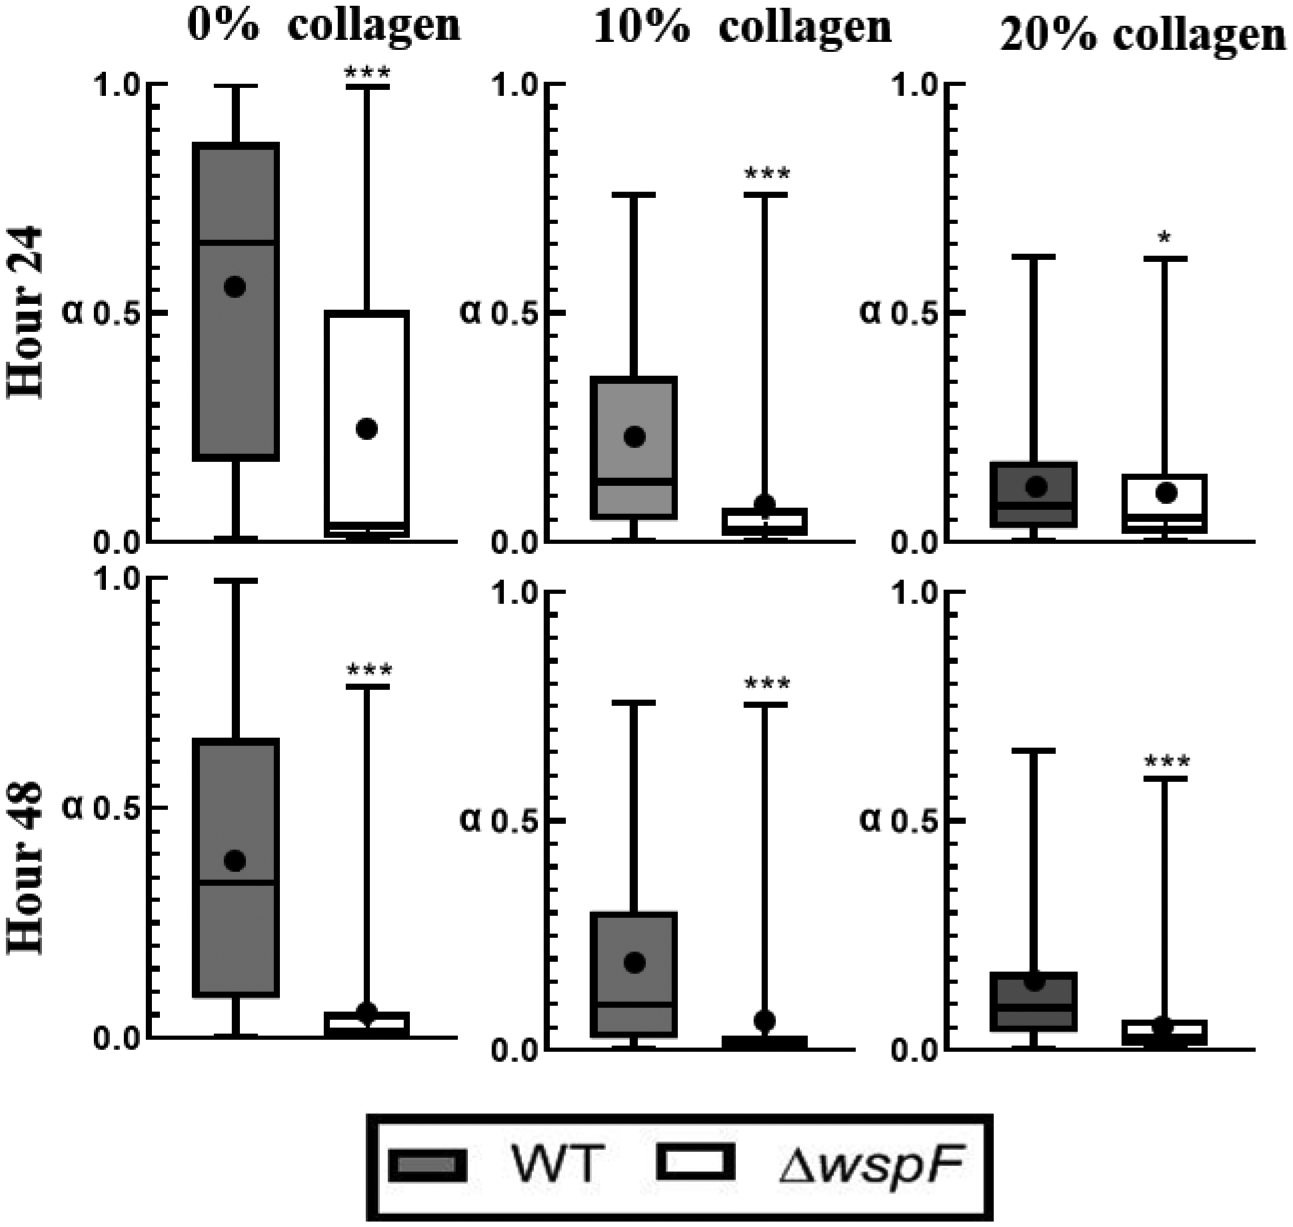
Distribution of alpha in a Box-whisker plot comparing c-di-GMP over-expressers to WT strain. The box represents the middle 50% of the data, line within the box represents the median of the distribution, the black dot represents the mean, the top line represents the upper quartile, and the bottom line represents the bottom quartile. P≤0.05 demarcated with *, P≤0.01 demarcated with **, and P≤0.001 demarcated with ***.
At 24 and 48 hours and all collagen concentrations, biofilms grown by the ΔwspF strain have compliances approximately one order of magnitude smaller than the compliances of biofilms grown by WT (Figure 7). All but the 10% collagen at 48 hours are statistically different. Qualitatively the effects of collagen do not seem pronounced.
Figure 7:
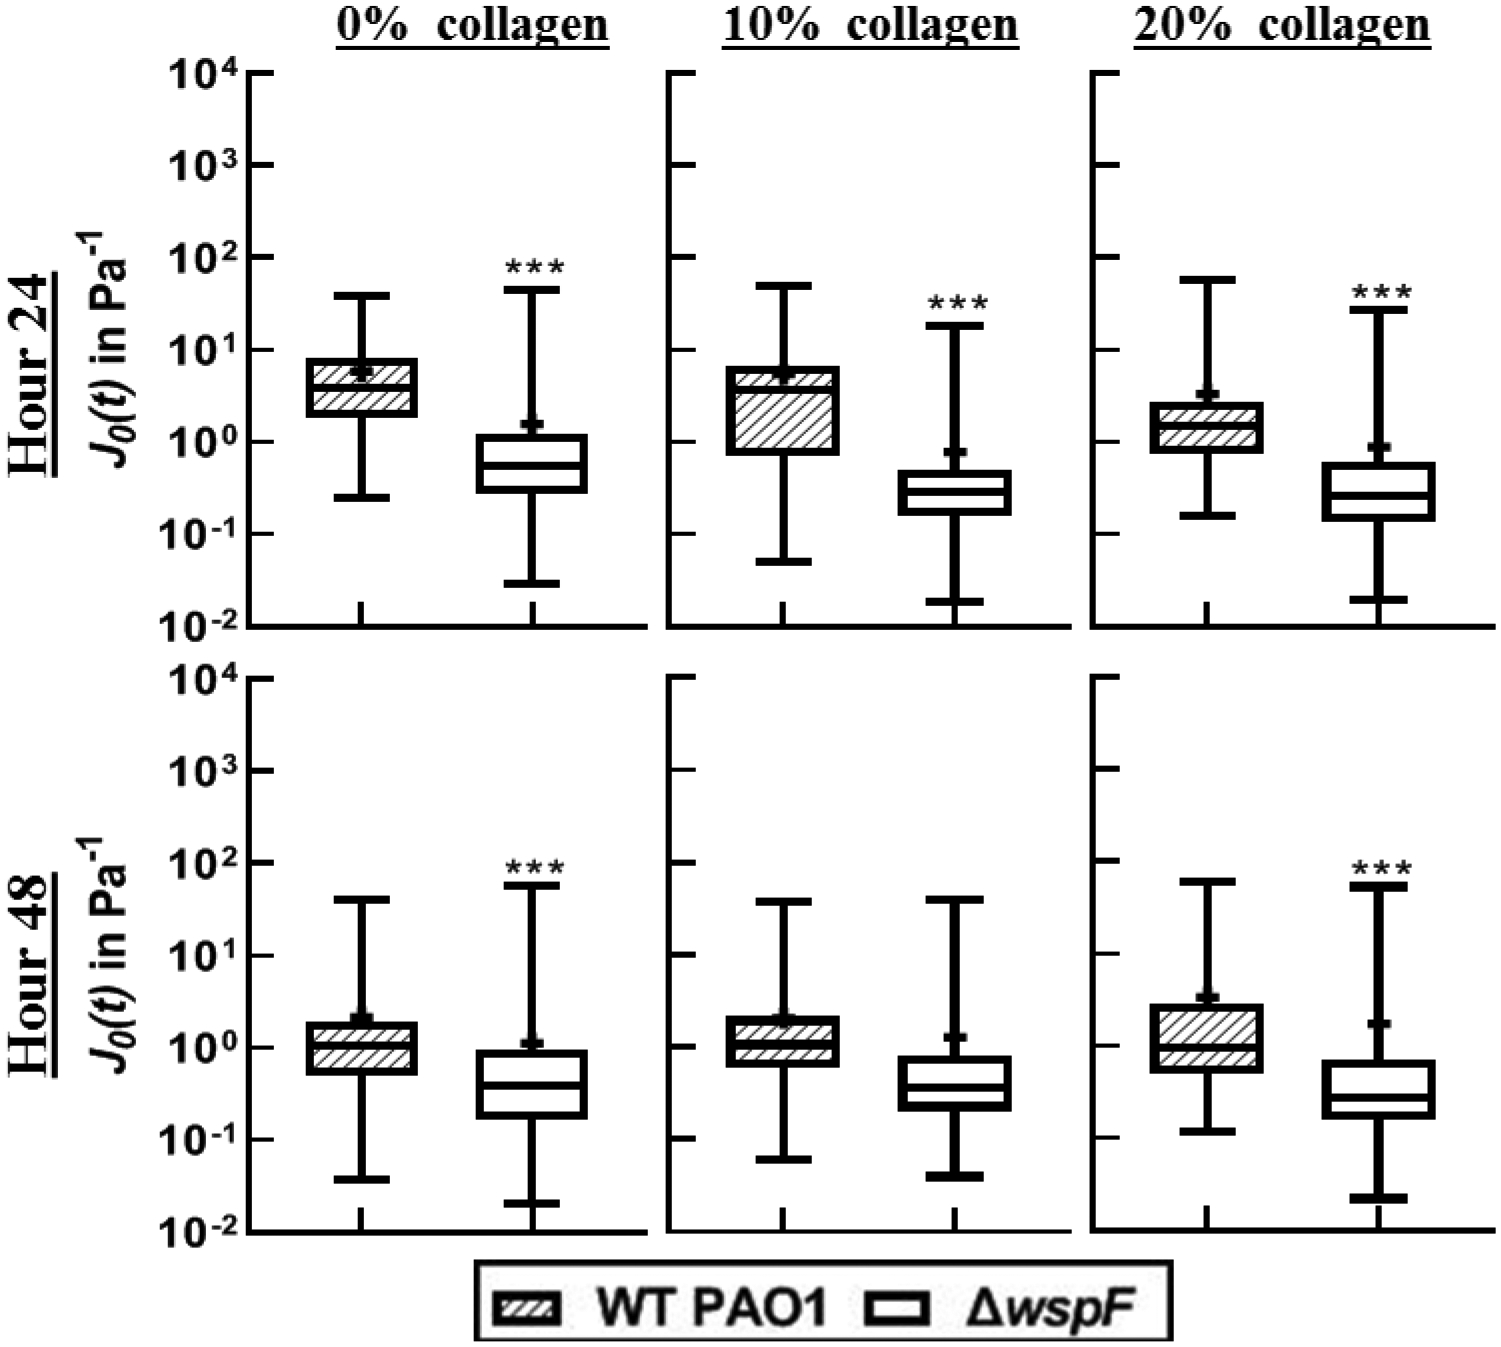
Distribution of compliance at time t=0.2 in a Box-whisker plot comparing c-di-GMP over-expressers to WT strains. The box represents the middle 50% of the data, the line within the box represents the median of the distribution, the black dot represents the mean, the upper vertical line represents the upper quartile, and the lower vertical line represents the bottom quartile. P≤0.05 demarcated with *, P≤0.01 demarcated with **, and P≤0.001 demarcated with ***.
Effects of Increased EPS Biomass with changes to EPS production
Mutants with both EPS knockouts and c-di-GMP overexpression are compared in Figure 8 to the baseline c-di-GMP overexpresser. Examining the ensemble data, these strains (Figure 8) typically have smaller values of α than comparable strains in Figure 2 except for the double EPS knockouts. This indicates the biofilms here are more relatively elastic than the strains with baseline c-di-GMP expression. The EPS knockout strains exhibit inconsistent changes to α when comparing 24 to 48 hour data in Figure 8. Examining the effect of collagen, we see less impact and no clear trends in as collagen increases to 10% and 20% due to the already low α values for the 0% collagen tests.
Figure 8:
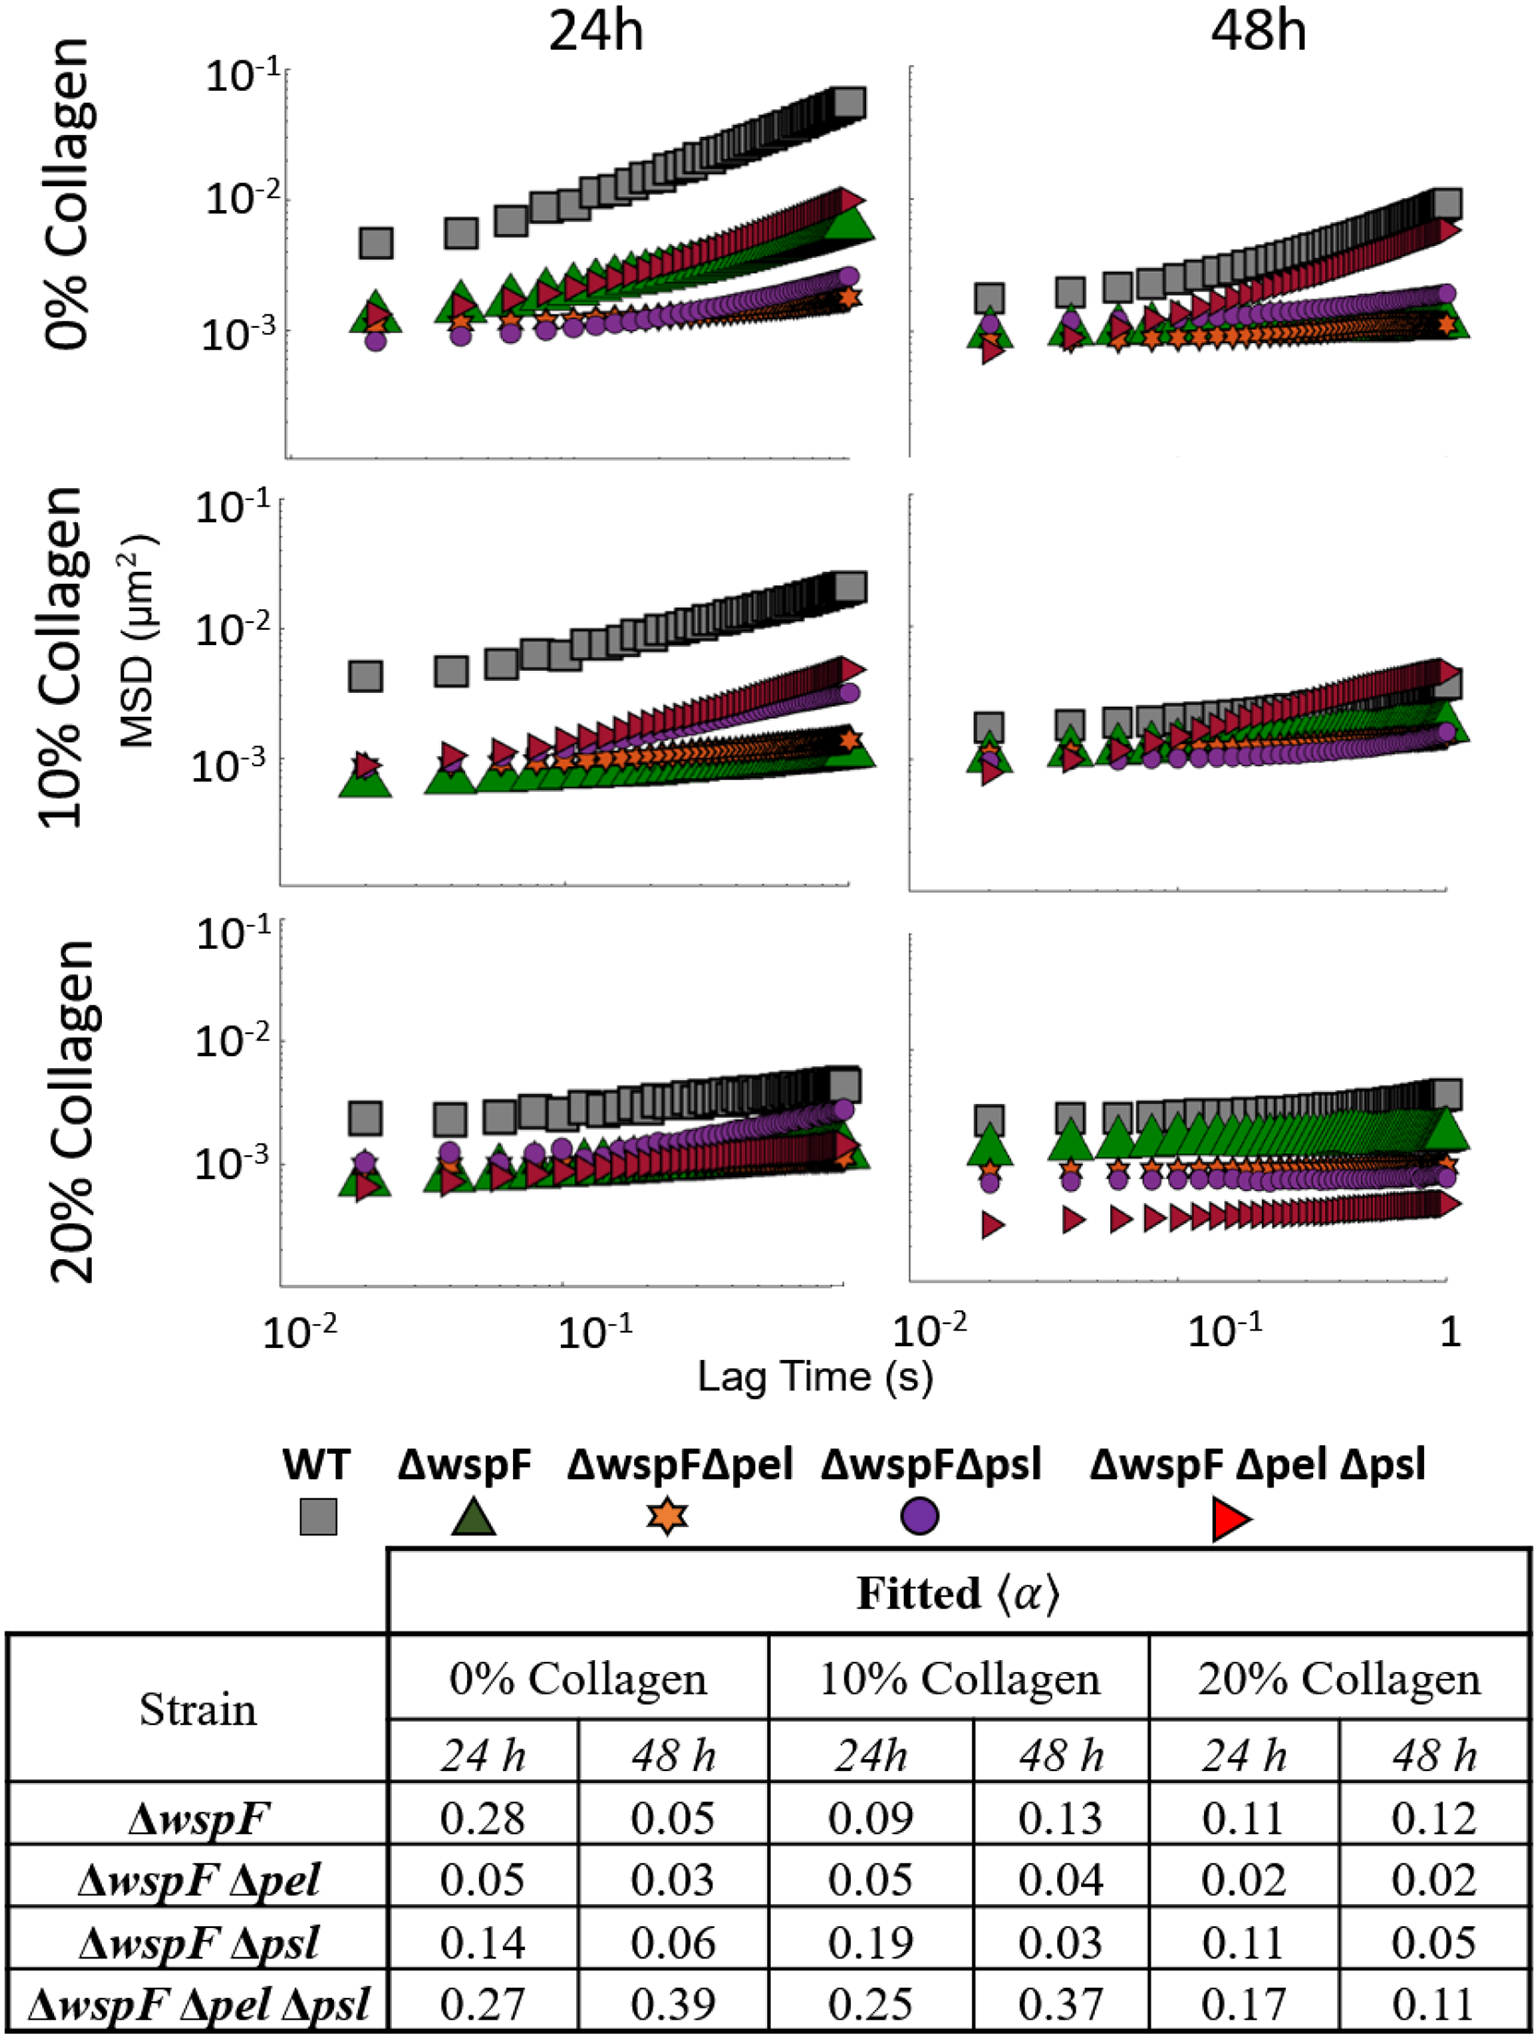
Ensemble MSD as a function of lag time for all strains with baseline c-di-GMP expression strains at all times and collagen concentrations. Summary of slope values provided in table.
From Figure 9, we observe that α distributions for the ΔwspF mutants are narrower and α means are lower to comparable EPS strains without c-di-GMP overproduction in Figure 3. This is true for all strains except the ΔwspFΔpelΔpsl. Similar to ensemble data, we see no clear trend in increasing collagen concentration on results.
Figure 9.
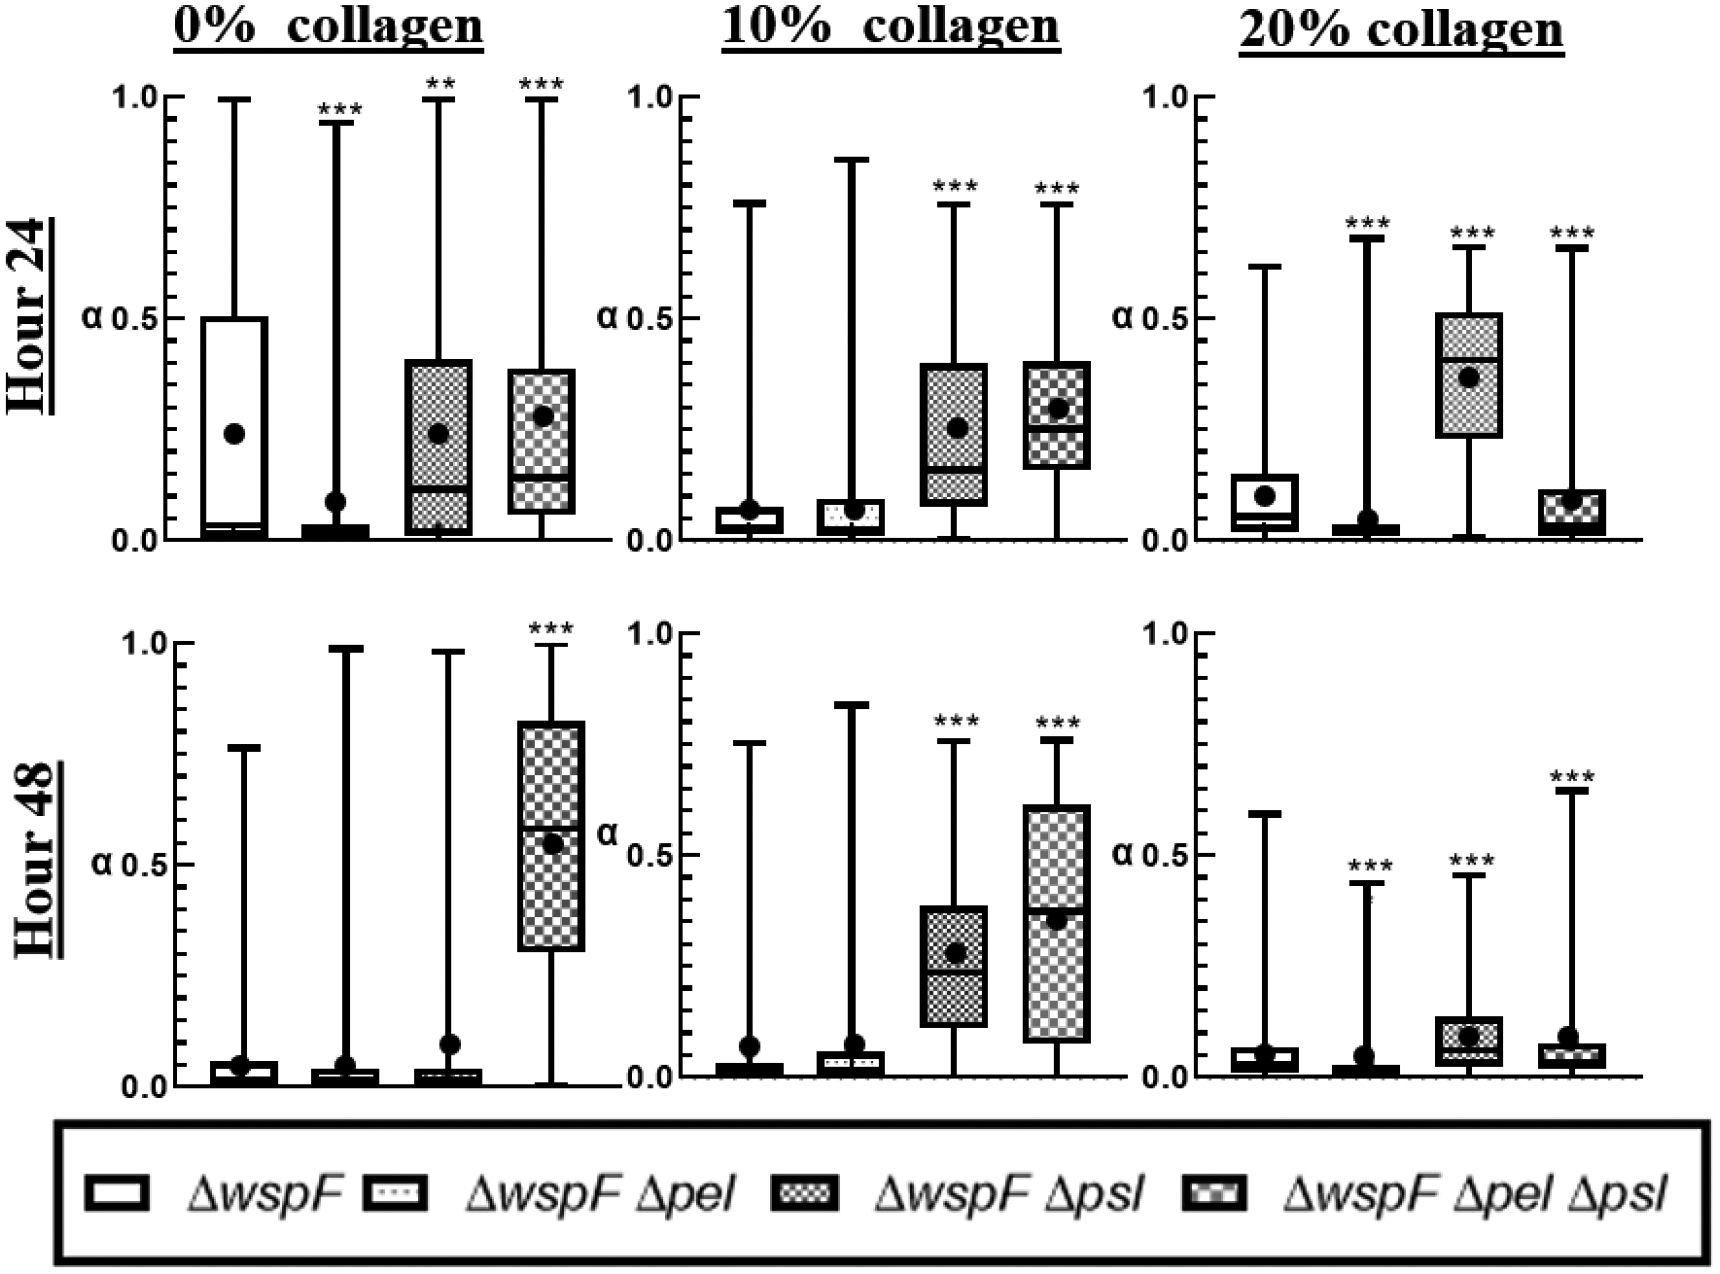
Distribution of alpha in a box-whisker plot. The box represents the middle 50% of the data, the line within the box represents the median of the distribution, the black dot represents the mean, the upper vertical line represents the upper quartile, and the lower vertical line represents the bottom quartile. P≤0.05 demarcated with *, P≤0.01 demarcated with **, and P≤0.001 demarcated with ***.
Role of c-di-GMP on Compliance
At the 24-hour mark, with no collagen, all the ΔwspF strains are statistically identical. This is different from the case for the baseline strains, which typically showed more differentiation in compliance at the 24-hour mark. At 48 hours, compliance decreases for all films in the absence of collagen and each strain is statistically different than the WT. The addition of collagen does not significantly impact compliance mean or distribution for the ΔwspF strains at either 24 or 48 hours.
DISCUSSION
Role of EPS components and production on Biofilm Viscoelasticity
Modifying expression of any single EPS component (Δpel,Δpsl, or ΔmucA) does not impact relative elasticity based on median α and its distribution at the 24 hour mark in the absence of collagen, but these strains all have lower median compliances in comparison to WT. After 48 hours, biofilms from these strains became more homogenous based on distributions of α and compliance, had statistically different distributions of α in comparison to WT, but closely resembled WT in terms of compliance. Based on these results, changing EPS composition impacts compliance and relative elasticity differently. Relative elasticity (based on α) is impacted in later development and compliance in early development. Furthermore, in general decreasing the complexity of EPS composition resulted in greater homogeneity.
Biofilms grown by Δpsl strain were more relatively viscous than biofilms grown by the WT strain at 48 hours, whereas biofilms grown from the Δpel strain had similar relative elasticity to WT. Both strains made films that were less compliant than WT. These results suggest that Psl provides greater relative elasticity and less compliance in comparison to Pel which is consistent with published work.23, 34
The role of alginate on biofilm mechanical properties was less clear. The double knockout ΔpelΔpsl strain was always substantially more relatively elastic, less compliant, and more homogenous than the WT at all times. Given that the ΔpelΔpsl biofilm should be composed primarily of alginate in terms of EPS, this result appears to be consistent with alginate biofilms having increased resistance to yield.34 However, ΔmucA strain was more relatively viscous than WT, which is at odds with published results34, 57 and the ΔpelΔpsl strain.
Increasing EPS production results in more homogenous, more relatively elastic, and less compliant biofilms when comparing ΔwspF strains to the baseline strains, indicating increasing quantity of EPS in general affects biofilms in similar ways regardless of EPS composition. The ΔwspFΔpelΔpsl was an exception to this observation. It is unclear why. Finally, EPS production is increased the relative impact of individual EPS components is diminished, i.e., most biofilms appear quite similar mechanically when the ΔwspF is present.
Effects of Collagen
Results from ensemble averages in Figure 2 and distributions in Figure 3 and 5 show that in the first 24 hours collagen increases the relative elasticity and lowers compliance of young biofilms regardless of the EPS components present. Furthermore, there is a narrowing of the distribution of α with increasing collagen, indicating biofilms also become more homogenous in the presence of more collagen. P. aeruginosa has been shown to be more capable of adhering30, 31 and forms more stable biofilms32 on surfaces with collagen. Such increased growth rate and/or surface attachment, could accelerate maturation of the biofilms which would be consistent with observed mechanical results up to 24 hours. However, there is no published evidence that free collagen aids in attachment.
Figure 5:
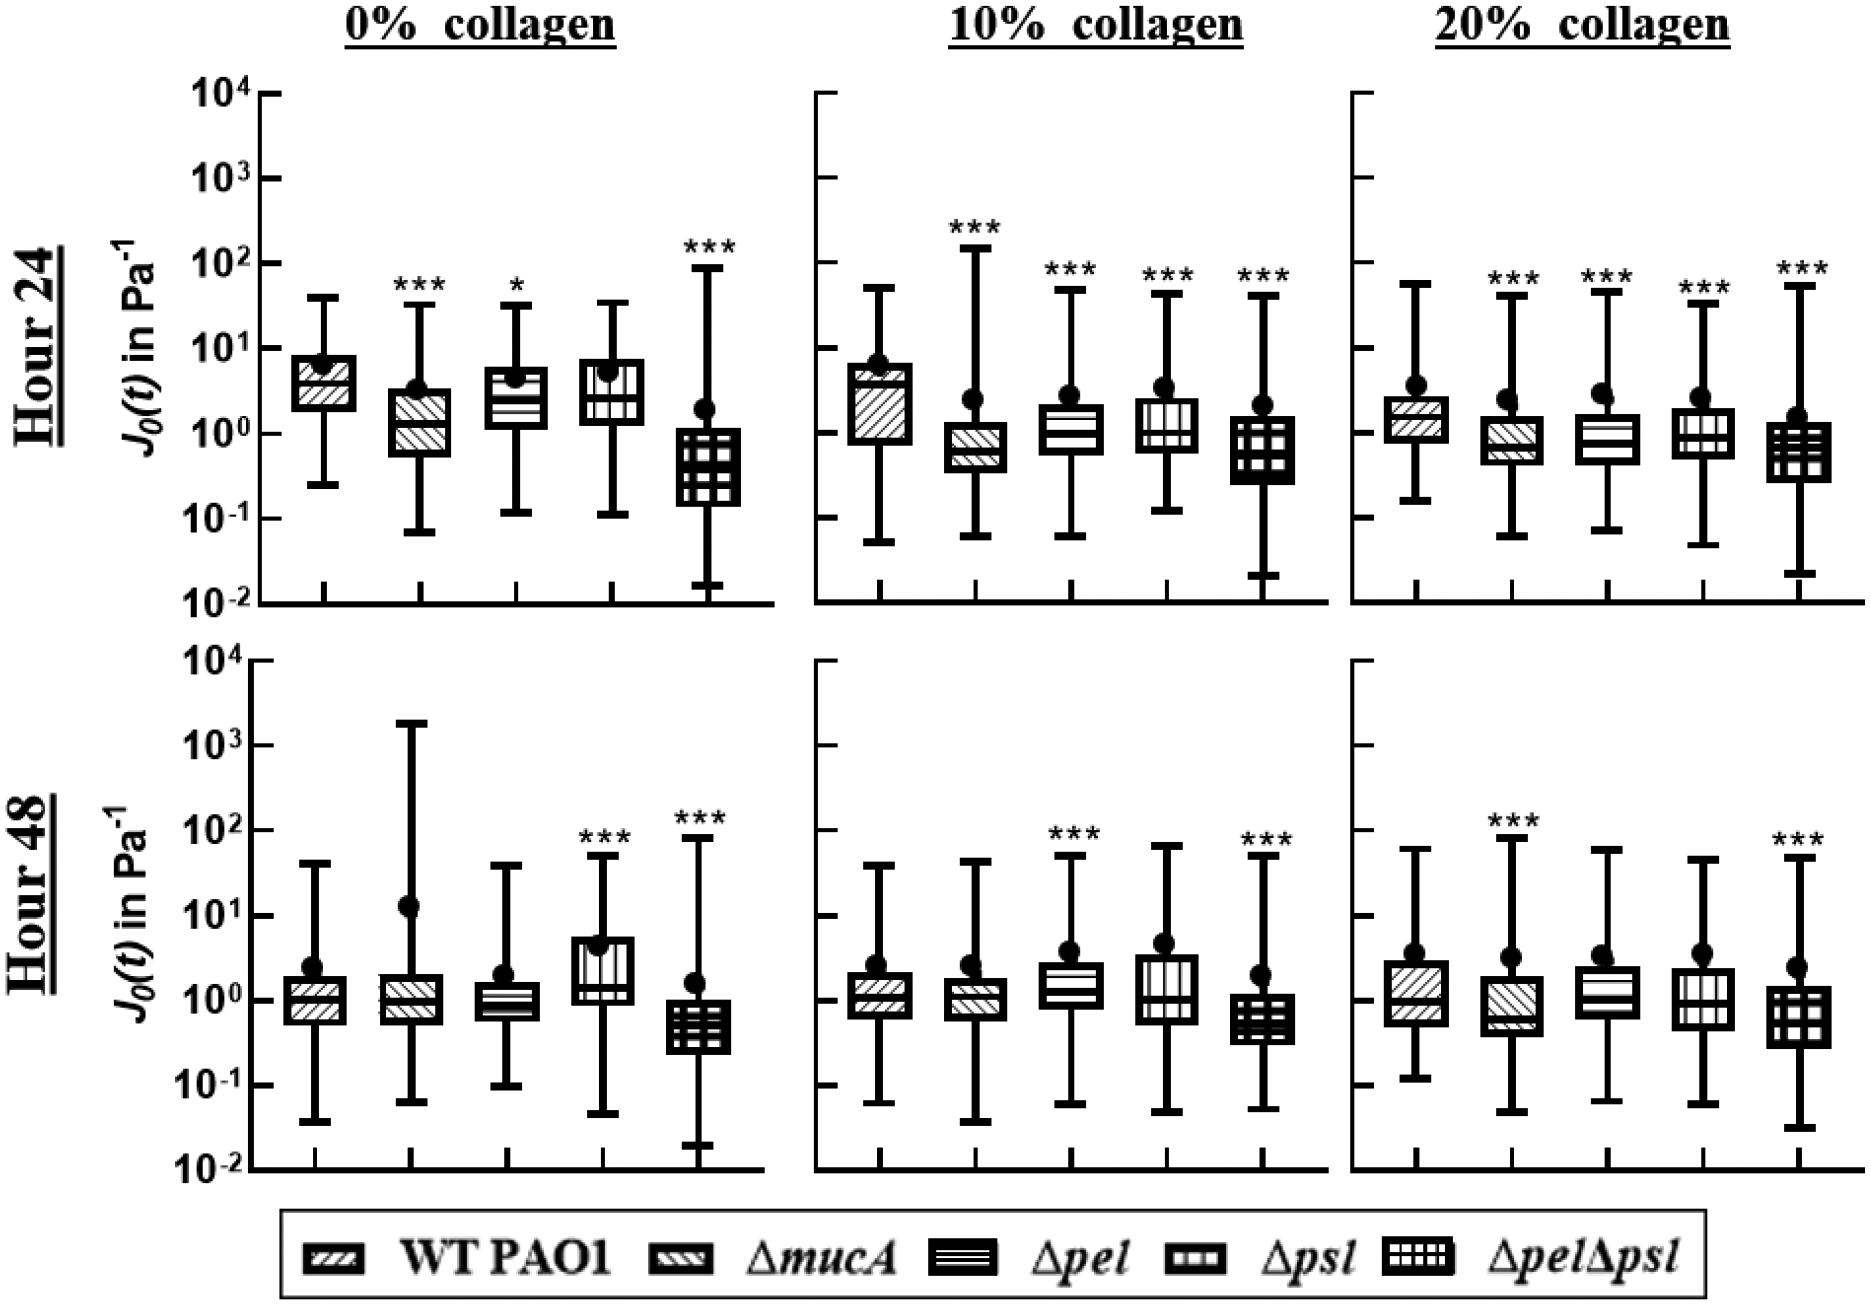
Distribution of compliance at t=0.2s. The box represents the middle 50% of the data, the line within the box represents the median of the distribution, the black dot represents the mean, the upper vertical line represents the upper quartile, and the lower vertical line represents the bottom quartile. P≤0.05 demarcated with *, P≤0.01 demarcated with **, and P≤0.001 demarcated with ***.
After 48 hours, the biofilms grown in the presence of 10% collagen do not exhibit changes in compliance, become more relatively viscous (except for the ΔpelΔpsl), and distributions indicate increased heterogeneity. These changes indicate the biofilm’s microstructure is altering. The biofilms grown in the presence of 20% collagen exhibit almost no change in the behavior of α and compliance from 24 to 48 hours, indicating a more stable microstructure. If behavior were determined by increased attachment due to free collagen, we would not expect differences in microstructure to develop for similar EPS strains based at different collagen levels over time.
Instead, we hypothesize that the collagen is incorporating into the biofilm and becoming a de-facto part of the EPS. To help confirm this, it is useful to compare the c-di-GMP overexpressing strains without collagen to the baseline strains with collagen. The c-di-GMP overexpressers create more EPS because of the increasing number of “biofilm founders.” These films are more relatively elastic and less compliant than comparable baseline films due to the increased EPS. The effects are very similar to how baseline strains change in the presence of collagen. We conclude that the free collagen affects biofilm viscoelasticity by incorporating into the EPS which is equivalent to the increased EPS production of the -di-GMP overexpressers. However EPS quantity is increased, there is increasing relative elasticity and decreasing compliance.
Furthermore, incorporation of collagen gels into biofilms has been previously found to increase the consistency of P. aeruginosa biofilms’ properties in literature.32 The incorporation of free collagen throughout the biofilm into the EPS should similarly create more consistent microstructures in technical/biological replicates, resulting in the observed increased homogeneity in material properties.
The above hypothesis appears consistent with literature and interpretations of our data. It is not clear how the free collagen incorporates into the biofilm. It may be adsorbing to the bacteria, interacting with existing EPS, or physically entangling with existing EPS to incorporate into the biofilm. Most of the baseline strains grown in the presence of collagen are statistically similar to the WT biofilm at 24 hours. This seems to indicate no interaction between a specific EPS component and the collagen. When looking at individual strain results in Figure 4, the alginate-dominated strains show little dependence on collagen concentration. Both Δpsl and Δpel had statistical differences with increasing collagen concentration, indicating possible interaction between Pel and Psl with collagen. However, the Δpsl behavior is nearly identical to the WT, indicating Psl is not interacting with the collagen. There is therefore possibly some specific chemical or electrostatic interaction between collagen and Pel. However, given its broad impact over most strains, it appears more likely collagen’s incorporation into the EPS is not due to specific interaction with any EPS component.
The interaction between the biofilm and the collagen may be due to collagen adhering to bacteria. Given that published work has shown that P. aeruginosa can adhere to collagen,30–32 and the results here indicate no interaction with specific EPS components, this appears to be a likely source of incorporation into the EPS.
Additionally, collagen may incorporate into the biofilm through physical entanglement with existing EPS. The increased relative viscosity of the 10% collagen biofilms after 48 hours could be explained by secreted EPS driving out entangled collagen. At higher collagen concentrations the microstructure imposed by collagen may be more resistant to re-structuring.
Implications to In-vivo Biofilms
Given these experimental results, we expect that the collagen in wounds is significantly impacting the viscoelasticity of P. aeruginosa biofilms, creating less compliant, more elastic films. Therefore, experimental study of P. aeruginosa biofilm viscoelasticity without the presence of collagen is not capturing the true nature of in-vivo biofilms in terms of their rheological properties. Rather most studies are growing substantially weaker, more viscous films than would be found in-vivo. Furthermore, the contribution of bacterial exopolysaccharides may appear exaggerated compared to their importance in-vivo. This is important in attempting to understand/develop techniques for physical removal and/or dispersal. Films grown without collagen will be easier to remove, and do not accurately represent in-vivo rheology.
Conclusion
The results of individual EPS components on the viscoelasticity of P. aeruginosa biofilms in this work is relatively consistent with previously published results. However, we find that EPS seems to affect the compliance at early time stages and the relative elasticity of biofilms at later stages. Unsurprisingly, we also find that increased EPS due to increased c-di-GMP levels production results in increased relative elasticity and decreased compliance of biofilms. Although this was expected, it has not been shown in previous work. Additionally, the presence of free collagen enables the formation of less compliant, more elastic, more homogenous biofilms over the first 48 hours of biofilm growth. This appears to be concentration dependent, with greater levels of collagen providing greater effect. Based on results with various EPS knockouts, the effect of the collagen on the biofilm is non-specific to EPS components and appears to be some combination of both physical entanglement of collagen into the EPS and attachment of collagen to bacteria within the biofilm. In general, this results have important implications to the role of collagen on in-vivo biofilm viscoelasticity and current experimental techniques.
Figure 10:
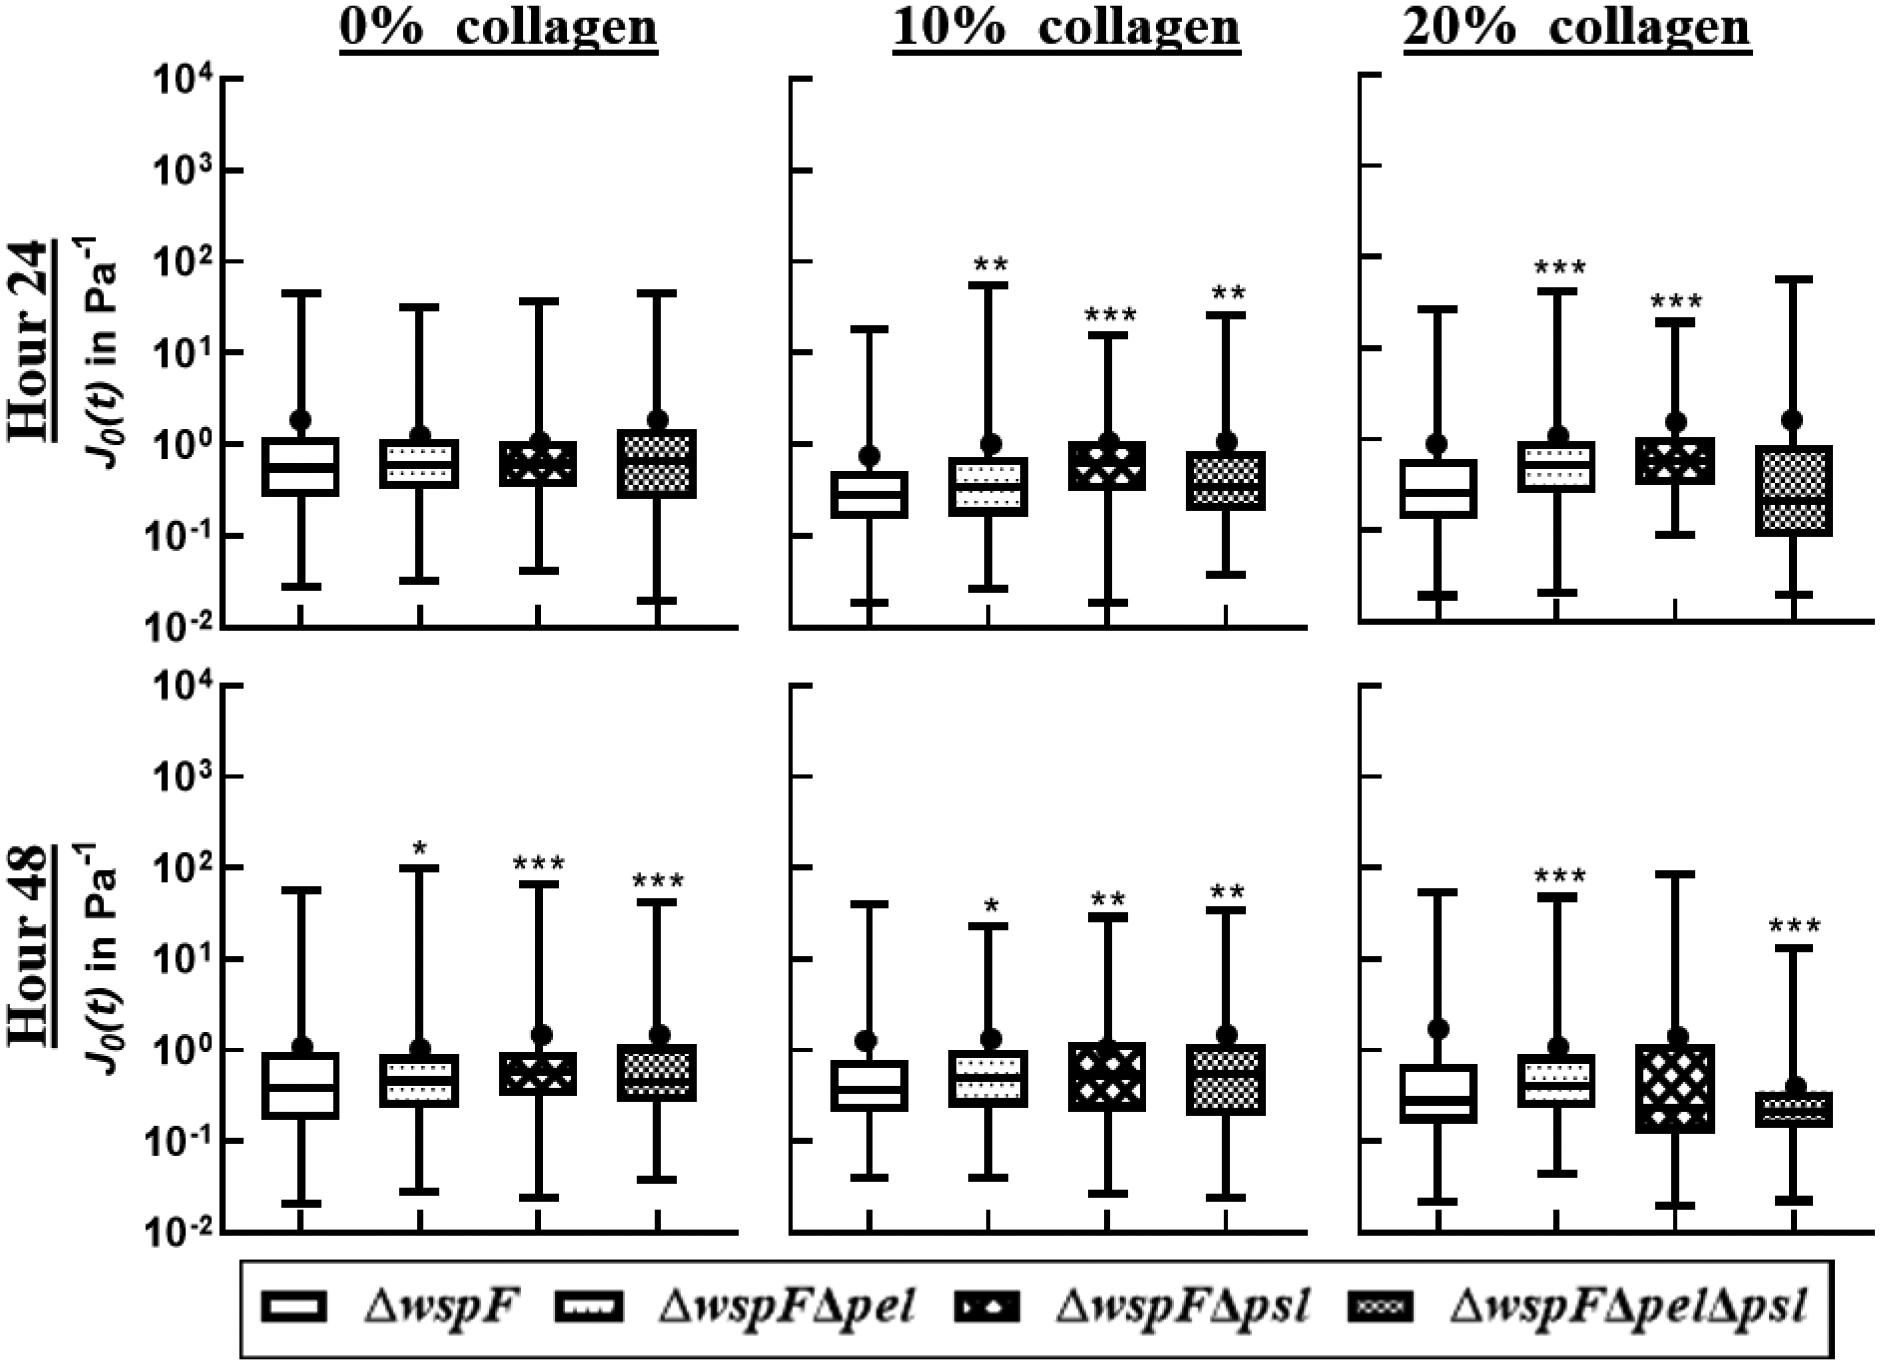
Distribution of compliance at t=0.2s in a box-whisker plot. The box represents the middle 50% of the data, the line within the box represents the median of the distribution, the black dot represents the mean, the upper vertical line represents the upper quartile, and the lower vertical line represents the bottom quartile. P≤0.05 demarcated with *, P≤0.01 demarcated with **, and P≤0.001 demarcated with ***.
Acknowledgements
We wish to acknowledge the NIH NIAID for funding this work (#9384080).
REFERENCES
- 1.Costerton JW, Stewart PS and Greenberg EP, Science, 1999, 284, 1318–1322. [DOI] [PubMed] [Google Scholar]
- 2.Costerton JW, International journal of antimicrobial agents, 1999, 11, 217–221. [DOI] [PubMed] [Google Scholar]
- 3.Hall-Stoodley L, Costerton JW and Stoodley P, Nature Reviews Microbiology, 2004, 2, 95–108. [DOI] [PubMed] [Google Scholar]
- 4.Bjarnsholt T, Jensen PØ, Fiandaca MJ, Pedersen J, Hansen CR, Andersen CB, Pressler T, Givskov M and Høiby N, Pediatric pulmonology, 2009, 44, 547–558. [DOI] [PubMed] [Google Scholar]
- 5.Bjarnsholt T, Kirketerp‐Møller K, Jensen PØ, Madsen KG, Phipps R, Krogfelt K, Høiby N and Givskov M, Wound repair and regeneration, 2008, 16, 2–10. [DOI] [PubMed] [Google Scholar]
- 6.Bjarnsholt T, Jensen PØ, Burmølle M, Hentzer M, Haagensen JAJ, Hougen HP, Calum H, Madsen KG, Moser C, Molin S, Høiby N and Givskov M, Microbiology, 2005, 151, 373–383. [DOI] [PubMed] [Google Scholar]
- 7.Fexby S, Bjarnsholt T, Jensen PØ, Roos V, Høiby N, Givskov M and Klemm P, Infection and immunity, 2007, 75, 30–34. [DOI] [PMC free article] [PubMed] [Google Scholar]
- 8.Gilligan PH, Clinical microbiology reviews, 1991, 4, 35–51. [DOI] [PMC free article] [PubMed] [Google Scholar]
- 9.Pedersen SS, Høiby N, Espersen F and Koch C, Thorax, 1992, 47, 6–13. [DOI] [PMC free article] [PubMed] [Google Scholar]
- 10.Flemming H-C, Wingender J, Mayer C, Korstgens V and Borchard W, Cohesiveness in biofilm matrix polymers, Cambridge; Cambridge University Press, 2000. [Google Scholar]
- 11.Stewart PS, Biofouling, 2012, 28, 187–198. [DOI] [PubMed] [Google Scholar]
- 12.Stoodley P, Lewandowski Z, Boyle JD and Lappin‐Scott HM, Biotechnology and bioengineering, 1999, 65, 83–92. [PubMed] [Google Scholar]
- 13.Stoodley P, Hall-Stoodley L and Lappin-Scott HM, Methods in enzymology, 2001, 337, 306–319. [DOI] [PubMed] [Google Scholar]
- 14.Bodey GP, Bolivar R, Fainstein V and Jadeja L, Rev Infect Dis, 1983, 5, 279–313. [DOI] [PubMed] [Google Scholar]
- 15.Davies CE, Hill KE, Wilson MJ, Stephens P, Hill CM, Harding KG and Thomas DW, J Clin Microbiol, 2004, 42, 3549–3557. [DOI] [PMC free article] [PubMed] [Google Scholar]
- 16.Ramsey SD, Newton K, Blough D, Mcculloch DK, Sandhu N, Reiber GE and Wagner EH, Diabetes care, 1999, 22, 382–387. [DOI] [PubMed] [Google Scholar]
- 17.Kalan L, Loesche M, Hodkinson BP, Heilmann K, Ruthel G, Gardner SE and Grice EA, mBio, 2016, 7, e01058–01016. [DOI] [PMC free article] [PubMed] [Google Scholar]
- 18.Gardner SE, Hillis SL, Heilmann K, Segre JA and Grice EA, Diabetes, 2013, 62, 923–930. [DOI] [PMC free article] [PubMed] [Google Scholar]
- 19.Grice EA, Snitkin ES, Yockey LJ, Bermudez DM, Liechty KW and Segre JA, Proceedings of the National Academy of Sciences, 2010, 107, 14799–14804. [DOI] [PMC free article] [PubMed] [Google Scholar]
- 20.Fleming D and Rumbaugh K, Scientific Reports, 2018, 8. [DOI] [PMC free article] [PubMed] [Google Scholar]
- 21.Wolcott R, Sanford N, Gabrilska R, Oates JL, Wilkinson JE and Rumbaugh KP, Journal of Wound Care, 2016, 25, S33–S43. [DOI] [PubMed] [Google Scholar]
- 22.Sun Y, Dowd SE, Smith E, Rhoads DD and Wolcott RD, Wound repair and regeneration, 2008, 16, 805–813. [DOI] [PubMed] [Google Scholar]
- 23.Chew SC, Kundukad B, Seviour T, Van der Maarel JRC, Yang L, Rice SA, Doyle P and Kjelleberg S, mBio, 2014, 5, 1–11. [DOI] [PMC free article] [PubMed] [Google Scholar]
- 24.Berk V, Fong JCN, Dempsey GT, Develioglu ON, Zhuang X, Liphardt J, Yildiz FH and Chu S, Science, 2012, 337, 236–239. [DOI] [PMC free article] [PubMed] [Google Scholar]
- 25.Wloka M, Rehage H, Flemming HC and Wingender J, Biofilms, 2005, 2, 275–283. [Google Scholar]
- 26.Lieleg O, Caldara M, Baumgartel R and Ribbeck K, Soft Matter, 2011, 7, 3307–3314. [DOI] [PMC free article] [PubMed] [Google Scholar]
- 27.Kovach KN, Fleming D, Wells MJ, Rumbaugh KP and Gordon VD, Langmuir, 2020, 36, 1585–1595. [DOI] [PMC free article] [PubMed] [Google Scholar]
- 28.Scott JE, J Anat, 1995, 187 (Pt 2), 259–269. [PMC free article] [PubMed] [Google Scholar]
- 29.Shen ZL, Kahn H, Ballarini R and Eppell SJ, Biophysical journal, 2011, 100, 3008–3015. [DOI] [PMC free article] [PubMed] [Google Scholar]
- 30.Birkenhauer E, Neethirajan S and Weese JS, BMC Microbiol, 2014, 14, 191–191. [DOI] [PMC free article] [PubMed] [Google Scholar]
- 31.Tsang KW, Shum DK, Chan S, Ng P, Mak J, Leung R, Shum IH, Ooi GC, Tipoe GL and Lam WK, European Respiratory Journal, 2003, 21, 932–938. [DOI] [PubMed] [Google Scholar]
- 32.Slade EA, Thorn RM, Young A and Reynolds DM, BMC Microbiol, 2019, 19, 310. [DOI] [PMC free article] [PubMed] [Google Scholar]
- 33.Rogers SS, Van Der Walle C and Waigh TA, Langmuir, 2008, 24, 13549–13555. [DOI] [PubMed] [Google Scholar]
- 34.Kovach K, Davis-Fields M, Irie Y, Jain K, Doorwar S, Vuong K, Dhamani N, Mohanty K, Touhami A and Gordon VD, Biofilms and Microbiomes, 2017, 3, 1–1. [DOI] [PMC free article] [PubMed] [Google Scholar]
- 35.Jones WL, Sutton MP, McKittrick L and Stewart PS, Biofouling, 2011, 27, 207–215. [DOI] [PubMed] [Google Scholar]
- 36.Klapper I, Rupp CJ, Cargo R, Purvedorj B and Stoodley P, Biotechnology bioengineering, 2002, 80, 289–296. [DOI] [PubMed] [Google Scholar]
- 37.Stoodley P, Jacobsen A, Dunsmore B, Purevdorj B, Wilson S, Lappin-Scott H and Costerton JW, Water Science Technology, 2001, 43, 113–120. [PubMed] [Google Scholar]
- 38.Stoodley P, Sauer K, Davies D and Costerton JW, Annual Reviews in Microbiology, 2002, 56, 187–209. [DOI] [PubMed] [Google Scholar]
- 39.Cao H, Habimana O, Safari A, Heffernan R, Dai Y and Casey E, Biofilms and Microbiomes, 2016, 2, 1–7. [DOI] [PMC free article] [PubMed] [Google Scholar]
- 40.Cao H, Habimana O, Safari A, Heffernan R, Dai Y and Casey E, 2016, DOI: 10.1038/s41522-016-0005-y, 1–7. [DOI] [PMC free article] [PubMed]
- 41.He K and Bauer CE, Trends Microbiol, 2014, 22, 389–398. [DOI] [PMC free article] [PubMed] [Google Scholar]
- 42.Valentini M and Filloux A, J Biol Chem, 2016, 291, 12547–12555. [DOI] [PMC free article] [PubMed] [Google Scholar]
- 43.Armbruster CR, Lee CK, Parker-Gilham J, de Anda J, Xia A, Zhao K, Murakami K, Tseng BS, Hoffman LR and Jin F, Elife, 2019, 8, e45084. [DOI] [PMC free article] [PubMed] [Google Scholar]
- 44.Hickman JW, Tifrea DF and Harwood CS, Proceedings of the National Academy of Sciences, 2005, 102, 14422–14427. [DOI] [PMC free article] [PubMed] [Google Scholar]
- 45.Gordon VD, Davis-Fields M, Kovach K and Rodesney CA, Journal of Physics D: Applied Physics, 2017, 50, 223002. [Google Scholar]
- 46.Lieleg O, Caldara M, Baumgärtel R and Ribbeck K, Soft matter, 2011, 7, 3307–3314. [DOI] [PMC free article] [PubMed] [Google Scholar]
- 47.Kovach KN, Fleming D, Wells MJ, Rumbaugh KP and Gordon VDJL, 2020, 36, 1585–1595. [DOI] [PMC free article] [PubMed] [Google Scholar]
- 48.Schurr MJ, Journal of bacteriology, 2013, 195, 1623–1626. [DOI] [PMC free article] [PubMed] [Google Scholar]
- 49.Ma L, Jackson KD, Landry RM, Parsek MR and Wozniak DJ, Journal of Bacteriology, 2006, 188, 8213–8221. [DOI] [PMC free article] [PubMed] [Google Scholar]
- 50.Campisano A, Schroeder C, Schemionek M, Overhage J and Rehm BH, Applied and environmental microbiology, 2006, 72, 3066–3068. [DOI] [PMC free article] [PubMed] [Google Scholar]
- 51.Colvin KM, Gordon VD, Murakami K, Borlee BR, Wozniak DJ, Wong GCL and Parsek MR, PLOS Pathogens, 2011, 7, e1001264. [DOI] [PMC free article] [PubMed] [Google Scholar]
- 52.Simpson JA, Smith SE and Dean RT, Free Radical Biology and Medicine, 1989, 6, 347–353. [DOI] [PubMed] [Google Scholar]
- 53.Hentzer M, Teitzel GM, Balzer GJ, Heydorn A, Molin S, Givskov M and Parsek MR, Journal of bacteriology, 2001, 183, 5395–5401. [DOI] [PMC free article] [PubMed] [Google Scholar]
- 54.Bayer AS, Speert DP, Park S, Tu J, Witt M, Nast CC and Norman DC, Infection and immunity, 1991, 59, 302–308. [DOI] [PMC free article] [PubMed] [Google Scholar]
- 55.Colvin KM, Irie Y, Tart CS, Urbano R, Whitney JC, Ryder C, Howell PL, Wozniak DJ and Parsek MR, Environmental microbiology, 2012, 14, 1913–1928. [DOI] [PMC free article] [PubMed] [Google Scholar]
- 56.Jennings LK, Storek KM, Ledvina HE, Coulon C, Marmont LS, Sadovskaya I, Secor PR, Tseng BS, Scian M, Filloux A, Wozniak DJ, Howell PL and Parsek MR, Proceedings of the National Academy of Sciences, 2015, 112, 11353. [DOI] [PMC free article] [PubMed] [Google Scholar]
- 57.Murgia X, Kany AM, Herr C, Ho D-K, De Rossi C, Bals R, Lehr C-M, Hirsch AKH, Hartmann RW, Empting M and Röhrig T, Scientific Reports, 2020, 10, 16502. [DOI] [PMC free article] [PubMed] [Google Scholar]
- 58.McDonald JC, Duffy DC, Anderson JR, Chiu DT, Wu H, Schueller OJ and Whitesides GM, ELECTROPHORESIS, 2000, 21, 27–40. [DOI] [PubMed] [Google Scholar]
- 59.Coenye T, Kjellerup B, Stoodley P, Bjarnsholt T, Shirtliff M, Stoodley P, Kjellerup B and Coenye T, Biofilms, 2020, 2. [Google Scholar]
- 60.Bilings N, Birjiniuk A, Samad T, Doyle P and Ribbeck K, Rep Prog Phys, 2016, 78, 33. [DOI] [PMC free article] [PubMed] [Google Scholar]
- 61.Mason TG, Ganesan K, van Zanten JH, Wirtz D and Kuo SC, Physical review letters, 1997, 79, 3282. [Google Scholar]
- 62.Savin T and Doyle PS, Physical Review E, 2007, 76, 021501. [DOI] [PubMed] [Google Scholar]
- 63.Tinevez J-Y, Perry N, Schindelin J, Hoopes GM, Reynolds GD, Laplantine E, Bednarek SY, Shorte SL and Eliceiri KW, Methods, 2017, 115, 80–90. [DOI] [PubMed] [Google Scholar]
- 64.Schindelin J, Arganda-Carreras I, Frise E, Kaynig V, Longair M, Pietzsch T, Preibisch S, Rueden C, Saalfeld S, Schmid B, Tinevez J-Y, White DJ, Hartenstein V, Eliceiri K, Tomancak P and Cardona A, Nature Methods, 2012, 9, 676–682. [DOI] [PMC free article] [PubMed] [Google Scholar]
- 65.Tarantino N, Tinevez J-Y, Crowell EF, Boisson B, Henriques R, Mhlanga M, Agou F, Israël A and Laplantine E, Journal of Cell Biology, 2014, 204, 231–245. [DOI] [PMC free article] [PubMed] [Google Scholar]
- 66.Michalet X, Physical Review E, 2010, 82, 041914. [DOI] [PMC free article] [PubMed] [Google Scholar]
- 67.McKight PE and Najab J, The corsini encyclopedia of psychology, 2010, 1–1. [Google Scholar]
- 68.Wozniak DJ, Wyckoff TJO, Starkey M, Keyser R, Azadi P, O’Toole GA and Parsek MR, 2003, 100, 7907–7912. [DOI] [PMC free article] [PubMed] [Google Scholar]


