

INTRODUCTION
In 2017, the American Joint Committee on Cancer (AJCC) announced the 8th edition staging guidelines including significant changes to the T classification in oral cavity cancer.1 In particular, depth of invasion (DOI) was added to the schema for T1 – T3 tumors and extrinsic muscle invasion (EMI) was removed as a criterion for upstaging tumors to T4a. The motivation for this decision was “because DOI supersedes [EMI], and limited EMI is difficult to assess (either clinically or pathologically).1” However, disagreement exists in the literature regarding the independent prognostic value of EMI, and DOI may not have the same impact in all subsites of the oral cavity.2,3
We hypothesized that EMI remains an important predictor of oral cancer oncologic outcomes. In this study, we sought to determine the relative impact of EMI on survival in reference to other factors within the staging schema. We evaluated the difference between bone and EMI, the two primary criteria for upstaging to T4a in the AJCC 7th edition staging guidelines, to understand the impact of EMI on survival in the AJCC 8th edition staging system.
MATERIALS AND METHODS
Population:
We performed a retrospective analysis of a prospectively collected registry (University of Michigan Specialized Program of Research Excellence (SPORE) and Michigan Head and Neck Epidemiology Research and Outcomes (MiHero) clinical databases) in patients 18 years of age or older with previously untreated oral cavity squamous cell carcinoma (OCSCC) at the University of Michigan from 1998 – 2017. The inclusion criteria included only patients with advanced T classification (T4a by AJCC 7th edition staging guidelines), patients who underwent primary surgical resection, and those cases where depth of invasion (DOI) was available.1 Patients were classified by both AJCC 7th and 8th edition staging guidelines. T4a by AJCC 7th edition staging guidelines is defined as a tumor invading adjacent structures including cortical bone, deep muscle of the tongue, maxillary sinus and skin of the face. According to the AJCC 8th edition staging guidelines T1–T4a are defined as follows: (T1) ≤ 2 cm, ≤ 5 mm DOI, (T2) ≤ 2 cm, DOI > 5 mm and ≤ 10 mm or > 2 cm but ≤ 4 cm and ≤ 10 mm DOI (T3) > 4 cm or any tumor > 10 mm DOI (T4a) invasion of adjacent structures including bone of mandible, maxillary sinus, skin of face.4 A superscript of 7th or 8th was utilized to designate which edition was used in the referenced data. All classifications were pathologic. Cutaneous (dry) lip subsite and T4b cases were excluded from this analysis. Clincopathologic data were abstracted from the electronic medical record. The University of Michigan IRBMED provided approval for the study.
The electronic medical record was reviewed and all clinical and pathologic and available radiographic data were independently reviewed (EJM and SBC) to determine whether each case had both bone invasion and EMI versus EMI alone as the criteria for the original T4a7th classification. Bone invasion was defined as invades through the cortical bone, greater than tooth socket/cortical bone erosion. Within the study cohort, 60% (98/163) of patients had available pre-operative computed tomography (CT) scans available for review. These were independently reviewed by two board certified neuroradiologists and a head and neck surgical oncologist (RL, MI, and SBC) for EMI. There was 100% concordance between the two radiologists. There were 20 patients in which there was disagreement between the surgeon and radiologist categorization of EMI. These cases were reviewed and the operative report was used as the gold standard if there was explicit description of gross tumor in relation to EMI (n = 9); otherwise we deferred to the radiographic categorization. Bone invasion was exclusively determined utilizing pathologic data. One patient was excluded because skin invasion was the only criteria met for T4a classification. Treatment end date was defined as the date of completed definitive treatment (including adjuvant therapy if applicable).
Statistical analysis:
Descriptive statistics, chi-square tests, linear regression, and Kaplan Meier survival analyses were performed using SAS (v.9.4) software (Carey, NC). Confidence intervals for binomial proportions were calculated by the Clopper-Pearson method. Unadjusted overall (OS) and disease-specific (DSS) survival were calculated from the date of treatment completion to death or last known follow-up. Patients who died from causes other than the index malignancy were censored at the date of death for DSS. Point estimates using the life table method were reported. Cox regression analysis was performed for OS and DSS first by choosing a best clinical model through backward selection of all available covariates (age, gender, nodal status including extracapsular extension, margin status, perineural invasion, lymphovascular invasion (LVI), and adjuvant therapy). Next, each T classification migration variable (T classification by 8th edition guidelines and reason for T4 under 7th edition) was tested separately when added to the base model.
RESULTS
AJCC 8th Edition Restaging
Patients were re-classified according to the AJCC 8th edition staging guidelines,1 the results of which are outlined in Figure 1A. Overall stage migration to a lower T-classification was found in 44% (71/163) of the cases. The majority, 90% (64/71) were downstaged to T38th, whereas only 7% (5/71) and 3% (2/71) were downstaged to T28th and T18th respectively. We compared 5–year overall survival (OS) between T38th and T4a8th tumors and found that there was no significant difference between the two groups (47%[ 95% CI: (34, 60)], and 41%[ 95% CI: (30, 52)],respectively, p = 0.57) (Figure 1B). A similar result was seen for 5-year DSS which was 63% [95% CI: (48,74)] and 51% [95% CI: (38,62)] for T38th and T4a8th respectively (p = 0.32) (Figure 1C). The most significant variables were included in a multivariable cox model for overall (OS) and disease specific survival (DSS) (Table 1). Herein, we found that T3a8th classification did not result in a significant decrease in the Hazard Ratio (HR) for either OS or DSS (0.95, 95% CI 0.59 – 1.52 p = 0.83 and 0.78, 95% CI 0.44 – 1.38, p = 0.40, respectively). However, gender, LVI, and N-classification with extracapsular spread (ECS) were associated with significantly increased HR for both OS and DSS. Adjuvant therapy was associated with significantly better OS and DSS.
Figure 1.
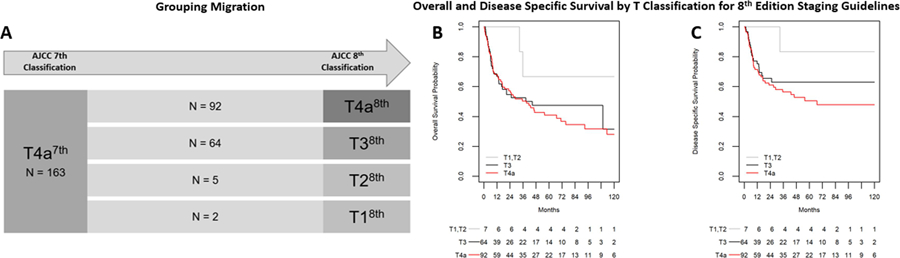
Reclassification of T4a7th tumors by AJCC 7th edition guidelines to AJCC 8th edition staging guidelines. A) Stage Migration; (B) Overall and Disease specific (C) survival by T classification, 8th edition staging guidelines
Abbreviations: 7th = AJCC 7th edition; 8th = AJCC 8th edition
Table 1:
Multivariable Cox model results for Overall survival (OS) and Disease Specific Survival (DSS)
| Variable | OS | DSS | |||
|---|---|---|---|---|---|
| unit | HR (95% CI) | p-value | HR (95% CI) | p-value | |
| Tpath8th | 1 or 2 | 0.42 (0.10, 1.76) | 0.23 | 0.28 (0.04, 2.10) | 0.22 |
| 3 | 0.95 (0.59, 1.52) | 0.83 | 0.78 (0.44, 1.38) | 0.40 | |
| 4 | ref | ref | |||
| Gender | Female | 1.58 (1.02, 2.46) | 0.04 | 1.69 (0.99, 2.88) | 0.05 |
| Male | ref | ref | |||
| NstageECS | N0 | 0.31 (0.16, 0.59) | <0.001 | 0.25 (0.11, 0.57) | 0.001 |
| N+ no ECS | 0.53 (0.30, 0.93) | 0.03 | 0.51 (0.27, 0.97) | 0.04 | |
| N+ ECS+ | ref | ref | |||
| LVI | Yes | 1.74 (1.07, 2.81) | 0.03 | 2.74 (1.59, 4.72) | <0.001 |
| No | ref | ref | |||
| Margins | Positive | 2.21 (1.14, 4.28) | 0.02 | 1.55 (0.67, 3.56) | 0.31 |
| Negative | ref | ref | |||
| Adjuvant Therapy | RT | 0.39 (0.20, 0.76) | 0.006 | 0.33 (0.14, 0.80) | 0.01 |
| ChemoRT | 0.42 (0.20, 0.90) | 0.02 | 0.40 (0.16, 1.02) | 0.06 | |
| none | ref | ref | |||
Abbreviations: RT = radiation therapy, ECS = extracapsular extension, LVI = lymphovascular invasion, Tpath8th = pathologic T classification, 8th edition staging guidelines
Alternative Classification
Next, we categorized patients based on bone invasion, EMI, or both rather than T classification. We found that 17% (27/163) of patients had both bone invasion and EMI, 40% (65/163) of patients had bone invasion alone, and 44% (71/163) of patients had EMI alone (Figure 2A). On univariate analysis, we found that EMI alone was associated with younger age (Table 2). As expected, the subsite distribution differed significantly between the groups. Depth of invasion (DOI) was significantly higher among the EMI + bone invasion group (2.3 cm compared with 1.7 cm and 1.9 cm in bone invasion and EMI alone respectively, p = 0.006 and p = 0.06 (Table 3). Additionally, bone invasion alone was associated with both the highest rate of positive margins (15.4% [95% CI 7.6–26.5]) and the lowest occurrence of PNI (32.8% [95%CI 21.6–45.7]) between the groups. We then repeated the survival analysis as performed previously (Figure 2B and C). Bone invasion alone and EMI alone have similar OS outcomes (5-year OS estimate of 48% and 49% respectively) while EMI + bone invasion is associated with significantly poorer survival (21%, p = 0.03 and 0.03 compared to bone invasion alone or EMI alone, respectively). Multivariable cox modeling for OS and DSS found that bone invasion alone did not impart an increased HR for OS or DSS when compared to EMI (Table 3). However, EMI + bone invasion was associated with an increased HR compared to bone invasion alone that was not significant for OS (1.66, 95% CI 0.93 – 2.97, p = 0.09), but did predict DSS (1.98, 95% CI 1.03 – 3.82, p = 0.04). Again, female gender, LVI, andN classification with ECS were associated with significantly increased HR and adjuvant therapy was associated with significantly decreased HR for both OS and DSS.
Figure 2:
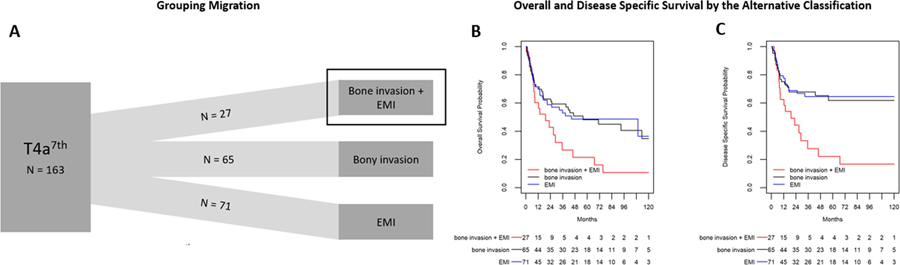
Reclassification of T4a tumors by AJCC 7th edition guidelines utilizing an alternative classification system based upon tumor characteristics. A) Stage Migration; (B) Overall and Disease specific (C) survival by alternative classification
Abbreviations: 7 = AJCC 7th edition; EMI = extrinsic muscle invasion
Table 2.
Clinicopathologic Characteristics of Patients with Advanced Stage Oral Cavity Squamous Cell Carcinoma
| EMI only (n = 71) |
Bone invasion only (n = 65) |
EMI + Bone invasion (n = 27) |
p | |
|---|---|---|---|---|
| Demographics | ||||
| Age, mean, years (±SD) | 54.7 (±14.0) | 66.2 (±12.0) | 60.5 (±11.4) | <0.001 |
| Sex, % (n) | ||||
| Male | 64.8 (46) | 55.4 (36) | 55.6 (15) | 0.483 |
| Female | 35.2 (25) | 44.6 (29) | 44.4 (12) | |
| Race, % (n) | 0.814 | |||
| White | 97.2 (97.2) | 95.4 (95.4) | 96.3 (26) | |
| Black | 2.8 (2) | 3.1 (2) | 3.7 (1) | |
| Other | 0.0 (0) | 1.5 (1) | 0.0 (0) | |
| Risk factors, % (n) | ||||
| Tobacco use | 0.152 | |||
| Current | 52.1 (37) | 42.4 (27) | 63.0 (17) | |
| Former | 26.8 (19) | 26.6 (17) | 29.6 (8) | |
| Never | 21.1 (15) | 31.3 (20) | 7.4 (2) | |
| Alcohol use | < 0.001 | |||
| Current | 43.7 (31) | 20.3 (13) | 63.0 (17) | |
| Former | 22.5 (16) | 14.1 (9) | 11.1(3) | |
| Never | 32.4 (23) | 64.1 (41) | 25.9 (7) | |
| Primary Tumor Anatomic Site, % (n) | <0.001 | |||
| Oral tongue | 70.4 (50) | 0.0 (0) | 7.4 (2) | |
| Alveolus | 0.0 (0) | 52.3 (34) | 14.8 (4) | |
| Buccal mucosa | 0.0 (0) | 6.2 (4) | 3.7 (1) | |
| Floor of mouth | 29.6 (21) | 12.3 (8) | 59.3 (16) | |
| Hard palate | 0.0 (0) | 12.3 (8) | 0 (0) | |
| Retromolar trigone | 0.0 (0) | 16.9 (11) | 14.8 (4) | |
| Stage (AJCC 8th.), % (n) | <0.001 | |||
| Stage III | 43.7 (31) | 0.0 | 0.0 | |
| Stage IVa | 56.3 (40) | 100.0 (65) | 100.0 (27) | |
| Adjuvant therapy, % (n) | 0.353 | |||
| None | 10.0 (7) | 18.8 (12) | 22.2 (6) | |
| Radiation therapy | 42.9 (30) | 46.9 (30) | 44.4 (12) | |
| Chemoradiation therapy | 47.1 (33) | 34.4 (22) | 33.3 (9) | |
| Depth of invasion, mean, cm (±SD) | 1.9 (±0.9) | 1.7 (±1.3) | 2.4 (±1.2) | 0.028 |
| N+ classification, % (n) | 69.0 (49) | 52.3 (34) | 66.7 (18) | 0.115 |
| Extracapsular extension, % of N+, % (n) | 61.2 (30) | 61.8 (21) | 61.1 (1) | 0.998 |
| Positive margins, % (n) | 1.4 (1) | 15.4 (10) | 11.1 (3) | 0.013 |
| Perineural invasion, % (n) | 71.4 (50) | 32.8 (21) | 65.4 (17) | <0.001 |
| Primary differentiation, % (n) | ||||
| Well | 25.4 (18) | 26.2 (17) | 3.7 (1) | |
| Moderate | 57.7 (41) | 63.1 (41) | 85.2 (23) | |
| Poor | 16.9 (12) | 10.8 (7) | 11.1 (3) |
EtOH defined as 3 drinks/day, former = quit >6 months ago
Tobacco, former = quit >6 months ago
Data for age and DOI were available for all patients
Table 3:
Multivariable Cox model results for Overall survival (OSS) and Disease Specific Survival (DSS)
| Variable | OS | DSS | |||
|---|---|---|---|---|---|
| Unit | HR (95% CI) | p-value | HR (95% CI) | p-value | |
| Classification | Both Bone invasion and EMI | 1.66 (0.93, 2.97) | 0.09 | 1.98 (1.03, 3.82) | 0.04 |
| EMI alone | 1.04 (0.62, 1.72) | 0.89 | 0.93 (0.49, 1.73) | 0.81 | |
| Bone invasion alone | ref | ref | |||
| Gender | Female | 1.60 (1.03, 2.49) | 0.04 | 1.70 (1.00, 2.91) | 0.05 |
| Male | ref | ref | |||
| N Classification ECS | N0 | 0.33 (0.17, 0.63) | <0.001 | 0.28 (0.12,0.65) | <0.001 |
| N+ no ECS | 0.52 (0.30,0.92) | 0.02 | 0.52 (0.27, 1.00) | 0.05 | |
| N+ ECS+ | ref | ref | |||
| LVI | Yes | 1.71 (1.05, 2.78) | 0.03 | 2.74 (1.58, 4.74) | <0.001 |
| No | ref | ref | |||
| Margins | Positive | 2.23 (1.14, 4.36) | 0.02 | 1.49 (0.63, 3.52) | 0.36 |
| ref | ref | ||||
| Adjuvant Therapy | RT | 0.42 (0.21,0.83) | 0.01 | 0.38 (0.16, 0.94) | 0.04 |
| ChemoRT | 0.46 (0.22, 0.99) | 0.05 | 0.46 (0.18, 1.20) | 0.11 | |
| None | ref | ref | |||
DISCUSSION
The primary objective of this study was to evaluate the impact of the changes made by the AJCC in the 8th edition oral cavity staging guidelines, in particular as it related to the removal of EMI as a criterion for upstaging to T4a. Given that this change solely impacted tumors previously staged as T4a7th, we utilized this as our study cohort. We determined that both bone invasion (pT4a8th) and EMI invasion (pT3, T2, or T18th) have similar prognostic impact alone and it is rather their combination that identifies patients who suffer worse prognoses.
EMI has long been considered a marker for aggressive disease in both oral cavity and oropharyngeal cancer by the AJCC, and remains in the staging guidelines for oropharyngeal tumors. However, the relevance of its impact as an independent prognostic indicator has been challenged. Boland et al5 utilized magnetic resonance images (MRI) to determine that lateral tumors with invasion of the styloglossus or hyoglossus can represent superficial tumors that show no association with occult nodal disease or disease-related survival. This study does not address the hypothesis that EMI may represent a means by which the tumor can overcome normal fascial planes resulting in more aggressive spread, even of superficial tumors. Similar questions have been raised regarding the independent prognostic value of cortical bone invasion in clinically small tumors.6 However, while limited invasion of the alveolus precludes upstaging of these tumors, patients with cortical bone invasion otherwise remain classified as T4a in the 8th edition staging guidelines. Herein, we sought to evaluate both of these key criteria as independent risk factors in advanced stage OCSCC.
Furthermore, one of the main arguments for transitioning away from EMI and using DOI is the difficulty interpreting EMI both radiographically and clinically, whereas DOI is thought of as an objective value. However, as noted in the AJCC discussion on DOI, differentiating thickness from DOI, particularly in large tumors can be equally problematic. While DOI is seen as straightforward, there can be significant interobserver variability, particularly in large 3-dimensional oral cancers.7 Incorporating all critical variables is of utmost importance.
When dichotomizing patients who underwent stage migration from T4a7th to T38th and those who did not get down-staged, the calculated survival estimates are nearly identical. Similarly, when performing a multi-variable cox regression analysis, we see that T48th classification does not increase the HR for either OS or DSS in this cohort. This suggests that we may not be optimally stratifying this group. Several groups have similarly investigated prognostication based upon the resultant stage migration that occurs when reclassifying using the AJCC 8th edition guidelines. However, different study cohorts have shown both improved8,9 and worse prognostication10. This underscores the care with which any single analysis should be interpreted. It also highlights the question of whether these cohorts need to be more granularly evaluated in order to determine the variables underlying these results.
Rather than utilize the cohorts predetermined by the AJCC, we chose to categorize the groups based upon defined criteria, namely bone invasion, EMI, or both. There is a subset of patients (bone invasion + EMI) with a distinct phenotype that supports the continued need to assess EMI. The proposed alternative categorization was used to reclassify the index cohort. Here we see that bone invasion alone does not impart an increased HR for either OS or DSS when compared to EMI. Rather, it is the combination of EMI and bone invasion that results in worse DSS. In this analysis, DOI was included as a possible covariate in the multivariable analysis although in backward selection was not chosen in the best model and therefore not included.
Since the initial release of the staging guidelines, there have been several errata addressing this cohort in particular. Lydiatt et al11 recently announced the most recent iteration of the T classification. Several important changes were made, most notably, tumors that are > 4 cm in size AND > 10 mm in DOI are upstaged to T4a. In our cohort, this reclassifies 31 patients to T4a8th categorization who were previously downstaged in the earlier versions of the guidelines. We further investigated this by comparing DOI in non-bone invasion patients and found that there is no difference in DOI between 7th edition and the newest 8th edition staging suggesting that DOI alone may not be a comprehensive marker for stage (Supplemental figure 3). This classification fails to capture narrow deep/burrowing tumors. We evaluated the distribution of EMI only tumors based on size and DOI and found that while most of the EMI patients fall in the newest definition of T4a8th (red box in supplemental figure 4), there remain a large number of “small, deep tumors” that would now be considered pT3 (blue box in supplemental figure 4). Based on this distribution and the fact that DOI is inherently correlated with EMI, this further supports that even the newest iteration of AJCC 8th does not fully capture these high risk burrowing tumors. Regardless, the data supporting the rationale for this change remains limited.8–10 The final rationale for these changes likely relates to the principles of the 7th edition which recognized EMI as a negative prognostic indicator but attempts to provide a more objective way of classifying these patients. Understanding the true impact of EMI and utilizing it in staging may offer a better dichotomization; however a larger cohort of patients will be needed to validate this hypothesis.
There are several limitations to this study. Namely, the study is not powered to prove non-inferiority of EMI when compared to bone invasion alone. However, this would require a cohort larger than that used to develop the 8th edition staging guidelines and likely will never be practically achievable. Additionally, this was a retrospective study in a prospectively collected registry that is dependent on accurate documentation as well as inherent institutional selection bias. Correct categorization of patients was dependent on available data. For instance, there were patients with no preoperative imaging available or a discrepancy between radiographic and clinical data. In these instances, the operative report description was used as surrogate data. This encompassed a small number of patients (n=9) and a margin of error would not likely effect the outcomes. Imperfect categorization also applies to our bone invasion tumors due to the subjective nature of histopathologic evaluation of bone invasion.12,13 At our institution, a single, head and neck pathologist’s report was utilized to classify these patients and we uniformly referred to these data for our analysis as this is the standard method employed. Moreover, staging schema apply to populations, rather than individual risk calculators that may more adroitly predict outcomes for specific patients.14
CONCLUSION
EMI and bone invasion are not independent prognostic indicators of survival in oral cavity cancer, but have effectively been dichotomized into different T classifications by the AJCC 8th edition guidelines. Patients with both EMI and bone invasion have comparatively worse oncologic outcomes in a manner insufficiently addressed by the current staging system.
Supplementary Material
Supplemental Figure 3: Depth of Invasion by T Classification. The 8th edition guidelines reflect the latest iteration in which pT4a tumors are defined as > 4 cm in size AND > 10 mm in depth.
Supplemental Figure 4: Tumor size versus Depth of Invasion in EMI only Patients. The 8th edition guidelines reflect the latest iteration in which pT4a tumors are defined as > 4 cm in size AND > 10 mm in depth.
Key: Red box = pT4a8th; Green box = pT1/28th; Blue box = pT38th
Research Highlights.
Extrinsic muscle invasion and bone invasion are not independent predictors of survival in oral cavity cancer, but have effectively been dichotomized into different T classifications by the AJCC 8th edition.
Patients with both EMI and bone invasion have comparatively worse oncologic outcomes in a manner not reflected in the current staging system.
Acknowledgments
Funding Source: NIH/NCI grant K08 17-PAF07511 and UM MICHR 1KL2TR002241
Footnotes
Presentation: This study was presented at Combined Otolaryngology Section Meeting 2018, Baltimore, Maryland.
Financial Disclosures: None
Conflicts of Interest: None
Publisher's Disclaimer: This is a PDF file of an unedited manuscript that has been accepted for publication. As a service to our customers we are providing this early version of the manuscript. The manuscript will undergo copyediting, typesetting, and review of the resulting proof before it is published in its final form. Please note that during the production process errors may be discovered which could affect the content, and all legal disclaimers that apply to the journal pertain.
REFERENCE
- 1.Lydiatt WM, Patel SG, O’Sullivan B et al. Head and Neck cancers-major changes in the American Joint Committee on cancer eighth edition cancer staging manual. CA: a cancer journal for clinicians 2017; 67:122–137. [DOI] [PubMed] [Google Scholar]
- 2.Liao CT, Lee LY, Hsueh Cet al. Clinical Outcomes in pT4 Tongue Carcinoma are Worse than in pT3 Disease: How Extrinsic Muscle Invasion Should be Considered? Annals of surgical oncology 2017; 24:2570–2579. [DOI] [PubMed] [Google Scholar]
- 3.Murthy SP, Thankappan K, Jayasankaran SCet al. “Deep Extrinsic Muscle Involvement” Is a Fallacy in the American Joint Committee on Cancer’s Seventh Edition of Tumor Staging of Oral Cavity Cancers. Journal of oral and maxillofacial surgery : official journal of the American Association of Oral and Maxillofacial Surgeons 2018; 76:206–212. [DOI] [PubMed] [Google Scholar]
- 4.AJCC cancer staging manual. New York, NY: Springer, 2010. [Google Scholar]
- 5.Boland PW, Pataridis K, Eley KA, Golding SJ, Watt-Smith SR. Automatic upstaging of tongue squamous cell carcinoma with lateral extrinsic muscle involvement is not justified. International journal of oral and maxillofacial surgery 2013; 42:1397–1402. [DOI] [PubMed] [Google Scholar]
- 6.Fried D, Mullins B, Weissler Met al. Prognostic significance of bone invasion for oral cavity squamous cell carcinoma considered T1/T2 by American joint committee on cancer size criteria. Head & neck 2014; 36:776–781. [DOI] [PubMed] [Google Scholar]
- 7.Bullock MJ. Current Challenges in the Staging of Oral Cancer. Head and neck pathology 2019; 13:440–448. [DOI] [PMC free article] [PubMed] [Google Scholar]
- 8.Matos LL, Dedivitis RA, Kulcsar MAV, de Mello ES, Alves VAF, Cernea CR. External validation of the AJCC Cancer Staging Manual, 8th edition, in an independent cohort of oral cancer patients. Oral oncology 2017; 71:47–53. [DOI] [PubMed] [Google Scholar]
- 9.Cramer JD, Reddy A, Ferris RL, Duvvuri U, Samant S. Comparison of the seventh and eighth edition american joint committee on cancer oral cavity staging systems. The Laryngoscope 2018; 128:2351–2360. [DOI] [PubMed] [Google Scholar]
- 10.Lee NCJ, Eskander A, Park HS, Mehra S, Burtness BA, Husain Z. Pathologic staging changes in oral cavity squamous cell carcinoma: Stage migration and implications for adjuvant treatment. Cancer 2019; 125:2975–2983. [DOI] [PubMed] [Google Scholar]
- 11.Lydiatt W The effect of depth of invasion on node negative tongue cancer staging. Head & neck 2019; 41:3464–3465. [DOI] [PubMed] [Google Scholar]
- 12.Ebrahimi A, Murali R, Gao K, Elliott MS, Clark JR. The prognostic and staging implications of bone invasion in oral squamous cell carcinoma. Cancer 2011; 117:4460–4467. [DOI] [PubMed] [Google Scholar]
- 13.Namin AW, Zitsch RP 3rd, Layfield LJ. Variability in pathologic interpretation of mandibular invasion. The Laryngoscope 2019. [DOI] [PubMed]
- 14.Prince V, Bellile EL, Sun Y et al. Individualized risk prediction of outcomes for oral cavity cancer patients. Oral oncology 2016; 63:66–73. [DOI] [PMC free article] [PubMed] [Google Scholar]
Associated Data
This section collects any data citations, data availability statements, or supplementary materials included in this article.
Supplementary Materials
Supplemental Figure 3: Depth of Invasion by T Classification. The 8th edition guidelines reflect the latest iteration in which pT4a tumors are defined as > 4 cm in size AND > 10 mm in depth.
Supplemental Figure 4: Tumor size versus Depth of Invasion in EMI only Patients. The 8th edition guidelines reflect the latest iteration in which pT4a tumors are defined as > 4 cm in size AND > 10 mm in depth.
Key: Red box = pT4a8th; Green box = pT1/28th; Blue box = pT38th