

Abstract
Depression is a leading mental health concern across the U.S. and worldwide. There are myriad assessments to evaluate depressive symptoms, including the Edinburgh Postnatal Depression Scale (EPDS), which is widely used to evaluate women’s pre- and postnatal depression but not as prevalent at other timepoints in adulthood, limiting its utility for longitudinal research. As part of the National Institutes of Health’s (NIH) Environmental influences on Child Health Outcomes (ECHO) Research Program, the current study sought to develop a common metric so that scores on the EPDS can be converted to the standardized Patient-Reported Measurement Information System (PROMIS®) T-score metric. Drawing on data from the ECHO—Prenatal Alcohol in SIDS and Stillbirth cohort, this study used a single-group linking design, where 1,263 mothers completed the EPDS and PROMIS-Depression measures at the same time. Score linking was conducted using equipercentile and item response theory (IRT) methods. Results showed both linking methods provide robust, congruent results, and subgroup invariance held across age, race, ethnicity, education, and geographic location. The IRT-based unidimensional fixed-parameter calibration was selected due to its model simplicity, and a crosswalk table was established to convert scores from the EPDS to PROMIS T-scores. Overall, this study provides a way to aggregate data across various depression measures and timepoints, such that researchers and clinicians now have the ability to directly compare and combine EPDS data with PROMIS and other depression measures already score-linked to PROMIS.
Keywords: depression, pregnancy and postpartum, item response theory (IRT), ECHO, PROMIS
Depression affects more than 264 million people worldwide (James et al., 2018), including 17.3 million Americans who experienced at least one major depressive episode in the past 12 months, with higher rates for women (National Institute of Mental Health [NIMH], 2017). The U.S. Preventative Services Task Force recommends primary care settings conduct routine depression screenings for adults, including pregnant and postpartum women (Siu et al., 2016). Numerous adult depression measures and lack of standardization across assessments, however, poses a significant challenge. While the assessments evaluate the same latent trait of depression or depressive symptoms, they do not express severity on a common, standard metric, making it difficult to compare scores across studies and time. Such a challenge is amplified in large research consortia, such as the National Institutes of Health’s (NIH) Environmental influences on Child Health outcomes (ECHO) Research Program. With 69 existing longitudinal pediatric cohorts, ECHO has large amounts of extant data collected using various instruments and requiring harmonization to be usable in analyses, including 10 different measures of adult depression. Having the ability to “link” across measures to a common metric enables direct comparison and consolidation of data, particularly for large research consortia like ECHO in addition to health systems that have other depression measures already in use.
The NIH Patient-Reported Outcomes Measurement Information System (PROMIS®) offers a common metric—the PROMIS standard T-score metric [mean = 50, standard deviation (SD) = 10]—that is referenced to the general U.S. population (Liu et al., 2010). Developed to help standardize patient-reported outcome (PRO) assessments, PROMIS employs a rigorous mixed-methods approach including input from content experts, clinicians, and patients as well as utilizes item response theory (IRT) to enable brief and efficient assessments that are feasible to implement and appropriate for use across the general population (Cella et al., 2007, 2010). PROMIS Depression (PROMIS-D) in particular is currently a recommended Level-2 Cross-Cutting Symptom emerging measure in the Diagnostic and Statistical Manual of Mental Disorders-5 (DSM-5; American Psychiatric Association [APA], 2013) and has already shown robust linking capabilities to many popular depression measures, including the Adult Self Report (ASR)—Achenbach System (Rescorla & Achenbach, 2004); Beck Depression Inventory—II (BDI-II; Beck et al., 1996); Brief Symptom Inventory (BSI; Derogatis, 1993); Center for Epidemiological Studies—Depression (CES-D; Radloff, 1977); and PHQ-9 (Choi et al., 2014; Kaat et al., 2017; Kroenke et al., 2001).
As part of the ECHO data harmonization efforts, the current study aimed to link PROMIS-D with the Edinburgh Postnatal Depression Scale (EPDS; Cox & Holden, 2003; Cox et al., 1987, 1996), a widely used measure of perinatal depression. Though PROMIS-D is not specifically a measure of postpartum depression, it has successfully been used in postnatal populations and has been shown to be highly correlated with the EPDS (Thomas & Spieker, 2016). Additionally, the National Committee for Quality Assurance (NCQA) includes both the EPDS and PROMIS-D, along with other general depression measures, in its Healthcare Effectiveness Data and Information Set (HEDIS®) recommendations for general depression screening and follow-up in adult populations, suggesting face validity of the EPDS measuring the same latent construct as PROMIS-D. Furthermore, developing a link between a measure designed for postnatal mothers with a more general measure of depression is particularly useful for any multi-cohort study such as ECHO in which depression is measured with one or the other instrument, as well as for evaluating lifespan coherence as depression may persist after the perinatal time period. As such, developing a link between PROMIS-D and the EPDS can enable clinicians and researchers to cohesively evaluate depression across the lifespan.
Methods
Data for this study were collected as part of the NIH ECHO Research Program, a national research consortium comprised of 69 existing longitudinal pediatric cohorts across 44 U.S. states and Puerto Rico (Gillman & Blaisdell, 2018). The ECHO Person-Reported Outcome (PRO) Core collaborated with the ECHO-Prenatal Alcohol in SIDS and Stillbirth (ECHO-PASS) Northern Plains cohort to co-administer PROMIS-D and the EPDS in June and July 2018. Both Institutional Review Boards approved data collection and sharing.
Participants
For the current study, all ECHO-PASS mothers (n = 1,561) were eligible to participate. Originally recruited during pregnancy between 2007 and 2015, participants represent rural and American Indian/Alaska Native populations in the Northern Plains, with documented high prenatal exposure to alcohol, tobacco, and other drugs. A total of 1,263 women (mean age = 35 years; SD = 5.2; range = 20–55), with children ages 2–11 years old participated. The majority of women were White (87%), 12% were American Indian/Alaska Native, and 2% other race, and 3% identified as Hispanic. Approximately half of the participants had a bachelor’s (36%) or postgraduate/professional degree (18%), 13% had an associate degree, and the remaining 23% had a high school degree or less (Table 1).
Table 1.
Participant Sample Demographic Characteristics
| Variable | n | % |
|---|---|---|
| Ethnicity | ||
| Hispanic | 37 | 2.9 |
| Non-Hispanic | 1226 | 97.1 |
| Race | ||
| American Indian/Alaska Native | 146 | 11.6 |
| White | 1095 | 86.7 |
| Other | 22 | 1.7 |
| Educational attainment | ||
| Less than a high school diploma or GED | 32 | 2.5 |
| High school diploma/or equivalent | 82 | 6.5 |
| Some college but no degree | 175 | 13.9 |
| Associate’s degree | 165 | 13.1 |
| Bachelor’s degree (e.g., BA, BS) | 456 | 36.1 |
| Post graduate degree (e.g., master’s or doctoral) | 223 | 17.7 |
| Study site | ||
| Sioux Falls | 981 | 77.7 |
| Rapid City | 282 | 22.3 |
Measures
PROMIS-D evaluates an individual’s negative mood, self-view, social cognition, and decreased positive affect and engagement over the past 7 days (Cella et al., 2010). The full item bank includes 28 items, and in this study, participants completed the PROMIS® Item Bank v1.0—Emotional Distress—Depression–Short Form 8a. This measure has eight items and uses a 5-point Likert response scale anchored by Never and Always. Higher scores represent higher levels of depressive symptoms. Though linking to the full item bank might improve linking accuracy, we used the short form based on the need to limit participant burden. The short form is highly correlated (r = 0.96) with the full form, and the test scores have excellent reliability (α = .95, item-total correlation = 0.83) and convergent validity (r = 0.83 with the CES-D; Cella et al., 2010; Pilkonis et al., 2011, 2014). Clinical validation is also well-established with such conditions as major depressive disorder, back pain, chronic obstructive pulmonary disease, chronic heart failure, multiple sclerosis, osteoarthritis, and various cancers (Amtmann et al., 2018; Cook et al., 2016; Schalet et al., 2016; Stone et al., 2016).
EPDS assesses an individual’s depression and anxiety symptoms over the past 7 days, including negative mood, decreased positive affect and engagement, suicidal ideation, fearfulness, anxious misery, and feeling overwhelmed (Cox & Holden, 2003; Cox et al., 1987, 1996). This 10-item measure uses 4-point Likert response scales with anchors representing a lack of item endorsement (e.g., Not at all; Never) and a high level of item endorsement (e.g., Yes, very often; Yes, most of the time). A raw score of 10 indicates moderate levels of depression and a score of 13 or higher represents “probable depression,” with diagnostic follow-up recommended. A recent review of studies using the EPDS showed sufficient sensitivity and specificity at both cutoffs, though slightly higher for scores of 13 and above (O’Connor et al., 2016). The EPDS was developed for evaluating postpartum depression and remains a tool for evaluating maternal depression in the perinatal time period. However, its use often continues in longitudinal studies well past the perinatal period such as in the data we report. Further, it has been validated in mothers of children older than 12 months (Cox et al., 1996), as well as in samples of fathers (Matthey et al., 2001).
Demographics included age (in years), race (American Indian/Alaska Native, White, Other/Unknown), ethnicity (Hispanic/Non-Hispanic), maternal education (less than a high school diploma or GED; high school diploma/or equivalent; some college but no degree; associate degree; bachelor’s degree; postgraduate degree), and study site (Sioux Falls or Rapid City).
Score-Linking Methodology
In the current study, we consider several different linking procedures, including IRT-based approaches and equipercentile linking (Dorans, 2007; Kolen & Brennan, 2014), and consider the strengths and weaknesses of each approach. The IRT-based fixed-parameter calibration method calibrates the legacy measure (in this case, the EPDS) and the anchor measure (in this case, PROMIS-D) at the same time with fixed item parameters extracted from the anchor measure’s existing calibrated item bank. By doing so, the item parameters of the legacy measure are then calibrated on the same metric as the anchor measure.
The IRT-based Stocking-Lord separate-parameter calibration method (Stocking & Lord, 1983) requires a computation of additive and multiplicative transformation constants for item parameters. Free from the constraints that may be imposed by the fixed-parameter calibration, the Stocking-Lord method freely calibrates the item parameters of the two measures at the same time. The multiplicative and additive constants are then computed based on the discrepancy between the newly calibrated and existing calibrated item parameters of the anchor measure. Using these constants, the item parameters of legacy measure can be linked to the metric of the anchor measure.
Based on the item parameters of the legacy measure that have been linked onto the metric of anchor measure using the above IRT-based linking approaches, we can then score participants’ item responses and create the crosswalk table to convert each possible raw score of the legacy measure to the anchor measure. If the linked item parameters of the two methods largely differ from each other, Stocking—Lord method is preferred. Otherwise, fixed-parameter calibration can be used.
A third and newer IRT-based method, calibrated projection, is usually applied when the constructs measured by the two scales are not exactly the same (Thissen et al., 2011). In this approach, a two-dimensional IRT model is fit to the two measures concurrently, with items of the legacy measure loaded on one dimension and those of the anchor measure loaded on the other dimension. Then the variance-covariance matrix of the two traits, estimated item parameters, and item responses of the legacy measure are used to compute the scale score of the anchor measure corresponding to each summed raw score of the legacy measure.
Alternatively, the equipercentile approach, a non-IRT linking method, aligns percentile ranks with the score distributions to establish a nonlinear linking relationship. To minimize the impact of random sampling error, smoothing the score distribution can be used.
Analytical Plan
This study uses a single group design, in which the two measures were administered to all participants at the same time, and a multimethod approach (Choi et al., 2014; Kaat et al., 2017; Lai et al., 2014; Schalet et al., 2014) by comparing the IRT-based linking and the non-IRT equipercentile methods described above. The former methods use individual items as the basis for the linking analysis, while the latter rely on scale scores. For all the IRT-related methods, the graded response model (GRM) was used (Samejima, 2010). All the linking analyses were implemented using the PROsetta R package (Choi & Lim, 2020), with the exception of multidimensional IRT (MIRT) parameter estimates and scaled score computation for the calibrated projection approach, which were conducted with flexMIRT software (Cai, 2017).
Linking Assumptions
We investigated all linking assumptions using the psych package in R (Revelle, 2019). First, to verify the similar content assumption, we qualitatively examined the item content of each measure. To further quantitatively verify the construct validity of the test scores of the combined scale, we computed Cronbach’s alpha and item-total correlations for the combined scale. Second, we calculated the correlation between the raw scores of the two measures to determine whether they were highly correlated. Third, confirmatory factor analysis (CFA) and bi-factor exploratory factor analysis (bEFA) were used to assess the unidimensionality of the combined scale (i.e., EPDS and PROMIS-D). The fit statistics of the CFA model were used to evaluate the combined scale’s relative unidimensionality. We considered the following adequate model fit criteria: RMSEA ≤ 0.08, CFI ≥ 0.95, TLI ≥ 0.95 (Browne & Cudeck, 1992; Hancock et al., 2010; Hu & Bentler, 1999). An Omega Hierarchical (OmegaH) statistic (McDonald, 1999; Zinbarg et al., 2005) higher than 0.75 (Reise et al., 2013) speaks to the unidimensionality of the combined scale. Fourth, we conducted the subgroup invariance analysis, which verifies whether the linking relationship between the two measures is common across groups. We conducted a linking analysis for each subgroup and evaluated if linking functions were the same across groups by computing the standardized Root Expected Mean Square Difference (REMSD; Kolen & Brennan, 2014) for age (20–35 and 36–55), ethnicity (Hispanic and Not Hispanic), race (American Indian/Alaska Native and White; “other” was excluded from this analysis due to small sample) and study site (Sioux Falls and Rapid City). We considered values less than 8% as cutoff criterion for subgroup invariance in the linking function (Dorans & Holland, 2000). Finally, to check the local dependence assumption of IRT, we considered absolute Yen’s Q3 larger than 0.2 as a criterion to flag potentially local dependent item pairs (Yen, 1984).
Comparison of Linking Accuracy Across Methods
We evaluated linking accuracy by comparing the linked scores computed by each method with the actual score for each participant based on Pearson product-moment correlations and the mean and SD of score differences. To graphically illustrate the differences, we constructed a Bland—Altman plot (Bland & Altman, 1986, 1999) with a linear regression line for each method to demonstrate the variations from low to high scores and evaluate whether there was an indication of bias along the score range.
Results
We found substantial overlap in the item content of the two measures. Although the EPDS asks about sleep problems, harming oneself, and anxiety that are not on PROMIS-D, both measures include items related to negative mood and decreased positive affect and engagement. The EPDS also uses both positively and negatively valenced items while PROMIS-D only uses the latter.
The Cronbach’s alpha for the combined scale was 0.95, and the range of item-total correlation was between .52 and .84, supporting the construct validity of the test scores of the combined scale. The Pearson’s correlation between the raw scores of the two measures had a value of 0.81, suggesting a high correlation between the two measures. Regarding unidimensionality, we fit a single factor CFA to the combined scale, observing good model fit (RMSEA = 0.075, CFI = 0.995, TLI = 0.994, OmegaH = 0.85), suggesting sufficient unidimensionality of the combined scale.
REMSD values evaluating subgroup invariance in the linking function were 10.3% for age groups, 3.32% for ethnic groups, 3.54% for racial groups, and 2.51% for study sites. The REMSD value for age differences was slightly higher than the criterion (8%) but not considered to have significant impact on the score linking based on evidence that small deviations tend to be inconsequential and can thus requirements can be relaxed on a case by case basis (Choi et al., 2014; Dorans & Holland, 2000). Thus, the population invariance assumption was met for the linking analysis.
After computing local dependence statistics for each item pair in the combined scale, we found six item pairs that showed potential local dependence. To evaluate the impact of the local dependence on the linking results, we removed locally dependent item pairs between the two instruments and ran the linking analysis with items that were free of local dependencies between instruments. The resulting discrimination parameters were similar to the values obtained for full instrument linking. The average difference was 0.07 (range 0.01–0.18). These results suggest that, although the violation of local independence was detected, it would have little impact on linking results. We also applied the equipercentile approach in the linking analysis as a validation for the IRT results.
Figure 1 shows the test information curves of the combined scale, the EPDS and PROMIS-D, respectively. Results indicated that the eight item PROMIS-D scale provided more information (less error) than the 10-item EPDS.
Figure 1. Test Information Function of Each Instrument Using Linked Item Parameters and the Combined Scale.
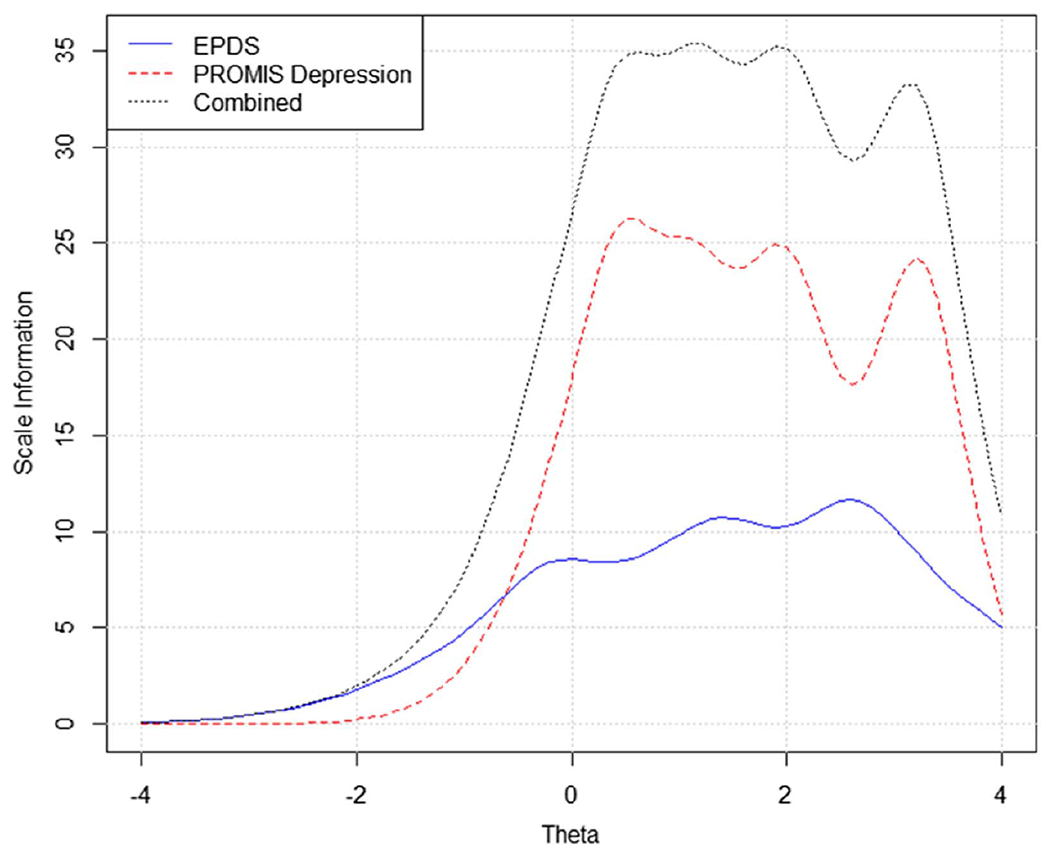
Note. PROMIS Depression = the eight-item PROMIS Depression Short Form 8a; EPDS = Edinburgh Postnatal Depression Scale. See the online article for the color version of this figure.
Table 2 shows the EPDS item parameters estimated by fixed-parameter calibration and the Stocking-Lord methods. Results show the linked item parameters are similar between the two methods, suggesting the test characteristic curves (TCCs) of the separate calibrations are very similar to the TCCs of the fixed calibrations. The linking results of the third IRT-based method—calibrated projection—were also similar, with score differences lower than 1 T-score point reported in the crosswalk table. Given the congruent results across methods, the unidimensional fixed-parameter calibration is reported here, due to its parsimony.
Table 2.
Transformed Item Parameter Estimates for Fixed-Parameter Calibration and Separate Calibration Using Stocking-Lord Method
| Item | Fixed-parameter calibration |
Separate calibration using stocking-lord method |
||||||
|---|---|---|---|---|---|---|---|---|
| Slope | CB1 | CB2 | CB3 | Slope | CB1 | CB2 | CB3 | |
| 1 | 2.66 | 0.99 | 2.27 | 3.51 | 2.73 | 0.98 | 2.22 | 3.43 |
| 2 | 2.72 | 0.89 | 1.96 | 2.93 | 2.79 | 0.88 | 1.92 | 2.86 |
| 3 | 2.09 | −1.23 | 0.18 | 1.85 | 2.18 | −1.14 | 0.20 | 1.79 |
| 4 | 2.22 | −0.92 | 0.08 | 1.77 | 2.31 | −0.84 | 0.10 | 1.72 |
| 5 | 2.24 | −0.27 | 0.69 | 2.10 | 2.33 | −0.22 | 0.68 | 2.04 |
| 6 | 2.67 | −0.66 | 0.68 | 2.28 | 2.79 | −0.59 | 0.67 | 2.21 |
| 7 | 2.59 | 0.17 | 1.09 | 2.15 | 2.70 | 0.19 | 1.07 | 2.09 |
| 8 | 4.15 | −0.16 | 1.15 | 2.12 | 4.33 | −0.12 | 1.12 | 2.07 |
| 9 | 2.65 | 0.20 | 1.83 | 2.70 | 2.77 | 0.21 | 1.78 | 2.62 |
| 10 | 2.67 | 1.31 | 2.00 | 3.07 | 2.75 | 1.28 | 1.96 | 2.99 |
Note. CB = category boundary.
Figure 2 shows a comparison of the equipercentile functions with post-smoothing values of 0 (non-smoothing) and log-linear smoothing (medium smoothing) and the IRT linked scores based on the crosswalk and the IRT parameters for each pair of the EPDS raw summed score and its linked PROMIS-D scale score. The scores computed from each method are visually indistinguishable except for some low score values.
Figure 2. IRT Crosswalk-Linking Function (Based on Fixed-Parameter Calibration) and Equipercentile Functions With Different Levels of Smoothing.
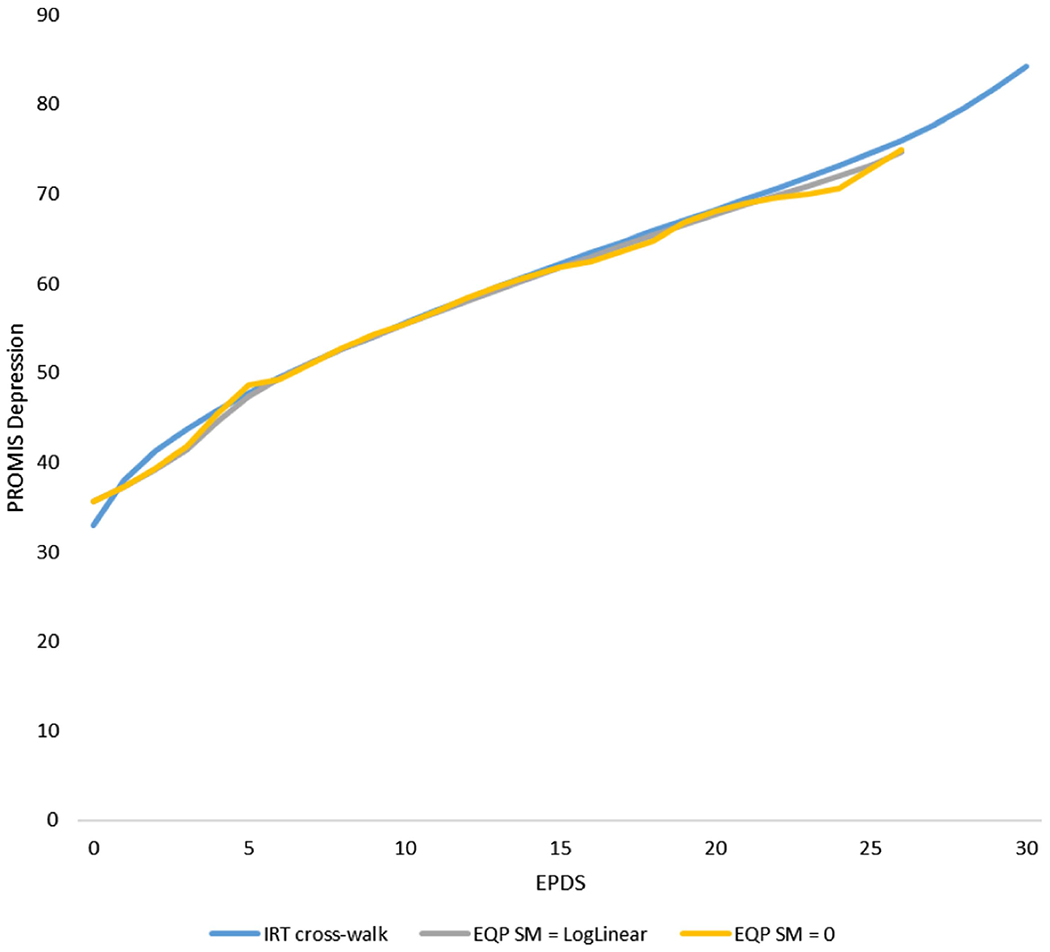
Note. PROMIS Depression = the eight-item PROMIS Depression Short Form 8a; EPDS = Edinburgh Postnatal Depression Scale; EQP = equipercentile; SM = postsmoothing. See the online article for the color version of this figure.
To further compare methods, we computed the mean and SD of the differences between the linked T-scores derived from each method and the actual T-scores (Table 3). For the fixed-parameter calibration method, we applied two scoring approaches: IRT pattern scoring and IRT crosswalk scoring. The scoring of both approaches was based on expected a posteriori (EAP) estimation. For the IRT pattern scoring, scores were calculated based on item parameters and item responses. For the IRT crosswalk scoring, the Lord and Wingersky recursive algorithm (Lord & Wingersky, 1984) was used to assign item responses that belong to the same summed score into the same linked scale score and eventually generate the crosswalk table. As demonstrated in Table 3, the correlations between the linked T-score and the true T-score were high across all four approaches, and the means and the SDs of differences were similar. In general, the linked scores of all four methods had small biases when compared with the actual scores.
Table 3.
Correlations, Mean Differences, and Standard Deviations of Actual Versus Linked PROMIS Depression T-Scores
| Linking method | Correlation | Mean difference | SD of differences |
|---|---|---|---|
| IRT pattern scoring | 0.80 | −0.31 | 5.24 |
| IRT crosswalk scoring | 0.79 | −0.27 | 5.35 |
| EQP_loglinear | 0.80 | 0.22 | 5.29 |
| EQP_none | 0.80 | 0.01 | 5.31 |
Note. EQP = equipercentile.
Figure 3 shows the Bland—Altman plots for the IRT pattern scoring and the IRT crosswalk scoring, which display the difference between the actual PROMIS T-score and the T-score derived from each method. We plotted and regressed the difference against the average of the two T-scores and included the 95% confidence interval band of the difference. The linear regression lines of the two methods showed a horizontal trend, suggesting little bias was found between the actual score and the linked scores estimated by the two methods.
Figure 3. Bland—Altman Plot for the IRT Pattern Scoring Approach and the IRT Crosswalk Scoring Approach.
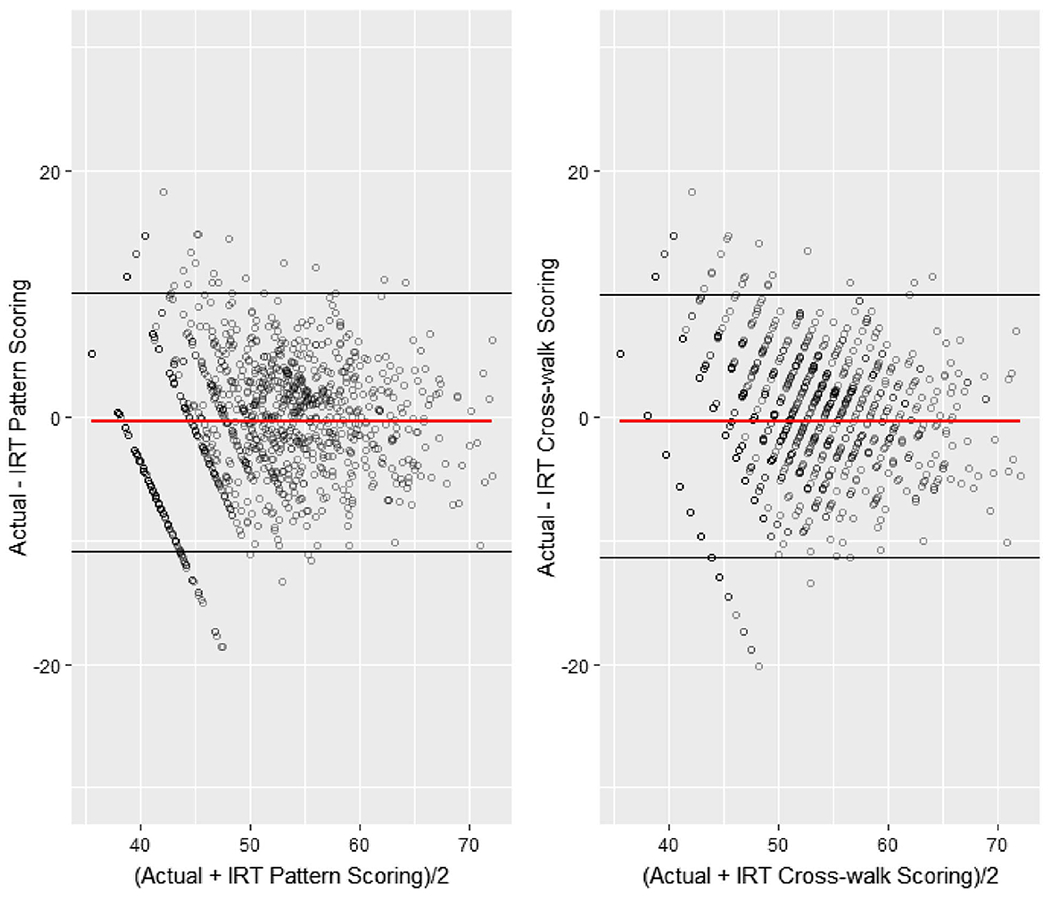
Note. See the online article for the color version of this figure.
The crosswalk table (Table 4) constructed based on the Lord and Wingersky recursive algorithm for EAP summed scoring can be used to map each raw summed score from the EPDS to the corresponding T-score values on the PROMIS-D metric. The corresponding T-score of the PROMIS-D scale for the EPDS clinical threshold of a raw score of 13 is 59.7.
Table 4.
Raw Score to T-Score Conversion Table (IRT Fixed-Parameter Calibration Linking) for EPDS to PROMIS Depression
| EPDS score | PROMIS-D T-score | T-score SE |
|---|---|---|
| 0 | 33.0 | 5.5 |
| 1 | 38.1 | 4.3 |
| 2 | 41.2 | 3.8 |
| 3 | 43.7 | 3.4 |
| 4 | 45.9 | 3.1 |
| 5 | 47.8 | 3.0 |
| 6 | 49.5 | 2.9 |
| 7 | 51.2 | 2.8 |
| 8 | 52.7 | 2.7 |
| 9 | 54.1 | 2.7 |
| 10 | 55.6 | 2.6 |
| 11 | 57.0 | 2.6 |
| 12 | 58.3 | 2.5 |
| 13 | 59.7 | 2.5 |
| 14 | 61.0 | 2.5 |
| 15 | 62.2 | 2.5 |
| 16 | 63.5 | 2.4 |
| 17 | 64.7 | 2.4 |
| 18 | 65.9 | 2.4 |
| 19 | 67.1 | 2.4 |
| 20 | 68.2 | 2.4 |
| 21 | 69.4 | 2.4 |
| 22 | 70.7 | 2.4 |
| 23 | 71.9 | 2.4 |
| 24 | 73.2 | 2.4 |
| 25 | 74.5 | 2.5 |
| 26 | 76.0 | 2.6 |
| 27 | 77.6 | 2.8 |
| 28 | 79.5 | 3.0 |
| 29 | 81.8 | 3.2 |
| 30 | 84.3 | 3.1 |
Discussion
The linking between the EPDS and the PROMIS-D scale met the conceptual and statistical assumptions for the linking analysis and IRT modeling. Drawing on best practices for score-linking (Dorans, 2007), we used a single-group design where participants were co-administered both instruments at the same time and evaluated both IRT-based and equipercentile linking methods to empirically test which method provided the most robust results that minimized differences between observed and linked scores. Results favored the IRT-based fixed-parameter calibration method, which we used to generate a crosswalk table (Table 4) that can be used to convert EPDS scores to PROMIS-D scores. Users of the PROMIS-D can now use T-scores above 59.7 in the same way the EPDS uses a raw score of 13 as a clinical indicator of depression. Impressively, such results align with at least five other depression measures linked with PROMIS-D, suggesting a PROMIS T-score of approximately 60 appears to be a clinically relevant cut score for adult depression.
PROMIS-D was validated with a nationally normed reference sample, and while not specific to the postnatal time period, the measure has successfully been used in postnatal populations and has been shown to be highly correlated with the EPDS. The current study replicated such high correlations and suggests the two measures, no matter how differently they may seem to be targeted, are measuring the similar latent trait, which we are calling depression, or depressive symptoms. Testing the assumptions underlying the linking exercise helped confirm this empirically.
The utility of linking the EPDS to a common metric cannot be understated. The American College of Obstetricians and Gynecologists recommends using the EPDS with pregnant and postpartum women because it is brief; includes anxiety symptoms, which are prominent in perinatal mood disorders; and excludes items on changes in sleep patterns, which are common side effects of the perinatal time period and thus not sensitive to distinguishing between normative symptoms and depressive symptoms (American College of Obstetricians and Gynecologists, 2018). Thus, many clinicians and researchers will likely continue implementing the EPDS, particularly during and shortly following pregnancy. However, outside of that time period, the EPDS is not necessarily the first choice to evaluate adult depression. Given recommendations for on-going depression screening, the crosswalk table developed in this study enables clinicians and researchers to directly compare and combine data from the EPDS and depression measures used outside the perinatal timeframe using the common metric of the PROMIS T-score. Findings can thus be leveraged for longitudinal patient follow-up where the EPDS was administered in the perinatal life stage, but a different tool was used in subsequent visits.
Such work is also critical for large-scale epidemiological research, where desire for measurement consistency is not necessarily feasible or simply does not exist, as is the case with ECHO. We identified 10 different self-report measures of adult depression in the existing ECHO data, including PROMIS and the EPDS, the latter of which had the highest frequency of use (39% of the 69 ECHO cohorts). The current study enables ECHO and other large consortia to leverage existing EPDS data and combine it with data from nine other depression instruments using the shared PROMIS T-score metric. Indeed, ECHO PASS cohort participants represented here completed the EPDS in the postpartum period, and in order to compare levels of depression over time, investigators wanted to use a comparable measure that could be sufficiently harmonized with the EPDS. Such methods can now be used across research projects and consortia, thus enabling standardization without requiring all entities to use the same depression measure.
This study had some limitations. First, we did not use a nationally representative sample of the U.S. population—participants were mothers, and the sample was predominately white. Also, we found a small difference in the linking functions between age groups (i.e., 20–35 and 36–55). However, we showed no difference in item functioning by age, ethnicity, race, or study site. Importantly, we did not calibrate based on the current sample but rather anchored on PROMIS calibrations, which were developed using a standardized sample (Pilkonis et al., 2011) and centered on the 2000 U.S. Census (Liu et al., 2010). Future research could be conducted with a larger sample to examine the age group differences in the linking relationships between the EPDS and the PROMIS-D.
Second, linked scores from legacy measures such as the EPDS may have more error than scores obtained directly from PROMIS-D, particularly in small samples. However, the advantages of having a standard metric and the ability to combine and compare data across these two measures may outweigh the slight reduction in reliability of test scores. For clinical care and large initiatives such as ECHO, the ability to leverage decades of existing data provides sufficient justification for using linked scores.
Finally, the current study used the PROMIS-D short form 8a, not the full 28-item item bank for score-linking. Using the full bank may improve linking accuracy and could be explored in future research to examine how much more accuracy is gained when using the entire item bank. However, not only is the 8-item short form highly correlated with the full form (r > .95; Cella et al., 2019), but linking results from the current study show sufficient accuracy using the short form; because the 8 items are co-calibrated with the other 20 items in the PROMIS-D item bank, conducting score-linking with the short form essentially links the full item bank.
Conclusion
Overall, the current study provides a way to convert scores from the widely-used EPDS to PROMIS-D using the newly-established crosswalk table. Given the high rates of depression—particularly in women and during the perinatal timeframe—as well as the U.S. Preventative Services Task Force recommendations to conduct routine depression screening for all adult patients (Siu et al., 2016), this study offers clinicians and researchers a practical tool to link scores from two popular depression measures often used at different time points across adulthood. As such, this study enables longitudinal follow-up outside of the perinatal time frame without sacrificing the perinatal-specific EPDS measure.
Public Significance Statement.
This study provides a way for researchers and clinicians to combine and compare data from two commonly-used measures of adult depression. Using the crosswalk table generated through this research, scores on the Edinburgh Postnatal Depression Scale can now be converted to the same T-score metric as the Patient-Reported Outcome Measurement System (PROMIS®) Depression measure.
Acknowledgments
Research reported in this publication was supported by the Environmental influences on Child Health Outcomes (ECHO) program, Office of The Director, National Institutes of Health, under Award Numbers U2COD023375 (Coordinating Center), U24OD023382 (Data Analysis Center), U24OD023319 with co-funding from the Office of Behavioral and Social Sciences Research (OBSSR; Person Reported Outcomes Core, Courtney K. Blackwell, Xiaodan Tang, Richard Gershon, Benjamin D. Schalet, David Cella) and UH3OD023279 (Amy J. Elliott, Tracy Thomes, Hannah Louwagie). The content is solely the responsibility of the authors and does not necessarily represent the official views of the National Institutes of Health.
The authors wish to thank our ECHO colleagues, the medical, nursing, and program staff, as well as the children and families participating in the ECHO cohorts. We also acknowledge the contribution of the following ECHO program collaborators: ECHO Coordinating Center: Duke Clinical Research Institute, Durham, North Carolina: Phillip Brian Smith, Laura Kristin Newby, and Daniel Kelly Benjamin.
Footnotes
The authors have no conflicts of interest relevant to this article to disclose.
The authors have no financial relationships relevant to this article to disclose.
References
- American College of Obstetricians and Gynecologists. (2018). Screening for perinatal depression. ACOG Committee Opinion No. 757. Obstetrics and Gynecology, 132, e208–e212. 10.1097/AOG.0000000000002927 [DOI] [PubMed] [Google Scholar]
- American Psychiatric Association. (2013). Diagnostic and statistical manual of mental disorders (5th ed.). [Google Scholar]
- Amtmann D, Bamer AM, Kim J, Chung H, & Salem R (2018). People with multiple sclerosis report significantly worse symptoms and health related quality of life than the US general population as measured by PROMIS and NeuroQoL outcome measures. Disability and Health Journal, 11(1), 99–107. 10.1016/j.dhjo.2017.04.008 [DOI] [PubMed] [Google Scholar]
- Beck AT, Steer RA, & Brown GK (1996). Manual for the beck depression inventory—II. Psychological Corporation. [Google Scholar]
- Bland JM, & Altman DG (1986). Statistical methods for assessing agreement between two methods of clinical measurement. Lancet, 327, 307–310. 10.1016/S0140-6736(86)90837-8 [DOI] [PubMed] [Google Scholar]
- Bland JM, & Altman DG (1999). Measuring agreement in method comparison studies. Statistical Methods in Medical Research, 8, 135–160. 10.1177/096228029900800204 [DOI] [PubMed] [Google Scholar]
- Browne MW, & Cudeck R (1992). Alternative ways of assessing model fit. Sociological Methods & Research, 21(2), 230–258. 10.1177/0049124192021002005 [DOI] [Google Scholar]
- Cai L (2017). flexMIRT version 3.51: Flexible multilevel multidimensional item analysis and test scoring. Vector Psychometric Group. [Google Scholar]
- Cella D, Choi SW, Condon DM, Schalet B, Hays RD, Rothrock NE, Yount S, Cook KF, Gershon RC, Amtmann D, DeWalt DA, Pilkonis PA, Stone AA, Weinfurt K, & Reeve BB (2019). PROMIS® adult health profiles: Efficient short-form measures of seven health domains. Value in Health, 22(5), 537–544. 10.1016/j.jval.2019.02.004 [DOI] [PMC free article] [PubMed] [Google Scholar]
- Cella D, Riley W, Stone AA, Rothrock N, Reeve BB, Yount S, Amtmann D, Bode R, Buysse D, Choi S, Cook K, Devellis R, DeWalt D, Fries JF, Gershon R, Hahn EA, Lai J-S, Pilkonis P, Revicki D, … PROMIS Cooperative Group. (2010). The Patient Reported Outcomes Measurement Information System (PROMIS) developed and tested its first wave of adult self-reported health outcome item banks: 2005–2008. Journal of Clinical Epidemiology, 63, 1179–1194. 10.1016/j.jclinepi.2010.04.011 [DOI] [PMC free article] [PubMed] [Google Scholar]
- Cella D, Yount S, Rothrock N, Gershon R, Cook K, Reeve B, Ader D, Fries JF, Bruce B, Rose M, & on behalf of the PROMIS Cooperative Group. (2007). The Patient-Reported Outcomes Measurement Information System (PROMIS): Progress of an NIH Roadmap Cooperative Group during its first two years. Medical Care, 45(5, Suppl. 1), S3–S11. 10.1097/01.mlr.0000258615.42478.55 [DOI] [PMC free article] [PubMed] [Google Scholar]
- Choi SW, & Lim S (2020). PROsetta: Linking patient-reported outcomes measures. R package version 0.1.4. https://CRAN.R-project.org/package=PROsetta [Google Scholar]
- Choi SW, Schalet B, Cook KF, & Cella D (2014). Establishing a common metric for depressive symptoms: Linking the BDI-II, CES-D, and PHQ-9 to PROMIS depression. Psychological Assessment, 26, 513–527. 10.1037/a0035768 [DOI] [PMC free article] [PubMed] [Google Scholar]
- Cook KF, Jensen SE, Schalet BD, Beaumont JL, Amtmann D, Czajkowski S, Dewalt DA, Fries JF, Pilkonis PA, Reeve B, Stone AA, Weinfurt KP, & Cella D (2016). PROMIS® measures of pain, fatigue, negative affect, physical function and social function demonstrate clinical validity across a range of chronic conditions. Journal of Clinical Epidemiology, 73, 89–102. 10.1016/j.jclinepi.2015.08.038 [DOI] [PMC free article] [PubMed] [Google Scholar]
- Cox JL, Chapman G, Murray D, & Jones PV(1996). Validation of the Edinburgh Postnatal Depression Scale (EPDS) in non-postnatal women. Journal of Affective Disorders, 39(3), 185–189. 10.1016/0165-0327(96)00008-0 [DOI] [PubMed] [Google Scholar]
- Cox JL, & Holden J (2003). Perinatal mental health: A guide to the Edinburgh Postnatal Depression Scale (EPDS). Royal College of Psychiatrists. [Google Scholar]
- Cox JL, Holden JM, & Sagovsky R (1987). Detection of postnatal depression: Development of the 10-item Edinburgh Postnatal Depression Scale. The British Journal of Psychiatry, 150(6), 782–786. 10.1192/bjp.150.6.782 [DOI] [PubMed] [Google Scholar]
- Derogatis LR (1993). The Brief Symptom Inventory: Administration, scoring & procedures manual. National Computer Systems. [Google Scholar]
- Dorans NJ (2007). Linking scores from multiple health outcome instruments. Quality of Life Research: An International Journal of Quality of Life Aspects of Treatment, Care & Rehabilitation, 16, 85–94. 10.1007/s11136-006-9155-3 [DOI] [PubMed] [Google Scholar]
- Dorans NJ, & Holland PW (2000). Population invariance and the equatability of tests: Basic theory and the linear case. Journal of Educational Measurement, 37, 281–306. 10.1111/j.1745-3984.2000.tb01088.x [DOI] [Google Scholar]
- Gillman MW, & Blaisdell CJ (2018). Environmental Influences on Child Health Outcomes, a research program of the National Institutes of Health. Current Opinion in Pediatrics, 30(2), 260–262. 10.1097/MOP.0000000000000600 [DOI] [PMC free article] [PubMed] [Google Scholar]
- Hancock GR, Mueller RO, & Stapleton LM (Eds.) (2010). The reviewer’s guide to quantitative methods in the social sciences. Routledge. 10.4324/9780203861554 [DOI] [Google Scholar]
- Hu L, & Bentler PM (1999). Cutoff criteria for fit indexes in covariance structure analysis: Conventional criteria versus new alternatives. Structural Equation Modeling, 6(1), 1–55. 10.1080/10705519909540118 [DOI] [Google Scholar]
- James SL, Abate D, Abate KH, Abay SM, Abbafati C, Abbasi N, Abbastabar H, Abd-Allah F, Abdela J, Abdelalim A, & Murray CJL (2018). Global, regional, and national incidence, prevalence, and years lived with disability for 354 diseases and injuries for 195 countries and territories, 1990–2017: A systematic analysis for the Global Burden of Disease Study 2017. Lancet, 392(10159), 1789–1858. 10.1016/S0140-6736(18)32279-7 [DOI] [PMC free article] [PubMed] [Google Scholar]
- Kaat AJ, Newcomb ME, Ryan DT, & Mustanski B (2017). Expanding a common metric for depression reporting: Linking two scales to PROMIS® depression. Quality of Life Research: An International Journal of Quality of Life Aspects of Treatment, Care & Rehabilitation, 26(5), 1119–1128. 10.1007/s11136-016-1450-z [DOI] [PMC free article] [PubMed] [Google Scholar]
- Kolen MJ, & Brennan RL (2014). Test equating, scaling, and linking: Methods and practices. Springer Science & Business Media. 10.1007/978-1-4939-0317-7 [DOI] [Google Scholar]
- Kroenke K, Spitzer RL, & Williams JBW (2001). The PHQ-9: Validity of a brief depression severity measure. Journal of General Internal Medicine, 16(9), 606–613. 10.1046/j.1525-1497.2001.016009606.x [DOI] [PMC free article] [PubMed] [Google Scholar]
- Lai JS, Cella D, Yanez B, & Stone A (2014). Linking fatigue measures on a common reporting metric. Journal of Pain and Symptom Management, 48, 639–648. 10.1016/j.jpainsymman.2013.12.236 [DOI] [PMC free article] [PubMed] [Google Scholar]
- Liu H, Cella D, Gershon R, Shen J, Morales LS, Riley W, & Hays RD (2010). Representativeness of the patient-reported outcomes measurement information system Internet panel. Journal of Clinical Epidemiology, 63(11), 1169–1178. 10.1016/j.jclinepi.2009.11.021 [DOI] [PMC free article] [PubMed] [Google Scholar]
- Lord FM, & Wingersky MS (1984). Comparison of IRT true-score and equipercentile observed-score “equatings”. Applied Psychological Measurement, 8, 453–461. 10.1177/014662168400800409 [DOI] [Google Scholar]
- Matthey S, Barnett B, Kavanagh DJ, & Howie P (2001). Validation of the Edinburgh Postnatal Depression Scale for men, and comparison of item endorsement with their partners. Journal of Affective Disorders, 64(2–3), 175–184. 10.1016/S0165-0327(00)00236-6 [DOI] [PubMed] [Google Scholar]
- McDonald RP (1999). Test theory: A unified treatment. Erlbaum. [Google Scholar]
- National Institute of Mental Health. (2017). Center for Behavioral Health Statistics and Quality (CBHSQ), Substance Abuse and Mental Health Services Administration (SAMHSA), U.S. Department of Health and Human Services (HHS), and RTI International. Results from the 2017 National Survey on Drug Use and Health: Detailed Tables. National Institute of Mental Health (NIMH), Substance Abuse and Mental Health Services Administration. [Google Scholar]
- O’Connor E, Rossom RC, Henninger M, Groom HC, & Burda BU (2016). Primary care screening for and treatment of depression in pregnant and postpartum women: Evidence report and systematic review for the US Preventive Services Task Force. JAMA: Journal of the American Medical Association, 315(4), 388–406. 10.1001/jama.2015.18948 [DOI] [PubMed] [Google Scholar]
- Pilkonis PA, Choi SW, Reise SP, Stover AM, Riley WT, & Cella D (2011). Item banks for measuring emotional distress from the Patient-Reported Outcomes Measurement Information System (PROMIS): Depression, anxiety, and anger. Assessment, 18(3), 263–283. 10.1177/1073191111411667 [DOI] [PMC free article] [PubMed] [Google Scholar]
- Pilkonis PA, Yu L, Dodds NE, Johnston KL, Maihoefer CC, & Lawrence SM (2014). Validation of the Depression Item Bank from the Patient-Reported Outcomes Measurement Information System (PROMIS) in a three-month observational study. Journal of Psychiatric Research, 56, 112–119. 10.1016/j.jpsychires.2014.05.010 [DOI] [PMC free article] [PubMed] [Google Scholar]
- Radloff LS (1977). The CES-D scale: A self-report depression scale for research in the general population. Applied Psychological Measurement, 1(3), 385–401. 10.1177/014662167700100306 [DOI] [Google Scholar]
- Reise SP, Bonifay WE, & Haviland MG (2013). Scoring and modeling psychological measures in the presence of multidimensionality. Journal of Personality Assessment, 95, 129–140. 10.1080/00223891.2012.725437 [DOI] [PubMed] [Google Scholar]
- Rescorla LA, & Achenbach TM (2004). The Achenbach System of Empirically Based Assessment (ASEBA) for ages 18 to 90 years. In Maruish ME (Ed.), The use of psychologicaltesting for treatment planning and outcomes assessment (3rd ed., pp. 115–152). Erlbaum. [Google Scholar]
- Revelle W (2019). psych: Procedures for psychological, psychometric, and personality research. R package version 1.9.12. Northwestern University. https://CRAN.R-project.org/package=psych. [Google Scholar]
- Samejima F (2010). The general graded response model. In Nering ML & Ostini R (Eds.), Handbook of polytomous item response theory models (pp. 77–107). Routledge. [Google Scholar]
- Schalet BD, Cook KF, Choi SW, & Cella D (2014). Establishing a common metric for self-reported anxiety: Linking the MASQ, PANAS, and GAD-7 to PROMIS Anxiety. Journal of Anxiety Disorders, 28, 88–96. 10.1016/j.janxdis.2013.11.006 [DOI] [PMC free article] [PubMed] [Google Scholar]
- Schalet BD, Pilkonis PA, Yu L, Dodds N, Johnston KL, Yount S, Riley W, & Cella D (2016). Clinical validity of PROMIS® Depression, Anxiety, and Anger across diverse clinical samples. Journal of Clinical Epidemiology, 73, 119–127. 10.1016/j.jclinepi.2015.08.036 [DOI] [PMC free article] [PubMed] [Google Scholar]
- Siu AL, Bibbins-Domingo K, Grossman DC, Baumann LC, Davidson KW, Ebell M, García FA, Gillman M, Herzstein J, Kemper AR, & Pignone MP (2016). Screening for depression in adults US preventive services task force recommendation statement. JAMA: Journal of the American Medical Association, 315(4), 380–387. 10.1001/jama.2015.18392 [DOI] [PubMed] [Google Scholar]
- Stocking ML, & Lord FM (1983). Developing a common metric in item response theory. Applied Psychological Measurement, 7(2), 201–210. 10.1177/014662168300700208 [DOI] [Google Scholar]
- Stone AA, Broderick JE, Junghaenel DU, Schneider S, & Schwartz JE (2016). PROMIS fatigue, pain intensity, pain interference, pain behavior, physical function, depression, anxiety, and anger scales demonstrate ecological validity. Journal of Clinical Epidemiology, 74, 194–206. 10.1016/j.jclinepi.2015.08.029 [DOI] [PubMed] [Google Scholar]
- Thissen D, Varni JW, Stucky BD, Liu Y, Irwin DE, & Dewalt DA (2011). Using the PedsQL™ 3.0 asthma module to obtain scores comparable with those of the PROMIS pediatric asthma impact scale (PAIS). Quality of Life Research: An International Journal of Quality of Life Aspects of Treatment, Care & Rehabilitation, 20(9), 1497–1505. 10.1007/s11136-011-9874-y [DOI] [PMC free article] [PubMed] [Google Scholar]
- Thomas KA, & Spieker S (2016). Sleep, depression, and fatigue in late postpartum. MCN. The American Journal of Maternal/Child Nursing, 41(2), 104–109. 10.1097/NMC.0000000000000213 [DOI] [PMC free article] [PubMed] [Google Scholar]
- Yen WM (1984). Effects of local item dependence on the fit and equating performance of the three-parameter logistic model. Applied Psychological Measurement, 8, 125–145. 10.1177/014662168400800201 [DOI] [Google Scholar]
- Zinbarg RE, Revelle W, Yovel I, & Li WJP (2005). Cronbach’s α, Revelle’s β, and Mcdonald’s ωH; Their relations with each other and two alternative conceptualizations of reliability. Psychometrika, 70, 123–133. 10.1007/s11336-003-0974-7 [DOI] [Google Scholar]