

Whole-genome sequencing of 1479 clinical Neisseria gonorrhoeae isolates collected in 2018 for the US Gonococcal Isolate Surveillance Project identified the common genomic strains and antimicrobial resistance profiles.
Supplemental digital content is available in the text.
Background
The prevalence of Neisseria gonorrhoeae (GC) isolates with elevated minimum inhibitory concentrations to various antibiotics continues to rise in the United States and globally. Genomic analysis provides a powerful tool for surveillance of circulating strains, antimicrobial resistance determinants, and understanding of transmission through a population.
Methods
Neisseria gonorrhoeae isolates collected from the US Gonococcal Isolate Surveillance Project in 2018 (n = 1479) were sequenced and characterized. Whole-genome sequencing was used to identify sequence types, antimicrobial resistance profiles, and phylogenetic relationships across demographic and geographic populations.
Results
Genetic characterization identified that (1) 80% of the GC isolates were represented in 33 multilocus sequence types, (2) isolates clustered in 23 major phylogenetic clusters with select phenotypic and demographic prevalence, and (3) common antimicrobial resistance determinants associated with low-level or high-level decreased susceptibility or resistance to relevant antibiotics.
Conclusions
Characterization of this 2018 Gonococcal Isolate Surveillance Project genomic data set, which is the largest US whole-genome sequence data set to date, sets the basis for future prospective studies, and establishes a genomic baseline of GC populations for local and national monitoring.
Neisseria gonorrhoeae (GC) is the causative agent of gonorrhea, the second most commonly reported notifiable disease in the United States in 2018 with 583,405 cases reported, a 63% increase since 2014.1 Gonorrhea presents a public health burden worldwide with high prevalence and incidence rates.2 The World Health Organization estimated 87 million new gonorrhea infections worldwide in 2016 and reports that gonorrhea is a major cause of pelvic inflammatory disease and infertility in women.2
Adding to the health burden, drug-resistant GC was classified as an urgent threat in “Antibiotic Resistance Threats in the United States” by the Centers for Disease Control and Prevention (CDC) in 2013 and 2019.3 Since the 1940s, GC has progressively developed resistance mechanisms against every drug of treatment, including penicillin (PEN), tetracycline (TET), ciprofloxacin (CIP), azithromycin (AZM), and cephalosporins (cefixime [CFM], ceftriaxone [CRO]). In 2018, the recommended therapeutic regimen in the United States was a combination of ceftriaxone and azithromycin.4 Increasing prevalence of isolates with reduced azithromycin susceptibility contributed to azithromycin's recent removal from the updated 2020 GC treatment recommendations for uncomplicated gonorrhea.5 Low-level reduced azithromycin susceptibility may be because of the mutations in the genes encoding the MtrCDE multidrug efflux pump and/or its repressor MtrR; high-level resistance results from 23S ribosomal RNA mutations.6,7 Understanding the genetic determinants responsible for elevated minimal inhibitory concentrations (MICs) and the strains carrying them is important for tracking drug-resistant infections and influencing treatment recommendations.
Ceftriaxone-resistant GC has not been a major threat in the United States; however, isolates with reduced susceptibility caused by mosaic penA genes or combinations of other mutations in mtrR, porB, and ponA have been observed recently.7–9 Single-nucleotide polymorphisms (SNPs) in porB may decrease importation of drugs, such as PEN, TET, and cephalosporins, into the cell, thus increasing the MIC; however, this may only occur when other antimicrobial resistance (AMR) markers are present.9,10 Specific variants in gyrA and parC are well known to result in low- to high-level CIP resistance.11 Determinants carried on plasmids include blaTEM, a β-lactamase capable of inactivating PEN, and tetM, which blocks target binding of TET; both cause high-level resistance in GC.12 This list is by no means exhaustive, and multiple mutations may be acquired to build higher levels of resistance and multidrug resistance. There remain yet to be discovered mechanisms of resistance, and the natural competence of GC enables the incorporation of new AMR determinants into the genome through horizontal gene transfer from GC and other Neisseria species.8,13,14 Thus, monitoring of gonococcal strains and AMR markers is crucial and is enhanced by the incorporation of whole-genome sequencing (WGS) into surveillance workflows.
The US Gonococcal Isolate Surveillance Project (GISP) was established in 1986 by the Division of Sexually Transmitted Disease (STD) Prevention at the CDC to expand the capacity of GC surveillance.15 Gonococcal Isolate Surveillance Project collects urethral gonococcal isolates from the first 25 men per month that present with symptomatic urethritis at STD clinics within participating US jurisdictions. These samples are used to assess and monitor GC antimicrobial susceptibility within various geographic regions over time, characterize populations with resistant organisms, and use the data to inform treatment recommendations.7,15 Through the National Strategy to Combat Antibiotic-Resistant Bacteria initiated in 2016, the CDC implemented WGS of the first 5 GC isolates collected through GISP per month per participating jurisdiction, with WGS beginning in 2018 performed through the Antibiotic Resistance (AR) Laboratory Network.16 Whole-genome sequencing of isolates collected within a national sentinel surveillance system established a genomic baseline of GC in the United States to monitor strain prevalence, transmission, and expansion within communities. Whole-genome sequencing is used to survey AMR profiles of strains currently infecting populations and to examine the evolution of newly emerging resistance mechanisms. Previous studies on GISP isolates from 2000 to 2017 found that 23S rRNA, mtr operon, and promoter mutations were responsible for elevated AZM MICs in the United States6,7,14 Here, we document the 2018 GISP molecular data set and present the important sequence types (STs), phylogenetic relationships, and AMR profiles associated with the isolates. This data set represents the greatest number of GISP isolates systematically sequenced in 1 year to date.
METHODS
Isolate Collection
In 2018, GISP collected the first 25 urethral specimens from men with symptomatic urethritis attending each participating STD clinic across 32 jurisdictions. Neisseria gonorrhoeae was isolated and antimicrobial susceptibility testing (AST) was performed by agar dilution methods following GISP protocols16 (https://www.cdc.gov/std/gisp/GISP_eGISP_Protocol_January_2020.pdf). The first 5 specimens per jurisdiction per month (that were viable with completed AST) were selected for WGS, designated as “1st 5” (n = 1479). Isolates were defined as either having elevated MICs to AZM, CFM, and CRO or being resistant to CIP, PEN, and TET based on Clinical and Laboratory Standards Institute (CLSI) susceptibility or resistance breakpoints17 (Table 1). The MIC values considered elevated for CRO and CFM are lower than the CLSI susceptibility breakpoint as GISP attempts to identify developing cephalosporin resistance before widespread circulation in the community.
TABLE 1.
Antibiotic MIC Values for WGS Analysis and CLSI Breakpoints
| Antibiotic | Elevated MIC/Resistant Cutoff, μg/mL* | CLSI Susceptibility Breakpoint, μg/mL† | CLSI Resistance Breakpoint, μg/mL†,‡ |
|---|---|---|---|
| Azithromycin | ≥2.0 | ≤1.0 | |
| Ceftriaxone | ≥0.125 | ≤0.25 | |
| Cefixime | ≥0.25 | ≤0.25 | |
| Ciprofloxacin | ≥1.0 | ≤0.06 | ≥1.0 |
| Penicillin | ≥2.0 | ≤0.06 | ≥2.0 |
| Tetracycline | ≥2.0 | ≤0.25 | ≥2.0 |
*Cutoffs used for analysis in this study.
†Susceptibility and resistance breakpoints set by the CLSI 2020.
‡No resistance breakpoints have been determined for azithromycin, ceftriaxone, or cefixime.
Clinical and Laboratory Standards Institute. Performance standards for AST. 30th ed. Wayne, PA: Clinical and Laboratory Standards Institute; 2020.
Whole-Genome Sequencing
AR Lab Network laboratories performed WGS following GISP guidance (https://www.cdc.gov/std/gisp/GISP_eGISP_Protocol_January_2020.pdf) and PulseNet protocols for DNA extraction, library preparation, and Illumina sequencing (MiSeq V2/V3 chemistry; Illumina, San Diego, CA) (https://www.cdc.gov/pulsenet/pathogens/protocols.html). Sequence data were deposited in National Center for Biotechnology Information Sequence Read Archive (NCBI/SRA, project accession PRJNA317462).
Bioinformatic Analyses
Whole-genome sequencing bioinformatic analyses included the following: (1) preprocessing, assembly, quality assessment (FastQ), contaminant assessment (Kraken v0.10.5), trimming (Cutadapt v1.8.3), assembly (SPAdes Assembler v3.0.9), quality assessment (QUAST v0.4); (2) in silico sequence typing—Multilocus Sequence Typing (MLST v0.3.6), GC multiantigen sequence typing (ngMAST v0.4), and GC sequence typing for antimicrobial resistance (ngSTAR); (3) phylogenetic analysis—whole genome alignment (SNIPPY v4.3.8), recombination detection and filtering (Gubbins v2.3.1), ascertainment-bias corrected (Stamatakis), maximum-likelihood phylogenetic reconstruction (RaxML v8.2.9), cluster identification (Fastbaps v1.0.4), and visualization via Interactive Tree of Life (ITOL). The reference for assembly, mapping, and phylogenetics was GC strain FA19 (GeneBank accession CP012026.1). A custom CDC program, AMR-Profiler and Typing Tool 2.8.3/2.9.2, identified AMR markers from raw sequence reads and assemblies.6 Detailed bioinformatic methods, bioinformatic references, AMR loci, and parameters are provided in Supplemental Methods (http://links.lww.com/OLQ/A682).
Statistical Analyses
Fisher exact test and χ2 test calculated associations between genetic and phenotypic parameters.
RESULTS
In 2018, GISP sites collected and the AR Lab Network performed AST on 5160 isolates from 32 jurisdictions. The first 5 isolates (n = 1501) collected each month per jurisdiction were selected for WGS. Some jurisdictions had less than 60 sequences due to nonavailability of specimens or inability to obtain high-quality sequences. Of these 1501 isolates, 1479 (98.5%) were successfully sequenced and identified as the representative set, “1st 5” (Supplemental File, GISP_2018.xlsx, http://links.lww.com/OLQ/A683). Fifty-one percent (760/1479) of the isolates had elevated MICs to 1 or more antibiotics; 19.7% (291/1479) were resistant to more than 1 antibiotic (Table 2), matching the prevalence of elevated MICs among specimens reported in all of GISP in 2018.1
TABLE 2.
Combinations of Elevated MICs Among GISP Isolates in 2018
| AST (n = 5160) | WGS (n = 1479) | |||
|---|---|---|---|---|
| Antibiotic(s) | Count | Percentage | Count | Percentage |
| Susceptible | 2525 | 48.9 | 719 | 48.6 |
| CIP | 790 | 15.3 | 247 | 16.7 |
| TET | 700 | 13.6 | 187 | 12.6 |
| PEN/CIP | 344 | 6.7 | 92 | 6.2 |
| TET/CIP | 228 | 4.4 | 69 | 4.7 |
| PEN/TET/CIP | 141 | 2.7 | 47 | 3.2 |
| PEN | 129 | 2.5 | 27 | 1.8 |
| TET/AZM | 117 | 2.3 | 31 | 2.1 |
| TET/CIP/AZM | 63 | 1.2 | 21 | 1.4 |
| PEN/TET | 46 | 0.9 | 17 | 1.1 |
| AZM | 26 | 0.5 | 8 | 0.5 |
| CIP/AZM | 20 | 0.4 | 3 | 0.2 |
| PEN/TET/CIP/ESC | 16 | 0.3 | 4 | 0.3 |
| PEN/TET/AZM | 5 | 0.1 | 1 | 0.1 |
| PEN/TET/CIP/AZM | 4 | 0.1 | 2 | 0.1 |
| ESC/CIP | 3 | 0.1 | 3 | 0.2 |
| TET/CIP/ESC | 2 | 0.0 | 1 | 0.1 |
| ESC | 1 | 0.0 | 0 | 0.0 |
Counts for all GISP in 2018 (AST) versus GISP isolates that were sequenced (WGS).
ESC, extended-spectrum cephalosporins (CRO or CFM).
Demographics
The isolates were collected from patients representing a broad range of age, race, sexual orientation, and HIV status. The most common age group was 25 to 29 years (24%). The race distribution was 50% Black, 22% White, and 17% Hispanic. Fifty-eight percent were men who have sex with women (MSW), 32% were men who have sex with men (MSM), 6% were men who have sex with women and men (MSWM) (Table 3, Fig. 3).
TABLE 3.
Patient Demographics Associated With GC Isolates, GISP 2018
| AST (n = 5160) | WGS (n = 1479) | |||
|---|---|---|---|---|
| Count | Percentage | Count | Percentage | |
| Age, y | ||||
| ≤19 | 297 | 6 | 97 | 7 |
| 20–24 | 1041 | 20 | 292 | 20 |
| 25–29 | 1266 | 25 | 352 | 24 |
| 30–34 | 875 | 17 | 247 | 17 |
| 35–39 | 527 | 10 | 153 | 10 |
| 40–44 | 329 | 6 | 106 | 7 |
| 45–49 | 259 | 5 | 69 | 5 |
| 50–54 | 221 | 4 | 78 | 5 |
| 55–59 | 157 | 3 | 35 | 2 |
| 60–64 | 79 | 2 | 17 | 1 |
| ≥65 | 33 | 1 | 16 | 1 |
| Unknown | 76 | 1 | 17 | 1 |
| Sexual orientation | ||||
| MSW | 3110 | 60 | 853 | 58 |
| MSM | 1548 | 30 | 479 | 32 |
| MSMW | 294 | 6 | 91 | 6 |
| Unknown | 208 | 4 | 56 | 4 |
| Ethnicity | ||||
| Black | 2791 | 54 | 741 | 50 |
| White | 1058 | 21 | 318 | 22 |
| Hispanic | 822 | 16 | 252 | 17 |
| Asian | 115 | 2 | 43 | 3 |
| Multiracial | 82 | 2 | 37 | 3 |
| Native Hawaiian | 25 | 0 | 13 | 1 |
| American Indian | 15 | 0 | 9 | 1 |
| Other | 84 | 2 | 18 | 1 |
| Unknown | 168 | 3 | 48 | 3 |
Counts for all GISP in 2018 versus GISP isolates that were sequenced.
Figure 3.
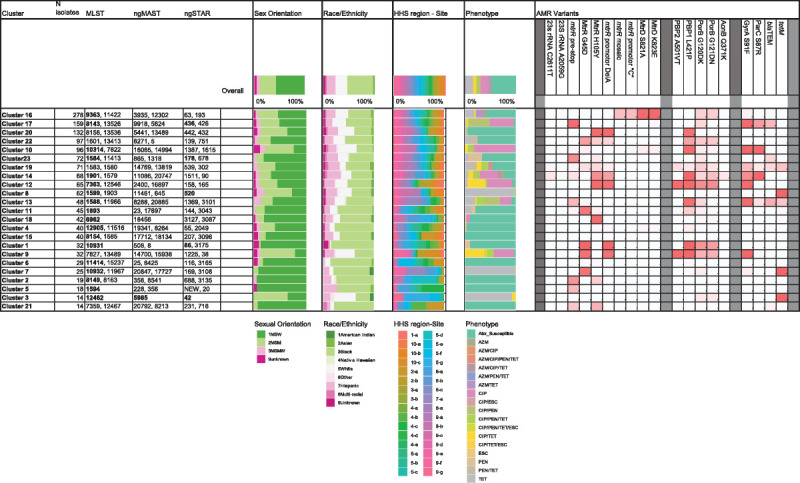
Summary of genotypic, demographic, and phenotypic properties of the phylogenetic clusters defined in 1479 GISP first 5 isolates from the United States in 2018. Fastbaps clusters 1 to 23 were defined within the phylogenetic tree (Fig. 2). Figure shows the number of isolates per cluster and the most common MLST STs, ngMAST STs, and ngSTAR STs per cluster. Numbers are bold if they represent >50%. Distribution of demographic parameters per cluster is shown in the filled histograms (see color keys) for (1) sexual orientation, (2) race/ethnicity, (3) HHS region site, and (4) AMR phenotype. The proportion of isolates per cluster which carry the AMR variants at each loci is highlighted by color gradient (high proportion of variant [>75%, red] [50–75% variant, pink], low proportion of variant [25–50%, light pink], no variant [white]). Gene name and nucleotide variant or protein name and amino acid variant are listed. Descriptions and accession numbers of variants are available in Supplemental Table 3 (http://links.lww.com/OLQ/A682). AMR variants: mtrR promoter identifies adenine nucleotide deletion (Del A); mtrR promoter “C” identifies adenine to cytosine variant (A > C); PBP2 (penA) A501V/T identifies a Val or Thr variant in position 501; PorB G120DK identifies an Asp or Lys variant in position 120; PorB G121DN identifies an Asp or Asn variant in position 121; blaTEM or tetM identify the presence of the plasmid-based gene. Site identifier includes US HHS region (1–10, https://www.hhs.gov/about/agencies/iea/regional-offices/index.html) and site number per region.
Molecular Strain Types
The 1479 GC isolates represented 142 different MLST STs. Eighty percent of the isolates were represented by 33 STs (Fig. 1A); 3.2% of isolates had a novel STs. Twenty-eight STs included only 2 isolates, and 45 STs included only 1 isolate. ST9363 was the predominant ST consisting of 10.7% of isolates; followed by ST8143 (6.4%), ST1584 (4.0%), ST7363 (3.9%), and ST1599 (3.8%). Sequence types were not evenly distributed across all geographic sites (Supplemental Figure 1, http://links.lww.com/OLQ/A682).
Figure 1.
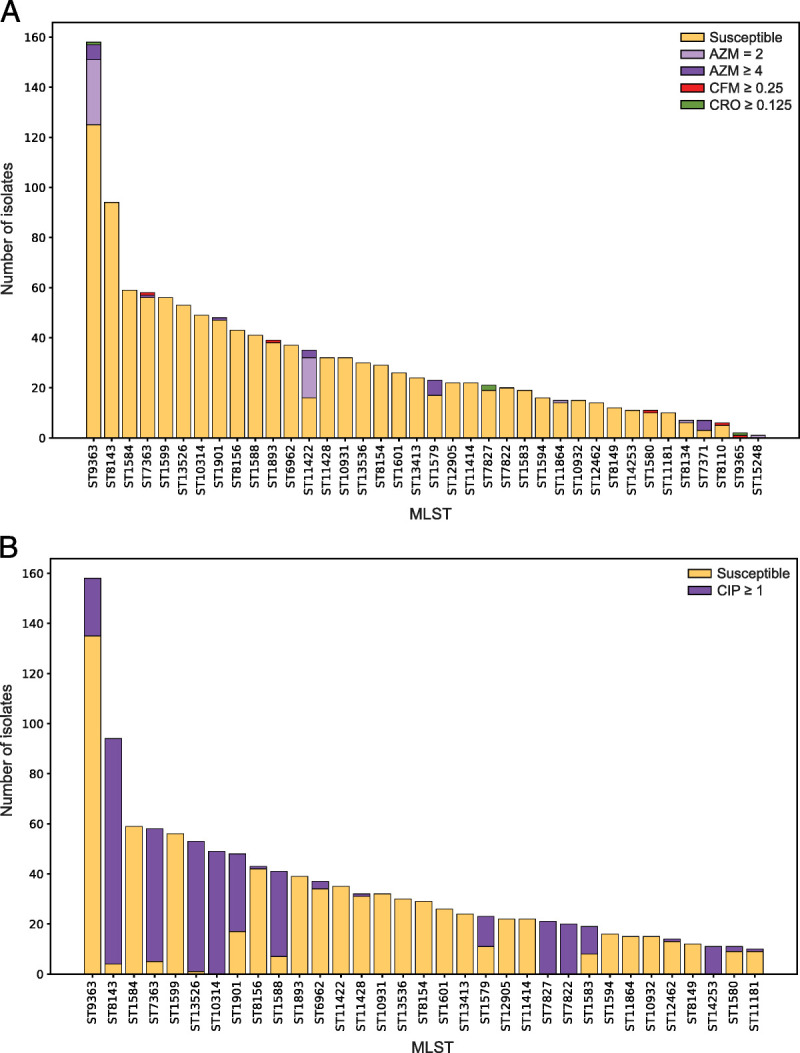
Distribution of multilocus STs for 1479 GISP 1st 5 isolates from the United States in 2018. A, The 33 most numerous STs (that include 10 or more isolates) are shown and colored according to susceptibility to AZM, CFM, and CRO. An additional 5 STs with fewer than 10 isolates which include isolates with decreased susceptibility are also shown on the far right. B, The 33 most numerous STs (that include 10 or more isolates) are shown and colored according to susceptibility or resistance to CIP.
The 1479 isolates represented 668 NG-MAST STs and 306 NG-STAR STs, with 56 novel NG-STARs (Supplemental Figure 2A, 2B, http://links.lww.com/OLQ/A682). The most common NG-MAST STs were ST-9918 (n = 53), ST-11461 (n = 39), and ST-3935 (n = 30); and the common NG-STAR STs were ST-436 (n = 88), ST-63 (n = 73), and ST-520 (n = 58).
Phylogenetics
A maximum-likelihood core-genome SNP phylogenetic analysis categorized the isolates into 2 lineages18 and 23 major clusters. Isolates in lineage A (1120/1479, 76%) had elevated MICs to multiple antibiotics and in lineage B (359/1479, 24.2%) were mostly susceptible to antibiotics (Fig. 2). Seventy percent (253/359) of isolates in lineage B were susceptible to all tested antibiotics. Seventy-one percent (75/106) of isolates in this lineage with elevated MICs to antibiotics tested, carried tetM (ST1599 and ST12462) (Fig. 2). Fifty-eight percent (648/1120) of isolates in lineage A had elevated MICs to at least 1 antibiotic. Three clusters within this lineage, 20 (ST8156 and ST13536), 11 (ST1893), and 22 (ST1601), contained 45% (218/471) of isolates susceptible to all antibiotics tested.
Figure 2.
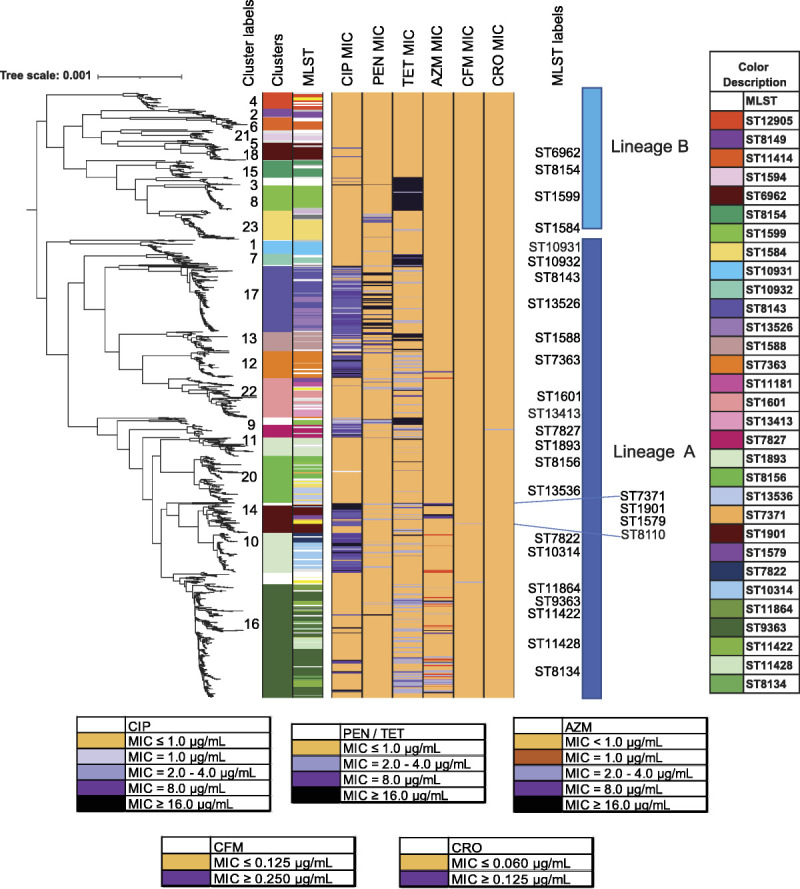
Maximum likelihood core-genome SNP phylogenetic alignment of 1479 GISP first 5 isolates from the United States in 2018. Maximum likelihood core-genome SNP analyses defined the 1479 isolates into 2 lineages, A and B, and into 23 clusters (“Cluster Label” left column) and color-defined in the left-most column. MLST STs are shown (with a color key to the right, listed in order of appearance) and MLST STs (“MLST Label” in center column). MLSTs with low representation are uncolored (white), with the exceptions of MLSTs ST11516, ST12093, ST11423, ST8110, ST1580 which are colored yellow. Isolate susceptibility profiles are shown for CIP, PEN, TET, AZM, CFM, and CRO and colored according to MIC (susceptible (gold), elevated MIC (shades of purple)).
Of the 23 clusters (Fig. 3), cluster 16 was the largest with 19% (278/1479) of isolates representing a patient population of 54% MSW, 38% MSM; 45% Black, 23% White, 18% Hispanic. Isolates were predominately ST9363, ST11422, ST11428, and ST8134 (Fig. 4A) and associated with elevated MICs (em) to AZM (AZMem) and resistance (R) to TET (TETR). The second largest cluster, cluster 17, included 159 isolates in ST8143 and ST13526 associated with CIPR (Fig. 4B). This cluster included patient demographics of 52% MSW, 36% MSM; 52% Black, 26% White, 13% Hispanic. Cluster 10 with 96 isolates included ST10314, ST7822, and ST14253 (Fig. 4C), and included 24% MSW, 55% MSM; 31% Black, 35% White, 16% Hispanic.
Figure 4.
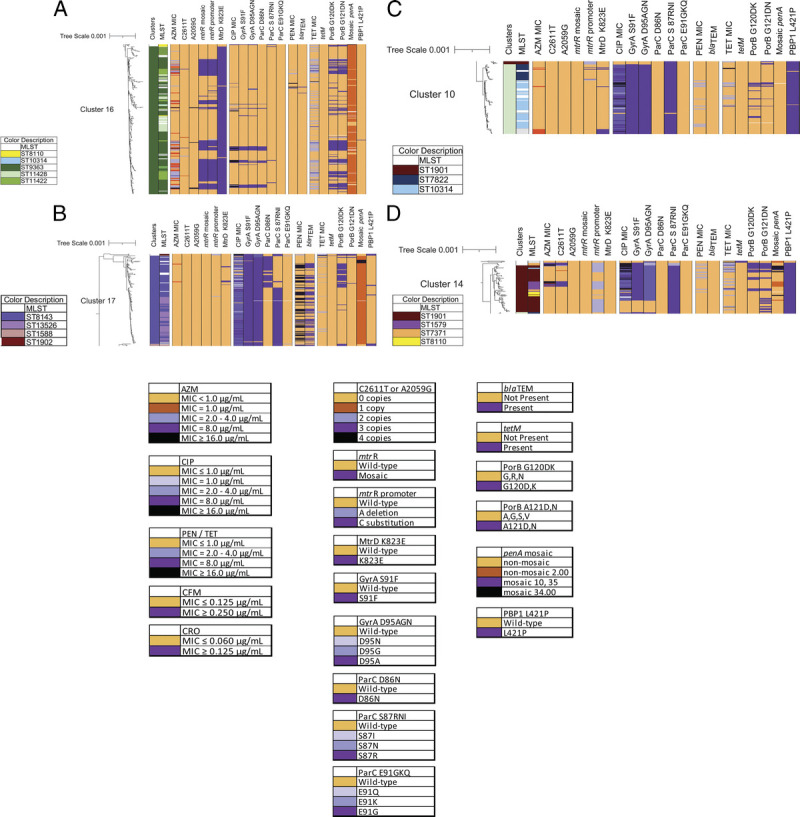
Maximum likelihood core-genome SNP phylogenetic alignment close-up of clusters. Antibiotic susceptibility profiles and genetic variant profiles are specified for (A) cluster 16 (278/1479 isolates), (B) cluster 17 (158/1479 isolates), (C) cluster 10 (96/1479 isolates), and (D) cluster 14 (68/1479 isolates). Isolate susceptibility profiles are shown for CIP, PEN, TET, and AZM, and colored according to MIC with gold for susceptible and shades of purple for elevated MIC (AZM) or resistant (CIP, PEN, and TET). The variants are represented as wild-type (light orange) or mutant (light to dark purple).
Cluster 14 which associated with CIPR, TETR, and AZMem (and historically CFMem/CROem), included multiple MLST STs (Fig. 4D) and demographics of 68% MSW, 22% MSM; 41% Black, 21% White, 28% Hispanic.
AMR Variants/Susceptibilities
Among the isolates in this data set, AZMem, CFMem, CROem, and resistance to previously used antibiotics were associated with known gonococcal genetic variants and select MLSTs (Fig. 3, Fig. 1A). In MLST ST8143, ST1588, ST7363, ST1583, ST1901, and ST9363, isolates had elevated MICs to multiple antibiotics (Fig. 2, Fig. 3). There were no isolates in the data set with elevated MICs to all drugs tested, and no isolates had elevated MICs to both AZM and CRO.
Azithromycin
Sixty-six (4.4%) of the 1479 isolates had AZMem. Forty-five isolates showed low-level AZMem (MIC = 2.0 μg/mL) with the majority in MLST ST9363 (58%, 26/45) and ST11422 (36%, 16/45) (Figs. 1A, 2). Ninety-six percent (43/45) of these isolates had a mosaic mtr operon, including mosaic mtrR, mtrR promoter C substitution, mtrR-35 A, and MtrD K823E, variants capable of elevating AZM MICs13,19 (Table 4). Eighty percent (36/45) also carried variants PorB G120DK and G121DN associated with TETR (Fig. 4A). Of the remaining 2 MIC of 2.0 μg/mL isolates, one carried a premature stop codon in mtrR and the other had mutations indicative of a mosaic mtrD gene (MtrD S821A and K823E). A mosaic mtr operon was also found in 59 isolates in ST9363 and ST11422 that showed AZM MIC less than 2.0 μg/mL (Table 4). The AZM median MIC of the 101 isolates with a mosaic mtr operon (without 23S rRNA mutations) was 1.0 μg/mL. Similar clustering of isolates with a mosaic mtr operon or only mosaic mtrD was observed in previous years.6,7
TABLE 4.
Combinations of Sequence Variants With Associated AZM MICs
| Loci With Variants* | No. Isolates Per MIC, μg/mL† | ||||||||||
|---|---|---|---|---|---|---|---|---|---|---|---|
| 23S-C2611 | 23S-A2059 | mtrR Mosaic | mtrR Promoter | MtrD K823 | ≤0.5 | 1 | 2 | 4 | 8 | ≥16 | MLST‡ |
| C | A | False | A | E | 153 | 13 | 1 | 0 | 1 | 0 | 9363 |
| C | A | False | A | K | 864 | 1 | 0 | 0 | 0 | 0 | |
| C | A | False | C | E | 2 | 3 | 0 | 0 | 0 | 0 | |
| C | A | False | C | K | 2 | 0 | 1 | 0 | 0 | 0 | 9363 |
| C | A | False | DEL | E | 4 | 0 | 0 | 0 | 0 | 0 | |
| C | A | False | DEL | K | 294 | 2 | 0 | 0 | 0 | 0 | |
| C | A | True | A | E | 0 | 0 | 1 | 0 | 0 | 0 | 9363 |
| C | A | True | C | E | 23 | 41 | 42 | 1 | 0 | 0 | 9363, 11422 |
| T | A | True | C | E | 0 | 0 | 0 | 1 | 0 | 2 | 11422, 9363 |
| C | G | True | C | E | 0 | 0 | 0 | 0 | 0 | 4 | 9363 |
| T | A | False | A | E | 1 | 1 | 0 | 0 | 0 | 0 | |
| T | A | False | A | K | 3 | 0 | 0 | 0 | 0 | 0 | |
| T | A | False | DEL | K | 1 | 2 | 0 | 1 | 6 | 5 | 1579, 7371 |
*Gray shading indicates the variant compared to unshaded wild type.
†Elevated MICs: Low = 2 μg/mL, Intermediate = 4–8 μg/mL, High ≥16 μg/mL.
‡Lists the MLST ST where isolates with elevated MICs (numbers in bold) with the respective variant profile are most frequently found.
Isolates with intermediate to high AZMem (MIC≥4.0 μg/mL) carried 23S rRNA variants (18/21, 86%, P < 0.00001) (Supplemental Table 1A, http://links.lww.com/OLQ/A682). Four isolates in ST9363 had 23S rRNA A2059G (Escherichia coli numbering) variant, resulting in an AZM MIC of 16.0 μg/mL or greater; these were collected among 2 sites in the west region of the United States. Twenty-three isolates carried 23S rRNA C2611T (E. coli numbering) variants (median MIC = 8.0 μg/mL) and were primarily in MLST ST7371, ST1579, and ST9363. Nine isolates had C2611T in less than 4 copies with AZM MICs ranging from 0.06 to 8.0 μg/mL (Supplemental Table 2, http://links.lww.com/OLQ/A682). These were identified in 6 different MLST STs, phylogenetically dispersed, suggesting novel introductions of the variant.
Cefixime and Ceftriaxone
Only 5 isolates had CFMem (MIC ≥ 0.25 μg/mL) and were MLST ST8110, ST7363, ST9365, ST1893, and ST1580, although not phylogenetically clustered (Fig. 2). Four of the isolates had mosaic penA-34.001 allele; one had mosaic penA-10.001 (ST7363). Four isolates were CROem (MIC≥0.125 μg/mL) and were MLST ST7827 (n = 2), ST9363, and ST9365. These isolates carried penA alleles 13.001 (n = 2), 91.001, and 34.001. Other AMR variants in mtrR, the mtr promoter region, ponA, and porB were identified in isolates with reduced susceptibility to cephalosporins. Twenty of the 1479 isolates had a mosaic penA-34 allele with CFM MICs ranging from 0.06 to 0.5 μg/mL (median MIC = 0.125 μg/mL), and with CRO MICs ranging from 0.015 to 0.125 μg/mL (median MIC = 0.03 μg/mL) (Supplemental File, GISP_2018.xlsx, http://links.lww.com/OLQ/A683).
Ciprofloxacin
Thirty-two percent of all isolates (488/1479) displayed CIPR (MIC≥1.0 μg/mL). These were grouped in clusters 17, 12, and 13 and among phylogenetically distant clusters 10, 14, and 9 (Fig. 2). Eight highly prevalent MLST STs (ST8143, ST7363, ST13526, ST10314, ST1588, ST7827, ST7822, and ST14253) contained greater than 80% of isolates with CIPR (Fig. 1B). Six additional MLST STs had 10% to 65% CIPR isolates (Fig. 1B).
The variant GyrA S91F was associated with CIPR (475/488, 97%) (χ2(1, N = 1479) = 1289.36, P < 0.01) (Supplemental Table 1B, http://links.lww.com/OLQ/A682). This significant association was not matched by any other GyrA or ParC variants studied (GyrA 92 and 95, or ParC 86, 87, 88, and 91). Although GyrA S91F may be sufficient to confer CIPR, the addition of other GyrA and ParC variants is known to further increase CIP MICs11,12 (Table 5). Notably, cluster 17 had 159 isolates with 98% (156/159) carrying GyrA S91F/D95A and 92% (146/159) carrying ParC D86N and/or S87R (Fig. 4B). In cluster 10, 99% (95/96) of isolates were CIPR carrying GyrA S91F and ParC S87R (Fig. 4C).
TABLE 5.
Combinations of Sequence Variants With Associated CIP MICs
| Loci With Variants* | No. Isolates Per MIC (μg/mL)† | ||||||||||||
|---|---|---|---|---|---|---|---|---|---|---|---|---|---|
| GyrA S91 | GyrA D95 | ParC D86 | ParC S87 | ParC E91 | ≤0.25 | 0.5 | 1 | 2 | 4 | 8 | 16 | 32 | MLST‡ |
| F | A | D | N | E | 4 | 3 | 6 | 15 | 6 | 0 | 0 | 0 | 1588 |
| F | A | D | R | E | 1 | 0 | 1 | 5 | 116 | 77 | 7 | 3 | 13526, 10314, 8143, 7822 |
| F | A | D | S | E | 5 | 5 | 7 | 3 | 0 | 0 | 0 | 0 | 1583 |
| F | A | N | S | E | 1 | 0 | 0 | 22 | 28 | 8 | 12 | 0 | 8143, 9363 |
| F | G | D | R | E | 2 | 0 | 2 | 1 | 25 | 15 | 13 | 1 | 1901, 1579 |
| F | G | D | S | G | 5 | 0 | 0 | 0 | 17 | 22 | 8 | 2 | 7363 |
| F | G | N | S | E | 1 | 0 | 1 | 4 | 12 | 13 | 2 | 0 | 7827 |
| F | N | D | I | E | 0 | 0 | 0 | 0 | 0 | 0 | 0 | 4 | 7371 |
| S | D | D | S | E | 923 | 0 | 1 | 1 | 7 | 2 | 0 | 1 | 6962, 9363 |
| S | D | D | R | E | 19 | 0 | 0 | 0 | 1 | 0 | 0 | 0 | 13526 |
| S | G | D | S | E | 10 | 0 | 0 | 0 | 0 | 0 | 0 | 0 | |
*Gray shading indicates the variant compared to unshaded wild type.
†Resistant MICs: ≥1 μg/mL.
‡Lists the MLST ST where CIP resistant isolates (numbers in bold) with the respective variant profile are most frequently found.
Penicillin
PENR (MIC≥2.0 μg/mL) was observed in 12.8% (190/1479) of all isolates. Plasmid-based blaTEM is associated with PENR (χ2(1, N = 1479) = 875.72, P < 0.01) (Supplemental Table 1C, http://links.lww.com/OLQ/A682) and accounts for 95% (107/113) of high-level PENR (MIC≥4.0 μg/mL) (Table 6). blaTEM was predominantly identified in MLST ST8143 (45%, 42/94), ST13526 (51%, 30/53), ST1588 (46%, 22/41) in clusters 17 and 13 (Fig. 3, Fig. 4B).
TABLE 6.
Combinations of Sequence Variants With Associated PEN MICs
| Loci With Variants* | No. Isolates Per MIC (μg/mL)† | |||||||||||
|---|---|---|---|---|---|---|---|---|---|---|---|---|
| mtrR Promoter | PBP2 (penA) D345 Insert | PBP1 (ponA) L421 | blaTEM Present | ≤0.5 | 1 | 2 | 4 | 8 | 16 | 32 | 64 | MLST‡ |
| A | False | L | False | 62 | 1 | 0 | 0 | 0 | 0 | 0 | 0 | |
| A | False | P | False | 1 | 2 | 0 | 1 | 0 | 0 | 0 | 0 | 7363 |
| DEL | False | P | False | 8 | 4 | 3 | 0 | 0 | 0 | 0 | 0 | 1901, 9365 |
| A | True | L | False | 600 | 37 | 3 | 2 | 0 | 0 | 1 | 0 | § |
| C | True | L | False | 70 | 44 | 3 | 0 | 0 | 0 | 0 | 0 | 9363, 11422, 8134 |
| DEL | True | L | False | 11 | 0 | 0 | 0 | 0 | 0 | 0 | 0 | |
| A | True | P | False | 106 | 69 | 19 | 0 | 0 | 0 | 0 | 0 | 10314, 1901 |
| C | True | P | False | 4 | 0 | 0 | 0 | 0 | 0 | 0 | 0 | |
| DEL | True | P | False | 190 | 71 | 28 | 2 | 0 | 0 | 0 | 0 | 1579, 7827, 12093 |
| A | False | L | True | 0 | 0 | 0 | 0 | 0 | 0 | 1 | 0 | 7363 |
| A | True | L | True | 5 | 0 | 18 | 9 | 5 | 3 | 13 | 54 | 8143, 13526, 1583, 10317 |
| C | True | L | True | 1 | 0 | 0 | 0 | 0 | 0 | 0 | 0 | |
| A | True | P | True | 2 | 0 | 3 | 7 | 6 | 5 | 2 | 2 | 1588 |
| DEL | True | P | True | 1 | 0 | 0 | 0 | 0 | 0 | 0 | 0 | |
*Gray shading indicates the variant compared to unshaded wild type.
†Resistant MICs: ≥2 μg/mL.
‡Lists the MLST ST where PEN resistant isolates (numbers in bold) with the respective variant profile are most frequently found.
§No predominant MLST, all 6 resistant isolates in different STs.
Isolates with low-level PENR (MIC = 2.0 μg/mL, n = 77) contained combinations of 1 or more chromosomal variants previously implicated in increasing PENR (predominantly penA-5.002 and 9.001, PBP2 (penA) D345 insertion, PBP1 (ponA) L421P, mtrR promoter A-deletion, MtrR H105Y (or mtrR premature stop), and PorB G120DK and G121DN) (Fig. 3, Fig. 4C, Table 6).10,12 Forty-eight percent (37/77) of the low-level PENR isolates were found in MLST ST10314, ST1583, ST1579, and ST1901.
Tetracycline
Three hundred and eighty (25.6%) of 1479 isolates had TETR (MIC≥2.0 μg/mL). The presence of the plasmid-based tetM was associated with TETR (χ2(1, N = 1479) = 467.84, P < 0.01) (Supplemental Table 1D, http://links.lww.com/OLQ/A682) and accounted for 95% (144/152) of high-level TETR (MIC≥8.0 μg/mL) (Table 7). tetM was predominantly identified in MLST ST1599 (100%, 56/56), ST10932 (93%, 14/15), ST1588 (44%, 18/41), and ST12462 (100%, 14/14) (Fig. 2, Fig. 3).
TABLE 7.
Combinations of Sequence Variants With Associated TET MICs
| Loci With Variants* | No. Isolates Per MIC (μg/mL)† | ||||||||||||
|---|---|---|---|---|---|---|---|---|---|---|---|---|---|
| mtrR Promoter | PorB G120 | PorB G121 | RpsJ V57 | tetM Present | ≤0.5 | 1 | 2 | 4 | 8 | 16 | 32 | 64 | MLST‡ |
| A | WT | WT | V | False | 156 | 6 | 0 | 0 | 0 | 0 | 0 | 0 | |
| A | WT | WT | M | False | 173 | 360 | 41 | 0 | 1 | 1 | 2 | 0 | 11428, 10314, 1893, 1588 |
| DEL | WT | WT | V | False | 53 | 1 | 0 | 1 | 0 | 0 | 1 | 0 | 8156 |
| DEL | WT | WT | M | False | 31 | 79 | 9 | 1 | 0 | 0 | 0 | 0 | 13536 |
| C | WT | WT | M | False | 9 | 25 | 9 | 0 | 0 | 0 | 0 | 0 | 8143, 9363 |
| A | DK | WT | M | False | 33 | 43 | 5 | 0 | 0 | 0 | 0 | 0 | 8143 |
| A | WT | DN | M | False | 4 | 4 | 1 | 0 | 0 | 0 | 0 | 0 | 9363 |
| A | DK | DN | M | False | 4 | 21 | 12 | 3 | 0 | 0 | 0 | 0 | 13413 |
| DEL | DK | WT | V | False | 3 | 0 | 0 | 0 | 0 | 0 | 0 | 0 | |
| DEL | DK | DN | V | False | 20 | 0 | 0 | 0 | 0 | 0 | 0 | 0 | 10931 |
| DEL | WT | DN | M | False | 2 | 6 | 2 | 0 | 0 | 0 | 0 | 1 | 1901 |
| DEL | DK | DN | M | False | 6 | 18 | 59 | 13 | 2 | 0 | 1 | 0 | 7363 |
| C | DK | DN | M | False | 3 | 10 | 52 | 10 | 0 | 0 | 0 | 0 | 9363, 11422 |
| A | WT | WT | V | True | 0 | 0 | 0 | 0 | 1 | 2 | 0 | 0 | 10932, 1601 |
| A | WT | WT | M | True | 2 | 1 | 3 | 2 | 0 | 10 | 94 | 8 | 1599, 10932 |
| A | DK | WT | M | True | 0 | 0 | 1 | 1 | 0 | 1 | 9 | 1 | 1588, 10932 |
| A | DK | DN | M | True | 0 | 0 | 0 | 0 | 0 | 0 | 3 | 1 | 12462, 1587, 15242 |
*Gray shading indicates the variant compared with unshaded wild type.
†Resistant MICs: ≥2 μg/mL.
‡Lists the MLST ST where TET-resistant isolates (numbers in bold) with the respective variant profile are most frequently found.
Isolates with low-level TETR (MIC = 2.0–4.0 μg/mL, n = 228) were observed primarily in MLST ST9363, ST11422, ST7363, ST1579, ST7827, and ST1901 and lacked tetM (Fig. 2). Combinations of chromosomal variants previously reported to enhance TET MICs were present in these isolates, including RpsJ V57M, mtrR promoter A-deletion, MtrR A45D, MtrR H105Y, and PorB G120DK and A121DN12 (Table 7). In addition to PorB G120DK and G121DN, a C SNP in the mtr promoter and associated mosaic mtr operon was prevalent among isolates in ST9363 and ST11422 (cluster 16, Fig. 4A) and may have contributed to incremental MIC increases and resulting low-level TETR (68/78 isolates), in a strain already carrying AZMem.
DISCUSSION
This 2018 national sentinel surveillance study included 1479 GISP isolates from 32 US jurisdictions and is the largest annual molecular study of GC WGS in the United States to date. While this study was limited to only male urethral isolates, other CDC programs such as eGISP (extended Gonococcal Isolate Surveillance Project) and SURRG (Strengthening the US Response to Resistant Gonorrhea) collect gonococcal isolates from other genders and multiple anatomic sites in addition to male urethral isolates.16 Future genomic studies using such data will be important for understanding AMR trends among a diverse population and strain evolution among different anatomic sites of infection. The GISP data are potentially not truly representative of the United States due to oversampling of certain populations, however it benefits from association with a long-standing sentinel surveillance program. Previous WGS analyses were done retrospectively on smaller data sets; however, 2018 sets the basis for prospective studies on the first 5 GISP data moving forward. This data serves as a baseline for future comparisons and provides a national prevalence and distribution of GC STs. The 1479 GC genomes add to the global database and allow monitoring of historically persistent lineages, imported or novel STs, and the evolution of AMR variants.
The majority of MLST STs identified in this study were previously recorded in the United States between 2000 and 2017; in particular, ST9363 was observed in 2014 to 2016, became predominant in 2017,6,7,14 and persists in 2018.
In 2018, all AZMem isolates had 1 or more of the known determinants associated with AZMem (ie, 23S rRNA mutations, mosaic mtr operon). Genogroup ST9363/ST11422 (cluster 16) carried mosaic mtr alleles encoding variant MtrCDE multidrug efflux pump and its repressor, MtrR, which have a demonstrated ability to increase MICs of AZM and other antimicrobials.13 Although mosaic mtr alleles are a primary concern for AZMem, one could speculate that these alleles could enhance efflux of other antimicrobials.12 In line with lineage A accumulating AMR variants and associating with increasing MICs to multiple antibiotics,18 cluster 16 also carried chromosomal AMR variants associated with TETR (porB and rpsJ) and CIPR (gyrA), conferring resistance to 3 different antibiotic classes. Continued monitoring of chromosomal variant acquisitions conferring multidrug resistance in GC isolates is needed.19
23S rRNA mutations, although a good predictor of elevated MICs to AZM, were not prevalent in the data set. 23S rRNA mutations occurred in MLST STs and clusters previously defined in the United States, but were only in a minority of AZMem isolates (27%, 18/66).6,7 Isolates with fewer than 4 copies of the C2611T variant may be explained by novel introductions of the variant and show low to no clonal expansion in the population. Cases of unexplained AZMem appear to have diminished since they were reported in 36% of isolates in the 2000 to 2013 study.14
In 2020, the gonorrhea treatment recommendations in the United States were updated to CRO monotherapy. In addition to antimicrobial stewardship and azithromycin pharmacokinetics, part of the rationale for removal of AZM from the 2020 GC treatment recommendations was that GISP observed the percentage of isolates with AZM MICs of 2.0 μg/mL or greater increased over 7-fold from 2013 to 2018 (0.6% to 4.6% in 2018).1 With the continued presence and expansion of cluster 16, isolates with mosaic mtr locus account for over 77% (51/66) of AZMem.7 This expansion aligns with the MIC trends seen in GISP in the United States.1
Consistent with total GISP surveillance numbers for 2018, isolates with CFMem or CROem were few (Table 2) and were susceptible to other antibiotics. These isolates were phylogenetically diverse, of multiple STs, and individually carried penA34 allele. The mosaic penA60 allele, a cause of high-level CFMem and CROem, was not observed in this data set.8,9 Only recently, the first such isolate was identified in the United States in November 2019.20penA alleles responsible for decreased susceptibility to cephalosporins have been identified in countries utilizing CRO monotherapy21,22 and contributed to treatment failures.23–25 Hence, with the change of treatment guidelines to CRO monotherapy in the United States, the evolution and dissemination of CRO resistance determinants must be closely monitored.
Sixty percent of GC specimens show CIP susceptibility, although these numbers fluctuate per year. With the previously known significant correlation between CIPR and the GyrA S91F variant (also observed in our data—Supplemental Table 1B, http://links.lww.com/OLQ/A682), diagnostics are being developed for rapid detection of CIP susceptibility26 to present CIP as an alternative personalized treatment.27 With high-resolution data from WGS and increased understanding of GC AMR determinants, the goal is to develop similar diagnostic tests which may be used for other antibiotics.
As expected, clear correlations were observed between resistance determinants, such as blaTEM and PENR, and tetM and TETR. For low-level PENR and TETR accumulation of chromosomal variants as seen in this study (eg, mtr mosaic, porB, penA, or rpsJ) may incrementally increase the MIC for multiple antibiotics. Apart from the variants presented here, this large data set provides the opportunity for exploration of novel chromosomal variants or complex variant profiles through genome-wide association studies and machine learning–based prediction methods.28,29
This study provides a WGS data set from a systematically collected, well-characterized sample of isolates for the analysis and prediction of AMR profiles from diverse genomic backgrounds. Although WGS cannot replace phenotypic testing, routine molecular surveillance is crucial for detecting the accumulation or change of AMR variants within a short period and monitoring the trends of select strains harboring AMR markers. This knowledge will guide the development of novel diagnostics, personalized treatments, and ultimately direct strategies for mitigation of the emergence and spread of resistant GC strains in the population.
Supplementary Material
For further references, please see “Supplemental References,” http://links.lww.com/OLQ/A682.
Footnotes
J.L.R. and V.L.C. contributed equally to this article.
Acknowledgments: The authors thank the Gonococcal Isolate Surveillance Project (GISP), CDC GISP contributors, and all US GISP sites for submitting gonococcal isolates and epidemiological data to the CDC; CDC Antibiotic Resistance Coordination and Strategy Unit (ARX); Elizabeth A Torrone for oversight and direction of the GISP project; and Samera Sharpe and Kevin Pettus (CDC) for confirmatory antimicrobial susceptibility testing measurements.
The findings and conclusions in this report are those of the authors and do not necessarily represent the official position of the CDC.
Conflict of Interest and Sources of Funding: This work was supported by the Centers for Disease Control and Prevention (CDC) and in part made possible through support from CDC's Combating Antibiotic Resistant Bacteria and Advanced Molecular Detection programs. This project was also supported in part by an appointment to the Research Participation Program at the CDC administered by the Oak Ridge Institute for Science and Education through an interagency agreement between the Department of Energy and the CDC (to J.L.R. and V.L.C.). Authors declare no conflict of interest.
Antimicrobial Resistant Neisseria gonorrhoeae Working Group: Sopheay Hun, MBA, Chi Hua, BS, Ryan Ruiz, MS (Antibiotic Resistance Laboratory Network [AR Lab Network], Washington State Department of Health, WA); Olusegun O Soge, PhD (Department of Global Health and Medicine, University of Washington, Seattle, WA); Catherine Dominguez, PhD, Jillian Loomis, BS, Ami Patel, PhD (AR Lab Network, Maryland Department of Health, MD); Jenny Zhang, MD, Tamara Baldwin, BS, Chun Wang, MS, John Leavitt, PhD (AR Lab Network, Texas Department of State Health Services, TX); Christina Moore, BS (AR Lab Network, Tennessee Department of Health, TN); Christian Whelen, PhD, Pamela O'Brien, BS (Hawaii Department of Health State Laboratories Division, HI); Alesia Harvey, BS and Emily Learner, PhD, MPH (Centers for Disease Control and Prevention, National Center for HIV/AIDS, Viral Hepatitis, STD and TB Prevention, Division of STD Prevention, Atlanta, GA).
Supplemental digital content is available for this article. Direct URL citations appear in the printed text, and links to the digital files are provided in the HTML text of this article on the journal’s Web site (http://www.stdjournal.com).
Contributor Information
Jennifer L. Reimche, Email: nkv3@cdc.gov;jenniferlinn6@gmail.com.
Vasanta L. Chivukula, Email: vasanta.chivukula@gmail.com.
Matthew W. Schmerer, Email: nmk7@cdc.gov.
Sandeep J. Joseph, Email: lww9@cdc.gov.
Cau D. Pham, Email: whi4@cdc.gov.
Karen Schlanger, Email: khs4@cdc.gov.
Sancta B. St Cyr, Email: oew3@cdc.gov.
Hillard S. Weinstock, Email: hsw2@cdc.gov.
Brian H. Raphael, Email: elx9@cdc.gov.
Ellen N. Kersh, Email: egk6@cdc.gov.
REFERENCES
- 1.Bowen V Braxon J David D, et al. 2018Sexually Transmitted Diseases Surveillance. Available at: https://www.cdc.gov/std/stats18/default.htm. Accessed December 11, 2020.
- 2.Rowley J Vander Hoorn S Korenromp E, et al. Chlamydia, gonorrhoea, trichomoniasis and syphilis: Global prevalence and incidence estimates, 2016. Bull World Health Organ 2019; 97:548–562P. [DOI] [PMC free article] [PubMed] [Google Scholar]
- 3.U.S. Centers for Disease Control and Prevention . Antibiotic Resistance Threats in the United States, 2019. Atlanta, GA: U.S. Department of Health and Human Services, CDC, 2019:1–113. [Google Scholar]
- 4.Workowski KA Bolan GA, Centers for Disease Control and Prevention . Sexually transmitted diseases treatment guidelines, 2015. MMWR Recomm Rep 2015; 64(RR-03):1–137. [PMC free article] [PubMed] [Google Scholar]
- 5.St Cyr S Barbee L Workowski KA, et al. Update to CDC's Treatment Guidelines for Gonococcal Infection, 2020. MMWR Morb Mortal Wkly Rep 2020; 69:1911–1916. [DOI] [PMC free article] [PubMed] [Google Scholar]
- 6.Thomas JC Seby S Abrams AJ, et al. Evidence of recent genomic evolution in gonococcal strains with decreased susceptibility to cephalosporins or azithromycin in the United States, 2014–2016. J Infect Dis 2019; 220:294–305. [DOI] [PMC free article] [PubMed] [Google Scholar]
- 7.Gernert KM Seby S Schmerer MW, et al. Azithromycin susceptibility of Neisseria gonorrhoeae in the USA in 2017: A genomic analysis of surveillance data. Lancet Microbe 2020; 1:e154–e164. [DOI] [PMC free article] [PubMed] [Google Scholar]
- 8.Tomberg J Unemo M Davies C, et al. Molecular and structural analysis of mosaic variants of penicillin-binding protein 2 conferring decreased susceptibility to expanded-spectrum cephalosporins in Neisseria gonorrhoeae: Role of epistatic mutations. Biochemistry 2010; 49:8062–8070. [DOI] [PMC free article] [PubMed] [Google Scholar]
- 9.Liao M Gu WM Yang Y, et al. Analysis of mutations in multiple loci of Neisseria gonorrhoeae isolates reveals effects of PIB, PBP2 and MtrR on reduced susceptibility to ceftriaxone. J Antimicrob Chemother 2011; 66:1016–1023. [DOI] [PubMed] [Google Scholar]
- 10.Olesky M, Hobbs M, Nicholas RA. Identification and analysis of amino acid mutations in porin IB that mediate intermediate-level resistance to penicillin and tetracycline in Neisseria gonorrhoeae. Antimicrob Agents Chemother 2002; 46:2811–2820. [DOI] [PMC free article] [PubMed] [Google Scholar]
- 11.Belland RJ Morrison SG Ison C, et al. Neisseria gonorrhoeae acquires mutations in analogous regions of gyrA and parC in fluoroquinolone-resistant isolates. Mol Microbiol 1994; 14:371–380. [DOI] [PubMed] [Google Scholar]
- 12.Unemo M, Shafer WM. Antimicrobial resistance in Neisseria gonorrhoeae in the 21st century: Past, evolution, and future. Clin Microbiol Rev 2014; 27:587–613. [DOI] [PMC free article] [PubMed] [Google Scholar]
- 13.Wadsworth CB Arnold BJ Sater MRA, et al. Azithromycin resistance through interspecific acquisition of an epistasis-dependent efflux pump component and transcriptional regulator in Neisseria gonorrhoeae. MBio 2018; 9:e01419–e01418. [DOI] [PMC free article] [PubMed] [Google Scholar]
- 14.Grad YH Harris SR Kirkcaldy RD, et al. Genomic epidemiology of gonococcal resistance to extended-spectrum cephalosporins, macrolides, and fluoroquinolones in the United States, 2000–2013. J Infect Dis 2016; 214:1579–1587. [DOI] [PMC free article] [PubMed] [Google Scholar]
- 15.Schwarcz SK Zenilman JM Schnell D, et al. National surveillance of antimicrobial resistance in Neisseria gonorrhoeae. The gonococcal isolate surveillance project. JAMA 1990; 264:1413–1417. [PubMed] [Google Scholar]
- 16.Kersh EN Pham CD Papp JR, et al. Expanding U.S. Laboratory capacity for Neisseria gonorrhoeae antimicrobial susceptibility testing and whole-genome sequencing through the CDC's antibiotic resistance laboratory network. J Clin Microbiol 2020; 58:e01461–e01419. [DOI] [PMC free article] [PubMed] [Google Scholar]
- 17.Clinical and Laboratory Standards Institute (CLSI) . Perform Stand Antimicrob Susceptibility Test, 30th ed. Wayne, PA: Clinical and Laboratory Standards Institute, 2020. [Google Scholar]
- 18.Sánchez-Busó L Golparian D Corander J, et al. The impact of antimicrobials on gonococcal evolution. Nat Microbiol 2019; 4:1941–1950. [DOI] [PMC free article] [PubMed] [Google Scholar]
- 19.Rouquette-Loughlin CE Reimche JL Balthazar JT, et al. Mechanistic basis for decreased antimicrobial susceptibility in a clinical isolate of Neisseria gonorrhoeae possessing a mosaic-like mtr efflux pump locus. MBio 2018; 9:e02281–e02218. [DOI] [PMC free article] [PubMed] [Google Scholar]
- 20.Picker M Knoblock R Hansen H, et al. Notes from the field: First case in the United States of Neisseria gonorrhoeae harboring emerging mosaic penA60 allele, conferring reduced susceptibility to cefixime and ceftriaxone. MMWR Morb Mortal Wkly Rep 2020; 69:1876–1877. [DOI] [PMC free article] [PubMed] [Google Scholar]
- 21.Shimuta K Watanabe Y Nakayama S, et al. Emergence and evolution of internationally disseminated cephalosporin-resistant Neisseria gonorrhoeae clones from 1995 to 2005 in Japan. BMC Infect Dis 2015; 23:1800617. [DOI] [PMC free article] [PubMed] [Google Scholar]
- 22.Yan J Xue J Chen Y, et al. Increasing prevalence of Neisseria gonorrhoeae with decreased susceptibility to ceftriaxone and resistance to azithromycin in Hangzhou, China (2015–17). J Antimicrob Chemother 2019; 74:29–37. [DOI] [PubMed] [Google Scholar]
- 23.Unemo M Golparian D Stary A, et al. First Neisseria gonorrhoeae strain with resistance to cefixime causing gonorrhoea treatment failure in Austria, 2011. Euro Surveill 2011; 16:19998. [PubMed] [Google Scholar]
- 24.Eyre DW Sanderson ND Lord E, et al. Gonorrhoea treatment failure caused by a Neisseria gonorrhoeae strain with combined ceftriaxone and high-level azithromycin resistance, England, February 2018. Euro Surveill 2018; 23:1800323. [DOI] [PMC free article] [PubMed] [Google Scholar]
- 25.Whiley DM Jennison A Pearson J, et al. Genetic characterisation of Neisseria gonorrhoeae resistant to both ceftriaxone and azithromycin. Lancet Infect Dis 2018; 18:717–718. [DOI] [PubMed] [Google Scholar]
- 26.Allan-Blitz LT Ellis OL Wee R, et al. Improved determination of Neisseria gonorrhoeae gyrase a genotype results in clinical specimens. J Antimicrob Chemother 2019; 74:2913–2915. [DOI] [PMC free article] [PubMed] [Google Scholar]
- 27.De Korne-Elenbaas J Pol A Vet J, et al. Simultaneous detection of Neisseria gonorrhoeae and fluoroquinolone resistance mutations to enable rapid prescription of oral antibiotics. Sex Transm Dis 2020; 47:238–242. [DOI] [PMC free article] [PubMed] [Google Scholar]
- 28.Pesesky MW Hussain T Wallace M, et al. Evaluation of machine learning and rules-based approaches for predicting antimicrobial resistance profiles in gram-negative bacilli from whole genome sequence data. Front Microbiol 2016; 7:1887. [DOI] [PMC free article] [PubMed] [Google Scholar]
- 29.Moradigaravand D Palm M Farewell A, et al. Prediction of antibiotic resistance in Escherichia coli from large-scale pan-genome data. PLoS Comput Biol 2018; 14:e1006258. [DOI] [PMC free article] [PubMed] [Google Scholar]
Associated Data
This section collects any data citations, data availability statements, or supplementary materials included in this article.