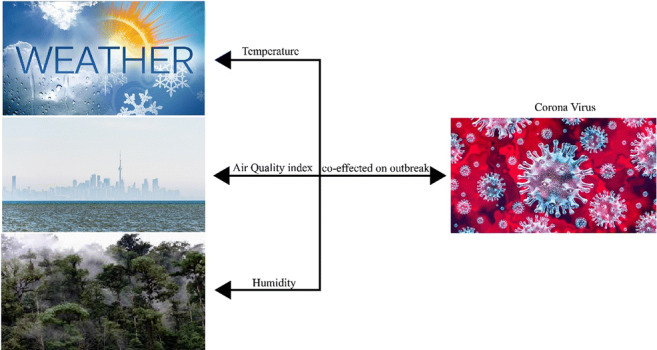
Graphical abstract
The Coronavirus (COVID-19) pandemic has infected more than three million people, with thousands of deaths and millions of people into quarantine. In this research, the authors focus on meteorological and climatic factors on the COVID-19 spread, the main parameters including daily new cases of COVID-19, carbon dioxide (CO2) emission, nitrogen dioxide (NO2), Sulfur dioxide (SO2), PM2.5, Ozone (O3), average temperature, and humidity are examined to understand how different meteorological parameters affect the COVID-19 spread in Canada? The graphical quantitative analysis results indicate that CO2 emissions, air quality, temperature, and humidity have a direct negative relationship with COVID-19 infections. Quantile regression analysis revealed that air quality, Nitrogen, and Ozone significantly induce the COVID-19 spread across Canadian provinces. The findings of this study are contrary to the earlier studies, which argued that weather and climate change significantly increase COVID-19 infections. We suggested that meteorological and climatic factors might be critical to reducing the COVID-19 new cases in Canada based on the findings. This work’s empirical conclusions can provide a guideline for future research and policymaking to stop the COVID-19 spread across Canadian provinces.
Keywords: COVID-19, Temperature, Humidity, Air quality, CO2 emission, Canada, Quantile on quantile
Introduction
For hundreds of years, the world has been encountering pandemic threats periodically. New pneumonia is known as coronavirus disease (COVID-19) reported at the end of 2019 from China [42]. From December 2019 to January 2020, COVID-19 has breakout into a pandemic, which quickly spread out nationwide and all over the world, e.g., in China, the northern hemisphere, the Middle East, Asia, Europe, and the USA [4, 13, 23]. Infectious disease can spread in two ways; firstly, the influenza virus has a longer airborne time and more stable in moist and cold temperatures [17, 33]. Secondly, the virus effect more susceptible and quickly to the host due to the weak immune system in cold and dry weather [8, 12]. COVID-19 spread around the globe in all states and infected 78,23,289 people, with 4,31,541 fatalities till mid of June 2020 [37].
Many climatological and weather parameters could transmit the viruses (e.g., temperature, air quality index, pollutant emissions, and humidity, etc.) and through human contact [36]. For example, previously, it was reported that the influenza disease spread quickly in winter conditions [15, 31]. Some other studies give evidence that influenza disease lowers its transmission in high temperature and low humidity [14, 16, 22, 25, 30]. These meteorological factors (e.g., air quality, temperature, and humidity) affect the virus’s existence in the environment, significantly influencing the transmission of COVID-19 [26]. For example, recent studies on the COVID-19 reported that disease spread positively correlated with climatological indicators, e.g., temperature, humidity, and air quality [20, 36, 43].
Temperature and humidity were the positively associated climate indicators with the COVID-19 pandemic [34, 36]. However, previously it was reported that extreme temperature and humidity could accelerate the viability of SARS diseases [3, 41]. For example, Tan et al. [32] revealed that SARS-CoV-1 showed significant correlations with meteorological parameters (temperature, air, and humidity). On the other hand, recently, it was reported that 95% of infections of COVID-19 spread through temperature variation between 28 °F - 50 °F (~2–10 °C) and in dry climates. It is necessary to forecast the pandemic outbreak and its end-time by understanding the relationship between COVID-19 and weather conditions.
Canada is the 2nd largest country globally, located in the northern part of North America, and covers 9.98 million square kilometers area with ten provinces and three territories. Canada confirms its first case of COVID-19 on 23 January 2020, and there have been 98,410 confirmed cases as of 15 June 2020 [39]. It has increased in all provinces very quickly. The five highest regions of COVID-19 cases were Quebec, Ontario, British Columbia, Alberta, and Nova Scotia. Some recent studies discussed that meteorological conditions help to spread COVID-19 in different regions of the world. For example, this phenomenon has been described before by Wang et al. [36] that the COVID-19 spread in China’s warm and humid region slower than in Wuhan. This study investigates the relationship between meteorological factors and epidemic transmission rates in Canada’s ten most affected regions. Three meteorological variables, i.e., air quality index {PM2.5, carbon dioxide (CO2), nitrogen dioxide (NO2), Sulfur dioxide (SO2), Ozone (O3)} temperature, humidity, and daily Covid-19 confirmed cases were recorded from Canada between 5 February and 8 April 2020, from 10 provinces of Canada.
In this research work, the authors use the weather forecast to analyze the Spearman correlation technique to predict Canada’s likely outbreak. Before COVID-19, various research work tested that infectious viruses can be transmitted through several climatic factors (e.g., air, temperature, and humidity) and population density [5]. After ten months of COVID-19, the disease does not go to normal, but it will increase day by day. For empirical analysis, the authors use the first wave available data till April 2020. The primary aim of this research is to explore the association between environmental quality, weather, and COVID-19 outbreak in Canada and prevent people from infected with COVID-19.
Data and methods
Data specification
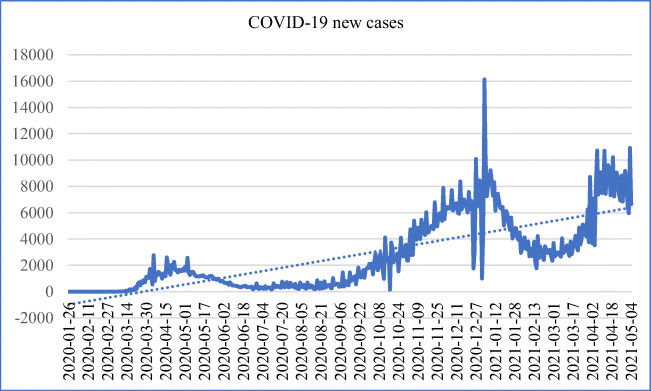
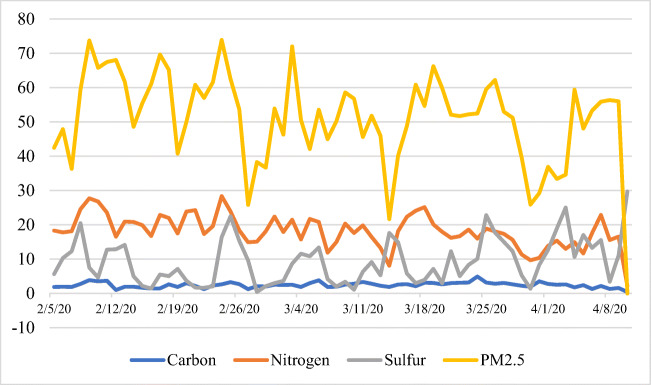
The study uses seven key indicators, such as CO2 emission, NO2, SO2, PM2.5, O3, average temperature, and humidity, to analyze the effects of climate change on the rapid spread across provinces of Canada.1 The variables included COVID-19 daily cases, carbon emission, the temperature (°C), PM2.5, and the percentage of air quality index and humidity. Daily data of all climate change indicators, including access from the Canadian government website (https://www.canada.ca/), reporting all the information and data related to health, environment, jobs, and other issues. The maximum available daily data is obtained from February to 10 April 2020. The main reason for selecting Canada is the rapid infections (36,000 Plus) and fatalities (1680 plus) by putting the country in the top 10 worst affected by COVID-19. Canada is a country with a 37.59 million population and a 1.4% population growth rate. Figure 1 represents the daily new cases of COVID-19 in Canada, mentioning that the country witnessed 1600 plus cases in a single day in April 2020. Figure 2 shows the fluctuation rate of pollutant emission in Canada led by PM2.5 and NO2. The recent year’s research has highlighted that human health is significantly affected by air pollution, temperature, and carbon emissions in the atmosphere. The air quality, wind speed, and temperature together contribute to moving the virus particles in the air and the indoor environment. According to the Global Air Report2 of 2019, air pollution approximately caused the death of 5 million people in 2017, while the USA was among the top countries on this list. Such factors and some scientific reasons motivate the researchers to consider the studied variables as key indicators for COVID-19. Further, the environmental parameters play a key role in transmission, the timing of infection, distribution viability, and range of spread [27].
Fig. 1.
Daily COVID-19 cases in Canada
Fig. 2.
Recent Trent of Environmental Pollutants in Canada
Estimation strategy
For empirical analysis, the authors employ the quantile on quantile (QQR) approach to check the effects of climate change indicators on COVID-19 spread. However, the existing studies recommend checking the normal distribution of data before applying any regression or correlation methods. The main parameters are reasons for applying the QQR method as explained as follows. The quantile-on-quantile technique is the newly developed method, which explains the specification of our preferred model. The QQR method is a more general strategy for standard quantile regression. Such a strategy allows exploring the effect of certain variables on dependent variables at conditional quantiles. Further, the quantile-on-quantile method is used to study the asymmetric behavior of studied factors on the dependent variable. More specifically, the QQR method generates us the 3D graph, which shows the effects of studied variables (air quality, temperature, etc.) on the COVID-19 new cases at all quantile levels. The QQR methodology is a combination of quantile regression and non-parametric. In a more recent study, Shahzad et al., [28] also employed the QQR methodology for their study on COVID-19 and the environment for the top ten provinces of China. More specifically, this approach reports the quantile effects of temperature, air quality, carbon, and nitrogen emissions on the COVID-19 cases.
The quantile on quantile technique was developed by Sim and Zhou [29] to study the asymmetric behavior of variables in time series data. The QQR technique is an advanced form of quantile regression and explores the conditional quantile variables with advanced technology quantile regression and non-parametric estimations [11]. However, the main advantage of QQR method is that it can be applied to data having non-normal distribution. In the recent study, Shahzad et al., [26] also used the quantile on quantile method for their study on COVID-19 and environment nexus for the top ten provinces of China.
Further, the QQR approach shows the asymmetric distributions between the variables [24]. The QQR technique can report in-depth details about different climate change factors’ reactions to varying quantiles of COVID-19 in Canada. Eq (i) presents the linear form of quantile-on-quantile analysis.
| 1 |
Whereas the Covidt denotes the daily new confirmed cases of COVID-19, climatet shows all used indicators of climate change, and μσstates the error term in the model.
The effect βσ is uncertain at this stage due to no prior information. In the next step of estimations, all the climate change variables present their impacts on different conditional quantiles. For the robustness analysis, the present study used linear regression methods. In doing so, the study used linear OLS and quantile regression method at conditional quantiles such as 10th, 25th, 50th, 75th, and 90th. Such an approach reports an in-depth analysis concerning the role of environmental factors for the COVID-19 transmission and new cases. The linear regression strategy is considered a well-known strategy for the time-series data to check the effects of specific indicators. As we know, the COVID-19 transmission might show in 2 to 15 days in any person. Hence, the studied data should be analyzed with regressions at different quantiles [7]. The linear regression and quantile regression results provide more robust and consistent outcomes on the short-term data. Equation (ii) presents the linear form of estimates. Whereas the symbols denote the respective variables of climate and environment and denotes the error term in the model.
| 2 |
Empirical results and discussion
The empirical findings of the Quantile-on-Quantile method are described in Fig. 3-9. The slope of coefficients β1(θ, τ) are estimated, indicating the impact of τthquantiles of CO2, NO2, SO2, PM2.5, PM10, TEMP, and HUM on θth quantiles of COVID-19. We have observed significant heterogeneity between metrological factors and COVID-19.
Fig. 3.
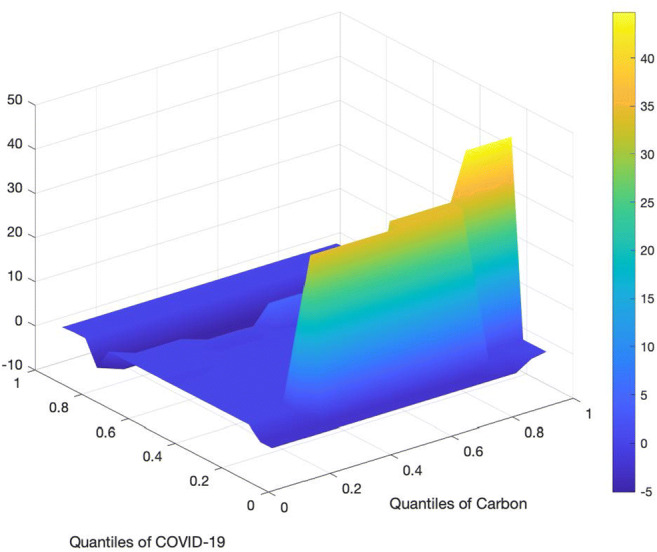
Impact of Carbon on COVID-19 cases
Fig. 9.
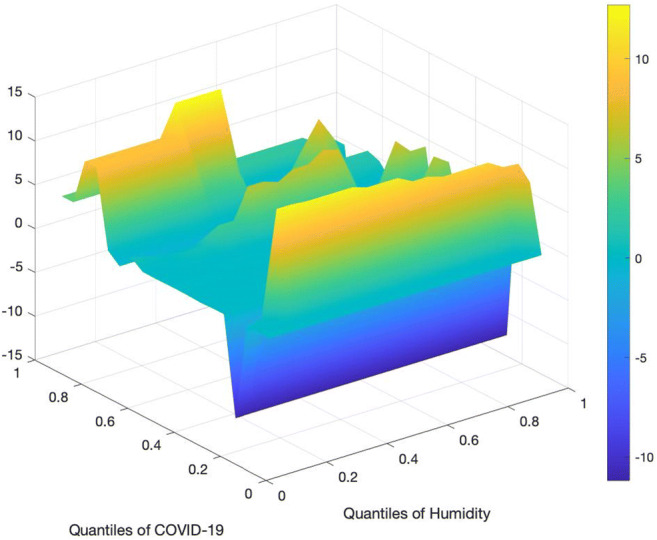
Impact of Humidity on COVID-19 cases
For instance, Fig. 3 shows the quantiles effect of carbon emission CO2 on quantiles of COVID-19. We observed a strong negative association between CO2 and COVID-19 in the range combining the lower quantiles (0.2–0.3) and higher quantiles (0.8–0.9). However, a weak but negative relationship was observed between CO2 and COVID-19 combining surface from quantiles (0.4–0.8) and lower to higher quantiles. Interestingly, the positive impact is limited and insignificant. This result is unexpected and new, which might be due to limited cases in Canada. Future research with more extensive data can unveil an accurate picture of the role of carbon emission.
Figure 4 demonstrates the quantiles impact of NO2 on quantiles of daily new confirmed cases of COVID-19. We detect the powerfully positive effect of NO2 and COVID-19, combining both variables from the middle quantiles (0.5–0.6) of COVID-19 and from the middle to higher quantiles (0.4–0.9) of NO2. It means that the pollutant environment may strengthen the number of daily new COVID-19 cases. These findings support the results of a recent study [19]. While on other surfaces of the graph, we found a weak negative impact of NO2 on COVID-19 on the surface, combining the middle to higher quantiles of both variables. However, the enormously positive effect is minimal and insignificant.
Fig. 4.
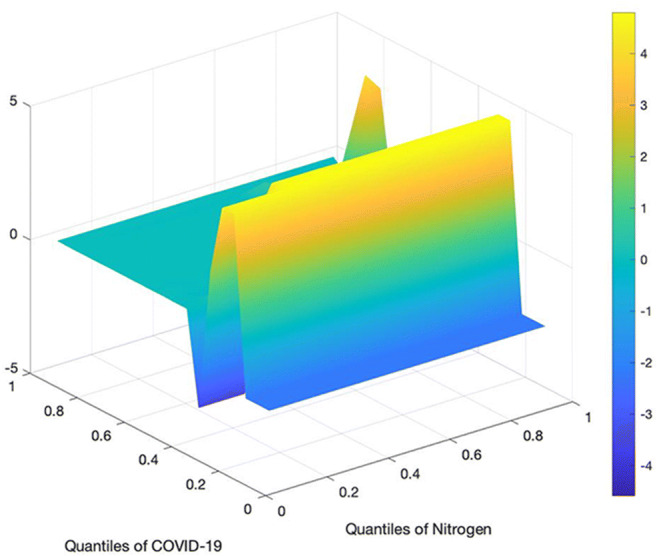
Impact of Nitrogen dioxide on COVID-19 cases
The quantiles effect of SO2 on the quantiles of daily new COVID-19 can be seen in Fig. 5. We found the strong positive and significant impact of SO2 on COVID-19 in the area adjoining the tail quantiles (0.8–0.9) of COVID-19 and middle quantiles to higher quantiles of SO2. These results show that the higher quantity of Sulphur dioxide in the atmosphere may increase the number of daily new cases of COVID-19. The findings are in line with the outcomes of a recent study [21] and opposing the results of Xie, J., Zhu, [40]. The other 3D graph areas suggest that a weak negative association exists between both variables from the middle quantiles to higher quantiles (0.6–0.8). The heterogeneous relationship confirms the non-linear impact between NO2 and COVID-19.
Fig. 5.
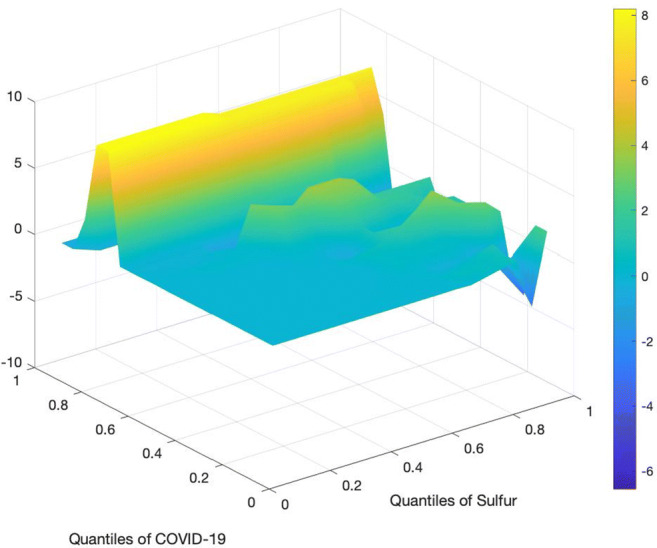
Impact of Sulfur on COVID-19 cases
Figure 6 shows a strong positive impact of the increase in PM2.5 on daily new COVID-19 confirmed cases in the surface, combining the lower quantiles to middle quantiles (0.3–0.6) of both variables. The findings recommend that the higher quantity of particles (low air quality) might increase daily COVID-19 cases in Canada. The results of this portion are complements to the findings of a new study [42]. While on other graph areas, the positive impact of PM2.5 starts getting weaker in the tail quantiles (0.7–0.9). The authors also observed the soft negative effect of PM2.5 on COVID-19 in the area combining the head quantiles (0.1–0.3) of both variables. The overall findings signify the asymmetric relationship between PM2.5 and COVID-19 through different quantiles patterns. In a more recent study, Diao et al., [6] concluded that temperature, humidity, and population density severally cause the COVID-19 virus transmission in Japan, Germany, and England. More Interestingly, they find negative outcomes (same as this study) for the case of China, which was justified from strict lockdowns and strict movement control of population during the first wave.
Fig. 6.
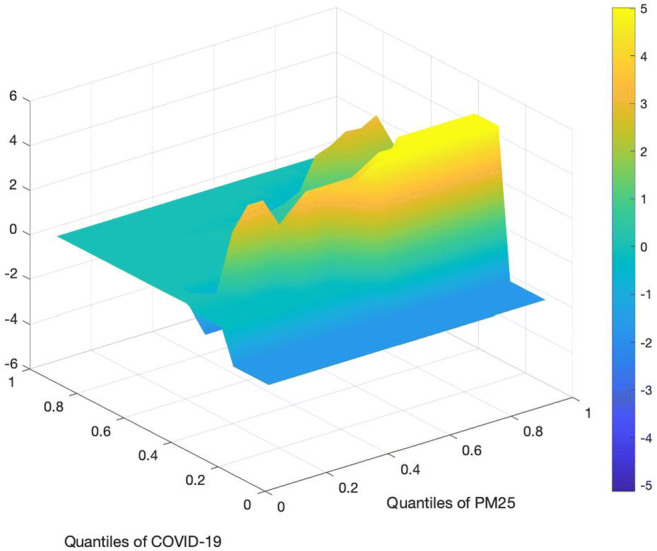
Impact of PM2.5 on COVID-19 cases
On the contrary, Fig. 7 shows the strong negative impact of quantiles of O3 on the quantile of COVID-19 daily new confirmed cases in the area combining the middle quantiles (0.4–0.5) of both variables. On the other surface of the 3D graph, the negative relationship gets more decisive in the area adjoining the middle quantiles to higher quantiles (0.5–0.8) of both variables. This implies that the thick ozone layers, which protect us from the harmful ultraviolet (UV) radiations of the sun, could lower the COVID-19 cases. The results also detect a strong positive impact of Ozone on COVID-19 in the area combining the tail quantiles (0.8–0.9) of COVID-19 and reduce to higher quantiles of Ozone layers. This outcome is similar to the findings of the recent study [40]. In addition, Shakoor et al., [27] and Shahzad et al., [28, 43] reached similar conclusions for their research on the USA, China, Turkey and Spain respectively.
Fig. 7.
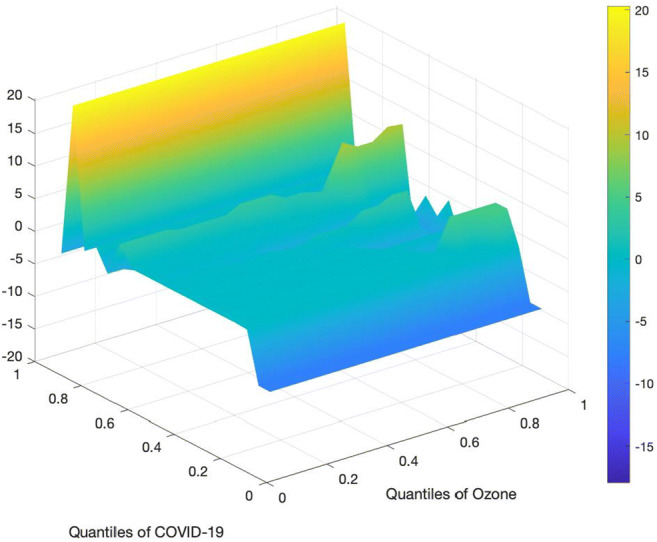
Impact of Ozone on COVID-19 cases
Figure 8 shows the quantiles impact of temperature on the quantiles of COVID-19 daily new cases. The authors observe a weak negative influence of temperature on COVID-19 in the area combining the middle to higher quantiles (0.5–0.7) of both variables. However, the more substantial impact of temperature on COVID-19 is minimal. This part of our findings complements a previous study [35], suggesting that high temperature may cause lower SARS infected cases, and COVID-19 is closely related to the SARS family [38]. From other graph areas, we observe a strong positive effect of temperature on COVID-19 in the region, combining the tail quantiles (0.8–0.9) of both variables. The results align with the current study [18]. The empirical findings endorse the results of Irfan et al., [9] and Iqbal et al., [10] for their studies on the USA, Spain, and China.
Fig. 8.
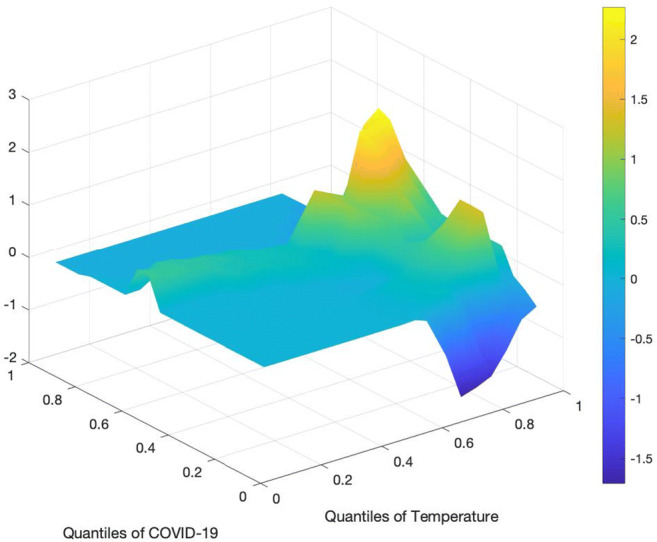
Impact of Temperature on COVID-19 cases
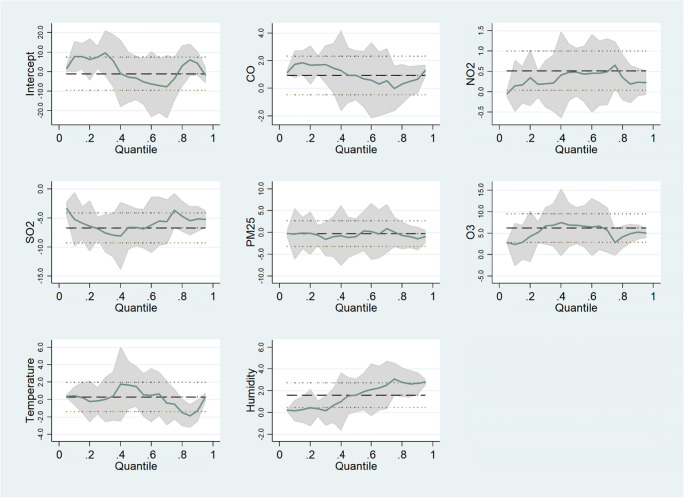
Figure 9 demonstrates the quantile’s influence of humidity on the quantiles of COVID-19. The impact of moisture is mix across all the quantiles. The head quantiles (0.1–0.2) of both variables indicate the strong positive association between both variables. In contrast, the strongly negative impact of humidity on COVID-19 is observed on the lower quantiles (0.3–0.4) of COVID-19 and lower to higher quantiles of moisture. The effect of humidity on COVID-19 gets weaker from the middle to upper quantiles (0.4–0.8). These findings are related to the evidence of a fresh study [1]. To examine the robustness of the above findings, we use linear OLS and quantile estimations at 0.10, 0.25, 0.50. 0.75 and 0.90 quantiles. The conditional quantile regression empirics represent the empirical relationship between climate variables and COVID-19. The findings in Table 1 confirm the existing results, moreover, the superiority of quantile regression over linear OLS is documented. Figure 10 mentions the graphical representation of results documented in Table 1. Notably, the empirics of fig. 10 are in line with the Table 1 outcomes and indicate that air quality, humidity, temperature, and ozone flow in the atmosphere might affect the movement of virus particles, which further cause the new cases of COVID-19. The findings of this research are in line with the recent conclusions of Ali et al., [2] for the case of Turkey.
Table 1.
Linear Regression estimations of all variables with COVID-19
| OLS | Q10 | Q25 | Q50 | Q75 | Q90 | |
|---|---|---|---|---|---|---|
| CO | 0.936 | 1.747*** | 1.687 | 0.938 | −0.0152 | 0.661** |
| −1.72 | −3.66 | −1.73 | −0.87 | (−0.02) | −2.89 | |
| NO2 | 0.515* | 0.145 | 0.179 | 0.485 | 0.652* | 0.236** |
| −2.37 | −0.89 | −0.53 | −1.31 | −2.43 | −3.01 | |
| SO2 | −6.711*** | −5.216*** | −6.790*** | −6.606** | −3.668* | −5.159*** |
| (−5.09) | (−5.99) | (−3.81) | (−3.35) | (−2.56) | (−12.33) | |
| PM25 | −0.258 | −0.326 | −0.622 | −0.936 | 0.125 | −1.404** |
| (−0.16) | (−0.32) | (−0.30) | (−0.41) | −0.08 | (−2.90) | |
| O3 | 6.204*** | 2.374* | 5.191* | 6.830* | 2.821 | 5.293*** |
| −3.83 | −2.1 | −2.24 | −2.67 | −1.52 | −9.74 | |
| Temperature | 0.294 | 0.415 | −0.145 | 1.502 | −0.538 | −1.283*** |
| −0.32 | −0.72 | (−0.12) | −1.15 | (−0.57) | (−4.64) | |
| Humidity | 1.584** | 0.179 | 0.357 | 1.586 | 3.084*** | 2.675*** |
| −2.91 | −0.47 | −0.46 | −1.83 | −4.9 | −14.52 | |
| Constant | −1.037 | 7.776** | 7.412 | −3.21 | −3.574 | 4.205** |
| (−0.23) | −2.7 | −1.26 | (−0.49) | (−0.76) | −3.04 |
Notes: ***,**,* represents the level of significance at 10%, 5% and 1% respectively
Fig. 10.
Quantile regression graph shows the impact of climate variables on COVID-19 cases
Concluding remarks
The present research recognizes the importance of COVID-19 in the daily routines of the Canadian population. In the first step, the researchers gather the available data of environmental indicators in objective to check its linkages with COVID-19 daily new cases. In the second step, the data was analyzed by a linear model of regressions and quantile on quantile method to draw the empirical results. The prime purpose of this research is to report new conclusions regarding the role of meteorological indicators such as Ozone, Nitrogen, air quality, temperature, and humidity for the rising level of daily cases. In this study, the authors explored the association between climate and metrological parameters on the COVID-19 for Canada’s case. During this COVID-19 global pandemic, this study’s prime objective is to access the role of different meteorological and climatic factors in determining the COVID new cases across provinces of Canada. The authors used the maximum available daily data of all studied indicators from February 2020 to 10 April 2020. The quantile-on-quantile estimations documented negative and significant impacts of temperature, air quality (PM2.5), CO2 emission, and ozone on the daily coronavirus infections across Canadian provinces. The conclusions can be used as an input to mitigate the spread of COVID-19 disease in Canada.
The empirical results allow us to conclude that weather and climate factors might be important contributors in determining the incidence rate of cases in Canada. The linear regression results suggest that Carbon, Nitrogen, Ozone, and humidity are the main factors that might increase the COVID-19 transmission in Canadian states. On the contrary, the regressions empirics draw that temperature, air quality, and Sulphur emissions may not be very significant factors. On the contrary, our quantile-on-quantile results argue relatively similar and few mixed results. Such findings argue that there is a strong need for future research studies regarding the role of air quality, air floating, and transmission of COVID-19. The results of this work are supportive of the literature and also guide us to conduct future research. The results of this work can assist the policymakers in mitigating the COVID-19 disease in different states of Canada.
Recently, the Canadian government and health authorities have witnessed that young people and kids have a high transmission rate to catch the virus. The data reports that among the total cases 20% cases are from the youth with a hospitalization rate of 2%. In the objective to reduce the pandemic threat, the Canadian government is promoting and encouraging the people to inject the COVID-19 vaccines. The researchers argue that COVID-19 might be a window for research for the next several decades and future research will us more useful and in-depth knowledge about its transmission, causes, treatments, and other aspects.
Data availability
he datasets used during the current study are available from the corresponding or first author on reasonable request.
Declarations
Ethics approval and consent to participate
Not applicable.
Consent to publish
Not applicable.
Competing interests
The authors declare that they have no known competing financial interests or personal relationships that could have appeared to influence the work reported in this paper. The authors have no conflicts of interest to declare.
Footnotes
The study gathered the data of 10 Chinese provinces and processed as time series data for empirical analysis.
Health Effects Institute (HEI), https://www.healtheffects.org/)
Research highlights
• The authors examine the effects of seven meteorological and climate change factors on COVID-19 in Canada.
• The authors apply Quantile on Quantile approach on the time series daily data to study the effects at conditional quantiles.
• The empirical evidence confirm that carbon emissions, ozone, temperature, humidity and air quality have significant and negative relationship with COVID-19 in Canada.
Publisher’s note
Springer Nature remains neutral with regard to jurisdictional claims in published maps and institutional affiliations.
Contributor Information
Suleman Sarwar, Email: ch.sulemansarwar@gmail.com.
Khurram Shahzad, Email: Khurrams.khurram@gmail.com.
Zeeshan Fareed, Email: zeeshanfareed@hotmail.com.
Umer Shahzad, Email: Shehzad-umer@hotmail.com, Email: umer@aufe.edu.cn.
References
- 1.Ahmadi M, Sharifi A, Dorosti S, Jafarzadeh Ghoushchi S, Ghanbari N. Investigation of effective climatology parameters on COVID-19 outbreak in Iran. Sci Total Environ. 2020;729:138705. doi: 10.1016/j.scitotenv.2020.138705. [DOI] [PMC free article] [PubMed] [Google Scholar]
- 2.Ali H, Yilmaz G, Fareed Z, Shahzad F, Ahmad M. Impact of novel coronavirus (COVID-19) on daily routines and air environment: evidence from Turkey. Air Qual. Atmos. Heal. 2021;14:381–387. doi: 10.1007/s11869-020-00943-2. [DOI] [PMC free article] [PubMed] [Google Scholar]
- 3.Chan KH, Peiris JSM, Lam SY, Poon LLM, Yuen KY, Seto WH. The Effects of Temperature and Relative Humidity on the Viability of the SARS Coronavirus. Adv. Virol. 2011:734690–6. 10.1155/2011/734690. [DOI] [PMC free article] [PubMed]
- 4.Cohen J, Kupferschmidt K. Countries test tactics in 'war' against COVID-19. Science. 2020;367:1287–1288. doi: 10.1126/science.367.6484.1287. [DOI] [PubMed] [Google Scholar]
- 5.Dalziel BD, Kissler S, Gog JR, Viboud C, Bjørnstad ON, Metcalf CJE, Grenfell BT. Urbanization and humidity shape the intensity of influenza epidemics in US cities. Science. 2018;362:75–79. doi: 10.1126/science.aat6030. [DOI] [PMC free article] [PubMed] [Google Scholar]
- 6.Diao Y, Kodera S, Anzai D, Gomez-tames J, Rashed EA, Hirata A. Influence of population density , temperature , and absolute humidity on spread and decay durations of COVID-19 : A comparative study of scenarios. One Heal. 2021;12:100203. doi: 10.1016/j.onehlt.2020.100203. [DOI] [PMC free article] [PubMed] [Google Scholar]
- 7.Doğan B, Ben Jebli M, Shahzad K, Farooq TH, Shahzad U. Investigating the effects of meteorological parameters on COVID-19: case study of New Jersey, United States. Environ Res. 2020;191:110148. doi: 10.1016/j.envres.2020.110148. [DOI] [PMC free article] [PubMed] [Google Scholar]
- 8.Eccles R. An explanation for the seasonality of acute upper respiratory tract viral infections. Acta Otolaryngol. 2002;122:183–191. doi: 10.1080/000164802-52814207. [DOI] [PubMed] [Google Scholar]
- 9.Irfan M, Ahmad M, Fareed Z, Iqbal N, Sharif A, Wu H. On the indirect environmental outcomes of COVID-19: short-term revival with futuristic long-term implications. Int J Environ Health Res. 2021;00:1–11. doi: 10.1080/09603123.2021.1874888. [DOI] [PubMed] [Google Scholar]
- 10.Iqbal N, Fareed Z, Shahzad F, He X, Shahzad U, Lina M. The nexus between COVID-19, temperature and exchange rate in Wuhan city: new findings from partial and multiple wavelet coherence. Sci Total Environ. 2020;729:138916. doi: 10.1016/j.scitotenv.2020.138916. [DOI] [PMC free article] [PubMed] [Google Scholar]
- 11.Iqbal N, Fareed Z, Wan G, Shahzad F. Asymmetric nexus between COVID-19 outbreak in the world and cryptocurrency market. Int Rev Financ Anal. 2021;73:101613. doi: 10.1016/j.irfa.2020.101613. [DOI] [PMC free article] [PubMed] [Google Scholar]
- 12.Kudo E, Song E, Yockey LJ, Rakib T, Wong PW, Homer RJ, Iwasaki A. Low ambient humidity impairs barrier function and innate resistance against influenza infection. Proc Natl Acad Sci U S A. 2019;116:10905–10910. doi: 10.1073/pnas.1902840116. [DOI] [PMC free article] [PubMed] [Google Scholar]
- 13.Li Q, Guan X, Wu P, Wang X, Zhou L, Tong Y, Ren R, Leung KSM, Lau EHY, Wong JY, Xing X, Xiang N, Wu Y, Li C, Chen Q, Li D, Liu T, Zhao J, Liu M, Tu W, Chen C, Jin L, Yang R, Wang Q, Zhou S, Wang R, Liu H, Luo Y, Liu Y, Shao G, Li H, Tao Z, Yang Y, Deng Z, Liu B, Ma Z, Zhang Y, Shi G, Lam TTY, Wu JT, Gao GF, Cowling BJ, Yang B, Leung GM, Feng Z. Early transmission dynamics in Wuhan, China, of novel coronavirus-infected pneumonia. N Engl J Med. 2020;382:1199–1207. doi: 10.1056/NEJMoa2001316. [DOI] [PMC free article] [PubMed] [Google Scholar]
- 14.Lipsitch M, Viboud C. Influenza seasonality: lifting the fog. Proc Natl Acad Sci. 2009;106:3645–3646. doi: 10.1073/pnas.0900933106. [DOI] [PMC free article] [PubMed] [Google Scholar]
- 15.Lowen AC, Mubareka S, Steel J, Palese P. Influenza virus transmission is dependent on relative humidity and temperature. PLoS Pathog. 2007;3(e151):1470–1476. doi: 10.1371/journal.ppat.0030151. [DOI] [PMC free article] [PubMed] [Google Scholar]
- 16.Lowen AC, Steel J, Mubareka S, Palese P. High temperature (30oC) blocks aerosol but not contact transmission of influenza virus. J Virol. 2018;82:5650–5652. doi: 10.1128/JVI.00325-08. [DOI] [PMC free article] [PubMed] [Google Scholar]
- 17.Lowen AC, Steel J. Roles of humidity and temperature in shaping influenza seasonality. J Virol. 2014;88:7692–7695. doi: 10.1128/JVI.03544-13. [DOI] [PMC free article] [PubMed] [Google Scholar]
- 18.Ma Y, Zhao Y, Liu J, et al. Effects of temperature variation and humidity on the death of COVID-19 in Wuhan. China, Science of the Total Environment. 2020;724:138226. doi: 10.1016/j.scitotenv.2020.138226. [DOI] [PMC free article] [PubMed] [Google Scholar]
- 19.Ogen Y. Assessing nitrogen dioxide (NO2) levels as a contributing factor to coronavirus (COVID-19) fatality. Sci Total Environ. 2020;726:138605. doi: 10.1016/j.scitotenv.2020.138605. [DOI] [PMC free article] [PubMed] [Google Scholar]
- 20.Oliveiros B, Caramelo L, Ferreira NC, Caramelo F. Role of temperature and humidity in the modulation of the doubling time of COVID-19 cases. medRxiv. 2020. 10.1101/2020.03.05.20031872.
- 21.Pansini Riccardo, Fornacca Davide. COVID-19 Higher Mortality in Chinese Regions With Chronic Exposure to Lower Air Quality. Frontiers in Public Health. 2021;8:999. 10.3389/fpubh.2020.597753 [DOI] [PMC free article] [PubMed]
- 22.Park J, Son W-S, Choi Y-H, Rye SB, Kwon O, Ahn I. Effects of temperature, humidity, and diurnal temperature range on influenza incidence in a temperate region. Influenza Other Respir Viruses. 2020;14:11–18. doi: 10.1111/irv.12682. [DOI] [PMC free article] [PubMed] [Google Scholar]
- 23.Phelan AL, Katz R, Gostin LO. The novel coronavirus originating in Wuhan. China: Challenges for Global Health Governance JAMA. 2020;323:709–710. doi: 10.1001/jama.2020.1097. [DOI] [PubMed] [Google Scholar]
- 24.Shahbaz M, Zakaria M, Jawad S, Shahzad H, Mahalik MK. The energy consumption and economic growth Nexus in top ten energy-consuming countries: fresh evidence from using the quantile-on-quantile approach. Energy Econ. 2018;71:282–301. doi: 10.1016/j.eneco.2018.02.023. [DOI] [Google Scholar]
- 25.Shaman J, Kohn M. Absolute humidity modulates influenza survival, transmission, and seasonality. Proc Natl Acad Sci U S A. 2009;106:3243–3248. doi: 10.1073/pnas.0806852106. [DOI] [PMC free article] [PubMed] [Google Scholar]
- 26.Shahzad F, Shahzad U, Fareed Z, Iqbal N, Hashmi SH, Ahmad F. Asymmetric nexus between temperature and COVID-19 in the top ten affected provinces of China: a current application of quantile-on-quantile approach. Sci Total Environ. 2020;736:139115. doi: 10.1016/j.scitotenv.2020.139115. [DOI] [PMC free article] [PubMed] [Google Scholar]
- 27.Shakoor A, Chen X, Farooq TH. Fluctuations in environmental pollutants and air quality during the lockdown in the USA and China : two sides of COVID-19 pandemic. Air Qual Atmos Heal. 2020;13:1335–1342. doi: 10.1007/s11869-020-00888-6. [DOI] [PMC free article] [PubMed] [Google Scholar]
- 28.Shahzad K, Shahzad U, Iqbal N, Shahzad F, Fareed Z. Effects of climatological parameters on the outbreak spread of COVID-19 in highly affected regions of Spain. Environ Sci Pollut Res. 2020;27:39657–39666. doi: 10.21203/rs.3.rs-30377/v1. [DOI] [PMC free article] [PubMed] [Google Scholar]
- 29.Sim N, Zhou H. Oil prices , US stock return , and the dependence between their. J Bank Financ. 2015;55:1–8. doi: 10.1016/j.jbankfin.2015.01.013. [DOI] [Google Scholar]
- 30.Steel J, Pales P, Lowen AC. Transmission of a 2009 pandemic influenza virus shows a sensitivity to temperature and humidity similar to that of an H3N2 seasonal strain. J Virol. 2011;85:1400–1402. doi: 10.1128/JVI.02186-10. [DOI] [PMC free article] [PubMed] [Google Scholar]
- 31.Tamerius JD, Shaman J, Alonso WJ, Bloom-Feshbach K, Uejio CK, Comrie A, Viboud C. Environmental predictors of seasonal influenza epidemics across temperate and tropical climates. PLoS Pathog. 2013;9:e1003194. doi: 10.1371/journal.ppat.1003194. [DOI] [PMC free article] [PubMed] [Google Scholar]
- 32.Tan J, Mu L, Huang J, Yu S, Chen B, Yin J. An initial investigation of the association between the SARS outbreak and weather: with the view of the environmental temperature and its variation. J Epidemiol Community Health. 2005;59:186–192. doi: 10.1136/jech.2004.020180. [DOI] [PMC free article] [PubMed] [Google Scholar]
- 33.Tellier R. Aerosol transmission of influenza a virus: a review of new studies. J R Soc Interface. 2009;6:S783–S790. doi: 10.1098/rsif.2009.0302.focus. [DOI] [PMC free article] [PubMed] [Google Scholar]
- 34.Tosepu R, Gunawan J, Savitri D, Ode L, Imran A, Lestari H, Bahar H, As P. Science of the Total environment correlation between weather and Covid-19 pandemic in Jakarta. Indonesia. 2020;725:138436. doi: 10.1016/j.scitotenv.2020.138436. [DOI] [PMC free article] [PubMed] [Google Scholar]
- 35.Wallis P, Nerlich B. Disease metaphors in new epidemics: the UK media framing of the 2003 SARS epidemic. Soc Sci Med. 2005;60(11):2629–2639. doi: 10.1016/j.socscimed.2004.11.031. [DOI] [PMC free article] [PubMed] [Google Scholar]
- 36.Wang J, Tang K, Feng K, Lv W., 2020. High temperature and high humidity reduce the transmission of COVID-19. Available at SSRN 3551767 2020b.
- 37.WHO. Coronavirus disease (COVID-2019) situation report-30. https://www.who.int/docs/default-source/coronaviruse/situationreports/ 20200219-sitrep-30-covid-19.pdf?sfvrsn=3346b04f_2 (accessed March 5, 2020).
- 38.Wilder-Smith A, Chiew CJ, Lee VJ. Can we contain the COVID-19 outbreak with the same measures as for SARS? Lancet Infect Dis. 2020;20:e102–e107. doi: 10.1016/S1473-3099(20)30129-8. [DOI] [PMC free article] [PubMed] [Google Scholar]
- 39.World Health Organization online available on https://www.who.int/emergencies/diseases/novel-coronavirus-2019/ 2020
- 40.Xie J, Zhu Y. Association between ambient temperature and COVID-19 infection in 122 cities from China. Sci Total Environ. 2020;138201. [DOI] [PMC free article] [PubMed]
- 41.Yuan J-S, Yun H-M, Lan W, et al. A climatologic investigation of the SARS-CoV outbreak in Beijing, China. Am J Infect Control. 2006;34:234–236. doi: 10.1016/j.ajic.2005.12.006. [DOI] [PMC free article] [PubMed] [Google Scholar]
- 42.Zhu N, Zhang D, Wang W, Li X, Yang B, Song J, Zhao X, Huang B, Shi W, Lu R, Niu P, Zhan F, Ma X, Wang D, Xu W, Wu G, Gao GF, Tan W. A novel coronavirus from patients with pneumonia in China, 2019. New England journal of medicine. 2020;382:727–733. doi: 10.1056/NEJMoa2001017. [DOI] [PMC free article] [PubMed] [Google Scholar]
- 43.Shahzad K, Farooq TH, Doğan B, Zhong Hu L, Shahzad U. Does environmental quality and weather induce COVID-19: Case study of Istanbul Turkey. Environmental Forensics 1–12. 10.1080/15275922.2021.1940380
Associated Data
This section collects any data citations, data availability statements, or supplementary materials included in this article.
Data Availability Statement
he datasets used during the current study are available from the corresponding or first author on reasonable request.


