

Abstract
A new paper-based analytical device design was fabricated by a wax printing method for simultaneous Cu(II), Co(II), Ni(II), Hg(II), and Mn(II) determination. Colorimetry was used to quantify the heavy metal ions, using bathocuproine (Bc), dimethylglyoxime (DMG), dithizone (DTZ), and 4-(2-pyridylazo) resorcinol (PAR) as complexing agents. The affinity of the complexing agent to the heavy metal ion is dependent on the formation constant (Kf). To enhance the selectivity for heavy metal ion determination, the new device was designed with two pretreatment zones, where masking agents remove interfering ions. It was found that two pretreatment zones worked better than a single pretreatment zone at removing interferences. The reaction time, sample and complexing agent volumes, and complexing agent concentrations were optimized. The analytical results were achieved with the lowest detectable concentration of 0.32, 0.59, 5.87, 0.20, and 0.11 mg L−1 for Cu(II), Co(II), Ni(II), Hg(II), and Mn(II), respectively. The linear range was found to be in the range of 0.32–63.55 mg L−1 (Cu(II)), 0.59–4.71 mg L−1 (Co(II)), 5.87–352.16 mg L−1 (Ni(II)), 0.20–12.04 mg L−1 (Hg(II)), and 0.11–0.55 mg L−1 (Mn(II)). The lowest detectable concentration and linearity for five metal ions allow it to be applied in various water samples. The sensor provided highly selective and efficient for simultaneous Cu(II), Co(II), Ni(II), Hg(II), and Mn(II) determination in drinking, tap, and pond water samples on a single device and detection by naked eye. The results illustrated that the proposed sensor showed good accuracy and precision agreement with a standard ICP-OES method.
Keywords: Heavy metal ion determination, detection, paper-based analytical device, colorimetric method, microfluidic
Graphical Abstract
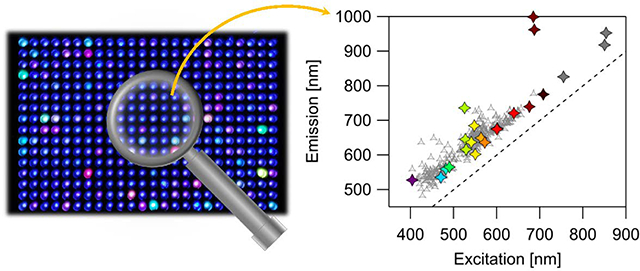
We present a high-throughput study of the steady state Stokes shifts of > 300 fluorescent DNA-stabilized silver clusters and the correlations of DNA sequence with the optical properties of these fluorophores.
Introduction
Electronic manufacturing facilities and electric power plants are very important to and their presence has been continuously growing in developing countries. These industrial facilities, however, release various toxic pollutants that can negatively affect the environment and human health. For example, heavy metals are toxic elements that are released and then contaminate water, soil, and air.1, 2 These contaminants do not degrade resulting in environmental accumulation. Heavy metals are toxic to humans and other living organisms, causing lung damage, nervous and immune disorders, and cancers.3 The World Health Organization has set maximum permissible concentrations in drinking water for Cu (II), Ni(II), Hg(II), and Mn(II): 2.00 mg L−1, 0.07 mg L−1, 0.006 mg L−1, and 0.10 mg L−1, respectively (WHO, 2017). The Ministry of Natural Resources and Environment in Thailand also has set the maximum permissible amount in industrial effluent of Cu(II) (2.00 mg L−1), Ni(II) (1.00 mg L−1), Hg(II) (0.005 mg L−1), and Mn(II) (5.00 mg L−1).4 To assess water quality, there are many conventional methods for toxic metals determination,5–7 like atomic absorption spectrometry (AAS),8, 9 fluorescent spectrometry,10 and electrochemical methods.11–13 These techniques are highly selective and sensitive, have low detection limits, and can detect multiple elements simultaneously. However, expensive instrumentation, time-consuming processes, and highly skilled technicians are required. Therefore, the development of selective, sensitive, simple, and low-cost methods has been emphasized for heavy metal detection.
Microfluidic paper-based analytical devices (μPADs) have become a common tool for heavy metal monitoring.14–17 μPADs are low-cost, flexible, absorbent, lightweight, high throughput, biodegradable, and induce flow without pumps via capillary action,18–22 making them useful for heavy metal quantification in food, clinical, and environmental samples.23, 24 Wax printing techniques are extensively used to fabricate hydrophobic barriers on the paper substrate due to their simplicity and high resolution.25, 26 Colorimetric detection methods on μPADs make analyte detection fast and easy, without external instrumentation.27 Several previous reports have demonstrated μPADs for toxic metal analysis. For example, a 3D origami paper-based analytical device combined with a PVC membrane was reported for colorimetric Cu(II) determination.28 A paper strip was integrated with a smartphone for Zn(II), Cr(VI), Cu(II), Pb(II), and Mn(II) colorimetric detection in wastewater.29 A colorimetric paper sensor based on cation-exchange (belt-like ZnSe nanoframes as the colorimetric reagent) was applied for visual determination of Ag(I), Cu(II), and Hg(II).30 A multilayer paper-based sensor was designed for electrochemical detection of Cd(II) and Pb(II) and colorimetric detection of Fe(III), Ni(II), Cr(VI), and Cu(II).31 A colorimetric paper-based device was used for semiquantitative Pb(II) detection with a smartphone.32 While these paper-based methods have been successful for on-site toxic metal analysis with a smartphone, they are only for limited metal ions, require time-consuming processes for reagent synthesis, and suffer from complicated steps, narrow linearity, high error from variable lighting conditions, and limited application due to the smartphone model.
To improve the limitations of the previous methods, this work focused on the development of a paper-based sensor for simultaneous colorimetric detection of Cu(II), Co(II), Ni(II), Hg(II), and Mn(II). After preparation with optimized masking and complexing agents for the five target metal ions, the paper-based sensor can be used to simultaneously detect Cu(II), Co(II), Ni(II), Co(II), and Mn(II) by naked eye. The device design consists of a sample zone, where the sample solution is added, connected to five sets of pretreatment and detection zones. Masking agents are added to the pretreatment zones which remove interfering ions and enhance selectivity, while complexing agents are added to the detection zones which react selectively with the target metal ions to form colored products. It was found that two pretreatment zones worked better than a single pretreatment zone at removing interferences. The colorimetric reactions on the device were analyzed by scanning the devices followed by analysis in ImageJ. The proposed paper-based sensor demonstrated highly selective and sensitive detection of Cu(II), Co(II), Ni(II), Hg(II), and Mn(II) with great linearity and low limits of detection in drinking, tap, and pond water samples.
Experimental
Chemicals
Standard solutions of five target metal ions were copper(II) nitrate trihydrate (Sigma-Aldrich), cobalt(II) chloride (Sigma-Aldrich), mercury(II) chloride (Sigma-Aldrich), nickel(II) sulfate hexahydrate (Alfa Aesar), and manganese(II) chloride tetrahydrate (Chem-Impex International Inc). Interfering ions were potassium nitrate (Sigma-Aldrich), sodium nitrate (Aldrich), magnesium chloride hexahydrate (Alfa Aesar), and calcium nitrate tetrahydrate (Alfa Aesar) as common ions found in waters and cadmium(II) nitrate tetrahydrate (Sigma-Aldrich), lead(II) nitrate (Sigma-Aldrich), zinc(II) nitrate hexahydrate (Sigma-Aldrich), potassium dichromate (Alfa Aesar), iron(III) chloride (Sigma-Aldrich), iron(II) sulfate heptahydrate (Sigma-Aldrich), vanadium(III) chloride (Sigma-Aldrich) were also studied.
Metal ion solutions were prepared in acetate buffer (0.1 M, pH 5.0). Acetate buffer was prepared by dissolving sodium acetate (Merck) and acetic acid (Sigma-Aldrich) in Milli-Q water (Millipore Milli-Q purification system, R ≥ 18.2 MΩ cm−1). Complexing agents, masking agents, and all reagents were prepared and used without purification as shown in Table S1 and S2.
Instrumentation
A benchtop pH meter with a glass electrode (Mettler Toledo FE20 FiveEasyTM Plus, Switzerland) was used to measure the pH of solutions. Inductively coupled plasma-optical emission spectrometry (Thermo Scientific, model iCAP 6500 series ICP-OES Spectrometer) was used as the standard method for validation. Images of the colorimetric paper-based devices were obtained using a scanner (Brother MFC-8370DN).
Device design and fabrication
The device was designed in CorelDRAW software. The structure design consisted of the sample zone (13 mm diameter), five detection zones (6 mm diameter), ten pretreatment zones (5 mm diameter), and channels (2×3 mm) to connect the zones. The design was printed onto Whatman grade 1 qualitative filter paper using a Xerox Phaser 8860 wax printer.25 This wax pattern was melted at 200°C for 30s using a hot plate, forming three-dimensional hydrophobic barriers as the wax melts into the paper. After heating the device, the dimensions of the printed designs decreased by ~1 mm. The backside of the device was sealed with clear packing tape to prevent leakage of the solution through the paper during analysis. The device was prepared for simultaneous detection of Cu(II), Co(II), Hg(II), Ni(II), and Mn(II) as follows.
Colorimetric detection and interference studies
Cu detection.
A solution of 10 mM bathocuproine (Bc) and 80 mg mL−1 polyethylene glycol (PEG 400) was prepared in chloroform. Two 2.0 μL aliquots of hydroxylamine hydrochloride (0.5 g mL−1), 2.0 μL of CH3COOH/NaCl buffer (10 mM, pH 4.6), followed by 2.0 μL of the bathocuproine/PEG 400 solution were added to detection zone 1. Four 2.5 μL aliquots of NaF (0.5 M) were added onto the pretreatment zone 1. The device was allowed to dry at room temperature in between each reagent addition.
Co detection.
A solution of 5 mM 4-(2-pyridylazo) resorcinol (PAR) and 5% w/w poly(diallyldimethylammonium chloride) (PDDA) was prepared in borate buffer (0.1 M, pH 9.3). Two 2.5 μL aliquots of the PAR/PDDA solution were added to detection zone 2. Three 2.5 μL aliquots of ethylenediamine (4 M) were added onto the pretreatment zone 2. Four 2.5 μL aliquots of EDTA (0.2 M) were added onto the pretreatment zone 1, followed by four 2.5 μL aliquots of triethylenetetramine (0.4 M). The device was allowed to dry at room temperature in between each reagent addition.
Hg detection.
Three 3.0 μL aliquots of PEG 400 (80 mg mL−1) were added to detection zone 3, followed by two 1.5 μL aliquots of dithizone (2 mM). Two 2.5 μL aliquots of ethylenediamine (10 M) were added onto pretreatment zone 2. Four 2.5 μL aliquots of 0.1 M trans-1,2-diaminocyclohexane-N,N,N’,N’-tetraacetic acid (DCTA) were added onto pretreatment zone 1, followed by two 2.5 μL aliquots of KCN (0.1 M). The device was allowed to dry at room temperature in between each reagent addition.
Mn detection.
A solution of 5 mM PAR and 5% w/w PDDA was prepared in borate buffer (0.1 M, pH 9.3). Two 2.5 μL aliquots of the PAR/PDDA solution were added to detection zone 4. Four 2.5 μL aliquots of ethylenediamine (8 M) and four 2.5 μL aliquots of thiourea (1 M) were added onto pretreatment zones 2 and 1, respectively. The device was allowed to dry at room temperature in between each reagent addition.
Ni detection.
Four 2.0 μL aliquots of hydroxylamine hydrochloride (0.5 g mL−1), two 1.5 μL aliquots of dimethylglyoxime (60 mM, DMG) solution, followed by two 2.0 μL aliquots of ammonium hydroxide (0.03 M) were added sequentially to detection zone 5. Two 2.5 μL aliquots of NaF (0.5 M) were added onto the pretreatment zone 2, followed by two 2.5 μL aliquots of acetic acid (6.3 M). The device was allowed to dry at room temperature in between each reagent addition.
Analytical procedures for simultaneous metal ion determination.
The paper-based devices were prepared with the optimized reagents for each metal. A metal ion solution (300 μL) containing the five metals of interest was added to the sample zone. The solution flowed through the pretreatment zones into the detection zones where the metal underwent a colorimetric reaction with the preloaded complexing agents. After the optimal reaction time (120 min), the device was scanned, and an image saved as JPEG. A scanner was used to decrease error from variable external lights. The metal ions were quantified by analyzing the image of the device using the open source software ImageJ (National Institutes of Health). The target metal ion quantification was processed as shown in Fig. 1.
Fig. 1.

The process for fabricating the μPAD and detecting Cu(II), Co(II), Ni(II), Hg(II), and Mn(II).
Interference studies.
To assess the potential of interfering ions, Cd(II), Zn(II), Pb(II), Fe(II), Fe(III), Cr(VI), and V(III) were studied at 1:1 and 1:2 ratios of target metal ion (0.455 mM) to interfering ion. The effect of alkali and alkali earth metals (K(I), Na(I), Mg(II), and Ca(II)) was evaluated by varying the ratio of target metal ion (0.455 mM) to these ion concentrations (1:100 and 1:1000). The color change in the detection zones of the device was measured using the optimum color channel of each reaction as determined by analysis with ImageJ. The tolerance limit for the interfering ions was defined as <10%.
Optimization conditions for simultaneous five metal ions detection
To optimize the effect of metal ion volumes (200–300 μL), reaction times (120–200 min), and volumes of complexing agent (2.0–10.0 μL) on the color intensity response, μPADs were prepared with a single set of reaction conditions on the detection and the pretreatment zones with one device for each metal of interest. The optimal reaction times and complexing agent volumes were evaluated by measuring the color intensity on the detection zones (n=5). The metal ion volumes were assessed by considering the color change of metal complexes on the detection zones.
Image analysis
For colorimetric analysis, the paper-based devices were scanned after the optimum reaction time and saved in JPEG format at 1200 dpi. The images were processed in ImageJ to determine the color intensity of the detection zones (Fig. S1, Supporting Information). Each image was inverted and then split into four color channels: grey, red, green, blue. The circle tool was used to determine an analysis region the size of the detection zone. The average intensity of each region was recorded for each color channel. The linear regression equation for each metal reaction was obtained by plotting the color intensity vs target metal concentration. The regression equation and correlation coefficient (R2) were evaluated to select the optimum color intensity for further studies.
Results and discussion
Device design and fabrication
The proposed paper-based sensor design has a sample zone, 10 pretreatment zones, and 5 detection zones to detect five target metals. The two pretreatment zones preceding each detection zone were used to (1) increase the area available for reagent and masking agent loading to eliminate interfering ions and (2) decrease the strongly basic effect of ethylenediamine at pH 12.2 (WHO, 1991) which improves the potential of masking agents for Co(II), Hg(II), Mn(II) analysis. The detection zones contain complexing agents that form colored complexes with the target metal ions. Once the aqueous sample is added to the sample zone, it travels through the paper through pretreatment zones into the detection zones by capillary action. This device design was applied for simultaneous analysis of five heavy metal ions with small reagent and sample volumes.
Optimization conditions for simultaneous five metal ions detection
Reaction time
The reaction time was optimized in the range of 120–200 min (room temperature) by using a metal ion volume of 300 μL. The color intensities were not significantly different over time for Cu(II), Co(II), Ni(II), Hg(II), and Mn(II) as shown in Fig. S2 (Supporting Information). For qualitative analysis, the device can be analyzed by naked eye at reaction times less than 120 min, but it took 120 min for the device to fully dry. A completely dry device is necessary to scan it for quantitative analysis. Therefore, 120 min was selected to optimize other parameters as the paper was completely dry and also maintained color intensity.
Metal ion volume
As previously optimized with a 300 μL sample volume, the optimal reaction time was 120 min. In order to decrease the reaction time, the sample volume was decreased to 200 and 250 μL but in these cases, the metal ion solution did not completely flow into the detection zone (reaction time of 120 min) for Mn(II) analysis as illustrated in Fig. S3 (Supporting Information). The viscosity of 10M ethylenediamine on the pretreatment zone affected the flow of the aqueous solution through the paper into the detection zone. Therefore, 300 μL of metal ion solution as the sample volume was chosen for further studies and for all metals.
Complexing agent volume
The complexing agent volumes were optimized with 300 μL (metal ion volume) and 120 min (reaction time). The total optimal volumes of Bc (2.0 μL), PAR (5.0 μL), DMG (3.0 μL), DTZ (3.0 μL), and PAR (5.0 μL) were determined for Cu(II), Co(II), Ni(II), Hg(II), and Mn(II) determination, respectively. Due to the size of the detection zone, the total optimal volume of complexing agents was added in multiple smaller aliquots. With low volumes of complexing agent, the complexing agent did not efficiently react with the metal ion, so the color intensity was not as strong. On the other hand, with too much complexing agent, the change in color intensity in the detection zone also decreased due to high background color intensity and high hydrophobicity of some complexing agents on the detection zone (Fig. S4, Supporting Information). For Cu(II) analysis, 2.0 μL of bathocuproine was selected instead of 4.0 μL because the higher volume of Bc increased hydrophobicity on the detection zone, obstructing the flow of the metal solution into the detection zone.
Image analysis
Based on the regression equation and correlation coefficient (R2) results, the gray channel was chosen for Cu(II) and the green channel was selected for Co(II), Ni(II), Hg(II), and Mn(II) analysis (Fig. S5a–5e, Supporting Information).
Colorimetric detection and interference studies
Bathocuproine (Bc) is a sensitive and selective complexing agent commonly used for Cu assay.33 Bathocuproine-Cu is a strong complex and stable under a wide range of pHs.34 Bathocuproine reacts with Cu(I) to form an orange complex35 (S2, Supporting Information). Hydroxylamine hydrochloride (0.5 g mL−1) was added onto the detection zone to (1) reduce Cu(II) to Cu(I), and (2) mask interferences from Zn(II), Co(II), and Cd(II).36 CH3COOH/NaCl buffer (10 mM, pH 4.6) was loaded to adjust the pH and stabilize the Cu(Bc)2 complex with the Cl− anion.36 Since Bc is hydrophobic and obstructs the flow of aqueous solution into the detection zone, PEG 400 (80 mg mL−1) was mixed into the bathocuproine solution to increase hydrophilicity on the detection zone. NaF (0.5 M) was added onto the pretreatment zone 1 to mask Fe(III) and Co(II).36 The lowest detectable concentration is defined as the lowest amount of metal that can be reproducibly detected.36 The lowest detectable concentration based on image analysis for Cu(II) was determined to be 0.005 mM with a linear range of 0.005–1.000 mM (Fig. 2).
Fig. 2.

Visual calibration curve was generated for semi-quantitative Cu(II) determination (top). Cu(II) calibration curve was produced in the range of 0.005–1.000 mM by analyzing the gray intensity of the color change on the detection zone (bottom).
Dithizone (DTZ)-Hg complex has a strong interaction with a formation constant of log Kf, Hg-(DTZ)2= 40.3.37 DTZ forms different colored complexes with metal ions at various pHs.38, 39 The structure of the Hg(DTZ)2 complex40 is shown in S3 (Supporting Information). Ethylenediamine (10 M) was used to mask Cu(II), Ni(II), Zn(II), Cd(II), and Pb(II) on the pretreatment zone 2.41–44 DCTA (0.1 M), which masks Cu(II), Co(II), Ni(II), Pb(II), Zn(II), Cr(VI), and Mn(II), and KCN (0.1 M), which masks Cu(II), Co(II), Ni(II), Zn(II), and Cd(II) were added onto the pretreatment zone 1.45, 46 PEG 400 (80 mg/mL) was added to the detection zone before loading DTZ to increase the hydrophilicity of the detection zone. Hg conditions show the lowest detectable concentration of 0.001 mM and the linear range of 0.001–0.060 mM (Fig. 3).
Fig. 3.

Visual calibration curve was generated for semi-quantitative Hg(II) determination (top). Hg(II) calibration curve was produced in the range of 0.001–0.060 mM by analyzing the green intensity of the color change on the detection zone (bottom).
4-(2-Pyridylazo) resorcinol (PAR) is frequently applied as an analytical reagent for heavy metal analysis. PAR forms a red-colored complex with numerous metal ions including Cu(II), Co(II), Ni(II), Hg(II), Zn(II), Mn(II), Cd(II), and Pb(II).47 PAR is a highly selective and sensitive colorimetric reagent for Mn(II), Ni(II), Zn(II), and Pb(II) in strongly basic conditions (pH 11).48 A PAR/PDDA solution was added onto the detection zones for Co(II) and Mn(II) detection (log Kf (Co(II)-PAR) > 12 and log Kf (Mn(II)-PAR) = 9.7).43 PDDA (5% w/w) was mixed into a PAR solution to stabilize and immobilize the metal-PAR complexes.17 The red Co(PAR)2 and Mn(PAR)2 complex structures49 are shown in S4 and S5 (Supporting Information). For Co(II) detection, ethylenediamine (4 M) was used to mask Cu(II), Ni(II), Zn(II), Cd(II), and Pb(II) on the pretreatment zone 2. Triethylenetetramine (0.4 M) and EDTA (0.2 M) were added onto pretreatment zone 1 to mask Cu(II), Zn(II), Cd(II), Pb(II) and Mn(II), Ni(II), Zn(II), Cd(II), Pb(II), Fe(III), respectively.49 Co conditions show the lowest detectable concentration of 0.010 mM and the linear range of 0.010–0.080 mM (Fig. 4). For Mn(II) detection, thiourea (1 M), which masks Cu(II), and ethylenediamine (8 M), which masks Cu(II), Ni(II), Zn(II), Cd(II), and Pb(II) were added onto the pretreatment zone 1 and 2, respective.50 Mn conditions show the lowest detectable concentration of 0.0020 mM and the linear range of 0.0020–0.0100 mM (Fig. 5).
Fig. 4.

Visual calibration curve was generated for semi-quantitative Co(II) determination (top). Co(II) calibration curve was produced in the range of 0.010–0.080 mM by analyzing the green intensity of the color change on the detection zone (bottom).
Fig. 5.

Visual calibration curve was generated for semi-quantitative Mn(II) determination (top). Mn(II) calibration curve was produced in the range of 0.0020–0.0100 mM by analyzing the green intensity of the color change on the detection zone (bottom).
Dimethylglyoxime (DMG) is an effective complexing agent that forms a pink colored complex with nickel in basic conditions (S6, Supporting Information). 31, 51, 52 The formation constant (Kf) of Ni(DMG)2 complex was reported (log Kf = 17.62).53 Hydroxylamine hydrochloride (0.5 g mL−1) was added onto the detection zone to mask Co(II), Zn(II), Cd(II).36 The optimum pH of the Ni(DMG)2 complex is approximately 9 so the pH of the detection zone was adjusted with ammonium hydroxide (0.03 M, pH 9.5). 54 To remove interference from Co(II) and Fe(III), NaF (0.5 M) was added onto the pretreatment zone 2, followed by acetic acid (6.3 M). Although the conditions in pretreatment zone 2 are strongly acidic, they did not affect Ni complex formation.36 These conditions resulted in the lowest detectable concentration of 0.100 mM and a linear range of 0.100–6.000 mM for Ni(II) (Fig. 6).
Fig. 6.

Visual calibration curve was generated for semi-quantitative Ni(II) determination (top). Ni(II) calibration curve was produced in the range of 0.100–6.000 mM by analyzing the green intensity of the color change on the detection zone (bottom).
The effect of interfering ions on each target metal ion (0.455 mM) was evaluated under the optimized reagent conditions. Interfering ions in the target group (Cu(II), Co(II), Ni(II), Hg(II), and Mn(II) as binary solutions as well as a mixture solution of five metal ions which is called All-5) were studied by varying concentrations in ratios of 1:1 and 1:2. Other metal interferences including Cd(II), Zn(II), Pb(II), Fe(III), Fe(II), Cr(VI), and V(III) were also assessed in the ratio of 1:1 and 1:2. Alkali and alkali earth group metals were evaluated at ratios of 1:100 and 1:1000. The tolerance limit is defined as the ion concentration which causes a relative error of target ion analysis smaller than ±10%.14
At a 1:1 ratio, there were no interferences between the target metal ion and any of the other metals (Fig. S6–S7, Supporting Information). For Cu(II), Co(II), Hg(II), and Mn(II) detection, there was no interference at a 1:2 ratio between the target metal ion and the other metals, except for Ni(II) detection (Fig. S8–S9, Supporting Information), where 0.910 mM Co(II) interfered and caused a relative error of 13.19% (Fig. S9C). At 100 times K(I), Na(I), Mg(II), and Ca(II) did not interfere with Cu(II), Co(II), Ni(II), Hg(II), and Mn(II) detection (Fig. S10, Supporting Information). Moreover, K(I), Na(I), Mg(II), and Ca(II) at a ratio of 1000:1 did not interfere with Co(II) determination and Na(I) at a ratio of 1000:1 did not interfere with Ni(II) determination (Fig. S10B, Supporting Information).
The proposed sensor performance was evaluated under the optimized conditions for each metal on a single device. The linear regression equation for each target metal ion reaction was determined by plotting between the optimum color intensities and metal concentrations with y = 28.317x + 8.2206 (R2 = 0.9977), y = 256.73x + 118.5 (R2 = 0.9887), y = 10.948x + 10.266 (R2 = 0.9846), y = 850.11x + 82.884 (R2 = 0.9831), and y = 1579.9x + 107.34 (R2 = 0.9833) for Cu(II), Co(II), Ni(II), Hg(II), and Mn(II) determination, respectively. The lowest detectable concentration, linear range, and saturated concentration for each metal ion are summarized in Table 1. The lowest detectable concentration of Cu(II) was lower than regulation levels and Mn(II) was close to regulation levels for heavy metal ions in drinking water.4 The proposed sensor could be applied for simultaneous detection of five metal ions in various water samples.
Table 1.
Summary of the analytical performance of the proposed sensor for Cu(II), Co(II), Ni(II), Hg(II), and Mn(II) determination using the reagent conditions for a single target metal on one device (n=5).
| Target metal ion | Lowest detectable concentration (naked eye) |
Color intensity | ||||||
|---|---|---|---|---|---|---|---|---|
| Lowest detectable concentration | Linear Range | Saturated concentration | ||||||
| mM | mg L−1 | mM | mg L−1 | mM | mg L−1 | mM | mg L−1 | |
| Cu(II) | 0.050 | 3.18 | 0.005 | 0.32 | 0.005–1.000 | 0.32–63.55 | 40.0 | 2542 |
| Co(II) | 0.050 | 2.95 | 0.010 | 0.59 | 0.010–0.080 | 0.59–4.71 | 10.0 | 589 |
| Ni(II) | 0.500 | 29.35 | 0.100 | 5.87 | 0.100–6.000 | 5.87–352.16 | 40.0 | 2348 |
| Hg(II) | 0.050 | 10.03 | 0.001 | 0.20 | 0.001–0.060 | 0.20–12.04 | 1.0 | 201 |
| Mn(II) | 0.0500 | 2.75 | 0.0020 | 0.11 | 0.0020–0.0100 | 0.11–0.55 | 10 | 549 |
The device design was successfully applied for Cu(II), Co(II), Ni(II), Hg(II), and Mn(II) quantification using the reagent conditions for a single target metal on one device, where each detection zone serves as a replicate (n=5). The design was also successfully applied for simultaneous Cu(II), Co(II), Ni(II), Hg(II), and Mn(II) screening by naked eye using the five optimized reagent conditions on a single device. After loading the pretreatment and detection zones with the appropriate reagents (Scheme), a solution containing the five target metal ions (varying metal ion concentration) was added to the sample zone. The color change for each reaction on one device was recorded by using a scanner after 120 min. The orange Cu(Bc)2, pink Ni(DMG)2, pink-red Hg(DTZ)2, red Co(PAR)2, and red Mn(PAR)2 complexes are shown in Fig. 7. The proposed sensor provided highly selective, efficient, and portable for simultaneous Cu(II), Co(II), Ni(II), Hg(II), and Mn(II) screening on one device by naked eye.
Fig. 7.

The color change of metal complexes for simultaneous detection of five metal ions on one device of (A) 1:1 ratio for all five metal ions, (B) 1:2 Cu(II): other metal ions, (C) 1:2 Co(II): other metal ions, (D) 1:2 Ni(II): other metal ions, (E) 1:2 Hg(II): other metal ions, and (F) 1:2 Mn(II): other metal ions.
The proposed sensor was successfully applied for simultaneous Cu(II), Co(II), Ni(II), Hg(II), and Mn(II) determination. The comparison between the performance of the proposed paper-based sensor and other paper-based sensors for heavy metal analysis by colorimetric methods is shown in Table 2. With the proposed sensor, more metals are detectable at once. In addition, the lowest detectable concentration is lower for Cu(II) and Ni(II), and Hg(II) compared to previous works. The linear range is wider for Cu(II) assay as well as Ni(II). The proposed device has a simple fabrication method, is easy to use and analyze, and can be applied for simultaneous screening and determination of five metal ions in various environmental water samples.
Table 2.
Comparison of the performance between the proposed paper-based sensor and other paper-based sensors based on wax printing fabrication method for heavy metal determination by colorimetric detection.
| Target Metal Ion | Lowest detectable concentration (mg L−1) | Complexing agent | Linear Range (mg L−1) | Device design | Ref. |
|---|---|---|---|---|---|
| Cu(II) | 0.32 | bathocuproine | 0.32–63.55 |  |
This work |
| Co(II) | 0.59 | 4-(2-pyridylazo) resorcinol | 0.59–4.71 | ||
| Ni(II) | 5.87 | dimethylglyoxime | 5.87–352.16 | ||
| Hg(II) | 0.20 | dithizone | 0.20–12.04 | ||
| Mn(II) | 0.11 | 4-(2-pyridylazo) resorcinol | 0.11–0.55 | ||
| Cu(II) | 15 | bathocuproine | 60–300 |  |
31 |
| Ni(II) | 15 | dimethylglyoxime | 30–300 | ||
| Cr(VI) | 2.4 | 1,5-diphenylcarbazide | 7.6–120 | ||
| Fe(III) | 15 | 1,10-phenanthroline | 30–300 | ||
| Hg(II) | 0.93 | dithizone | 1–30 |  |
55 |
| Fe(II) | 20 | 4,7-diphenyl-1– 1,10-phenanthroline | 100–1100 | 14 | |
| Ni(II) | 100 | dimethylglyoxime | 20–1300 | ||
| Cu(II) | 100 | dithiooxamide | 100–1300 | ||
| Cu(II) | 1.60 | bathocuproine | 5–80 |  |
56 |
| Ni(II) | 4.80 | dimethylglyoxime | 15–60 | ||
| Cr(VI) | 0.18 | 1,5-diphenylcarbazide | 0.50–10 |
Application of the proposed sensor for simultaneous five metal ions determination in real water samples
For Cu(II), Co(II), Ni(II), Hg(II), and Mn(II) determination in real water samples, the paper-based device was prepared with the optimized reagent conditions for one metal at a time. The real water samples included drinking, tap, and pond water. Drinking water was obtained from Nestlé Pure Life® as a product of Thailand. Tap and pond water were sampled from Chulalongkorn University. These samples were pretreated by filtration (0.45 μm) before use. Each target metal ion was spiked at three concentration levels in the three water samples. These samples were pH adjusted with pH 5 acetate buffer. For each concentration, each metal ion was spiked at a ratio of 1:1 for Cu(II), Co(II), Hg(II), and Mn(II) determination. Because Co(II) interferes with Ni(II), Ni(II) was spiked at three levels (0.800, 2.000, 4.000 mM) while Cu(II), Hg(II), and Mn(II) were spiked at 0.910 mM and Co(II) was spiked at 0.455 mM. The recoveries and %RSDs were determined to be in the range of 91–109% and 1.98–8.28% (Cu(II)), 100–120% and 0.80–3.48% (Co(II)), 101–107% and 2.58–5.49% (Ni(II)), 100–113% and 0.58–4.63% (Hg(II)), 112–125% and 0.68–2.92% (Mn(II)) for drinking, tap, and pond waters (Table 3–5). The accuracy of the proposed sensor was validated by a standard ICP-OES method with no significant difference (paired t-test, 95% confidence interval).57 The precision of the proposed method was evaluated using a single set of reagent conditions on a paper device and measuring the color intensity of each target metal ion (0.455 mM) on three devices on the same day (n = 15). The standard deviations (RSDs) were presented in the range of 3.98–5.77% (Cu(II)), 1.69–3.21% (Co(II)), 1.46–4.79% (Ni(II)), 2.08–4.66% (Hg(II)), 1.39–2.29% (Mn(II)). The proposed method showed acceptable accuracy and precision in accordance with The Association of Official Analytical Chemists (AOAC).58
Table 3.
Summary of the recovery test of the proposed sensor and the standard method (ICP-OES) for Cu(II), Co(II), Ni(II), Hg(II), and Mn(II) determination in drinking water.
| Metal ion | Added (mM) | Proposed sensor (n=5) | ICP-OES (n=3) | ||||
|---|---|---|---|---|---|---|---|
| Found (mM) | %Recovery | %RSD | Found (mM) | %Recovery | %RSD | ||
| Cu(II) | - | N.D. | N.D. | ||||
| 0.080 | 0.086 ± 0.031 | 108 | 8.28 | 0.094 ± 0.001 | 118 | 0.35 | |
| 0.400 | 0.415 ± 0.034 | 104 | 4.82 | 0.434 ± 0.003 | 109 | 0.63 | |
| 0.800 | 0.834 ± 0.064 | 104 | 5.70 | 0.825 ± 0.008 | 103 | 0.99 | |
| Co(II) | - | N.D. | N.D. | ||||
| 0.020 | 0.020 ± 0.013 | 100 | 2.65 | 0.021 ± 0.001 | 105 | 1.36 | |
| 0.040 | 0.041 ± 0.016 | 103 | 3.19 | 0.042 ± 0.002 | 105 | 3.07 | |
| 0.060 | 0.063 ± 0.004 | 105 | 0.80 | 0.076 ± 0.001 | 127 | 1.81 | |
| Ni(II) | - | N.D. | N.D. | ||||
| 0.800 | 0.835 ± 0.077 | 104 | 4.34 | 0.786 ± 0.001 | 98 | 0.05 | |
| 2.000 | 2.145 ± 0.083 | 107 | 2.70 | 2.168 ± 0.003 | 108 | 0.14 | |
| 4.000 | 4.179 ± 0.186 | 104 | 3.63 | 4.092 ± 0.009 | 102 | 0.21 | |
| Hg(II) | - | N.D. | N.D. | ||||
| 0.008 | 0.008 ± 0.003 | 100 | 2.91 | 0.008 ± 0.001 | 100 | 1.57 | |
| 0.020 | 0.022 ± 0.003 | 110 | 2.49 | 0.020 ± 0.001 | 100 | 0.59 | |
| 0.040 | 0.044 ± 0.001 | 110 | 0.58 | 0.040 ± 0.001 | 100 | 0.19 | |
| Mn(II) | - | N.D. | N.D. | ||||
| 0.0040 | 0.0047 ± 0.0005 | 118 | 0.68 | 0.0049 ± 0.0003 | 123 | 2.90 | |
| 0.0060 | 0.0072 ± 0.0013 | 120 | 1.78 | 0.0071 ± 0.0001 | 118 | 2.29 | |
| 0.0080 | 0.0096 ± 0.0010 | 120 | 1.27 | 0.0087 ± 0.0001 | 109 | 0.69 | |
N.D. none detectable.
Table 5.
Summary of the recovery test of the proposed sensor and the standard method (ICP-OES) for Cu(II), Co(II), Ni(II), Hg(II), and Mn(II) determination in pond water.
| Metal ion | Added (mM) | Proposed sensor (n=5) | ICP-OES (n=3) | ||||
|---|---|---|---|---|---|---|---|
| Found (mM) | %Recovery | %RSD | Found (mM) | %Recovery | %RSD | ||
| Cu(II) | - | N.D. | N.D. | ||||
| 0.080 | 0.081 ± 0.023 | 101 | 6.30 | 0.090 ± 0.001 | 113 | 0.46 | |
| 0.400 | 0.434 ± 0.035 | 109 | 4.87 | 0.417 ± 0.004 | 104 | 0.87 | |
| 0.800 | 0.748 ± 0.024 | 94 | 2.36 | 0.792 ± 0.006 | 99 | 0.81 | |
| Co(II) | - | N.D. | N.D. | ||||
| 0.020 | 0.022 ± 0.015 | 110 | 3.03 | 0.022 ± 0.001 | 110 | 4.16 | |
| 0.040 | 0.044 ± 0.012 | 110 | 2.31 | 0.039 ± 0.001 | 98 | 5.61 | |
| 0.060 | 0.066 ± 0.013 | 110 | 2.46 | 0.058 ± 0.001 | 97 | 2.82 | |
| Ni(II) | - | N.D. | N.D. | ||||
| 0.800 | 0.839 ± 0.098 | 105 | 5.49 | 0.786 ± 0.001 | 98 | 0.01 | |
| 2.000 | 2.128 ± 0.121 | 106 | 3.94 | 2.154 ± 0.004 | 108 | 0.27 | |
| 4.000 | 4.218 ± 0.157 | 105 | 3.05 | 4.087 ± 0.018 | 102 | 0.50 | |
| Hg(II) | - | N.D. | N.D. | ||||
| 0.008 | 0.008 ± 0.005 | 100 | 3.45 | 0.008 ± 0.001 | 100 | 1.68 | |
| 0.020 | 0.022 ± 0.006 | 110 | 4.46 | 0.022 ± 0.001 | 110 | 1.79 | |
| 0.040 | 0.044 ± 0.003 | 110 | 4.63 | 0.043 ± 0.001 | 108 | 0.91 | |
| Mn(II) | - | N.D. | N.D. | ||||
| 0.0040 | 0.0050 ± 0.0007 | 125 | 1.02 | 0.0045 ± 0.0001 | 113 | 2.15 | |
| 0.0060 | 0.0074 ± 0.0022 | 123 | 2.89 | 0.0067 ± 0.0003 | 112 | 2.80 | |
| 0.0080 | 0.0099 ± 0.0017 | 124 | 2.22 | 0.0084 ± 0.0004 | 105 | 3.13 | |
CU refers to Chulalongkorn University.
Conclusion
A paper-based sensor was designed for simultaneous Cu(II), Co(II), Ni(II), Co(II), and Mn(II) quantification using a set of five optimized reagent conditions on one device. The metals are detected by a colorimetric reaction between the metal ions and complexing agents in each detection zone. In addition, the device design consisted of two pretreatment zones with masking agents to increase specificity for the metals removing interfering ions. The orange Cu(Bc)2, pink Ni(DMG)2, pink-red Hg(DTZ)2, red Co(PAR)2, and red Mn(PAR)2 complexes demonstrated high selectivity for simultaneous Cu(II), Co(II), Ni(II), Hg(II), and Mn(II) analysis. The optimal conditions were determined to achieve the lowest detectable concentration of 0.005 mM (0.32 mg L−1), 0.010 mM (0.59 mg L−1), 0.100 mM (5.87 mg L−1), 0.001 mM (0.20 mg L−1), and 0.0020 mM (0.11 mg L−1) for Cu(II), Co(II), Ni(II), Hg(II), and Mn(II) determination, respectively. The lowest detectable concentration of Cu(II) was lower than regulation levels and Mn(II) was close to regulation levels for heavy metal ions in drinking water.4 The analytical performance was evaluated in three types of water samples. The results from the proposed paper-based sensor were compared to results from the standard ICP-OES method with good accuracy and precision. This proposed paper-based sensor demonstrated utility in real water samples with highly selective, sensitive, low cost, and simultaneous detection of Cu(II), Co(II), Ni(II), Hg(II), and Mn(II) by naked eye.
Supplementary Material
Table 4.
Summary of the recovery test of the proposed sensor and the standard method (ICP-OES) for Cu(II), Co(II), Ni(II), Hg(II), and Mn(II) determination in tap water.
| Metal ion | Added (mM) | Proposed sensor (n=5) | ICP-OES (n=3) | ||||
|---|---|---|---|---|---|---|---|
| Found (mM) | %Recovery | %RSD | Found (mM) | %Recovery | %RSD | ||
| Cu(II) | - | N.D. | N.D. | ||||
| 0.080 | 0.073 ± 0.021 | 91 | 5.69 | 0.093 ± 0.002 | 116 | 0.83 | |
| 0.400 | 0.410 ± 0.037 | 103 | 5.24 | 0.427 ± 0.002 | 107 | 1.45 | |
| 0.800 | 0.756 ± 0.021 | 95 | 1.98 | 0.805 ± 0.009 | 101 | 0.60 | |
| Co(II) | - | N.D. | N.D. | ||||
| 0.020 | 0.024 ± 0.004 | 120 | 0.83 | 0.021 ± 0.001 | 105 | 4.16 | |
| 0.040 | 0.047 ± 0.011 | 118 | 2.25 | 0.040 ± 0.001 | 100 | 5.61 | |
| 0.060 | 0.067 ± 0.018 | 112 | 3.48 | 0.058 ± 0.001 | 97 | 2.82 | |
| Ni(II) | - | N.D. | N.D. | ||||
| 0.800 | 0.856 ± 0.057 | 107 | 3.19 | 0.778 ± 0.002 | 97 | 0.10 | |
| 2.000 | 2.135 ± 0.082 | 107 | 2.68 | 2.145 ± 0.006 | 107 | 0.29 | |
| 4.000 | 4.056 ± 0.129 | 101 | 2.58 | 4.033 ± 0.016 | 101 | 0.29 | |
| Hg(II) | - | N.D. | N.D. | ||||
| 0.008 | 0.009 ± 0.001 | 113 | 1.86 | 0.008 ± 0.001 | 100 | 0.08 | |
| 0.020 | 0.022 ± 0.003 | 110 | 1.19 | 0.019 ± 0.001 | 95 | 0.30 | |
| 0.040 | 0.044 ± 0.003 | 110 | 2.25 | 0.040 ± 0.002 | 100 | 0.22 | |
| Mn(II) | - | 0.0047 ± 0.0026 | 0.0014 ± 0.0002 | ||||
| 0.0040 | 0.0092 ± 0.0012 | 113 | 1.61 | 0.0061 ± 0.0001 | 117 | 1.13 | |
| 0.0060 | 0.0114 ± 0.0023 | 112 | 2.92 | 0.0078 ± 0.0001 | 107 | 1.30 | |
| 0.0080 | 0.0139 ± 0.0013 | 115 | 1.55 | 0.0098 ± 0.0002 | 105 | 1.04 | |
Acknowledgments
This research was financially supported by the Development and Promotion of Science and Technology Talents Project (Royal Government of Thailand scholarship) under Henry Group (Colorado State University, United States) and Environmental Analysis Research Unit (Chulalongkorn University, Thailand). The device was partially fabricated by Electrochemistry and Optical Spectroscopy Research Unit (EOSRU), Department of Chemistry, Faculty of Science, Chulalongkorn University, Patumwan, Bangkok 10330, Thailand. CSH and RFM acknowledge support from the National Institutes of Health through R43 ES031906–01.
Footnotes
Conflict of interest
There is no conflict to declare.
ASSOCIATED CONTENT
References
- 1.Qu X, Xu W, Ren J, Zhao X, Li Y, and Gu X, J Hazard Mater, 2020, 400, 123135. [DOI] [PubMed] [Google Scholar]
- 2.Hoang HG, Lin C, Tran HT, Chiang CF, Bui XT, Cheruiyot NK, Shern CC, and Lee CW, Environmental Technology & Innovation, 2020, 20, 101043. [Google Scholar]
- 3.Jaishankar M, Tseten T, Anbalagan N, Mathew BB, and Beeregowda KN, Interdiscip Toxicol, 2014, 7, 60–72. [DOI] [PMC free article] [PubMed] [Google Scholar]
- 4.Pollution Control Department, MNRE Thailand. MNRE Decree on Industrial Effluent Standard B.E. 2016, Thailand, 2016. [Google Scholar]
- 5.Liu Y, Xue D, Li W, Li C, and Wan B, Microchemical Journal, 2020, 158, 105221. [Google Scholar]
- 6.Almeida LC, da Silva Junior JB, Dos Santos IF, de Carvalho VS, de Santana Santos A, Hadlich GM, and Ferreira SLC, Mar Pollut Bull, 2020, 158, 111423. [DOI] [PubMed] [Google Scholar]
- 7.Nyaba L and Nomngongo PN, Food Chem, 2020, 322, 126749. [DOI] [PubMed] [Google Scholar]
- 8.Hamida S, Ouabdesslam L, Ladjel AF, Escudero M, and Anzano J, Analytical Letters, 2018, 51, 2501–2508. [Google Scholar]
- 9.Endah SRN and Surantaatmadja SI, J. Phys. Conf. Ser, 2019, 1179, 12178. [Google Scholar]
- 10.Lo M, Diaw AKD, Gningue-Sall D, Oturan MA, Chehimi MM, and Aaron JJ, Luminescence, 2019, 34, 489–499. [DOI] [PubMed] [Google Scholar]
- 11.Huang W, Zhang Y, Li Y, Zeng T, Wan Q, and Yang N, Anal Chim Acta, 2020, 1126, 63–71. [DOI] [PubMed] [Google Scholar]
- 12.Xin X, Hu N, Ma Y, Wang Y, Hou L, Zhang H, and Han Z, Dalton Trans, 2020, 49, 4570–4577. [DOI] [PubMed] [Google Scholar]
- 13.Faridan A, Bahmae M, and Sharif AM, Anal. Bioanal. Electrochem, 2020, 12, 810–827. [Google Scholar]
- 14.Cate DM, Noblitt SD, Volckens J, and Henry CS, Lab Chip, 2015, 15, 2808–2818. [DOI] [PMC free article] [PubMed] [Google Scholar]
- 15.Jokerst JC, Emory JM, and Henry CS, Analyst, 2012, 137, 24–34. [DOI] [PubMed] [Google Scholar]
- 16.Chaiyo S, Siangphroh W, Apilux A, and Chailapakul O, Anal. Chim. Acta, 2015, 866, 75–83. [DOI] [PubMed] [Google Scholar]
- 17.Rattanarat P, Dungchai W, Cate DM, Siangproh W, Volckens J, Chailapakul O, and Henry CS, Anal Chim Acta, 2013, 800, 50–55. [DOI] [PMC free article] [PubMed] [Google Scholar]
- 18.Lu Y, Shi W, Jiang L, Qin J, and Lin B, Electrophoresis, 2009, 30, 1497–1500. [DOI] [PubMed] [Google Scholar]
- 19.Bracher PJ, Gupta M, Mack ET, and Whitesides GM, ACS Appl Mater Interfaces, 2009, 1, 1807–1812. [DOI] [PMC free article] [PubMed] [Google Scholar]
- 20.Martinez AW, Phillips ST, Wiley BJ, Gupta M, and Whitesides GM, Lab Chip, 2008, 8, 2146–2150. [DOI] [PMC free article] [PubMed] [Google Scholar]
- 21.Martinez AW, Bioanalysis, 2011, 3, 2589–2592. [DOI] [PubMed] [Google Scholar]
- 22.Dungchai W, Chailapakul O, and Henry CS, Analyst, 2011, 136, 77–82. [DOI] [PubMed] [Google Scholar]
- 23.Chaiyo S, Apiluk A, Siangproh W, and Chailapakul O, Sensors and Actuators B: Chemical, 2016, 233, 540–549. [Google Scholar]
- 24.Chabaud KR, Thomas JL, Torres MN, Oliveira S, and McCord BR, Forensic Chemistry, 2018, 9, 35–41. [Google Scholar]
- 25.Teengam P, Siangproh W, Tuantranont A, Vilaivan T, Chailapakul O, and Henry CS, Anal Chem, 2017, 89, 5428–5435. [DOI] [PMC free article] [PubMed] [Google Scholar]
- 26.Carrilho E, Martinez WA, and Whitesides MG, Anal. Chem, 2009, 81, 7091–7095. [DOI] [PubMed] [Google Scholar]
- 27.Firdaus ML, Aprian A, Meileza N, Hitsmi M, Elvia R, Rahmidar L, and Khaydarov R, Chemosensors, 2019, 7, 35–41. [Google Scholar]
- 28.Sharifi H, Tashkhourian J, and Hemmateenejad B, Anal Chim Acta, 2020, 1126, 114–123. [DOI] [PubMed] [Google Scholar]
- 29.Muhammad-Aree S and Teepoo S, Anal Bioanal Chem, 2020, 412, 1395–1405. [DOI] [PubMed] [Google Scholar]
- 30.Dong R-E, Kang P, Xu X-L, Cai L-X, and Guo Z, Sensors and Actuators B: Chemical, 2020, 312, 128013. [Google Scholar]
- 31.Rattanarat P, Dungchai W, Cate D, Volckens J, Chailapakul O, and Henry CS, Anal Chem, 2014, 86, 3555–3562. [DOI] [PubMed] [Google Scholar]
- 32.Wang H, Yang L, Chu S, Liu B, Zhang Q, Zou L, Yu S, and Jiang C, Anal Chem, 2019, 91, 9292–9299. [DOI] [PubMed] [Google Scholar]
- 33.Iwai H, Anal. Sci, 2017, 33, 1231–1236. [DOI] [PubMed] [Google Scholar]
- 34.Soares SAR, Costa SSL, Araujo RGO, Teixeira LSG, and Dantas AF, J AOAC Int, 2018, 101, 876–882. [DOI] [PubMed] [Google Scholar]
- 35.Palmer J, The Plymouth Student Scientist, 2014, 7, 151–184. [Google Scholar]
- 36.Mentele MM, Cunningham J, Koehler K, Volckens J, and Henry CS, Anal Chem, 2012, 84, 4474–4480. [DOI] [PubMed] [Google Scholar]
- 37.Britain G, Talanta, 1973, 20, 228–232.18961261 [Google Scholar]
- 38.Shahat A, Ali EA, and El Shahat MF, Sensors and Actuators B: Chemical, 2015, 221, 1027–1034. [Google Scholar]
- 39.Paradkar RP and Williams RR, Anal. Chem, 1994, 66, 2752–2756. [Google Scholar]
- 40.Azmi NA, Ahmad SH, and Low SC, RSC Advances, 2018, 8, 251–261. [Google Scholar]
- 41.Wilkins D and S. F., Anal. Chim. Acta, 1953, 9, 338–348. [Google Scholar]
- 42.Zhang Y, Jiang J, Li M, Gao P, Shi L, Zhang G, Dong C, and Shuang S, Sensors and Actuators B: Chemical, 2017, 238, 683–692. [Google Scholar]
- 43.Electrolytes, EFM, and Chemical equilibrium, https://drjvazque.files.wordpress.com/2012/2001/tablas-de-formacion-de-complejos.
- 44.Zhai J and Bakker E, Analyst, 2016, 141, 4252–4261. [DOI] [PubMed] [Google Scholar]
- 45.Chakrapani G, Murty DSR, Balaji BK, and Rangawamy R, Talanta, 1993, 40, 541–544. [DOI] [PubMed] [Google Scholar]
- 46.Pribil R and Vesely V, Talanta, 1961, 8, 270–275. [Google Scholar]
- 47.Doyle CM, Naser D, Bauman HA, Rumfeldt JAO, and Meiering EM, Anal Biochem, 2019, 579, 44–56. [DOI] [PubMed] [Google Scholar]
- 48.Zhou X, Nie J, and Du B, ACS Appl Mater Interfaces, 2015, 7, 21966–21974. [DOI] [PubMed] [Google Scholar]
- 49.Meredith NA, Volckens J, and Henry CS, Analytical Methods, 2017, 9, 534–540. [Google Scholar]
- 50.Raoot N and Raoot S, Talanta, 1981, 28, 327–328. [DOI] [PubMed] [Google Scholar]
- 51.Godycki LE and Rundle RE, Acta Cryst, 1953, 6, 487. [Google Scholar]
- 52.Ebrahimi B, Bahar S, and Moedi SE, JBraz. Chem. Soc, 2013, 24, 1832–1839. [Google Scholar]
- 53.Izquierdo A, Polyhedron, 1986, 5, 1007–1011. [Google Scholar]
- 54.Gazda DB, Fritz JS, and Porter MD, Anal. Chem, 2004, 76, 4881–4887. [DOI] [PubMed] [Google Scholar]
- 55.Li X, Ballerini DR, and Shen W, Biomicrofluidics, 2012, 6, 85214. [DOI] [PMC free article] [PubMed] [Google Scholar]
- 56.Sun X, Li B, Qi A, Tian C, Han J, Shi Y, Lin B, and Chen L, Talanta, 2018, 178, 426–431. [DOI] [PubMed] [Google Scholar]
- 57.Senila M, Drolc A, Pintar A, Senila L, and Levei E, Anal. Sci. Technol, 2014, 5. [Google Scholar]
- 58.AOAC International, Appendix K: Guidelines for Dietary Supplements and Botanicals, Part I, 2013. [Google Scholar]
Associated Data
This section collects any data citations, data availability statements, or supplementary materials included in this article.