

Abstract
Deactivation of the default mode network (DMN) is one of the most reliable observations from neuroimaging and has significant implications in development, aging, and various neuropsychiatric disorders. However, the neural mechanism underlying DMN deactivation remains elusive. As the coordination of regional neurochemical substrates and interregional neural interactions are both essential in support of brain functions, a quantitative description of how they impact DMN deactivation may provide new insights into the mechanism. Using an n-back working memory task fMRI and magnetic resonance spectroscopy, we probed the pairwise relationship between task-induced deactivation, interregional functional connectivity and regional excitation-inhibition balance (evaluated by glutamate/GABA ratio) in the posterior cingulate cortex/precuneus (PCC/PCu). Task-induced PCC/PCu deactivation correlated with its excitation-inhibition balance and interregional functional connectivity, where participants with lower glutamate/GABA ratio, stronger intra-DMN connections and stronger antagonistic inter-DMN interactions had greater PCC/PCu deactivation. Mediation analyses revealed that the DMN-salience network functional interactions partially mediated the relationship between task-induced deactivation and the excitation-inhibition balance at the PCC/PCu. The triple-relationship discovered in the present study has the potential to bridge DMN-deactivation related findings from various neuroimaging modalities and may provide new insights into the neural mechanism of DMN deactivation. Moreover, this finding may have significant implications for neuropsychiatric disorders related to the DMN dysfunction and suggests an integrated application of pharmacological and neuromodulation-based strategies for rescuing DMN deactivation deficits.
Keywords: Default mode network, fMRI, functional connectivity, magnetic resonance spectroscopy, task-based deactivation
Introduction
The default mode network (DMN; Raichle et al., 2001), anchored by posterior cingulate cortex / precuneus (PCC/PCu), medial prefrontal cortex (mPFC), and inferior parietal lobule (IPL), is characterized by increased activity during active engagement in internal thoughts (Andrews-Hanna et al., 2014) and decreased activity when performing externally-oriented tasks (Fox et al., 2005; Buckner et al., 2008). As the external cognitive task load increases, DMN deactivation becomes stronger (Singh and Fawcett, 2008; Hu et al., 2013), suggesting that a reallocation of cognitive resources to extrinsic tasks necessitates a suppression of the intrinsic brain activity in the DMN. In addition, better cognitive performances have been associated with greater task-induced DMN deactivation (Anticevic et al., 2010). Remarkably, aging (Sambataro et al., 2010; Prakash et al., 2012) and various brain disorders (Anticevic et al., 2012a) have been linked to failure to suppress DMN activity. Despite accumulating observations of DMN deactivation and its significant implications in psychiatric disorders, the underlying neural mechanism of DMN deactivation remains elusive.
Recent efforts have been made to integrate multiple neurobiological metrics measured with different imaging modalities to achieve a more complete view of brain functioning. The pairwise relationships between task-induced activity, interregional functional connectivity, and regional neurotransmitter concentrations have been examined in recent years (Northoff et al., 2007; Muthukumaraswamy et al., 2009; Mennes et al., 2010; Stagg et al., 2011; Hu et al., 2013; Kapogiannis et al., 2013; Zou et al., 2013; Schmitz et al., 2017). Emerging concepts indicate that intra- and inter-network interactions of large-scale brain networks underlie brain functions (Seeley et al., 2007; Menon, 2011). Specifically, growing evidence has shown that task-elicited brain activity and task performance are closely related to the intrinsic intra-DMN activity (Hampson et al., 2006; Zou et al., 2013) and the DMN interactions with two other major large-scale networks - the executive control network (ECN) and the salience network (SN) (Hampson et al., 2010; Mennes et al., 2010; Fornito et al., 2012; Lerman et al., 2014; Liang et al., 2015).
In parallel, recent studies combining fMRI and magnetic resonance spectroscopy (MRS) have demonstrated that regional glutamate and GABA concentrations modulate both regional neural activity and inter-regional functional connectivity (Northoff et al., 2007; Hu et al., 2013; Kapogiannis et al., 2013; Schmitz et al., 2017). These studies suggest that regional brain responses to tasks, interregional functional connections, and neurotransmitter concentrations are highly related to each other. However, a more complete, quantitative description of the relationship among these three neurophysiological measures related to DMN deactivation is still lacking. The current study, therefore, aimed to examine a triple-relationship between task-induced deactivation, interregional functional connectivity, and regional neurotransmitter levels associated with DMN. Such a triple-relationship may shed light on the neural mechanism of DMN deactivation and provide valuable information towards the development of neuromodulation-based interventional strategies for neuropsychiatric disorders associated with DMN dysfunction.
We further constructed a mediation model based on a model conceptualized at the cellular level, in which the local neurotransmitters serve as infrastructure-like substrates that determine or influence the likelihood of local neuronal firing and the responsiveness to remote inputs, which in turn affect the local neuronal activity via postsynaptic excitation / inhibition (McCormick, 1990). We scaled up this model by placing the glutamate/GABA ratio, an approximate index of the local excitation-inhibition balance, as the independent variable, and the interregional functional connectivity as the mediator to explain DMN deactivation at the system level. To test this hypothesis, we collected n-back working memory (WM) fMRI data known to deactivate the DMN (Owen et al., 2005; Tomasi et al., 2006) and MRS data to quantify glutamate and GABA concentrations in the PCC/PCu (a key functional hub of the DMN). Intra- and inter-network interactions were assessed by functional connectivity analysis with PCC/PCu as the seed region. A test model in which functional connectivity mediates the relationship between the neurotransmitter concentration at the PCC/PCu and the task-induced deactivation within the same region was evaluated.
Materials and Methods
Participants
Participants were 65 healthy adults (36 males; age range: 17 – 49 years; mean ± SD of age: 30.5 ± 9.2 years) pooled from two fMRI studies. Written informed consent, approved by the Institutional Review Board of the National Institute on Drug Abuse, was obtained from each participant prior to study enrollment. All participants had no major medical conditions, no history of neurological or psychiatric disorders, no history of substance abuse, and were not on medication that would affect neurotransmitter levels or cortical inhibition and excitation during the study participation. The 35 participants in Cohort 1 and the 30 participants in Cohort 2 both underwent a high-resolution anatomical scan and n-back WM fMRI scans on a Siemens 3T Allegra scanner (Cohort 1) or Trio scanner (Cohort 2) (Hu et al., 2013; Liang et al., 2015). In addition, the 30 participants from Cohort 2 also received single-voxel proton MRS scans for GABA and glutamate quantification at the PCC/PCu prior to the WM fMRI scan.
MRS Acquisition and Quantification
Single-voxel proton MRS data was acquired at the PCC/PCu of interest (voxel size: 24×32×36 mm3), using a MEGA-PRESS sequence (TE/TR = 68/5000 ms; 96 averages) and a PRESS sequence (TE/TR = 30/3000 ms; 128 averages) to detect GABA (Rothman et al., 1984; Mescher et al., 1998) and glutamate (Mullins et al., 2008; Hancu, 2009) signals, respectively. The editing pulses used in the MEGA-PRESS sequence were applied before and after the second refocusing pulse of PRESS, with a duration of 19.9 ms and a bandwidth of 45 Hz. They were applied alternatively at frequency of either 1.9 ppm (edit on) or 7.5 ppm (edit off), i.e. GABA is measured without macromolecule suppression. There were two loops in the MEGA-PRESS sequence: the inner loop of interleaved edit on/off and the outer loop of measurement average. Field map shimming was performed before MRS scans to ensure the line-width of water less than 14 Hz. Spectra of water were acquired using the same MEGA-PRESS and PRESS sequences respectively (number of averages = 16) by turning off the water suppression.
MRS data was quantified by fitting the MR spectra with a linear combination of basis sets using LCModel (Wu et al., 2007; Donahue et al., 2009). Different basis sets generated from the simulations of the MEGA-PRESS and PRESS sequences were used for GABA and glutamate quantifications respectively. Maximum-likelihood estimates of the metabolite concentrations and their uncertainties, indicated by the Cramer-Rao lower bounds (CRLB), were obtained. Spectra were excluded from further analysis if CRLB for GABA or glutamate was higher than 20%. Both GABA and glutamate concentrations were referenced to the unsuppressed partial-volume-corrected water concentration (Geramita et al., 2011). Ratio of glutamate over GABA concentration level (denoted as Glu/GABA ratio) was computed as a measure of local excitation-inhibition balance.
N-back Working Memory Task Paradigm
All 65 participants performed an n-back WM task with verbal stimuli (Owen et al., 2005) during the task fMRI scan. They were asked to monitor the letters back-projected on a screen inside the scanner and to respond by pressing a button whenever a presented letter is the same as the one presented n trials before (n = 1, 2, and 3). Each letter was displayed for 500 ms, followed by an inter-stimulus interval of 1500 ms. The task was presented in a block-design pattern, with each block consisting of one condition only [either one-back (1b), two-back (2b), or three-back (3b) condition]. A vigilance task block was included as a control condition, during which participants were required to respond to letter ‘D’ [zero back (0b)]. A 2 s visual instruction preceded each block to indicate the upcoming condition. All 4 conditions were repeated six times. Within each repetition, the 0b block was placed at the beginning and the order of the 1b, 2b, and 3b blocks was counter-balanced following the 0b block. The block durations of all n-back conditions for the two cohorts were 60 s for Cohort 1 and 30 s for Cohort 2 respectively. The primary behavioral measurement of task performance was dprime, estimated by the hit rate penalized by the false alarm rate (Haatveit et al., 2010).
FMRI Acquisition and Preprocessing
WM task BOLD fMRI data with whole-brain coverage were collected using a single-shot GE-EPI sequence (TR/TE = 2000/27 ms; FA = 78°; slice thickness/gap = 4/0 mm; in-plane resolution = 3.44×3.44 mm2; number of slices = 39). High-resolution T1-weighted anatomical images were acquired (TR/TE = 2500/4.38 ms; TI = 1000 ms; FA = 8°; in-plane resolution = 1×1×1 mm3) for structural reference and spatial normalization.
All fMRI data were preprocessed and analyzed in AFNI (Version AFNI_16.0.12) (Cox, 1996). The preprocessing steps included slice-timing and motion correction, quadratic detrending, Gaussian spatial smoothing (FWHM = 6 mm), and spatial normalization to Talairach space. Nonlinear registration using implicit template were then applied to further improve cross-subject alignment (Geng et al., 2009).
WM Task Activation / Deactivation
First-level individual activation maps under the 1b, 2b, and 3b WM conditions versus the vigilant 0b condition were obtained with general linear model analysis. The general linear model was constructed to include the following regressors: (1) four task regressors representing the 0b, 1b, 2b, and 3b conditions, generated by convolving task blocks with a canonical hemodynamic response function (HRF); (2) six motion nuisance regressors to account for head motion. A second-level whole-brain repeated-measure ANOVA analysis was conducted on the 35 n-back activation maps from Cohort 1 to obtain the group activation maps showing the WM effects. The activation map was thresholded at corrected p < 0.05 (corresponding to uncorrected p < 0.001 [F(2,68) = 7.66] and cluster threshold of 837 mm3, whole-brain corrected using Monte Carlo simulations) and will be used in the following voxel-wise regression analysis as the constriction mask in search of the regions whose connection strength with the PCC/PCu correlate with its deactivation. To delineate the PCC/PCu for the subsequent region of interest (ROI) analysis, the threshold was further increased to p = 1e-4 so that the deactivation cluster encompassing the PCC/PCu will be confined to the PCC/PCu area (shown as the seed region in Fig. 1). Individual mean BOLD signal percentage changes were extracted from the PCC/PCu ROI as a quantification index of the DMN deactivation.
Fig. 1.
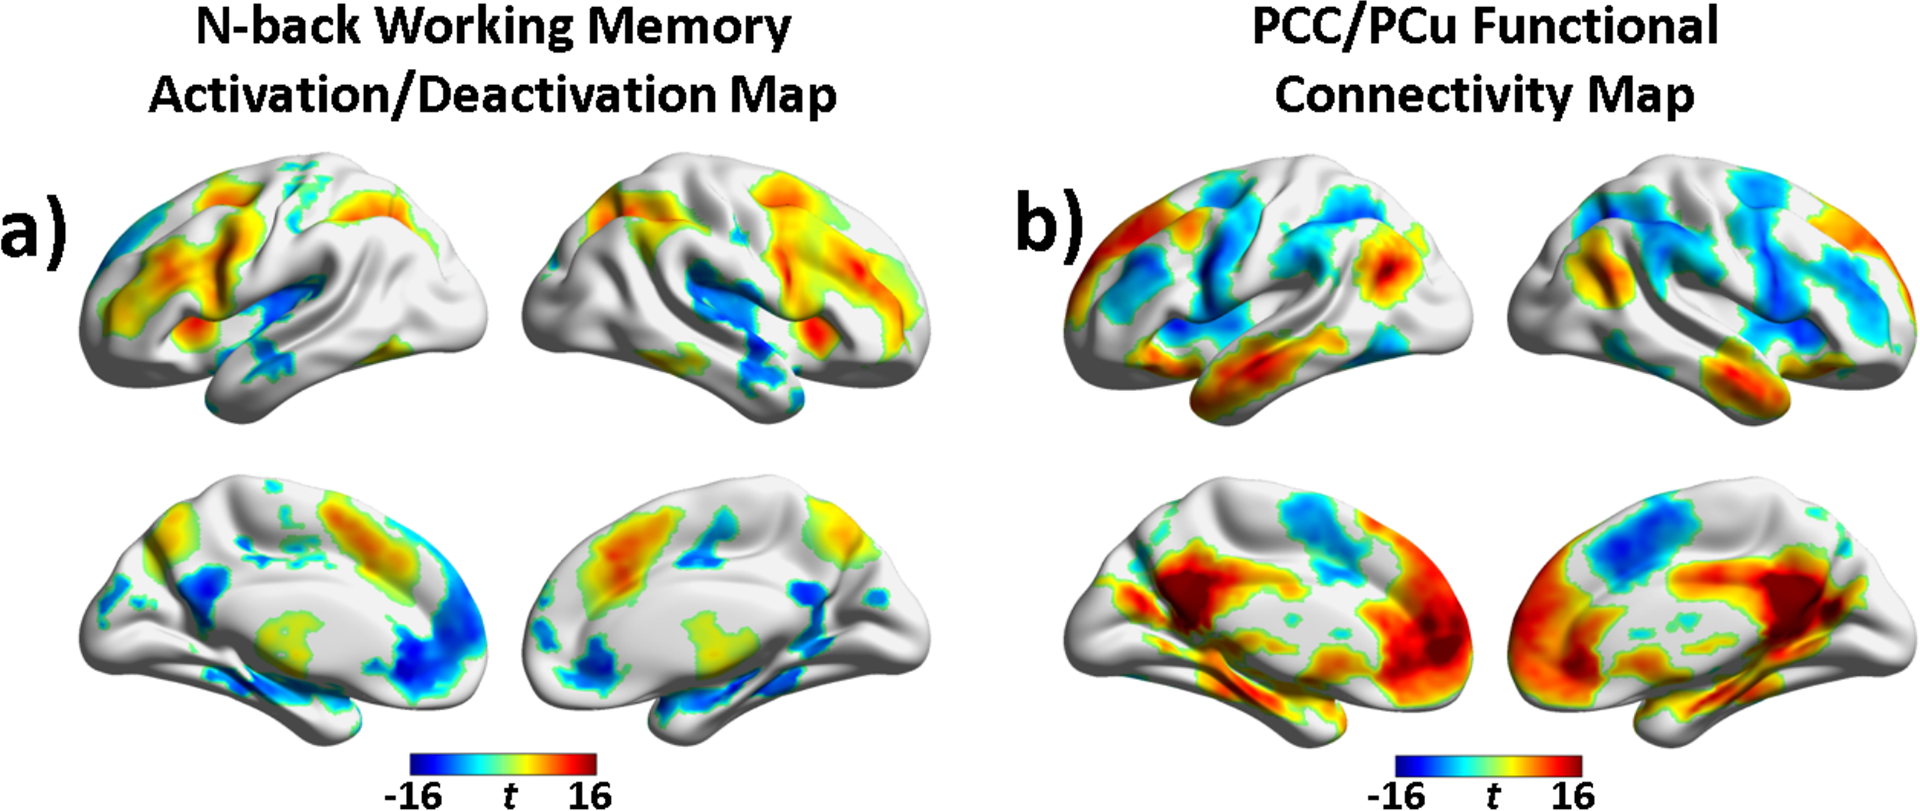
(a) Bain areas showing working memory task effects (puncorrected < 0.001; cluster size = 837 mm3). T statistic map at the 3-back vs. 0-back contrast was displayed to illustrate task-induced activation and deactivation. (b) The default mode network map generated by seed-based functional connectivity analysis of the task-response removed residual fMRI data (seed: PCC/PCu; puncorrected < 0.001; cluster size = 702 mm3]).
Functional Connectivity Analysis
Functional connectivity strength between PCC/PCu and other brain regions in the n-back task context was assessed with n-back task-removed residual time courses, which were generated by high-pass temporal filtering (cutoff frequency: 0.01 Hz), removal of task-induced neural responses under all four conditions (0b, 1b, 2b, and 3b), and regressing out nuisance variables including six motion time courses and eight principal time courses extracted from respective white matter and cerebrospinal fluid (CSF) fluctuations. The task-induced responses at all four task conditions were modeled using finite impulse response modeling during the regression (implemented as the TENT function in 3dDeconvolve in AFNI), so that the task effects can be more adequately removed than using a fixed canonical HRF model by taking into account the spatial variation of the HRF. Instead of using a pure resting-state design, we preferred this method because previous studies have demonstrated that psychological context can influence the ensuing functional connectivity recorded at rest (Lewis et al., 2009; Tung et al., 2013) and we want to probe the network interactions in the context of the actual task but not during a completely different psychological (“rest”) state.
To minimize head motion induced spurious functional connectivity, the following strategies have been employed: (i) censor data points when the instantaneous head motion (quantified by frame displacement: FDi = |Δdix| + |Δdiy| + |Δdiz| + |Δαi| + |Δβi| + |Δγi|) was larger than 0.5 mm (Power et al., 2012); (ii) exclude participants whose mean head motion index, i.e. , was larger than 0.25 mm; and (iii) include mean FD index as a covariate in the following regression analysis.
The PCC/PCu ROI delineated by the n-back task performed by Cohort 1 was then used as the seed region in the functional connectivity analysis to identify the brain regions functionally connected to the PCC/PCu. Specifically, individual functional connectivity map was generated by correlating the task-removed residual time course of each voxel with the mean reference time course of the seed PCC/PCu region and then converting the correlation value to z value via Fisher’s r-to-z transformation. The group PCC/PCu functional connectivity map was obtained via one-sample t-test and thresholded at corrected p < 0.05 (corresponding to uncorrected p < 0.001 and cluster threshold of 702 mm3, whole-brain corrected using permutation test implemented in 3dttest++ in AFNI).
To demonstrate the salience network (SN), executive-control network (ECN), DMN, and their overlap with task activated and deactivated regions, we performed group ICA on the task-response removed residual fMRI data using MELODIC (FMRIB Analysis Group, Oxford University). The number of component was set at 20 and the decomposition approach set as temporal concatenation. The group ICA spatial maps were converted to z score maps and then thresholded at z = 5 via a mixture model fit to identify voxels contributing to each independent component (Beckmann and Smith, 2004).
Relationships between Neurotransmitter Concentration, Task Deactivation and Interregional Functional Connectivity
To investigate which PCC/PCu related brain circuits correlate with the task-induced deactivation levels, a voxel-wise regression analysis, confined to the brain areas showing WM effects, was performed on the 35 PCC/PCu functional connectivity maps against the individual mean BOLD signal changes at 3b in the PCC/PCu, including age and motion index FD as nuisance covariates. Age was included in the model because of its significant influence on the DMN deactivation (Grady et al., 2006; Spreng and Schacter, 2012). The deactivation-predictive circuits were identified by a voxel-level threshold of p < 0.01 combined with a cluster threshold of 972 mm3.
Depending on their locations, the identified influential regions in the regression analysis was grouped into three networks as SN, ECN, and DMN. Similar as the strategy proposed by Shen et al. (2017), the mean functional connectivity strength between PCC/PCu and the three networks was extracted from the 30 PCC/PCu functional connectivity maps of Cohort 2 to test whether this deactivation-predictive model derived from Cohort 1 can be generalized to independent datasets. To investigate the relationship between network interactions and regional excitation-inhibition balance, the mean inter- and intra-DMN network functional connectivity strength was regressed against the Glu/GABA ratio, controlling for age, sex, head motion, and GM volume fraction. The relationship between the Glu/GABA ratio at rest and the task-induced deactivation at the PCC/PCu region was interrogated by entering individual mean PCC/PCu deactivation responses into a regression model against the individual Glu/GABA ratios, including age, sex, head motion, and GM volume fraction as covariates.
Mediation Analysis
The inter-DMN (PCC/PCu – SN and PCC/PCu – ECN) and intra-DMN (PCC/PCu – DMN) circuits, whose connectivity strength showed significant correlation with both task-induced deactivation and excitation-inhibition balance at the PCC/PCu, will enter the ensuing mediation analysis as a mediator. We tested our hypothesis that the functional connectivity strength, which showed influential power on PCC/PCu deactivation, mediates the relationship between the local excitation-inhibition balance (as measured by Glu/GABA ratio) and the task-induced BOLD deactivation level. The mediated (indirect path from Glu/GABA ratio to BOLD deactivation through inter-network coupling) model was tested against the unmediated (direct path from Glu/GABA ratio to BOLD deactivation) model using the PROCESS macro in SPSS, with age, sex, head motion, and GM volume fraction controlled (Preacher and Hayes, 2004; Hayes and Preacher, 2014). Significance of the models was evaluated by both bootstrapping (5,000 iterations) confidence intervals and the more conservative Sobel test (Hayes and Scharkow, 2013). Mediation effect was considered significant if zero does not fall into the confidence interval for bootstrapping testing.
Results
Two cohorts of participants were included in the present analysis. Participants in both Cohort 1 and 2 underwent the n-back WM fMRI task scan. In addition, participants in Cohort 2 have GABA and glutamate concentrations at the PCC/PCu quantified via single-voxel 1H MRS scans prior to the WM task scan. Cohort 1, consisting of 35 participants from a previous study (Liang et al., 2015), was used to 1) localize brain regions responding to the WM task and define the PCC seed ROI; and 2) identify the inter-DMN (i.e. PCC-ECN and PCC-SN) and intra-DMN circuits whose strengths were associated with the PCC deactivation via voxel-wise search. Cohort 2, consisting of 24 participants from Hu et al. (2013) and 6 new participants, was used to 1) validate the relationship between the inter-/intra-DMN functional circuits and the PCC deactivation in the same brain regions identified from Cohort 1; and 2) test the hypothesized triple relationships among the PCC deactivation, inter-/ intra-DMN circuit strengths, and local glutamate/GABA concentrations .
Task-induced Deactivation in PCC/PCu (Cohort 1)
Behavioral data showed a WM load effect on task accuracy as measured by dprime in both Cohort 1 (F(3,102) = 163.289, p = 8.4e-39) and Cohort 2 (F(3,87) = 32.196, p = 4.3e-14). The task accuracy was gradually decreased as the task difficulty increased from 0-back (0b) to 3-back (3b). Voxel-wise repeated-measures ANOVA analysis on blood oxygenation level dependent (BOLD) signal changes at 1-, 2-, and 3-back condition (relative to the 0b control condition) revealed significant task activated and deactivated regions (Fig. 1a and Supplemental Fig. S1; Table S1). Post-hoc t-tests on mean BOLD signal changes in the PCC/PCu region revealed that the PCC/PCu deactivation at 1-back (1b) was less deactivated than at 2-back (2b) (Cohort 1: t(34) = 5.42, p = 5e-6; Cohort 2: t(29) = 5.39, p = 9e-6) and 3-back (3b) (Cohort 1: t(34) = 6.07, p = 1e-6; Cohort 2: t(29) = 5.65, p = 4e-6), but no difference was found between 2b and 3b (Cohort 1: t(34) = −.20, p = .84; Cohort 2: t(29) = 1.10, p = .28). Importantly, the mean BOLD signal changes in the PCC/PCu were negatively correlated with WM task accuracy index dprime (r = −.31, p = .014), i.e. greater PCC/PCu deactivation were associated with better WM task performance, controlling for two task paradigms.
Functional Connectivity of PCC/PCu (Cohort 1)
The interaction between PCC/PCu and other brain regions in the n-back task context was evaluated on the WM task-response-removed residual fMRI data using PCC/PCu as seed ROI. As seen in Fig. 1b and Supplemental Fig. S2, the group PCC/PCu functional connectivity map in the n-back WM context exhibited the typical DMN pattern and confirmed that the PCC/PCu was functionally connected to mPFC/ACC, bilateral inferior parietal lobe [IPL; BA7,19], bilateral middle temporal gyrus, and bilateral parahippocampal gyrus [PHg]. Besides these positive correlated regions, the PCC/PCu also demonstrated strong negative correlation with ECN regions (involving bilateral dorsolateral prefrontal cortex [dlPFC; BA9,10], bilateral lateral premotor [BA6], and bilateral IPL [BA40]) and SN regions (including bilateral anterior insula [AI] and posterior medial frontal cortex (including dACC and pre-supplementary motor area [pre-SMA; BA32,6]). For illustration purpose, group independent component analysis (ICA) on the task-removed residual fMRI time series was performed to identify the SN, ECN, and DMN. Comparing the WM task-induced activation/deactivation maps (Supplemental Fig. S1) with the ICA-generated SN, ECN, and DMN network maps (Supplemental Fig. S3), we can see that the n-back task activated regions were mostly overlapped with the ECN and SN, while the task deactivated regions were largely overlapped with the DMN.
Association of Functional Connectivity of PCC/PCu with its Deactivation (Cohort 1)
To identify brain regions, which responded to the WM task and whose functional connectivity strength with the PCC/PCu were associated with the PCC/PCu deactivation, a voxel-wise regression analysis was conducted on the PCC/PCu functional connectivity maps against the WM-induced deactivation at 3b within the regions showing WM main effects (Fig. 1b and Supplemental Fig. S2), controlling for age and head motion. The voxel-wise regression analysis on datasets collected from Cohort 1 revealed that the PCC/PCu deactivation was positively correlated with both the DMN - SN inter-network coupling (comprising PCC/PCu - bilateral AI and PCC/PCu - dACC/pre-SMA circuits) and the DMN - ECN coupling (including connection between PCC/PCu and bilateral IPL, bilateral premotor cortex, and right dlPFC) (Fig. 2 and Supplemental Fig. S4; Table 1). In contrast, the intra-DMN network coupling (consisting of within PCC/PCu connection, PCC/PCu - mPFC, and PCC/PCu - left PHg connections) was negatively associated with the PCC/PCu deactivation (Fig. 2 and Supplemental Fig. S4; Table 1).
Fig. 2.
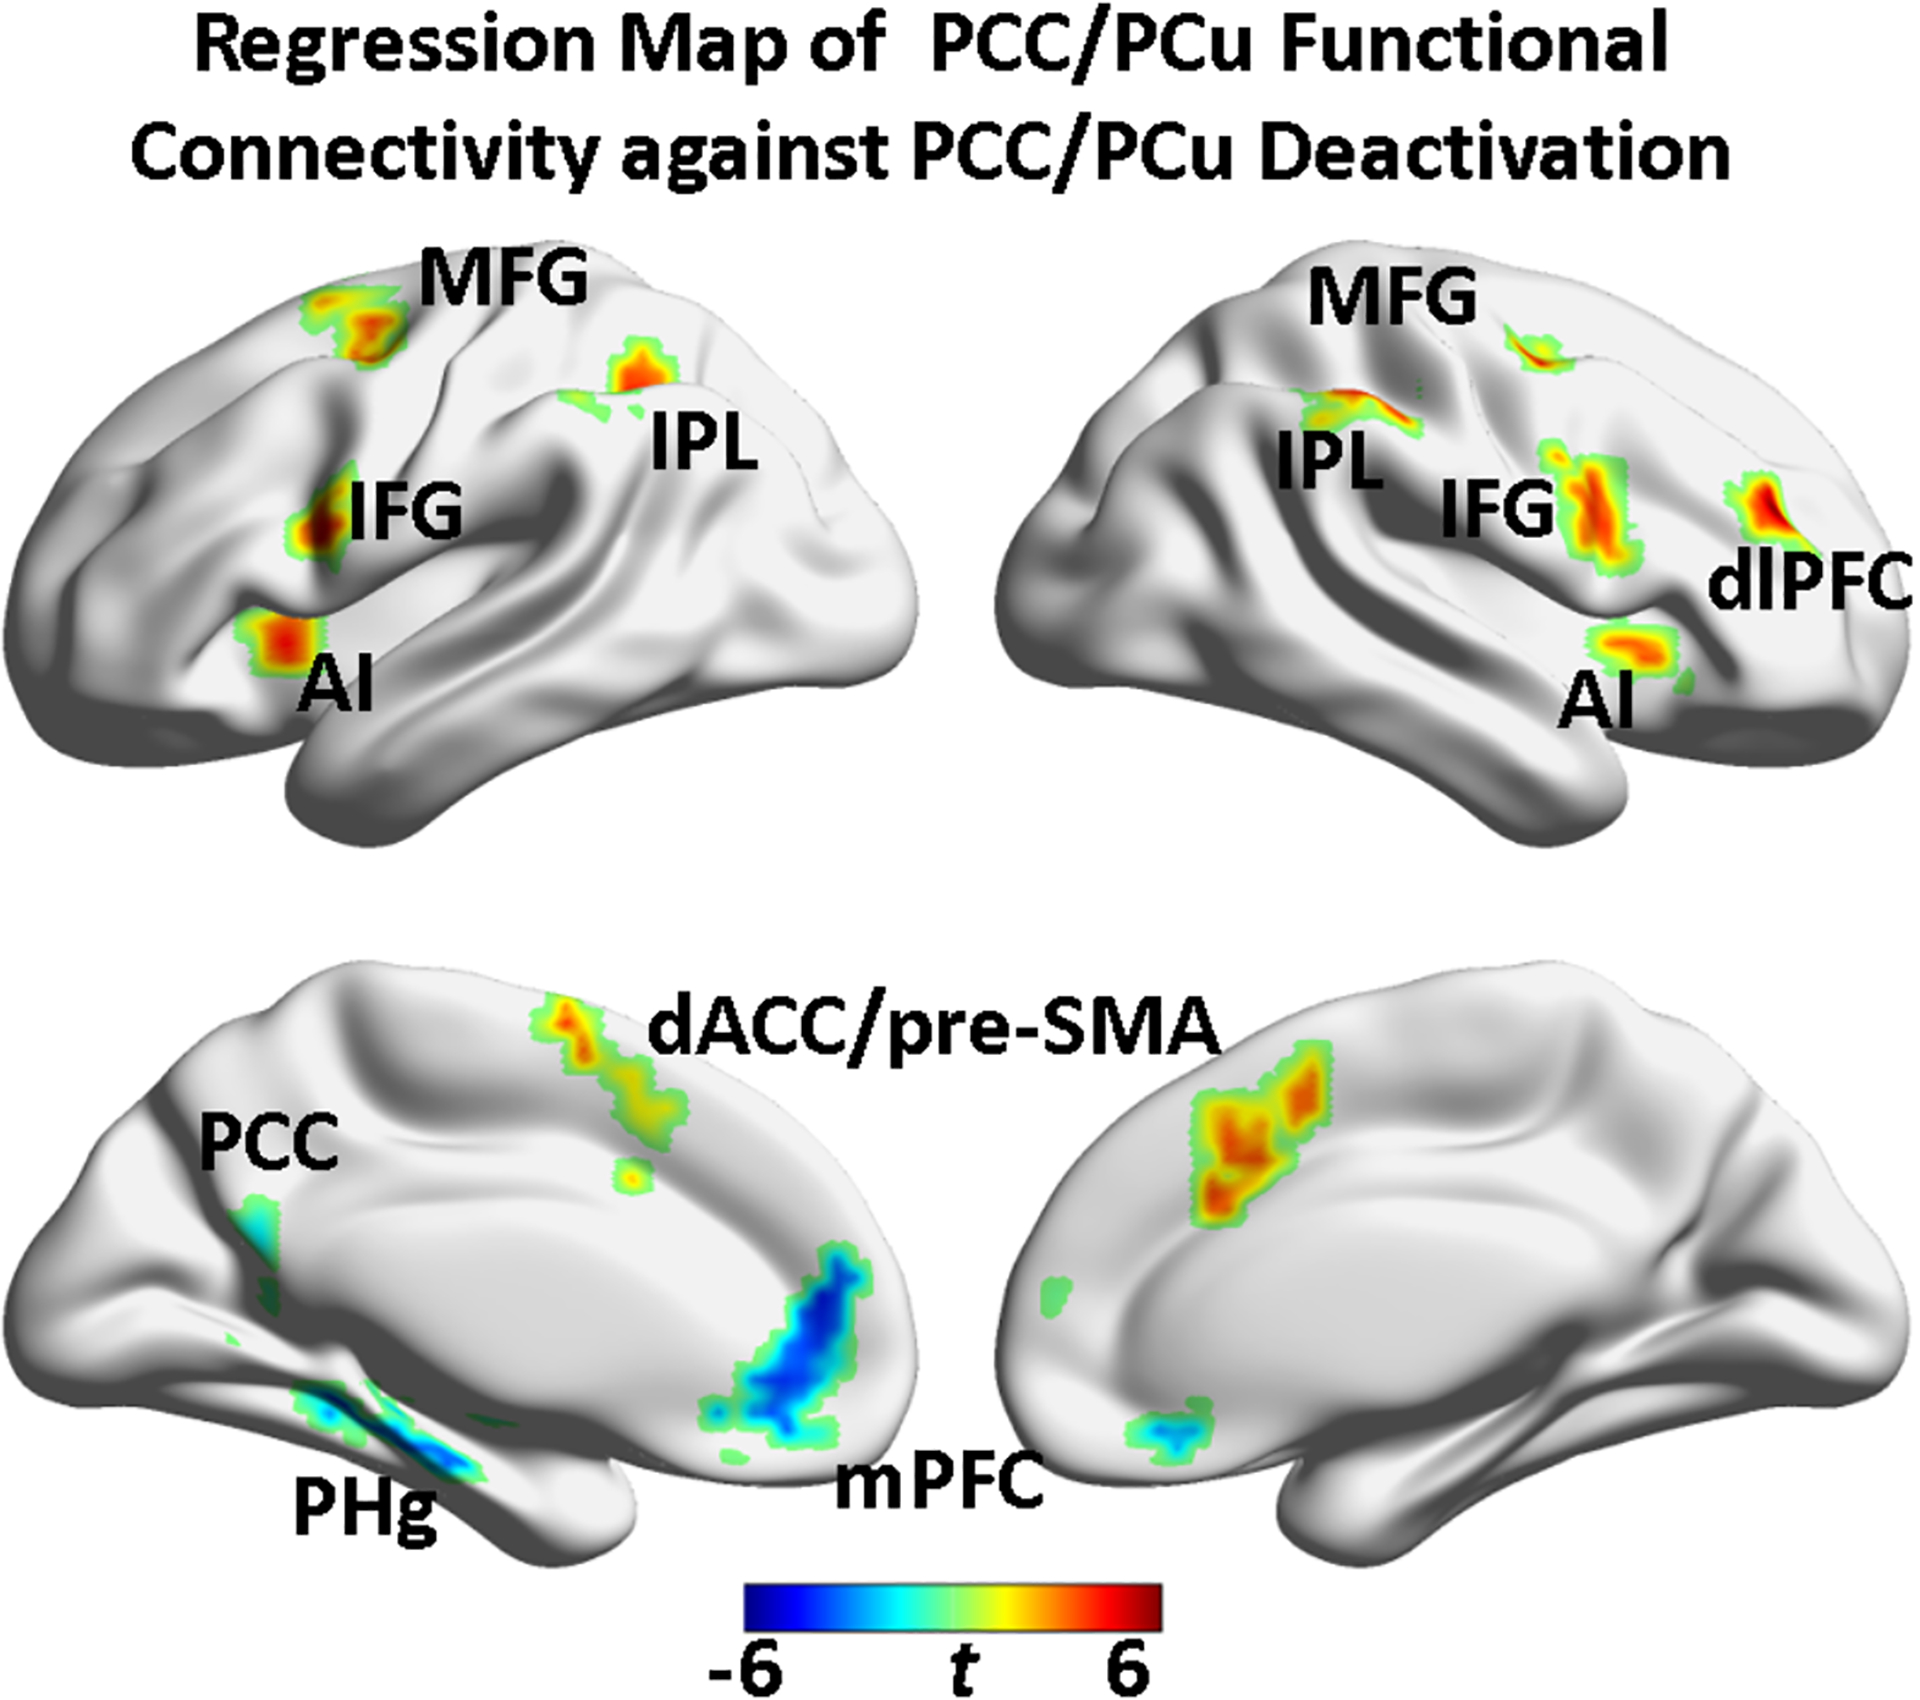
Regression map of PCC/PCu functional connectivity against PCC/PCu deactivation (covariates: age and head motion). The inter-DMN (PCC/PCu-SN and PCC/PCu-ECN) and intra-DMN connectivity strength were differentially associated with the working memory task-induced deactivation in the same PCC/PCu region (puncorrected < 0.01 and cluster size = 972 mm3). The yellow-orange color indicated positive correlation and the cyan-blue color indicated negative correlation. PCC/PCu: posterior cingulate cortex / precuneus; MFG: middle frontal gyrus; IFG: inferior frontal gyrus; IPL: inferior parietal lobule; dlPFC: dorsolateral prefrontal cortex; AI: anterior insula; dACC/pre-SMA: dorsal anterior cingulate cortex/pre-supplementary motor area; mPFC: medial prefrontal cortex; PHg: parahippocampal gyrus; SN: salience network; ECN: executive control network; DMN: default mode network.
Table 1.
Brain regions whose connection strength with the PCC/PCu was related with the seed region deactivation level at the 3-back WM load.
| Network | Brain Regions (Brodmann Area) | Hemisphere | Peak Coordinates (Talairach: x,y,z) | Cluster Size (Voxels) |
|---|---|---|---|---|
| Salience Network | dACC/pre-SMA (32) | Bilateral | (8. 17. 44) | 120 |
| Anterior insula (13) | Left | (−31, 17, 5) | 71 | |
| Anterior insula (13) | Right | (38, 17, 5) | 39 | |
| Executive Control Network | Inferior parietal lobule (40) | Left | (−55, −40, 38) | 144 |
| Inferior frontal gyrus (9, 44) | Right | (56, 5, 26) | 98 | |
| Middle frontal gyrus (6) | Left | (−25, −3, 63) | 85 | |
| Inferior frontal gyrus (9, 44) | Left | (−55, 11, 26) | 77 | |
| dlPFC | Right | (38, 44, 38) | 74 | |
| Inferior parietal lobule (40) | Right | (50, −40, 53) | 61 | |
| Middle frontal gyrus (6) | Right | (38, −7, 59) | 47 | |
| Inferior parietal lobule (40) | Right | (35, −49, 41) | 41 | |
| Default Mode Network | Medial frontal gyrus (10) | Bilateral | (−7, 50, 20) | 121 |
| PCC/PCu (30) | Left | (−7, −61, 11) | 76 | |
| Parahippocampal gyrus (36) | Left | (−25, −37, −4) | 63 |
Association of Functional Connectivity of PCC/PCu with its Deactivation (Cohort 2)
Three network-level interaction indices, namely DMN-SN, DMN-ECN, and intra-DMN, were created by averaging functional connectivity strength of the corresponding networks composed by the above-identified brain regions. As shown in Fig. 3a, the three inter- and intra-DMN indices demonstrated differential association with the PCC/PCu deactivation. Consistent with the findings in Cohort 1 (Fig. 3a), datasets in Cohort 2 demonstrated similar relationships between the constructed inter- and intra-DMN network-level interaction indices and the task-induced PCC/PCu deactivation after controlling for age and head motion (Fig. 3b), i.e. stronger negative inter-network connectivity strength corresponded to greater PCC/PCu deactivation (DMN - SN: r = 0.62, p = 0.0002; DMN - ECN: r = 0.47, p = 0.008), while higher positive intra-DMN connectivity was associated with greater PCC/PCu deactivation (r = −0.51, p = 0.004).
Fig. 3.
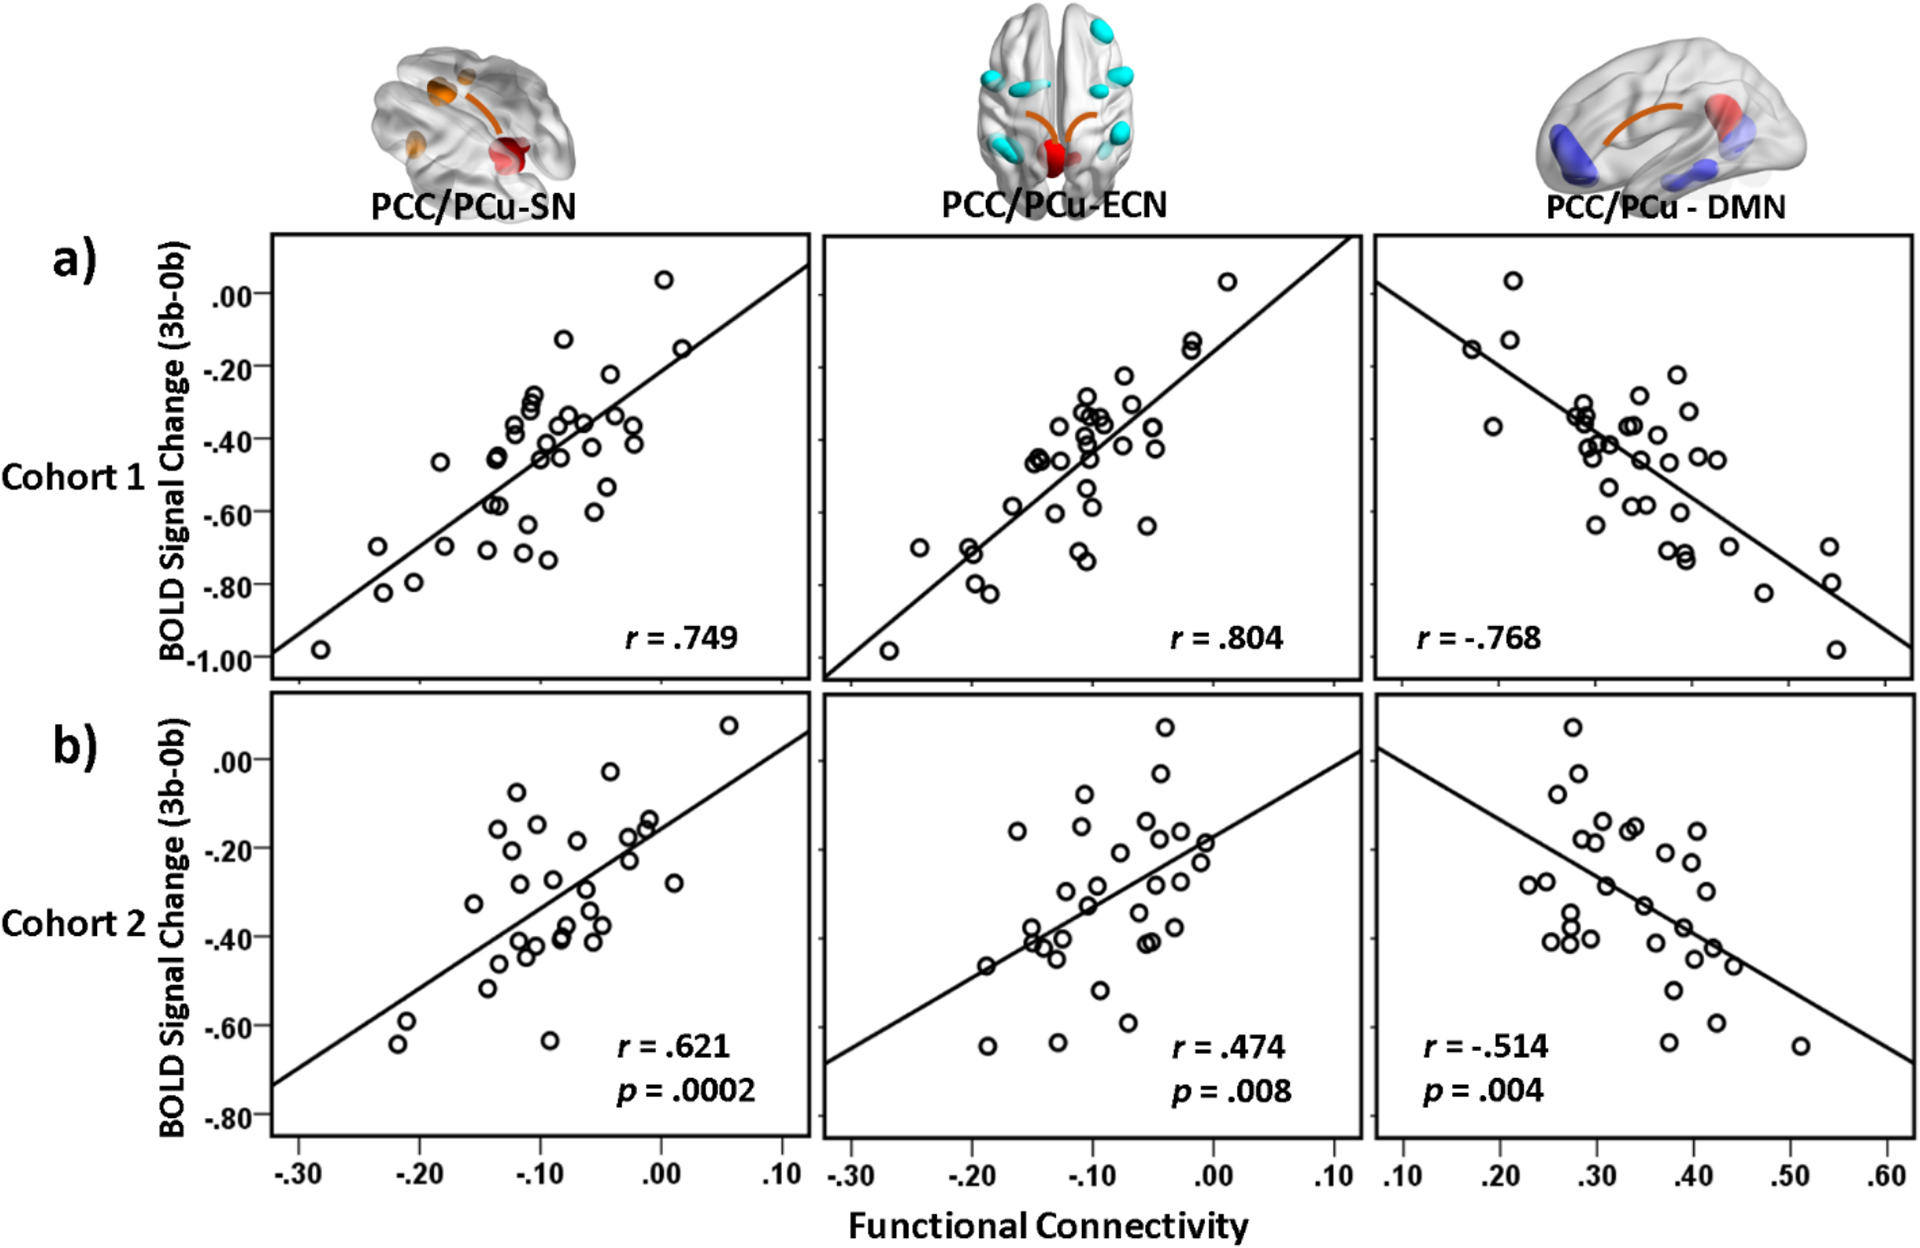
Partial regression plots of PCC/PCu deactivation level at 3 back WM against the inter-DMN (PCC/PCu-SN and PCC/PCu-ECN) and intra-DMN (seed: PCC/PCu) connectivity strength (covariates: age and head motion). The inter- and intra-DMN circuits were (a) identified using the 35 datasets in Cohort 1 and (b) validated using the independent 30 datasets in Cohort 2. Greater PCC/PCu deactivation was associated with stronger antagonistic inter-DMN correlations and stronger synchronized intra-DMN correlation in both cohorts. PCC/PCu: posterior cingulate cortex / precuneus; SN: salience network; ECN: executive control network; DMN: default-mode network. The rendering images illustrated the SN-, ECN-, and DMN-composing regions.
Glutamate and GABA Concentrations in PCC/PCu (Cohort 2)
Glutamate and GABA MRS spectra at the PCC/PCu were obtained reliably in Cohort 2, as indicated by the average Cramer-Rao lower bounds (CRLB) of 5% ± 1% (mean ± SD; range 4% – 6%) for glutamate and 8% ± 1% (range 6% – 11%) for GABA. Fig. 4a and 4b show placement of the voxel of interest (VOI) in the PCC/PCu and the representative glutamate and GABA spectra. In the MRS VOI, the mean fractional tissue composition was 56% ± 4% for gray matter (GM), 34% ± 4% for white matter, and 10% ± 3% for cerebrospinal fluid, respectively. No subject was excluded by the CRLB criterion (>20%). Glutamate and GABA concentrations referenced to the unsuppressed water concentration were 6.24 ± .48 and 4.62 ± .50 (quantified in institutional unit), respectively. Age was negatively correlated with glutamate (r = −0.51, p = 0.004), but not with GABA (p = 0.70). No gender effect was found on glutamate (p = 0.94) or GABA concentration (p = 0.60). No correlation was found between glutamate and GABA concentrations (p = 0.23). As a measure of local excitation-inhibition balance, the ratio of glutamate over GABA concentration level (denoted as Glu/GABA ratio) was computed and was 1.36 ± .16 at the PCC/PCu. Controlling for age and sex, the GM fraction in the MRS VOI was positively correlated with glutamate (r = 0.34, p = 0.075), but not with GABA (r = −0.05, p = 0.80) or Glu/GABA ratio (r = 0.22, p = 0.26).
Fig. 4.
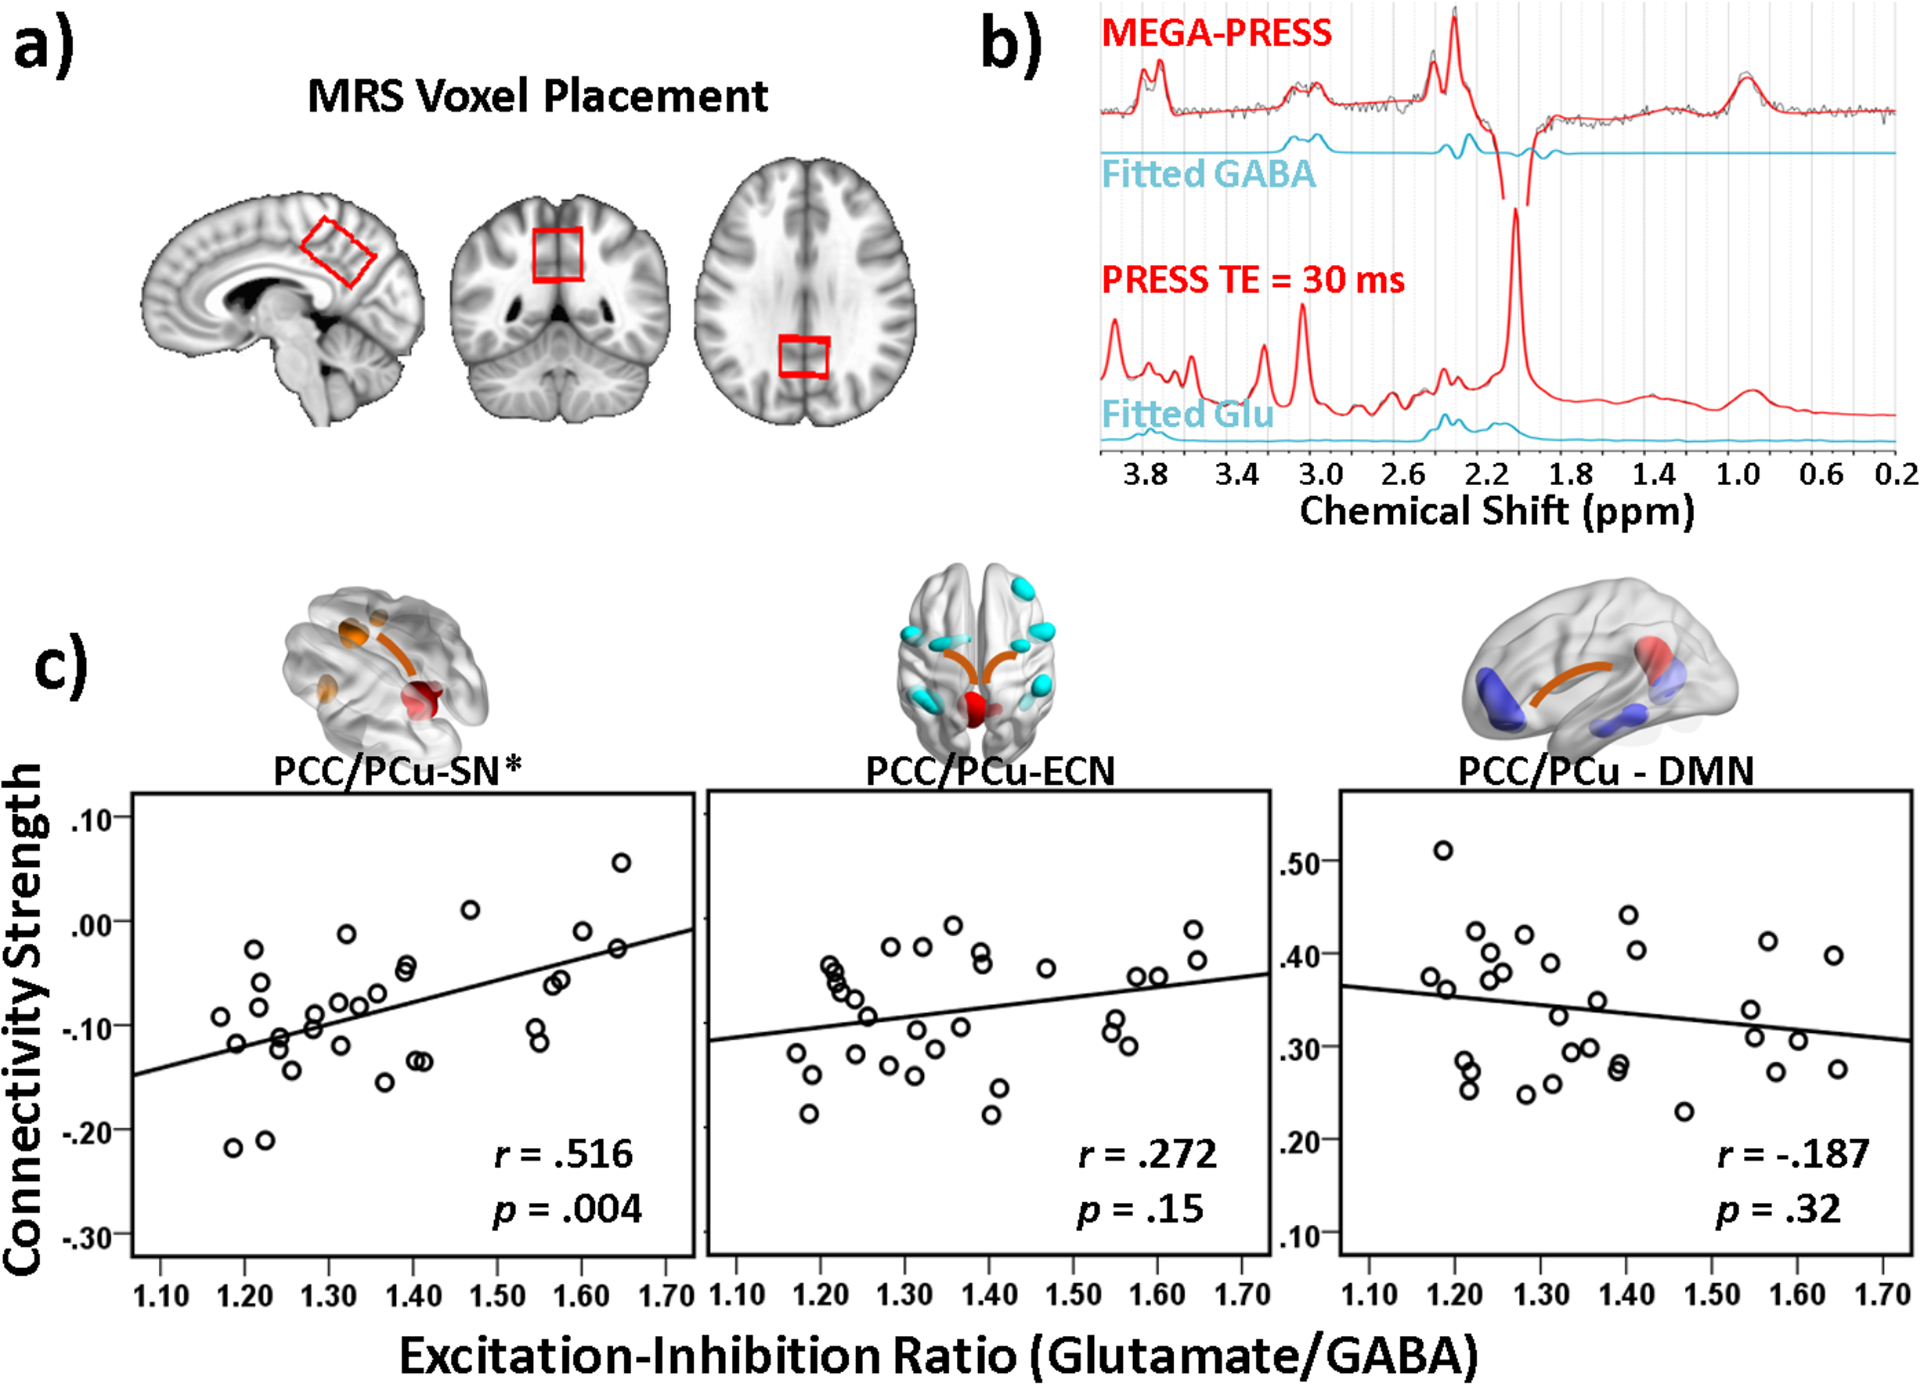
(a) Placement of the MRS voxel at the posterior cingulate cortex / precuneus (PCC/PCu). (b) The representative GABA and glutamate spectra from the PCC/PCu region. (c) Partial regression plots of inter-DMN (PCC/PCu-SN and PCC/PCu-ECN) and intra-DMN (seed: PCC/PCu) connectivity strength against the glutamate/GABA ratio (covariates: age, sex, head motion, and PCC/PCu gray matter volume fraction). Greater PCC/PCu-SN anticorrelation strength was associated with lower regional excitation-inhibition balance (indicating lower glutamate and/or higher GABA concentrations) in the PCC/PCu (p = .004). PCC/PCu: posterior cingulate cortex / precuneus; SN: salience network; ECN: executive control network; DMN: default-mode network. The rendering images illustrate the SN-, ECN-, and DMN-composing regions. *Significance p<.005.
Association of Functional Connectivity of PCC/PCu with Regional Neurotransmitter Levels (Cohort 2)
Regression analysis was performed on the three inter-/intra-network connectivity indices against the Glu/GABA ratio at PCC/PCu (covariates: age, sex, head motion, and GM volume fraction) to evaluate the local excitation-inhibition balance effects on its functional connection. Among the inter-/intra-DMN connections, lower Glu/GABA ratio was associated with higher DMN - SN connection strength (r = 0.52, p = 0.004), but not with the DMN - ECN connection (r = 0.27, p = 0.15), nor with the intra-DMN coupling (r = −0.19, p = 0.32) (Fig. 4c).
Regional Neurotransmitter Levels Correlated with the PCC/PCu Deactivation (Cohort 2)
To further assess the triple-relationship of regional brain activation/deactivation, interregional functional connections, and neurotransmitter concentrations, the relationship between the Glu/GABA ratio at rest and the task-induced deactivation at the PCC/PCu region was interrogated. Consistent with our previous study (Hu et al., 2013), lower Glu/GABA ratio was associated with greater PCC/PCu deactivation (r = .53, p = .002), controlling for age, sex, head motion, and GM volume fraction (Fig. 5).
Fig. 5.
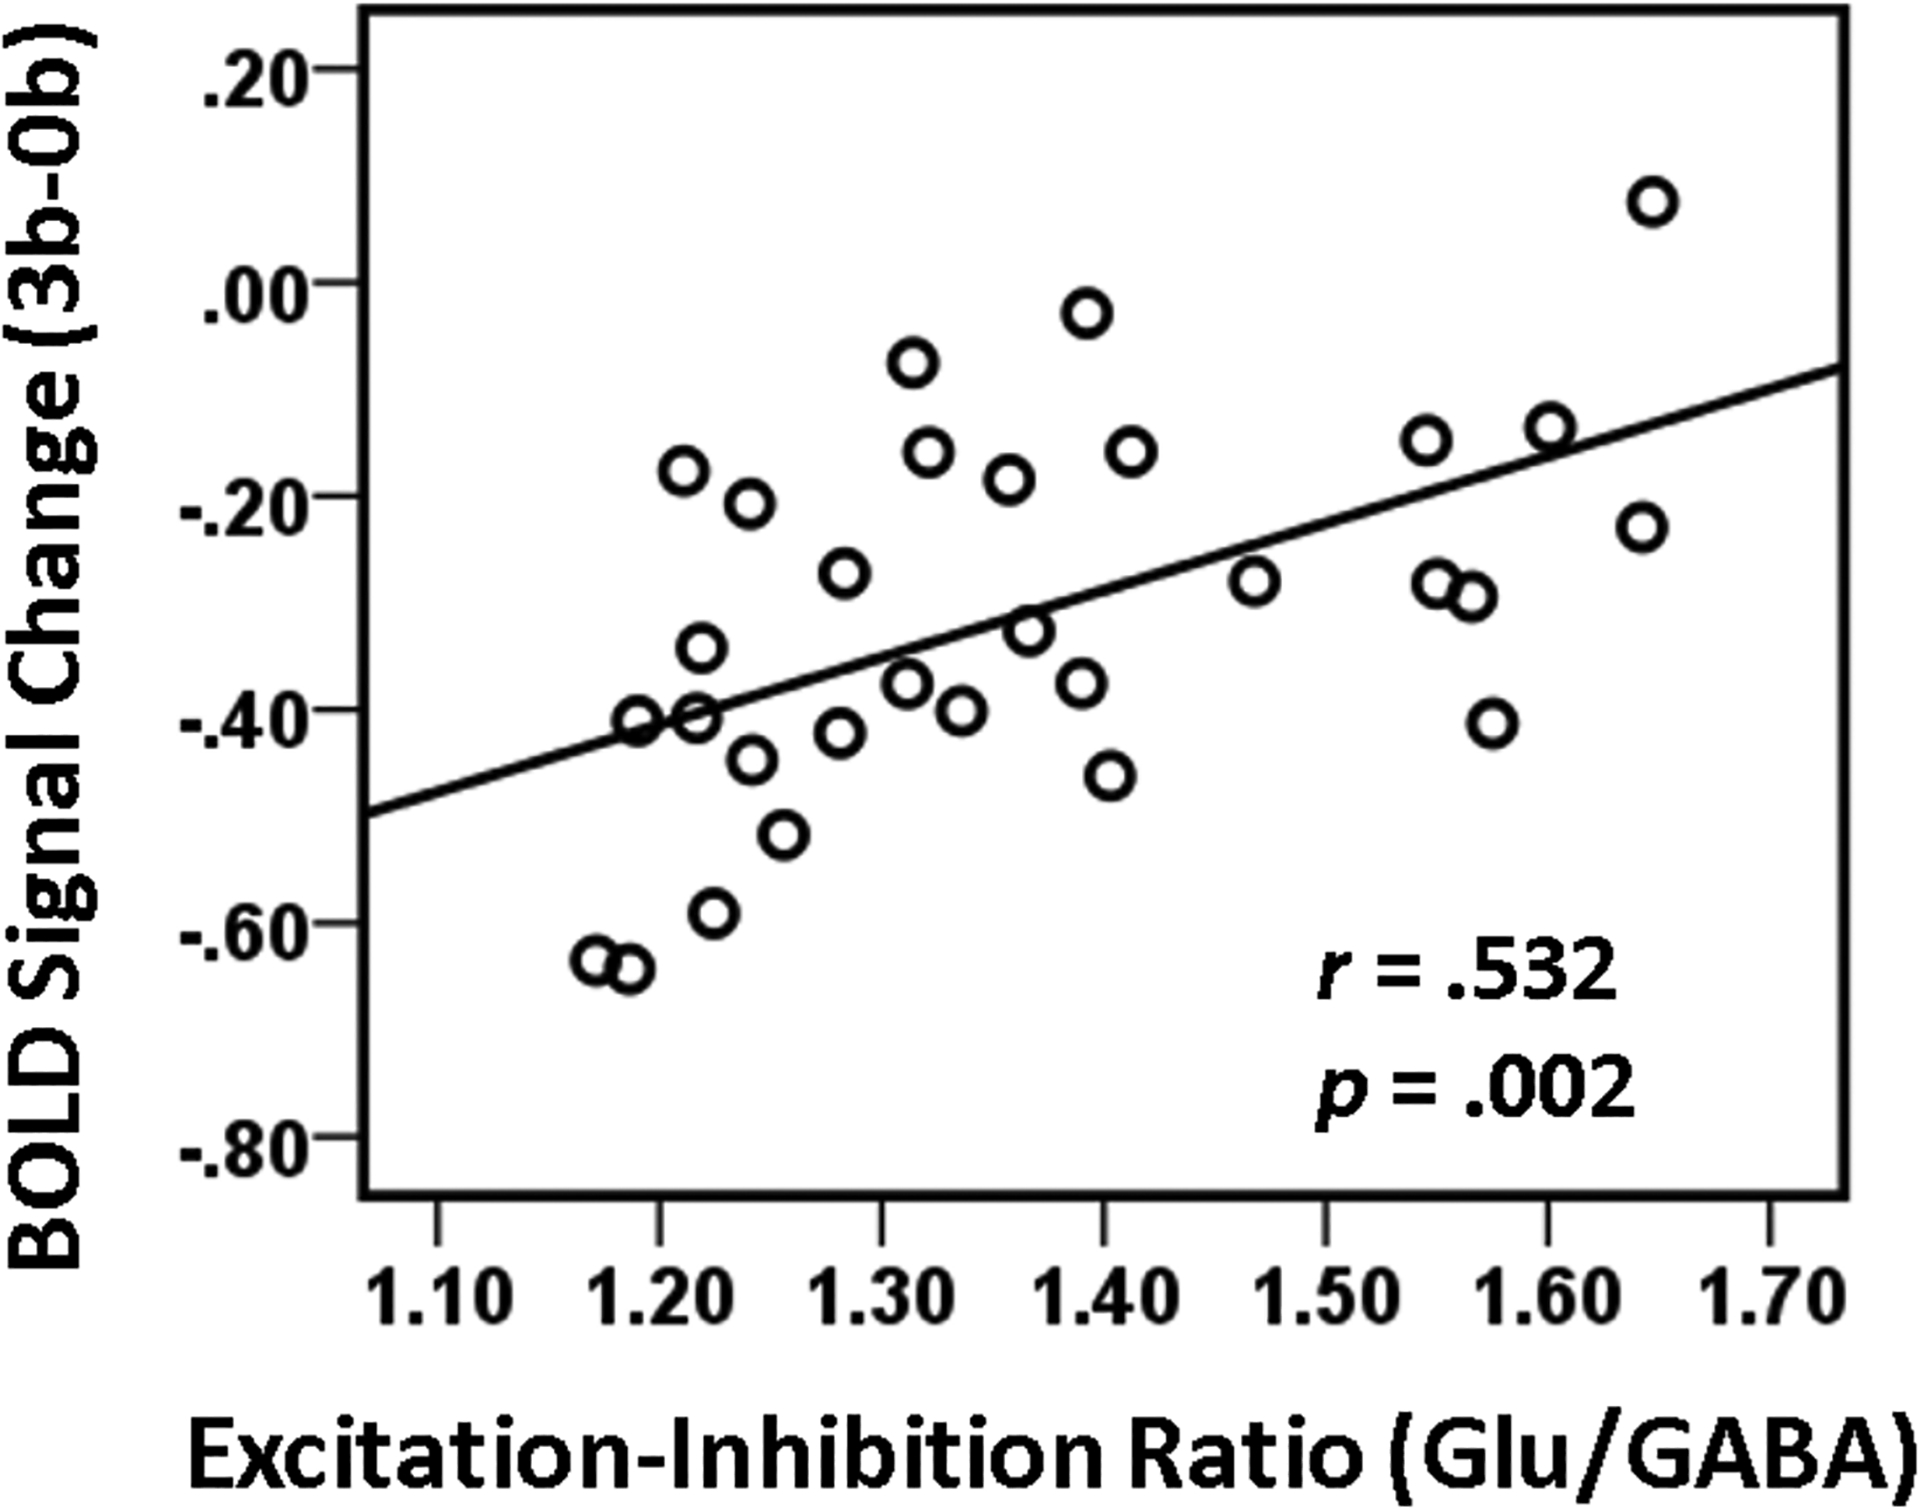
Partial regression plots of PCC/PCu deactivation level at 3-back WM against the PCC/PCu glutamate/GABA ratio (covariates: age, sex, head motion, and PCC/PCu gray matter volume fraction). Greater PCC/PCu deactivation was associated with lower glutamate/GABA ratio (due to lower glutamate and/or higher GABA concentration) at the PCC/PCu (p=0.002). PCC/PCu: posterior cingulate cortex / precuneus.
Triple-relationship among PCC/PCu Deactivation, Functional Connectivity and Neurotransmitter (Cohort 2)
We tested our hypothesis that the functional connectivity between PCC/PCu and connected remote brain regions mediates the relationship between the local excitation-inhibition balance (as measured by Glu/GABA ratio) and the task-induced BOLD deactivation level using mediation analysis. Controlling for age, sex, head motion, and GM volume fraction of the MRS voxel, the mediated model (indirect path from Glu/GABA ratio to BOLD deactivation through DMN – SN inter-network coupling, the only interregional interaction that was associated with both the DMN deactivation and local excitation-inhibition balance) was tested against the unmediated model (direct path from Glu/GABA ratio to BOLD deactivation). The mediation analysis revealed that the combined DMN – SN inter-network connectivity strength partially mediated the relationship between the local Glu/GABA concentration ratio and the PCC/PCu deactivation at 3b (p = .04; bias-corrected bootstrapping confidence interval [0.06 0.67]) (Fig. 6). After including the DMN – SN connectivity strength into the prediction model of DMN deactivation, the total effect of the regional Glu/GABA ratio on the deactivation was significantly decreased from 0.63 to 0.34, although the Glu/GABA ratio still explained a sizable portion of the task-induced deactivation at PCC/PCu. The indirect effect (the amount of mediation) due to the DMN – SN coupling was 0.29.
Fig. 6.
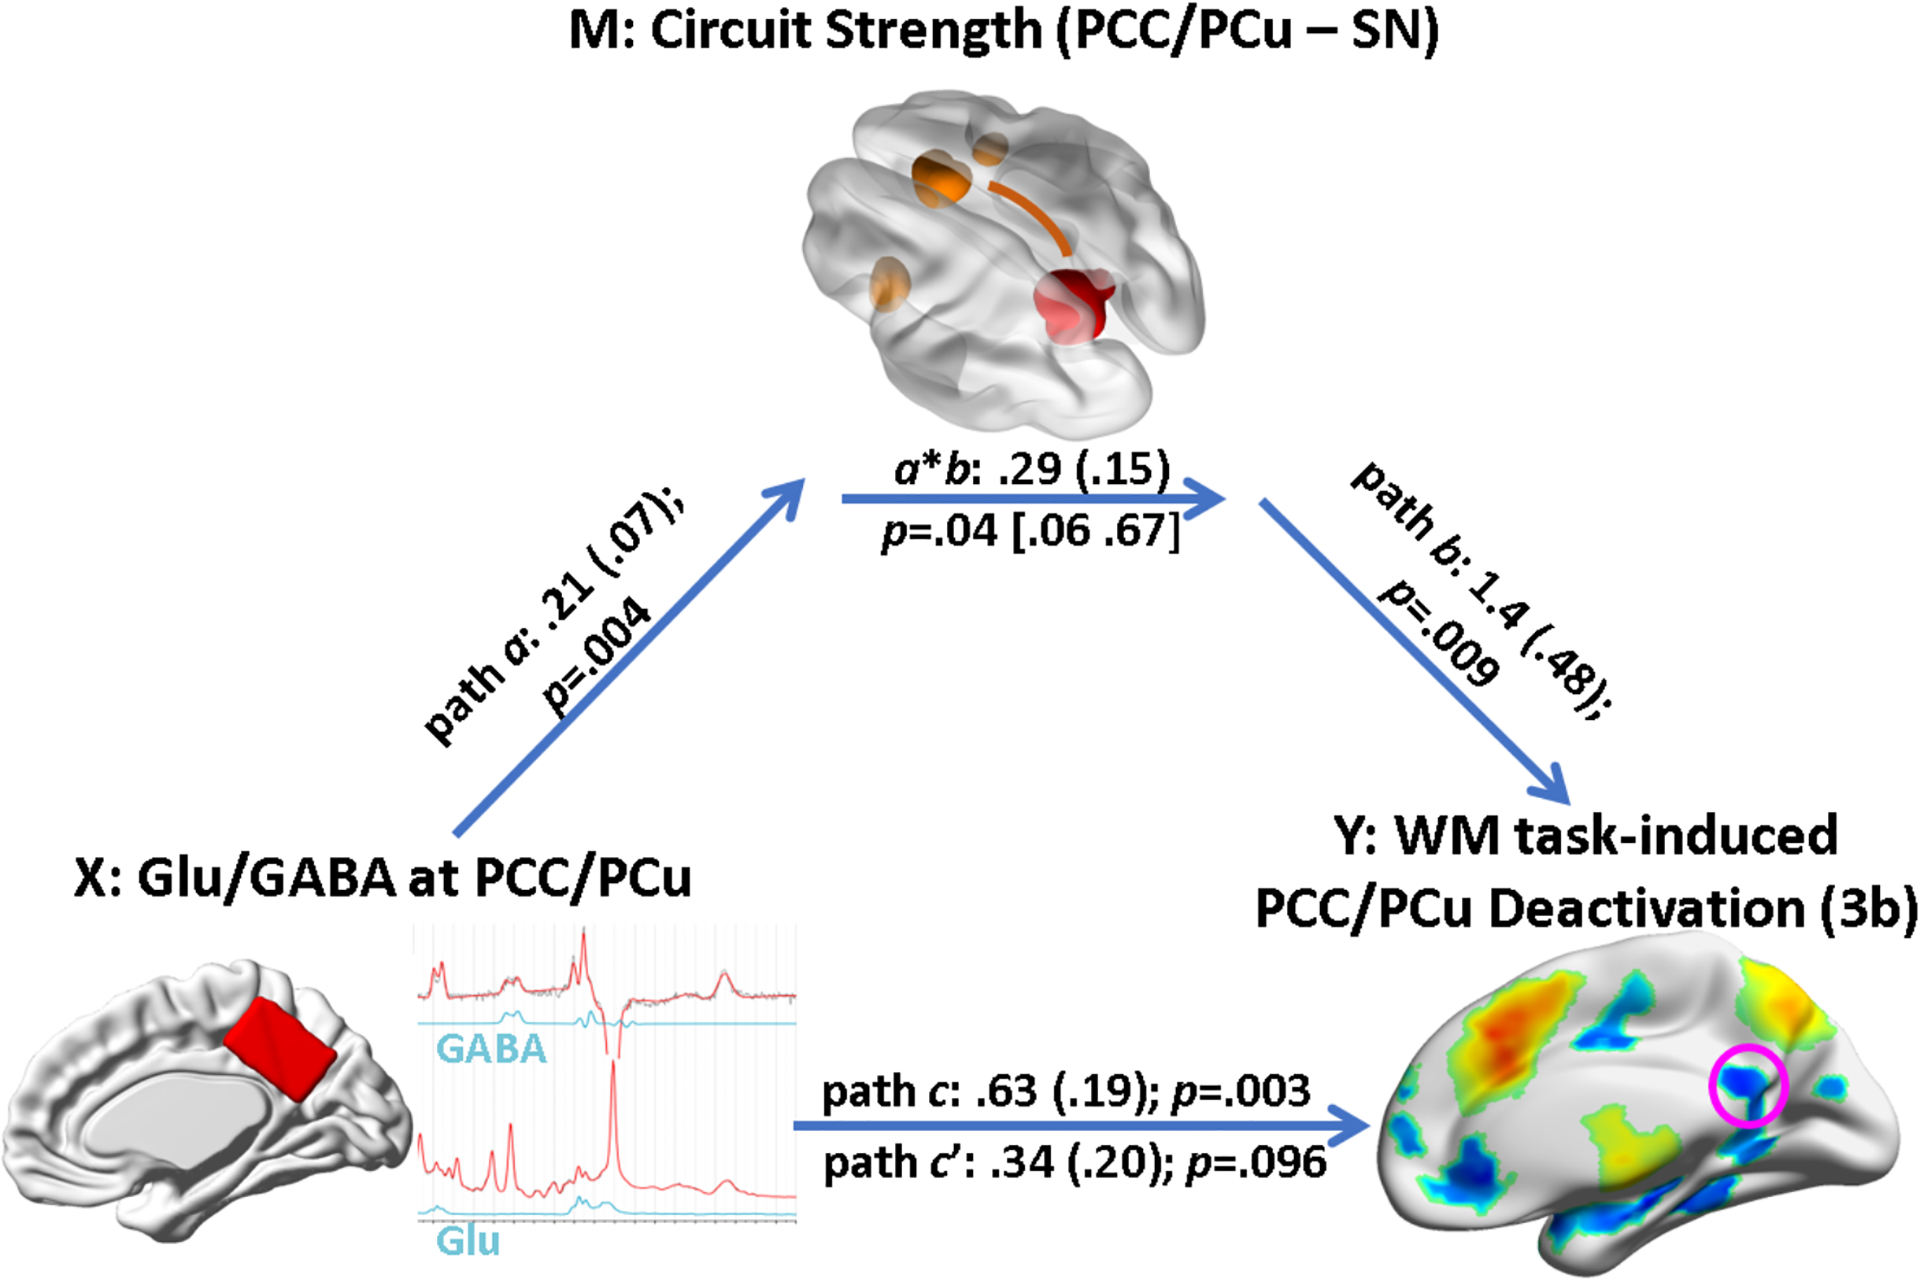
The association between the local excitation-inhibition balance (indexed by glutamate/GABA ratio) and the WM task-induced deactivation at PCC/PCu was partially mediated by the inter-network coupling between PCC/PCu and the salience network (SN; p = .04), controlling for age, sex, head motion, and the gray matter volume fraction of the MRS voxel at PCC/PCu. Path coefficients (SEs) are labeled along each path. Path a refers to the effect of Glu/GABA ratio on PCC/PCu-SN connection strength; path b refers to effect of PCC-SN coupling level on PCC deactivation, controlling for Glu/GABA ratio; path c refers to the total effect of Glu/GABA ratio on the deactivation level; path c’ refers to the direct effect of Glu/GABA ratio on the deactivation level, controlling for mediator (PCC/PCu-SN coupling strength); indirect effect (product a*b) refers to the amount of mediation the PCC/PCu-SN coupling had on the neurotransmitter – deactivation relationship. PCC/PCu: posterior cingulate cortex / precuneus; SN: salience network.
Taking together, we investigated a triple-relationship among task-induced DMN deactivation, functional network interactions, and regional neurotransmitter concentrations associated with DMN. Specifically, we identified 1) deactivation at PCC/PCu vs. intra-DMN, DMN-ECN and DMN-SN interactions; 2) glutamate/GABA ratio at PCC/PCu vs. DMN-SN interaction; and 3) deactivation vs. glutamate/GABA ratio at PCC/PCu. Further mediation analysis revealed that the network interaction of DMN-SN mediates the relationship between task-induced deactivation and glutamate/GABA ratio at PCC/PCu. These results extend previous findings and link measures from such MRI modalities as task fMRI, functional connectivity, and MRS. The potential implications of this finding, particularly in the context of neuropsychiatric disorders related to the DMN dysfunction, are discussed in the following sections.
Discussion
Local Glutamate/GABA Levels and DMN Deactivation
Though the neural mechanism underlying the DMN suppression is unclear, convergent evidence indicates that DMN deactivation is correlated with regional GABA and/or glutamate concentrations (Northoff et al., 2007; Enzi et al., 2012). In particular, our previous study (Hu et al., 2013) showed that DMN deactivation was positively correlated with glutamate concentration and negatively correlated with GABA concentration, suggesting an excitatory-inhibitory balance at the systems-level may account for the dynamic changes in neural activity in response to task modulations. Clinically, excitation-inhibition imbalance has been associated with various psychiatric disorders such as schizophrenia (Krystal et al., 2017), autism (Rubenstein and Merzenich, 2003; Yizhar et al., 2011), and depression (Lener et al., 2017). Whereas there are various ways to characterize excitation-inhibition balance, we proposed the ratio of glutamate and GABA concentrations as an approximate index of the local excitation-inhibition balance in the present study. We found the glutamate/GABA ratio was positively correlated with task-induced deactivation, suggesting that individuals with relatively high excitation-inhibition balance in the DMN may need more effort to suppress DMN activity. As deficits in DMN deactivation have been reported in aging (Sambataro et al., 2010; Prakash et al., 2012) and several neuropsychiatric diseases, it is very intriguing to investigate whether the observed deficits in DMN deactivation are associated with an abnormal excitatory-inhibitory balance indicated by the Glu/GABA ratio in these populations.
Interregional Functional Interactions and DMN Deactivation
In addition to local neurotransmitters, abnormal interregional interactions involving the DMN could be a major contributor to the failure of DMN suppression. However, it remains largely unknown which regions initiate and/or maintain DMN suppression. In the context of tasks with high cognitive demands, DMN deactivation concurs with activation in the ECN and SN. Here we identified a set of brain regions within these networks whose functional connectivity strength to the PCC/PCu region correlates with the DMN deactivation. These regions included the PCC/PCu, mPFC, and bilateral PHg in the DMN, bilateral AI and dACC/pre-SMA in the SN, and bilateral IPL, bilateral premotor cortex, and right dlPFC in the ECN. Using latency analysis and Granger causality analysis, Sridharan et al. (2008) found that task-induced brain responses peaked earlier in AI than in DMN and ECN; AI played a causal role in switching between the ECN and DMN that involved in processing exogenous and self-relevant information, suggesting a hierarchical relationship among the SN, ECN, and DMN networks. Relatedly, a previous study did show that reduced excitation of anterior insula due to theta-burst transcranial magnetic stimulation (TMS) increased the DMN connectivity strength with dlPFC (Gratton et al., 2013). Intriguingly, the connection strength between dlPFC and DMN was shown to be negatively correlated with the WM performance (Hampson et al., 2010), suggesting that increased DMN-ECN inter-network coupling may be indicative of insufficient suppression of the DMN activity ascribed to the acute disruption of the SN by theta-burst TMS.
Local Glutamate/GABA Levels and Interregional Functional Interactions
While interregional interactions influence local processing as reflected by activation / deactivation level during task performance, the interactions may, on the other hand, be modulated by local neurotransmitters. As is well known, at the cellular level the neural signal propagates from the neuronal soma along axons to synaptic terminals, triggering the release of neurotransmitters from pre-synaptic vesicles into clefts, activating corresponding post-synaptic receptors and transferring the signal to downstream neurons (Lodish et al., 2000). The firing state of a downstream neuron depends on integration of many presynaptic inputs and their excitatory-inhibitory profiles (Purves et al., 2012). As the major excitatory and inhibitory neurotransmitters in the central nervous system, respectively, glutamate and GABA are key factors in the chain of receiving, integrating and outputting signals. However, the relationship between synaptic level neurotransmission process and system level functional connectivity remains largely unknown. At the system level, our data indicate a positive relationship between Glu/GABA ratio at PCC/PCu and the antagonistic PCC/PCu-SN interaction, suggesting that individuals with a relatively low excitation-inhibition ratio may have relatively high anti-correlated coupling between the DMN and SN. Previous studies have also shown the impact of the regional neurotransmitter concentration on intrinsic functional connectivity. For example, the GABA concentration within the primary motor cortex (M1) is negatively correlated with the functional connectivity strength of the resting motor network (Stagg et al., 2014; Bachtiar et al., 2015). Further, anodal tDCS applied to the M1 region reduces the GABA concentration and increases functional connectivity strength at the same time. The triple-relationship we propose here, though still simplistic, accounts for both inhibitory and excitatory neurotransmitters as well as interregional interaction.
Mediation Effects of Interregional Functional Interactions on the Relationship between Glutamate/GABA Levels and DMN Deactivation
The present study establishes a triple-relationship model in which functional network interaction mediates the association between neurotransmitter levels (Glu/GABA ratio) and task-induced DMN deactivation. Such a triple-relationship between these imaging metrics is highly consistent with previous findings. For example, Anticevic et al. (2012b) showed that the administration of ketamine, an N-methyl-D-aspartate (NMDA) glutamate receptor antagonist, reduced the degree of DMN deactivation during the performance of a delayed working memory task. A computational model was proposed to interpret the data, where the disrupted inhibitory signaling due to ketamine was modeled as reduced NMDA conductance onto GABAergic interneurons. This model suggested two mechanisms by which the excitation-inhibition disruption could potentially disrupt DMN suppression during task: (i) the ability of task-activated regions to inhibit the DMN is impaired because long-range inhibitory connections between modules are weakened; and (ii) local disinhibition renders the hyperactive microcircuits less sensitive to the long-range input so that the already active DMN cannot be suppressed even with the same long-range inhibitory input strength. Our triple-relationship model, which was established from individual differences in DMN deactivation, local Glu/GABA ratio, and long-range regional interactions, is highly in line with these two mechanisms derived from pharmacological modulation. Further, our multimodal imaging data suggest that the long-range inputs that mediate DMN deactivation are potentially specified from the SN. It is reasonable to speculate that the SN regions identified in the present study may serve as neural substrates that send signals to inhibit DMN activity, and individual differences in DMN-SN functional connectivity may reflect individual differences in long-range drive of the DMN suppression (mechanism i). In contrast, individual differences in local Glu/GABA ratio may indicate: 1) various individual spontaneous DMN activity levels during rest, and 2) different individual sensitivities in response to long-range input to inhibit ongoing DMN activity (mechanism ii). Our mediation analysis demonstrated partial mediation effects of DMN-SN functional connectivity, suggesting both mechanisms play important roles in the suppression of DMN activity.
Limitations
As in most of 1H-MRS studies, there are potential methodological confounds in GABA and glutamate quantification. One concern is the macromolecule (MM) contamination in GABA measurement using editing sequences without MM suppression (Henry et al., 2001; Terpstra et al., 2002; Near et al., 2011). However, it has been shown that MM concentrations in cortical regions of healthy adults are very stable with respect to age and gender (Hofmann et al., 2001; Mader et al., 2002), suggesting that the individual variations in GABA+MM levels may primarily reflect variations in the concentration of GABA (Donahue et al., 2010). The other concern is the separability of glutamate and glutamine at 3T. The CRLBs for glutamate and glutamine quantification were 5% ± 1% and 15% ± 3% respectively in the current study, suggesting both are quantifiable. Another concern with glutamate measurement using 1H-MRS is that this technique cannot distinguish signals from the metabolic and neurotransmitter pools. However, the glutamate/glutamine cycling rate increases linearly with neuronal glucose oxidation rate in an approximately 1:1 ratio (Rothman et al., 2003; de Graaf et al., 2004), which supports the assumption that the total glutamate measured by 1H-MRS could be a reasonable metric to characterize regional excitability.
Summary
Collectively, the present study may suggest several important implications for DMN dysfunction. Based on our model, the origin of deficits in DMN deactivation during task performance may be rooted in an imbalance between glutamate and GABA neurotransmission and/or disrupted DMN – SN functional interaction. Identifying the nature of DMN dysfunction is important for the development of effective interventional strategies. If the imbalance of excitatory and inhibitory neurotransmission is the major cause, a pharmacologic strategy to restore the balance may be more effective. In contrast, if the deficit in DMN deactivation results from impaired inputs from remote SN nodes that mediate DMN activity through functional connectivity, even though the local neurotransmitters are in normal ranges, a neuromodulation strategy to restore the long-range inputs by targeting such regions as AI and/or dACC/pre-SMA may be more effective. Finally, an integrated application of pharmacological and neuromodulation strategies may achieve the maximum outcome in rescuing DMN deactivation deficits. Whether restoration of DMN deactivation would facilitate task performance in a healthy population and relieve symptoms in psychiatric disorders is an interesting question warranting further investigations.
Supplementary Material
Significance Statement.
Aberrant default mode network (DMN) activity has been related to aging and various neuropsychiatric illnesses. Graded DMN deactivation elicited by external cognitive tasks was associated with regional neurotransmitter concentration levels and functional connectivity strength within the DMN. To better understand the neural mechanisms underlying the DMN deactivation, we investigated the triple-relationship among the task-induced deactivation, regional excitation-inhibition balance, and the interregional functional connectivity strength associated with the DMN. Using mediation analysis, we found that the network interaction between DMN and the salience network partially mediated the association between the regional excitation-inhibition balance and the DMN deactivation. This finding bridges DMN-deactivation related findings from various neuroimaging modalities and may provide new insights into the neural mechanisms of the DMN deactivation.
Acknowledgements
This work was supported by the Intramural Research Program of National Institute on Drug Abuse at the National Institutes of Health (ZIA DA000469). We thank Dr. Thomas Ross for providing his support on scientific computing, fMRI data analysis and statistical analysis. We thank Dr. Qihong Zou and Loretta Spurgeon for data collection.
Footnotes
Declaration of Interests
The authors declare no competing interests.
References
- Andrews-Hanna JR, Smallwood J, Spreng RN (2014) The default network and self-generated thought: component processes, dynamic control, and clinical relevance. Ann N Y Acad Sci 1316:29–52. [DOI] [PMC free article] [PubMed] [Google Scholar]
- Anticevic A, Repovs G, Shulman GL, Barch DM (2010) When less is more: TPJ and default network deactivation during encoding predicts working memory performance. Neuroimage 49:2638–2648. [DOI] [PMC free article] [PubMed] [Google Scholar]
- Anticevic A, Cole MW, Murray JD, Corlett PR, Wang XJ, Krystal JH (2012a) The role of default network deactivation in cognition and disease. Trends Cogn Sci 16:584–592. [DOI] [PMC free article] [PubMed] [Google Scholar]
- Anticevic A, Gancsos M, Murray JD, Repovs G, Driesen NR, Ennis DJ, Niciu MJ, Morgan PT, Surti TS, Bloch MH, Ramani R, Smith MA, Wang XJ, Krystal JH, Corlett PR (2012b) NMDA receptor function in large-scale anticorrelated neural systems with implications for cognition and schizophrenia. Proc Natl Acad Sci U S A 109:16720–16725. [DOI] [PMC free article] [PubMed] [Google Scholar]
- Bachtiar V, Near J, Johansen-Berg H, Stagg CJ (2015) Modulation of GABA and resting state functional connectivity by transcranial direct current stimulation. eLife. [DOI] [PMC free article] [PubMed] [Google Scholar]
- Beckmann CF, Smith SM (2004) Probabilistic independent component analysis for functional magnetic resonance imaging. IEEE Trans Med Imaging 23:137–152. [DOI] [PubMed] [Google Scholar]
- Buckner RL, Andrews-Hanna JR, Schacter DL (2008) The brain’s default network: anatomy, function, and relevance to disease. Ann N Y Acad Sci 1124:1–38. [DOI] [PubMed] [Google Scholar]
- Cox RW (1996) AFNI: software for analysis and visualization of functional magnetic resonance neuroimages. Comput Biomed Res 29:162–173. [DOI] [PubMed] [Google Scholar]
- de Graaf RA, Mason GF, Patel AB, Rothman DL, Behar KL (2004) Regional glucose metabolism and glutamatergic neurotransmission in rat brain in vivo. Proc Natl Acad Sci U S A 101:12700–12705. [DOI] [PMC free article] [PubMed] [Google Scholar]
- Donahue MJ, Near J, Blicher JU, Jezzard P (2010) Baseline GABA concentration and fMRI response. Neuroimage 53:392–398. [DOI] [PubMed] [Google Scholar]
- Donahue MJ, Blicher JU, Østergaard L, Feinberg DA, MacIntosh BJ, Miller KL, Günther M, Jezzard P (2009) Cerebral blood flow, blood volume, and oxygen metabolism dynamics in human visual and motor cortex as measured by whole-brain multi-modal magnetic resonance imaging. J Cereb Blood Flow Metab 29:1856–1866. [DOI] [PubMed] [Google Scholar]
- Enzi B, Duncan NW, Kaufmann J, Tempelmann C, Wiebking C, Northoff G (2012) Glutamate modulates resting state activity in the perigenual anterior cingulate cortex – a combined fMRI-MRS study. Neuroscience 227:102–109. [DOI] [PubMed] [Google Scholar]
- Fornito A, Harrison BJ, Zalesky A, Simons JS (2012) Competitive and cooperative dynamics of large-scale brain functional networks supporting recollection. Proc Natl Acad Sci U S A 109:12788–12793. [DOI] [PMC free article] [PubMed] [Google Scholar]
- Fox MD, Snyder AZ, Vincent JL, Corbetta M, Van Essen DC, Raichle ME (2005) The human brain is intrinsically organized into dynamic, anticorrelated functional networks. Proc Natl Acad Sci U S A 102:9673–9678. [DOI] [PMC free article] [PubMed] [Google Scholar]
- Geng X, Christensen GE, Gu H, Ross TJ, Yang Y (2009) Implicit reference-based group-wise image registration and its application to structural and functional MRI. Neuroimage 47:1341–1351. [DOI] [PMC free article] [PubMed] [Google Scholar]
- Geramita M, van der Veen JW, Barnett AS, Savostyanova AA, Shen J, Weinberger DR, Marenco S (2011) Reproducibility of prefrontal γ-aminobutyric acid measurements with J-edited spectroscopy. NMR Biomed 24:1089–1098. [DOI] [PubMed] [Google Scholar]
- Grady CL, Springer MV, Hongwanishkul D, McIntosh AR, Winocur G (2006) Age-related changes in brain activity across the adult lifespan. J Cogn Neurosci 18:227–241. [DOI] [PubMed] [Google Scholar]
- Gratton C, Lee TG, Nomura EM, D’Esposito M (2013) The effect of theta-burst TMS on cognitive control networks measured with resting state fMRI. Front Syst Neurosci 7:124. [DOI] [PMC free article] [PubMed] [Google Scholar]
- Haatveit BC, Sundet K, Hugdahl K, Ueland T, Melle I, Andreassen OA (2010) The validity of d prime as a working memory index: results from the “Bergen n-back task”. J Clin Exp Neuropsychol 32:871–880. [DOI] [PubMed] [Google Scholar]
- Hampson M, Driesen NR, Skudlarski P, Gore JC, Constable RT (2006) Brain connectivity related to working memory performance. J Neurosci 26:13338–13343. [DOI] [PMC free article] [PubMed] [Google Scholar]
- Hampson M, Driesen N, Roth JK, Gore JC, Constable RT (2010) Functional connectivity between task-positive and task-negative brain areas and its relation to working memory performance. Magn Reson Imaging 28:1051–1057. [DOI] [PMC free article] [PubMed] [Google Scholar]
- Hancu I (2009) Optimized glutamate detection at 3T. J Magn Reson Imaging 30:1155–1162. [DOI] [PMC free article] [PubMed] [Google Scholar]
- Hayes AF, Scharkow M (2013) The relative trustworthiness of inferential tests of the indirect effect in statistical mediation analysis: does method really matter? Psychol Sci 24:1918–1927. [DOI] [PubMed] [Google Scholar]
- Hayes AF, Preacher KJ (2014) Statistical mediation analysis with a multicategorical independent variable. Br J Math Stat Psychol 67:451–470. [DOI] [PubMed] [Google Scholar]
- Henry P-G, Dautry C, Hantraye P, Bloch G (2001) Brain GABA editing without macromolecule contamination. Magnetic Resonance in Medicine 45:517–520. [DOI] [PubMed] [Google Scholar]
- Hofmann L, Slotboom J, Boesch C, Kreis R (2001) Characterization of the macromolecule baseline in localized (1)H-MR spectra of human brain. Magn Reson Med 46:855–863. [DOI] [PubMed] [Google Scholar]
- Hu Y, Chen X, Gu H, Yang Y (2013) Resting-state glutamate and GABA concentrations predict task-induced deactivation in the default mode network. J Neurosci 33:18566–18573. [DOI] [PMC free article] [PubMed] [Google Scholar]
- Kapogiannis D, Reiter DA, Willette AA, Mattson MP (2013) Posteromedial cortex glutamate and GABA predict intrinsic functional connectivity of the default mode network. Neuroimage 64:112–119. [DOI] [PMC free article] [PubMed] [Google Scholar]
- Krystal JH, Anticevic A, Yang GJ, Dragoi G, Driesen NR, Wang XJ, Murray JD (2017) Impaired Tuning of Neural Ensembles and the Pathophysiology of Schizophrenia: A Translational and Computational Neuroscience Perspective. Biol Psychiatry 81:874–885. [DOI] [PMC free article] [PubMed] [Google Scholar]
- Lener MS, Niciu MJ, Ballard ED, Park M, Park LT, Nugent AC, Zarate CA (2017) Glutamate and Gamma-Aminobutyric Acid Systems in the Pathophysiology of Major Depression and Antidepressant Response to Ketamine. Biol Psychiatry 81:886–897. [DOI] [PMC free article] [PubMed] [Google Scholar]
- Lerman C, Gu H, Loughead J, Ruparel K, Yang Y, Stein EA (2014) Large-scale brain network coupling predicts acute nicotine abstinence effects on craving and cognitive function. JAMA Psychiatry 71:523–530. [DOI] [PMC free article] [PubMed] [Google Scholar]
- Lewis CM, Baldassarre A, Committeri G, Romani GL, Corbetta M (2009) Learning sculpts the spontaneous activity of the resting human brain. Proc Natl Acad Sci U S A 106:17558–17563. [DOI] [PMC free article] [PubMed] [Google Scholar]
- Liang X, Zou Q, He Y, Yang Y (2015) Topologically Reorganized Connectivity Architecture of Default-Mode, Executive-Control, and Salience Networks across Working Memory Task Loads. Cereb Cortex. [DOI] [PMC free article] [PubMed] [Google Scholar]
- Lodish H, Berk A, Zipursky SL, Matsudaira P, Baltimore D, Darnell J (2000) Overview of Neuron Structure and Function. In: Molecular Cell Biology, 4th Edition. New York: W. H. Freeman and Company. [Google Scholar]
- Mader I, Seeger U, Karitzky J, Erb M, Schick F, Klose U (2002) Proton magnetic resonance spectroscopy with metabolite nulling reveals regional differences of macromolecules in normal human brain. J Magn Reson Imaging 16:538–546. [DOI] [PubMed] [Google Scholar]
- McCormick DA (1990) Membrane properties and neurotransmitter actions. In: The synaptic organization of the brain, 3rd Edition (Shepherd GM, ed), pp 32–66. New York: Oxford University Press. [Google Scholar]
- Mennes M, Kelly C, Zuo XN, Di Martino A, Biswal BB, Castellanos FX, Milham MP (2010) Inter-individual differences in resting-state functional connectivity predict task-induced BOLD activity. Neuroimage 50:1690–1701. [DOI] [PMC free article] [PubMed] [Google Scholar]
- Menon V (2011) Large-scale brain networks and psychopathology: a unifying triple network model. Trends Cogn Sci 15:483–506. [DOI] [PubMed] [Google Scholar]
- Mescher M, Merkle H, Kirsch J, Garwood M, Gruetter R (1998) Simultaneous in vivo spectral editing and water suppression. NMR Biomed 11:266–272. [DOI] [PubMed] [Google Scholar]
- Mullins PG, Chen H, Xu J, Caprihan A, Gasparovic C (2008) Comparative reliability of proton spectroscopy techniques designed to improve detection of J-coupled metabolites. Magn Reson Med 60:964–969. [DOI] [PubMed] [Google Scholar]
- Muthukumaraswamy SD, Edden RA, Jones DK, Swettenham JB, Singh KD (2009) Resting GABA concentration predicts peak gamma frequency and fMRI amplitude in response to visual stimulation in humans. Proc Natl Acad Sci U S A 106:8356–8361. [DOI] [PMC free article] [PubMed] [Google Scholar]
- Near J, Simpson R, Cowen P, Jezzard P (2011) Efficient γ-aminobutyric acid editing at 3T without macromolecule contamination: MEGA-SPECIAL. NMR in Biomedicine 24:1277–1285. [DOI] [PubMed] [Google Scholar]
- Northoff G, Walter M, Schulte RF, Beck J, Dydak U, Henning A, Boeker H, Grimm S, Boesiger P (2007) GABA concentrations in the human anterior cingulate cortex predict negative BOLD responses in fMRI. Nat Neurosci 10:1515–1517. [DOI] [PubMed] [Google Scholar]
- Owen AM, McMillan KM, Laird AR, Bullmore E (2005) N-back working memory paradigm: a meta-analysis of normative functional neuroimaging studies. Hum Brain Mapp 25:46–59. [DOI] [PMC free article] [PubMed] [Google Scholar]
- Power JD, Barnes KA, Snyder AZ, Schlaggar BL, Petersen SE (2012) Spurious but systematic correlations in functional connectivity MRI networks arise from subject motion. Neuroimage 59:2142–2154. [DOI] [PMC free article] [PubMed] [Google Scholar]
- Prakash RS, Heo S, Voss MW, Patterson B, Kramer AF (2012) Age-related differences in cortical recruitment and suppression: implications for cognitive performance. Behav Brain Res 230:192–200. [DOI] [PubMed] [Google Scholar]
- Preacher KJ, Hayes AF (2004) SPSS and SAS procedures for estimating indirect effects in simple mediation models. Behav Res Methods Instrum Comput 36:717–731. [DOI] [PubMed] [Google Scholar]
- Purves D, Augustine GJ, Fitzpatrick D, Hall WC, LaMantia A-S, White LE (2012) Synaptic Transmission. In: Neuroscience, 5th Edition, pp 77–107. Sunderland, MA: Sinauer Associates, Inc. [Google Scholar]
- Rothman DL, Behar KL, Hetherington HP, Shulman RG (1984) Homonuclear 1H double-resonance difference spectroscopy of the rat brain in vivo. Proc Natl Acad Sci U S A 81:6330–6334. [DOI] [PMC free article] [PubMed] [Google Scholar]
- Rothman DL, Behar KL, Hyder F, Shulman RG (2003) In vivo NMR studies of the glutamate neurotransmitter flux and neuroenergetics: implications for brain function. Annu Rev Physiol 65:401–427. [DOI] [PubMed] [Google Scholar]
- Rubenstein JL, Merzenich MM (2003) Model of autism: increased ratio of excitation/inhibition in key neural systems. Genes Brain Behav 2:255–267. [DOI] [PMC free article] [PubMed] [Google Scholar]
- Sambataro F, Murty VP, Callicott JH, Tan HY, Das S, Weinberger DR, Mattay VS (2010) Age-related alterations in default mode network: impact on working memory performance. Neurobiol Aging 31:839–852. [DOI] [PMC free article] [PubMed] [Google Scholar]
- Schmitz TW, Correia MM, Ferreira CS, Prescot AP, Anderson MC (2017) Hippocampal GABA enables inhibitory control over unwanted thoughts. Nat Commun 8:1311. [DOI] [PMC free article] [PubMed] [Google Scholar]
- Seeley WW, Menon V, Schatzberg AF, Keller J, Glover GH, Kenna H, Reiss AL, Greicius MD (2007) Dissociable intrinsic connectivity networks for salience processing and executive control. J Neurosci 27:2349–2356. [DOI] [PMC free article] [PubMed] [Google Scholar]
- Shen X, Finn ES, Scheinost D, Rosenberg MD, Chun MM, Papademetris X, Constable RT (2017) Using connectome-based predictive modeling to predict individual behavior from brain connectivity. Nat Protoc 12:506–518. [DOI] [PMC free article] [PubMed] [Google Scholar]
- Singh KD, Fawcett IP (2008) Transient and linearly graded deactivation of the human default-mode network by a visual detection task. Neuroimage 41:100–112. [DOI] [PubMed] [Google Scholar]
- Spreng RN, Schacter DL (2012) Default network modulation and large-scale network interactivity in healthy young and old adults. Cereb Cortex 22:2610–2621. [DOI] [PMC free article] [PubMed] [Google Scholar]
- Sridharan D, Levitin DJ, Menon V (2008) A critical role for the right fronto-insular cortex in switching between central-executive and default-mode networks. Proc Natl Acad Sci U S A 105:12569–12574. [DOI] [PMC free article] [PubMed] [Google Scholar]
- Stagg CJ, Bachtiar V, Johansen-Berg H (2011) The role of GABA in human motor learning. Curr Biol 21:480–484. [DOI] [PMC free article] [PubMed] [Google Scholar]
- Stagg CJ, Bachtiar V, Amadi U, Gudberg CA, Ilie AS, Sampaio-Baptista C, O’Shea J, Woolrich M, Smith SM, Filippini N, Near J, Johansen-Berg H (2014) Local GABA concentration is related to network-level resting functional connectivity. eLife 3. [DOI] [PMC free article] [PubMed] [Google Scholar]
- Terpstra M, Ugurbil K, Gruetter R (2002) Direct in vivo measurement of human cerebral GABA concentration using MEGA-editing at 7 Tesla. Magnetic Resonance in Medicine 47:1009–1012. [DOI] [PubMed] [Google Scholar]
- Tomasi D, Ernst T, Caparelli EC, Chang L (2006) Common deactivation patterns during working memory and visual attention tasks: an intra-subject fMRI study at 4 Tesla. Hum Brain Mapp 27:694–705. [DOI] [PMC free article] [PubMed] [Google Scholar]
- Tung KC, Uh J, Mao D, Xu F, Xiao G, Lu H (2013) Alterations in resting functional connectivity due to recent motor task. Neuroimage 78:316–324. [DOI] [PMC free article] [PubMed] [Google Scholar]
- Wu WC, Buxton RB, Wong EC (2007) Vascular space occupancy weighted imaging with control of residual blood signal and higher contrast-to-noise ratio. IEEE Trans Med Imaging 26:1319–1327. [DOI] [PubMed] [Google Scholar]
- Yizhar O, Fenno LE, Prigge M, Schneider F, Davidson TJ, O’Shea DJ, Sohal VS, Goshen I, Finkelstein J, Paz JT, Stehfest K, Fudim R, Ramakrishnan C, Huguenard JR, Hegemann P, Deisseroth K (2011) Neocortical excitation/inhibition balance in information processing and social dysfunction. Nature 477:171–178. [DOI] [PMC free article] [PubMed] [Google Scholar]
- Zou Q, Ross TJ, Gu H, Geng X, Zuo XN, Hong LE, Gao JH, Stein EA, Zang YF, Yang Y (2013) Intrinsic resting-state activity predicts working memory brain activation and behavioral performance. Hum Brain Mapp 34:3204–3215. [DOI] [PMC free article] [PubMed] [Google Scholar]
Associated Data
This section collects any data citations, data availability statements, or supplementary materials included in this article.