
Fig. 1. Classic evolution schematic and characterization.
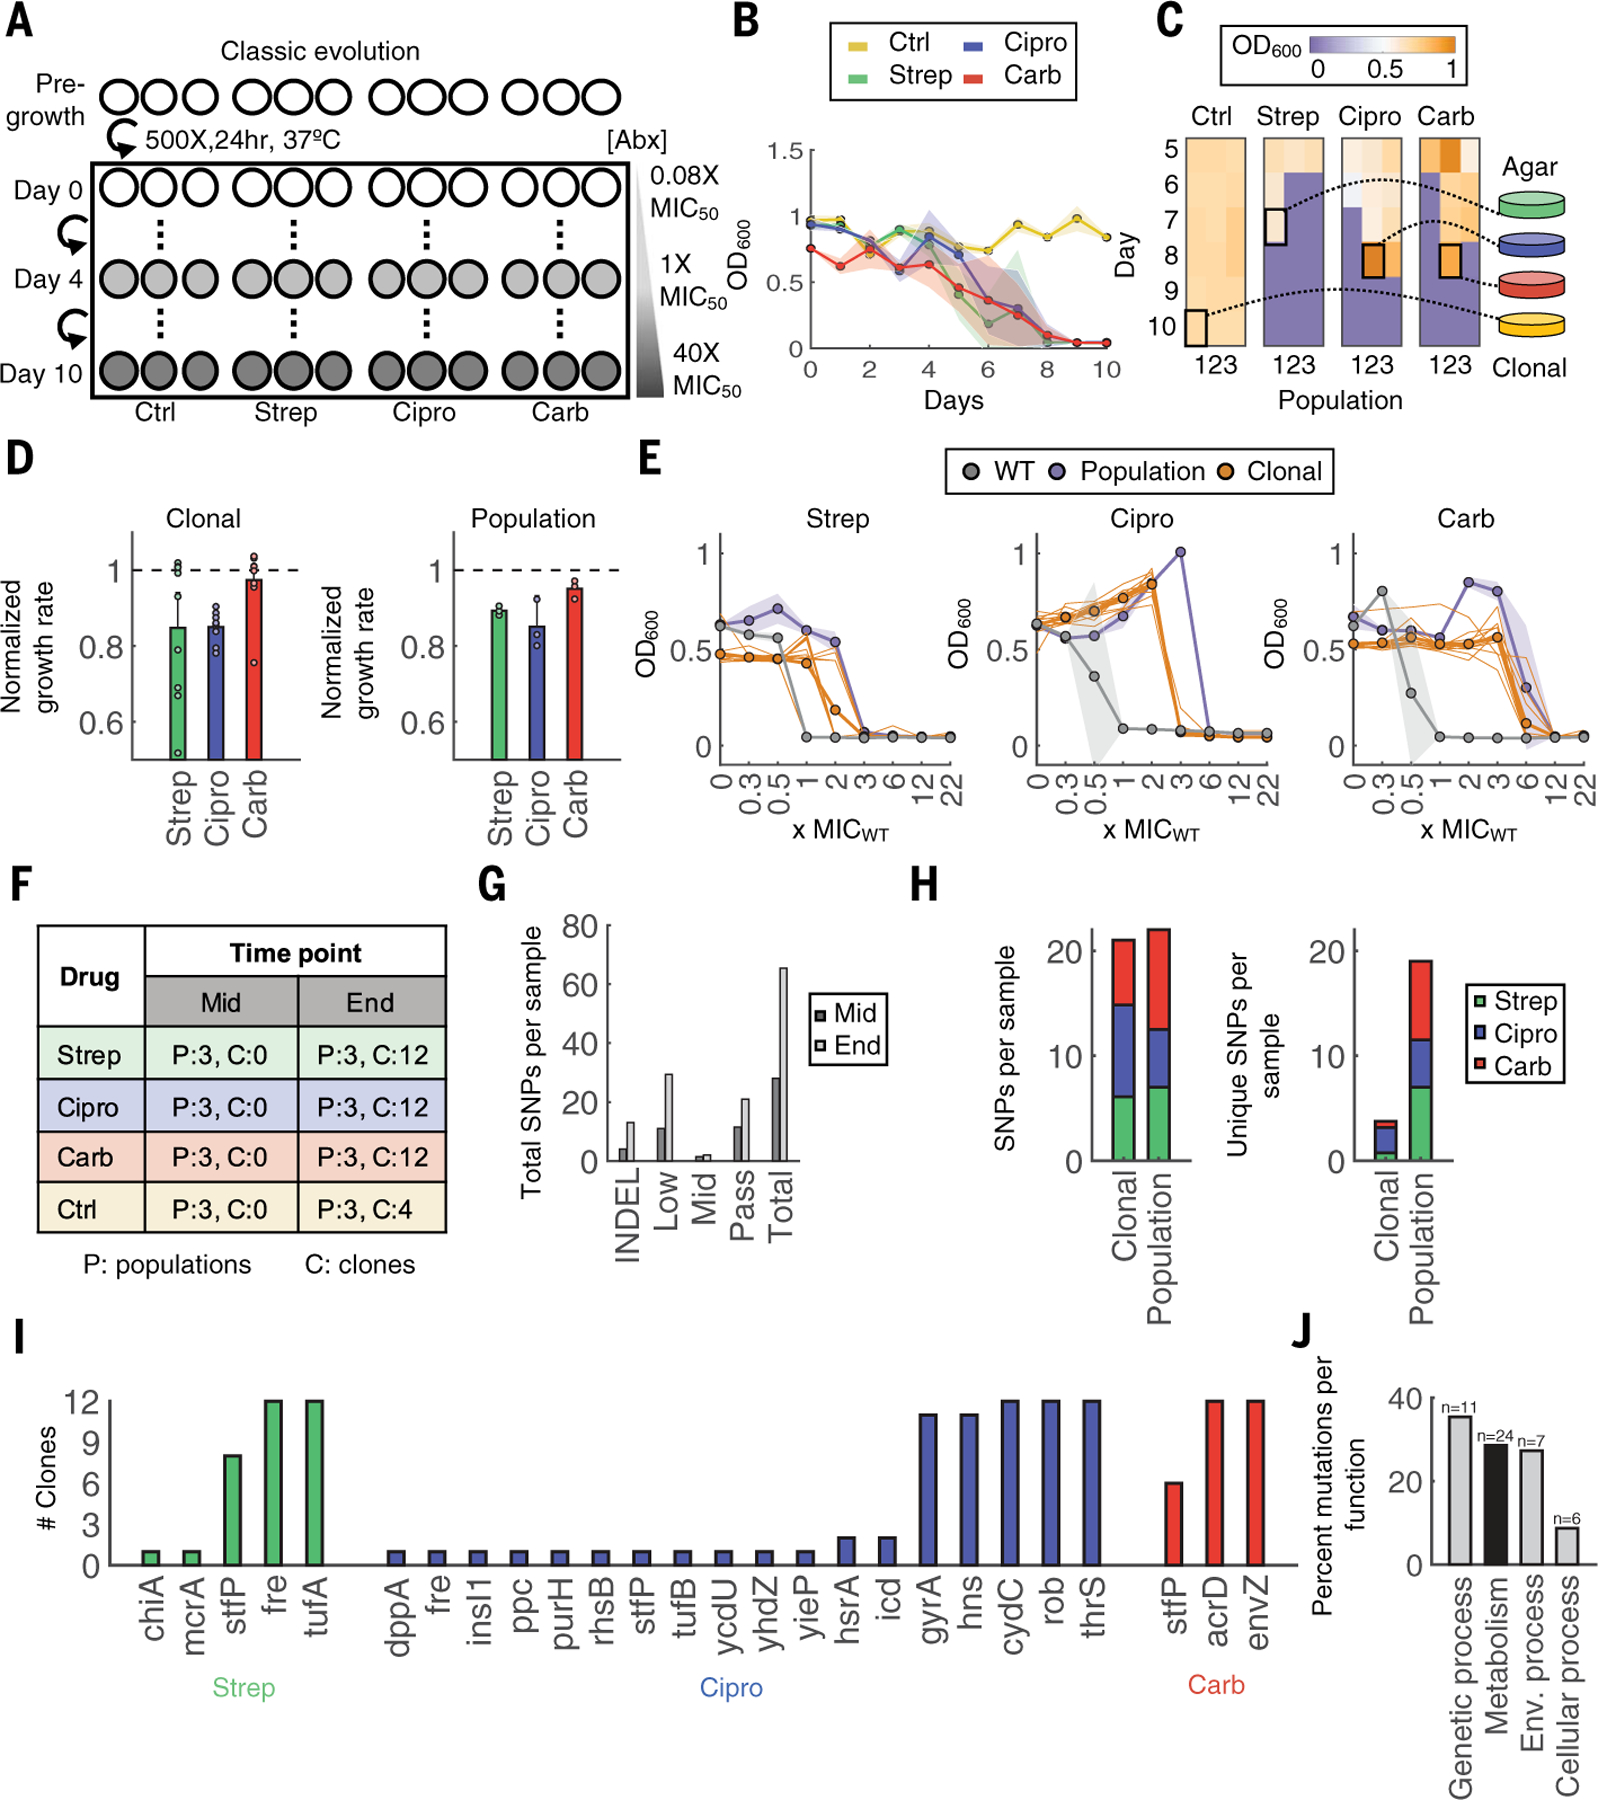
(A) Evolution schematic. Triplicate populations were treated with no antibiotic, strep, carb, or Cipro at increasing concentrations from 0.08× to 40× MIC50 over 11 days (days 0 to 10). (B) Daily OD600 measurements. Shaded color represents SD of three population replicates. The colors yellow, green, blue, and red indicate control, strep, Cipro, and carb, respectively. (C) Frozen samples of all populations starting on day 5 until day 10 were revived in drug-free medium to identify the terminal population per condition (highlighted square). Heatmap shading from purple to orange indicates OD600 levels from low to high, respectively. (D) Growth rates of 12 individual clones (left) or whole populations (right). Growth rates were normalized to the average growth rate of the untreated control (dashed black line for reference). Bars represent average of either 12 clones (left) or three biological replicates (right), and error bars indicate SD. (E) MICs of clones and populations. Bolded gray, orange, and purple lines indicate averages of three WT strain replicates, 12 clones, or three terminal population replicates, respectively. The 12 individual clones are shown in thin orange lines, and shading indicates the SD for WT and population samples. (F) Sequencing sample overview. Each number corresponds to the number of samples sequenced for population (P) or clonal (C) samples. (G) Mutations summary. Mutations include indels and SNPs at frequencies determined by Pilon (passing >~90%; midlevel ~25 to 90%; low ~0.2 to 25%). SNPs per sample are summed across all samples at each time point. (H) Total SNPs per population compared with clonal samples (left). Unique SNPs per population compared with clonal samples (right). (I) Passing SNPs per gene in sequenced clones. (J) KEGG Orthology and BRITE hierarchy classification for broad functional categories; n is the number of genes per category, and the y-axis is the percentage of all genes grouped into the corresponding category.