
Fig. 4. Metabolic mutations are highly prevalent in clinical E. coli genomes and confer resistance.
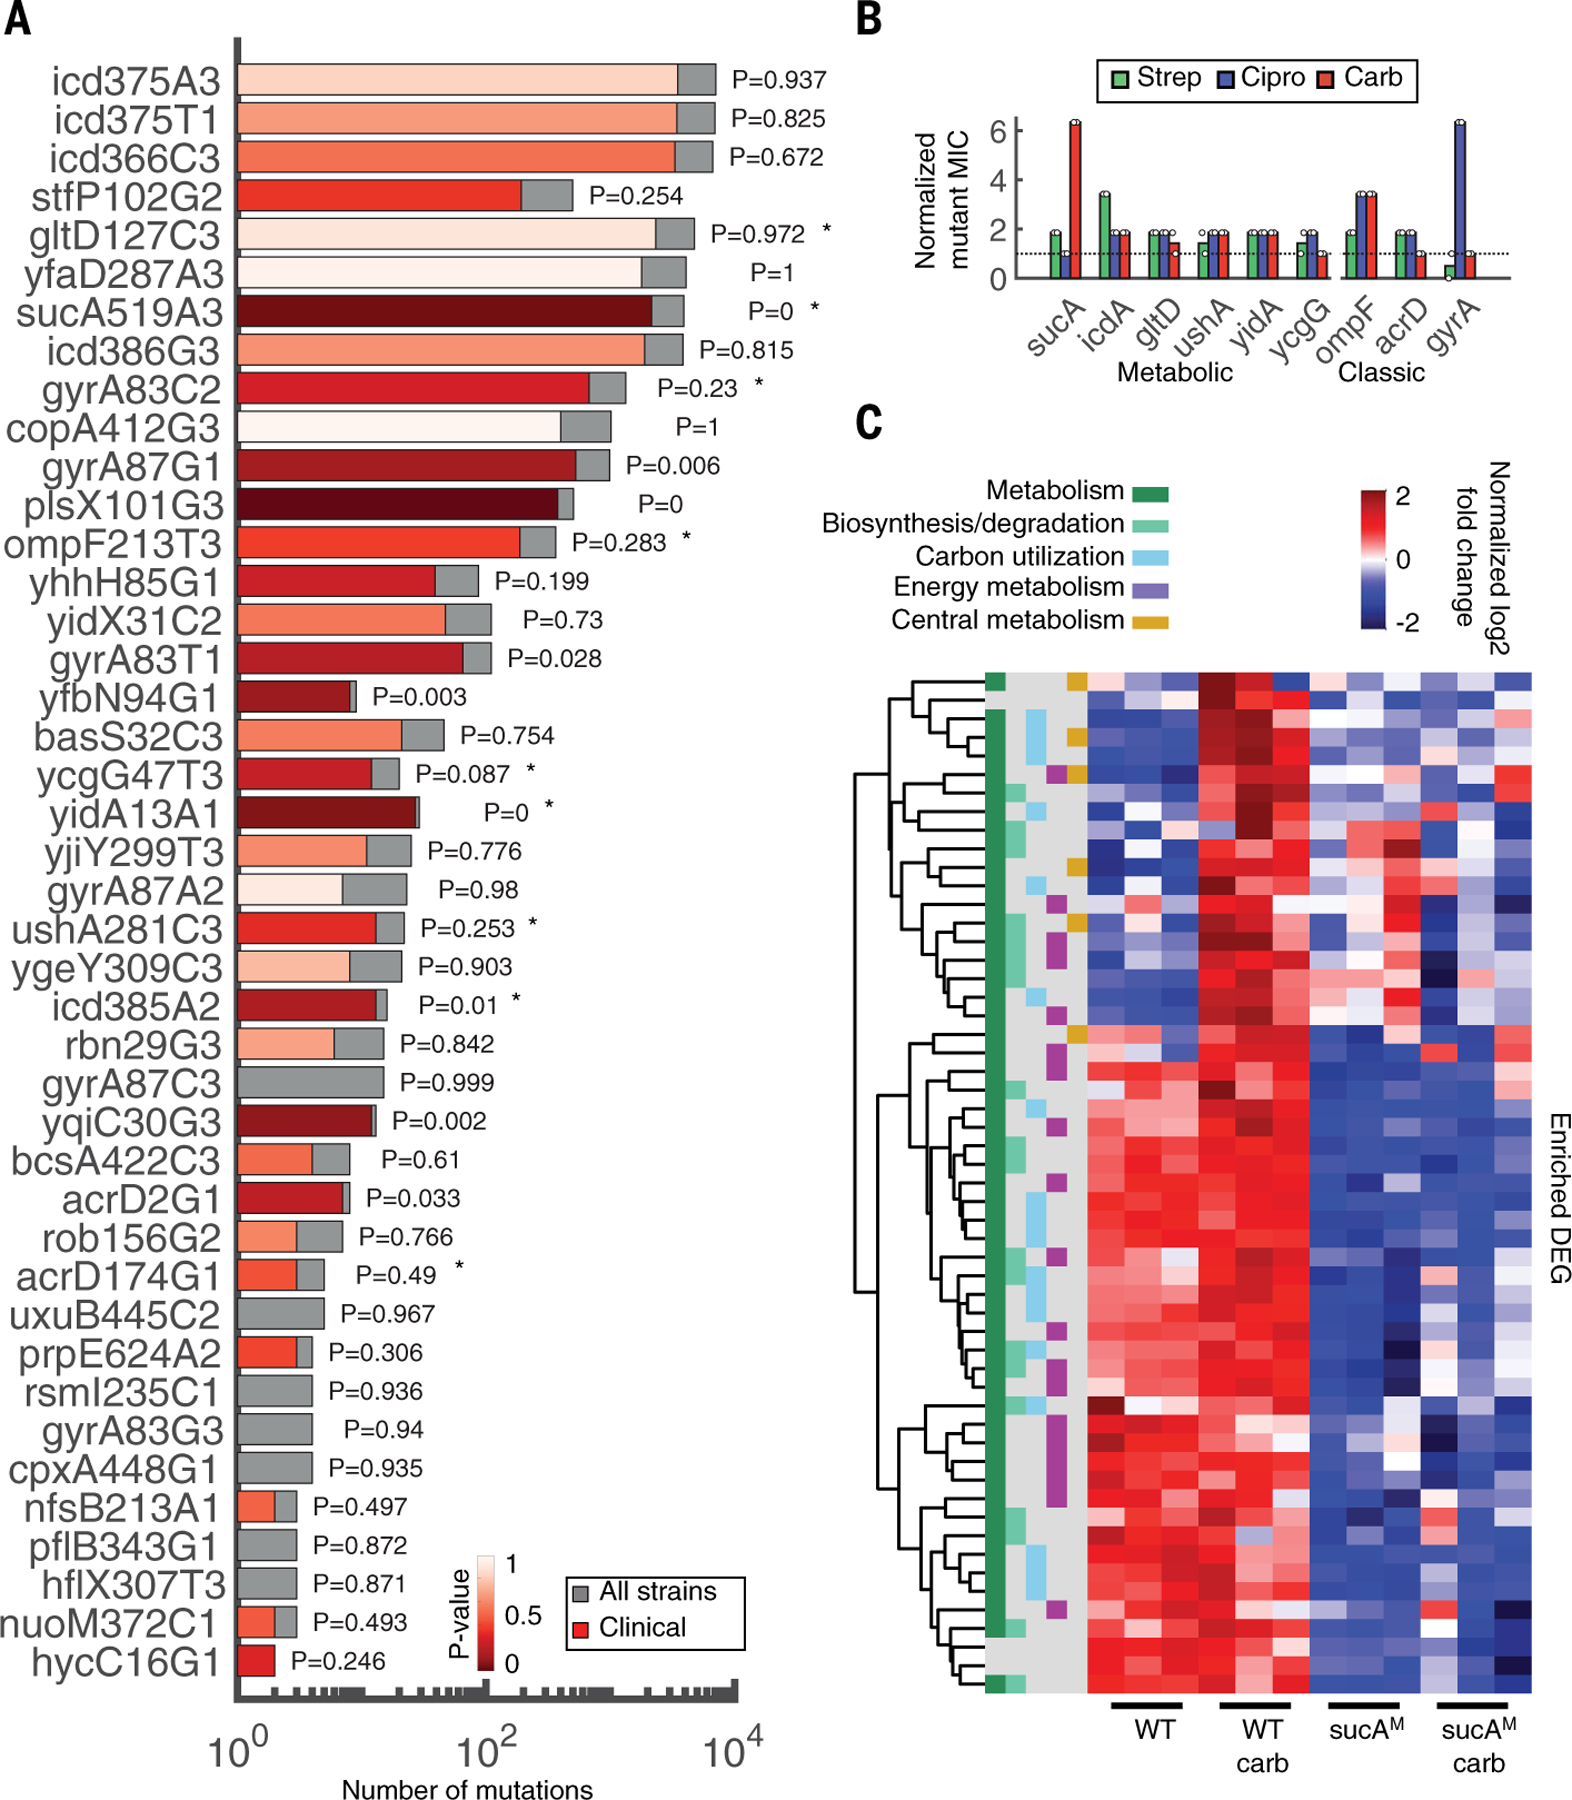
(A) Mutations in coding sequences were searched for in a database of 7243 genomes downloaded from NCBI. Bars indicate the number of strains with the specific mutation from our dataset (gray, total number; red, clinical strains). The significance and P values of the overrepresentation of each mutation within the subset of clinical strains is colored in varying degrees of red, from highly to not significant (dark to light red, respectively). Stars denote mutations tested in (B). The y-axis labels consist of gene name, codon position, reference allele, and nucleotide position, respectively. (B) MIC fold change of mutants compared with WT. Mutant sequences of a representative subset of metabolic (sucA, icd, gltD, ushA, yidA, and ycgG) and classic (ompF, acrD, and gyrA) genes were integrated onto the plasmid pAB downstream of the strong constitutive promoter proD. Each plasmid was introduced into the corresponding knockout strain, except for gyrA, which was introduced into the WT strain BW25113 because this gene is essential, and ycgG, which is compared with the knockout strain only because this mutation disrupted the gene. Control strain is BW25113 carrying pAB191 (black dashed line). Two biological replicates are represented by the circles; bars represent the average of both. MICs for all three drugs (strep, Cipro, and carb; green, blue, and red, respectively) were obtained after 10 hours. (C) Hierarchical clustering of DEGs in the presence and absence of carb treatment. All down-regulated DEGs between carb-treated WT and sucAM were enriched for overrepresented pathways in Ecocyc. Read counts were converted into counts per million (CPM). Heatmap color represents the log-2–transformed, trimmed mean of M values (TMM)–normalized CPM values. Functional categories are defined from MultiFun ontologies from Ecocyc. The y-axis includes all genes that were significantly enriched. The ordered list of genes can be found in table S14.