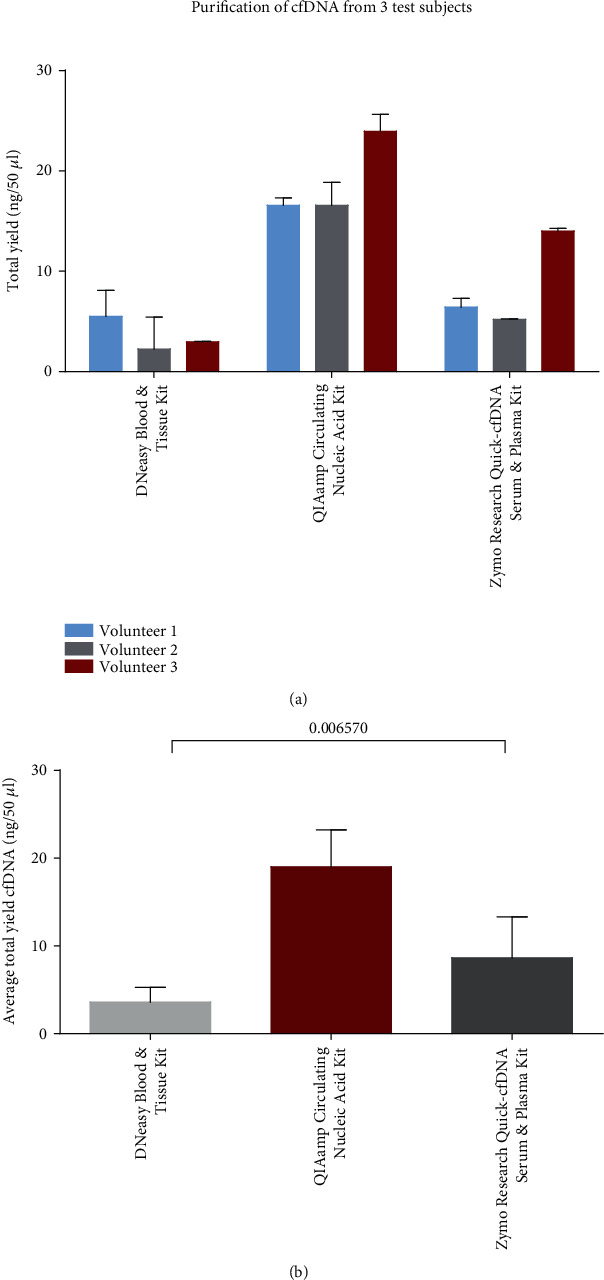
Figure 2.

Comparison of cfDNA purification kits. (a) The mean of cfDNA yield of duplicate purification for each volunteer and each kit with a standard deviation. (b) The mean yield of cfDNA from all three volunteers with standard deviation. P value obtained by one-way ANOVA test. Bars represent the total yield of cfDNA purified from 1 ml of plasma in technical duplicates.
