

Keywords: arousal, confirmation bias, decision-making, human, psychophysics
Abstract
Many decisions result from the accumulation of decision-relevant information (evidence) over time. Even when maximizing decision accuracy requires weighting all the evidence equally, decision-makers often give stronger weight to evidence occurring early or late in the evidence stream. Here, we show changes in such temporal biases within participants as a function of intermittent judgments about parts of the evidence stream. Human participants performed a decision task that required a continuous estimation of the mean evidence at the end of the stream. The evidence was either perceptual (noisy random dot motion) or symbolic (variable sequences of numbers). Participants also reported a categorical judgment of the preceding evidence half-way through the stream in one condition or executed an evidence-independent motor response in another condition. The relative impact of early versus late evidence on the final estimation flipped between these two conditions. In particular, participants’ sensitivity to late evidence after the intermittent judgment, but not the simple motor response, was decreased. Both the intermittent response as well as the final estimation reports were accompanied by nonluminance-mediated increases of pupil diameter. These pupil dilations were bigger during intermittent judgments than simple motor responses and bigger during estimation when the late evidence was consistent than inconsistent with the initial judgment. In sum, decisions activate pupil-linked arousal systems and alter the temporal weighting of decision evidence. Our results are consistent with the idea that categorical choices in the face of uncertainty induce a change in the state of the neural circuits underlying decision-making.
NEW & NOTEWORTHY The psychology and neuroscience of decision-making have extensively studied the accumulation of decision-relevant information toward a categorical choice. Much fewer studies have assessed the impact of a choice on the processing of subsequent information. Here, we show that intermittent choices during a protracted stream of input reduce the sensitivity to subsequent decision information and transiently boost arousal. Choices might trigger a state change in the neural machinery for decision-making.
INTRODUCTION
Many decisions need to be made on the basis of noisy, incomplete, or ambiguous decision-relevant information. An extensive body of research on perceptual decisions under uncertainty has converged on the idea that evidence about the state of the sensory environment is continuously accumulated across time (1, 2). In the choice tasks commonly used in the laboratory, performance is maximized by weighing evidence equally across time (1, but see 3–5). Yet, the evidence weighting applied by human and nonhuman decision-makers often deviates from such flat weighting profiles. Some studies found stronger weighting of early evidence (“primacy”; 6–9), others stronger weighting of late evidence (“recency”; 10–12), and yet others even nonmonotonic weighting profiles (13, 14). These distinct temporal weighting profiles may inform about differences in the mechanisms underlying decision formation (14–17). Yet, mechanistic inferences are limited by the fact that most of the above studies were conducted in different subjects and used various different stimuli and tasks (with evidence varying on different timescales). Thus, the resulting heterogenous weighting profiles may also reflect idiosyncratic strategies and/or task or stimulus differences. Demonstrations of changes in evidence weighting within subjects processing the same stimulus material are rare (15).
Real-life decisions are not isolated events but embedded in a sequence of judgments based on continuous streams of information, raising the question of whether and how successive decisions interact. Even in elementary perceptual decisions, postdecisional neural signals reflecting the previous choice have been identified in several regions of the monkey (18, 19) and rodent brain (20, 21). Likewise, perceptual choices are biased by the choices made on previous trials (22–37). Recently developed psychophysical protocols provide new tools for quantifying the effect of choices on the subsequent processing of decision evidence. These tasks prompt two successive judgments within the same trial: a binary choice, followed by a continuous estimation (38–43) or a confidence judgment (44, 45). In some of those tasks, the binary choice is followed by an additional evidence stream, enabling quantification of the impact of the choice on the processing of subsequent evidence (38, 42). These task designs have yielded two insights. First, the overall sensitivity to evidence following the intermittent choice is reduced in a nonselective fashion. Second, sensitivity for information consistent with the binary choice is selectively enhanced, at the expense of reduced sensitivity for choice-inconsistent evidence, yielding a bias to confirm the initial choice (confirmation bias; 42).
Here, we studied the relationship between the nonselective and selective changes in sensitivity following a choice and assessed their impact on temporal evidence weighting profiles. To this end, we reanalyzed the data sets from both these previous studies (38, 42). For one of the data sets, we also explored a relationship between these behavioral phenomena and pupil-linked, phasic arousal (35, 46–49).
MATERIALS AND METHODS
Behavioral Tasks
Perceptual task.
The University of Amsterdam ethics review board approved the study (reference number 2014-BC-3517). All participants gave their written informed consent. Participants were presented with two random dot motion stimuli in succession and were asked to estimate the average motion direction across the two intervals in each trial (Fig. 1A). A white line plotted on top of the circular aperture served as the reference, whose position changed between trials. An auditory cue after the first interval prompted the participants to make one of the two intermittent responses: 1) report a binary choice about the direction of dots in the first interval (clockwise (CW) or counterclockwise (CCW) with respect to the reference; two-third proportion of all trials) by pressing left/right mouse buttons; or 2) make a choice-independent button press (one-third proportion of all trials) by pressing the central mouse wheel. This intermittent response allowed us to investigate if participants showed different sensitivity to the second stimulus depending on whether they reported a binary choice (so-called “Choice trials”) or made a choice-independent motor response (so-called “No-Choice trials”). The position of the reference line for each participant was constrained to be within the top half or bottom half of the stimulus annulus (balanced across participants) to ensure a fixed choice (CW/CCW)–response (left/right buttons) mapping. The delay between the first and second stimuli was fixed (2 s), regardless of the reaction time of the subject. Participants gave their estimation response by dragging a red line around the circle using the mouse, starting from the reference line, and clicking the mouse at the end point. Half of all choice trials ended with an auditory feedback about the correctness of the binary choice to motivate participants to take the binary choice component seriously. An animation of the task structure is shown in the supplemental video file (Supplemental Video S1; all Supplemental material is available at https://doi.org/10.6084/m9.figshare.12752723). Feedback for the estimation response was provided at the end of each block (69 trials) as the mean deviation of the estimation report from the physical stimulus direction. The coherence of the stimuli was fixed at a predetermined level for each subject, and the direction of coherent dots in the two intervals was sampled independently from five possible values (−20°, −10°, 0°, 10°, 20° relative to the reference line). In all, 23 possible combinations of directions were used in the experiment (excluding the two most obviously conflicting directions: −20°/20° and 20°/−20°). A total of 90 trials for each combination of stimulus directions in the first and second intervals (45 Choice trials, and 45 No-Choice trials) were presented to the subjects. Subjects were not explicitly instructed about the distribution of stimuli. However, it is possible that subjects may have learned during the course of the task that the extremely inconsistent stimuli in the two intervals (+20 in interval 1, −20 in interval 2 and vice versa) are unlikely in the task. However, such knowledge does not affect the sensitivity measures we computed since the stimulus sequences across both Choice and No-Choice conditions were counterbalanced for every subject (see Supplemental Fig. S1).
Figure 1.
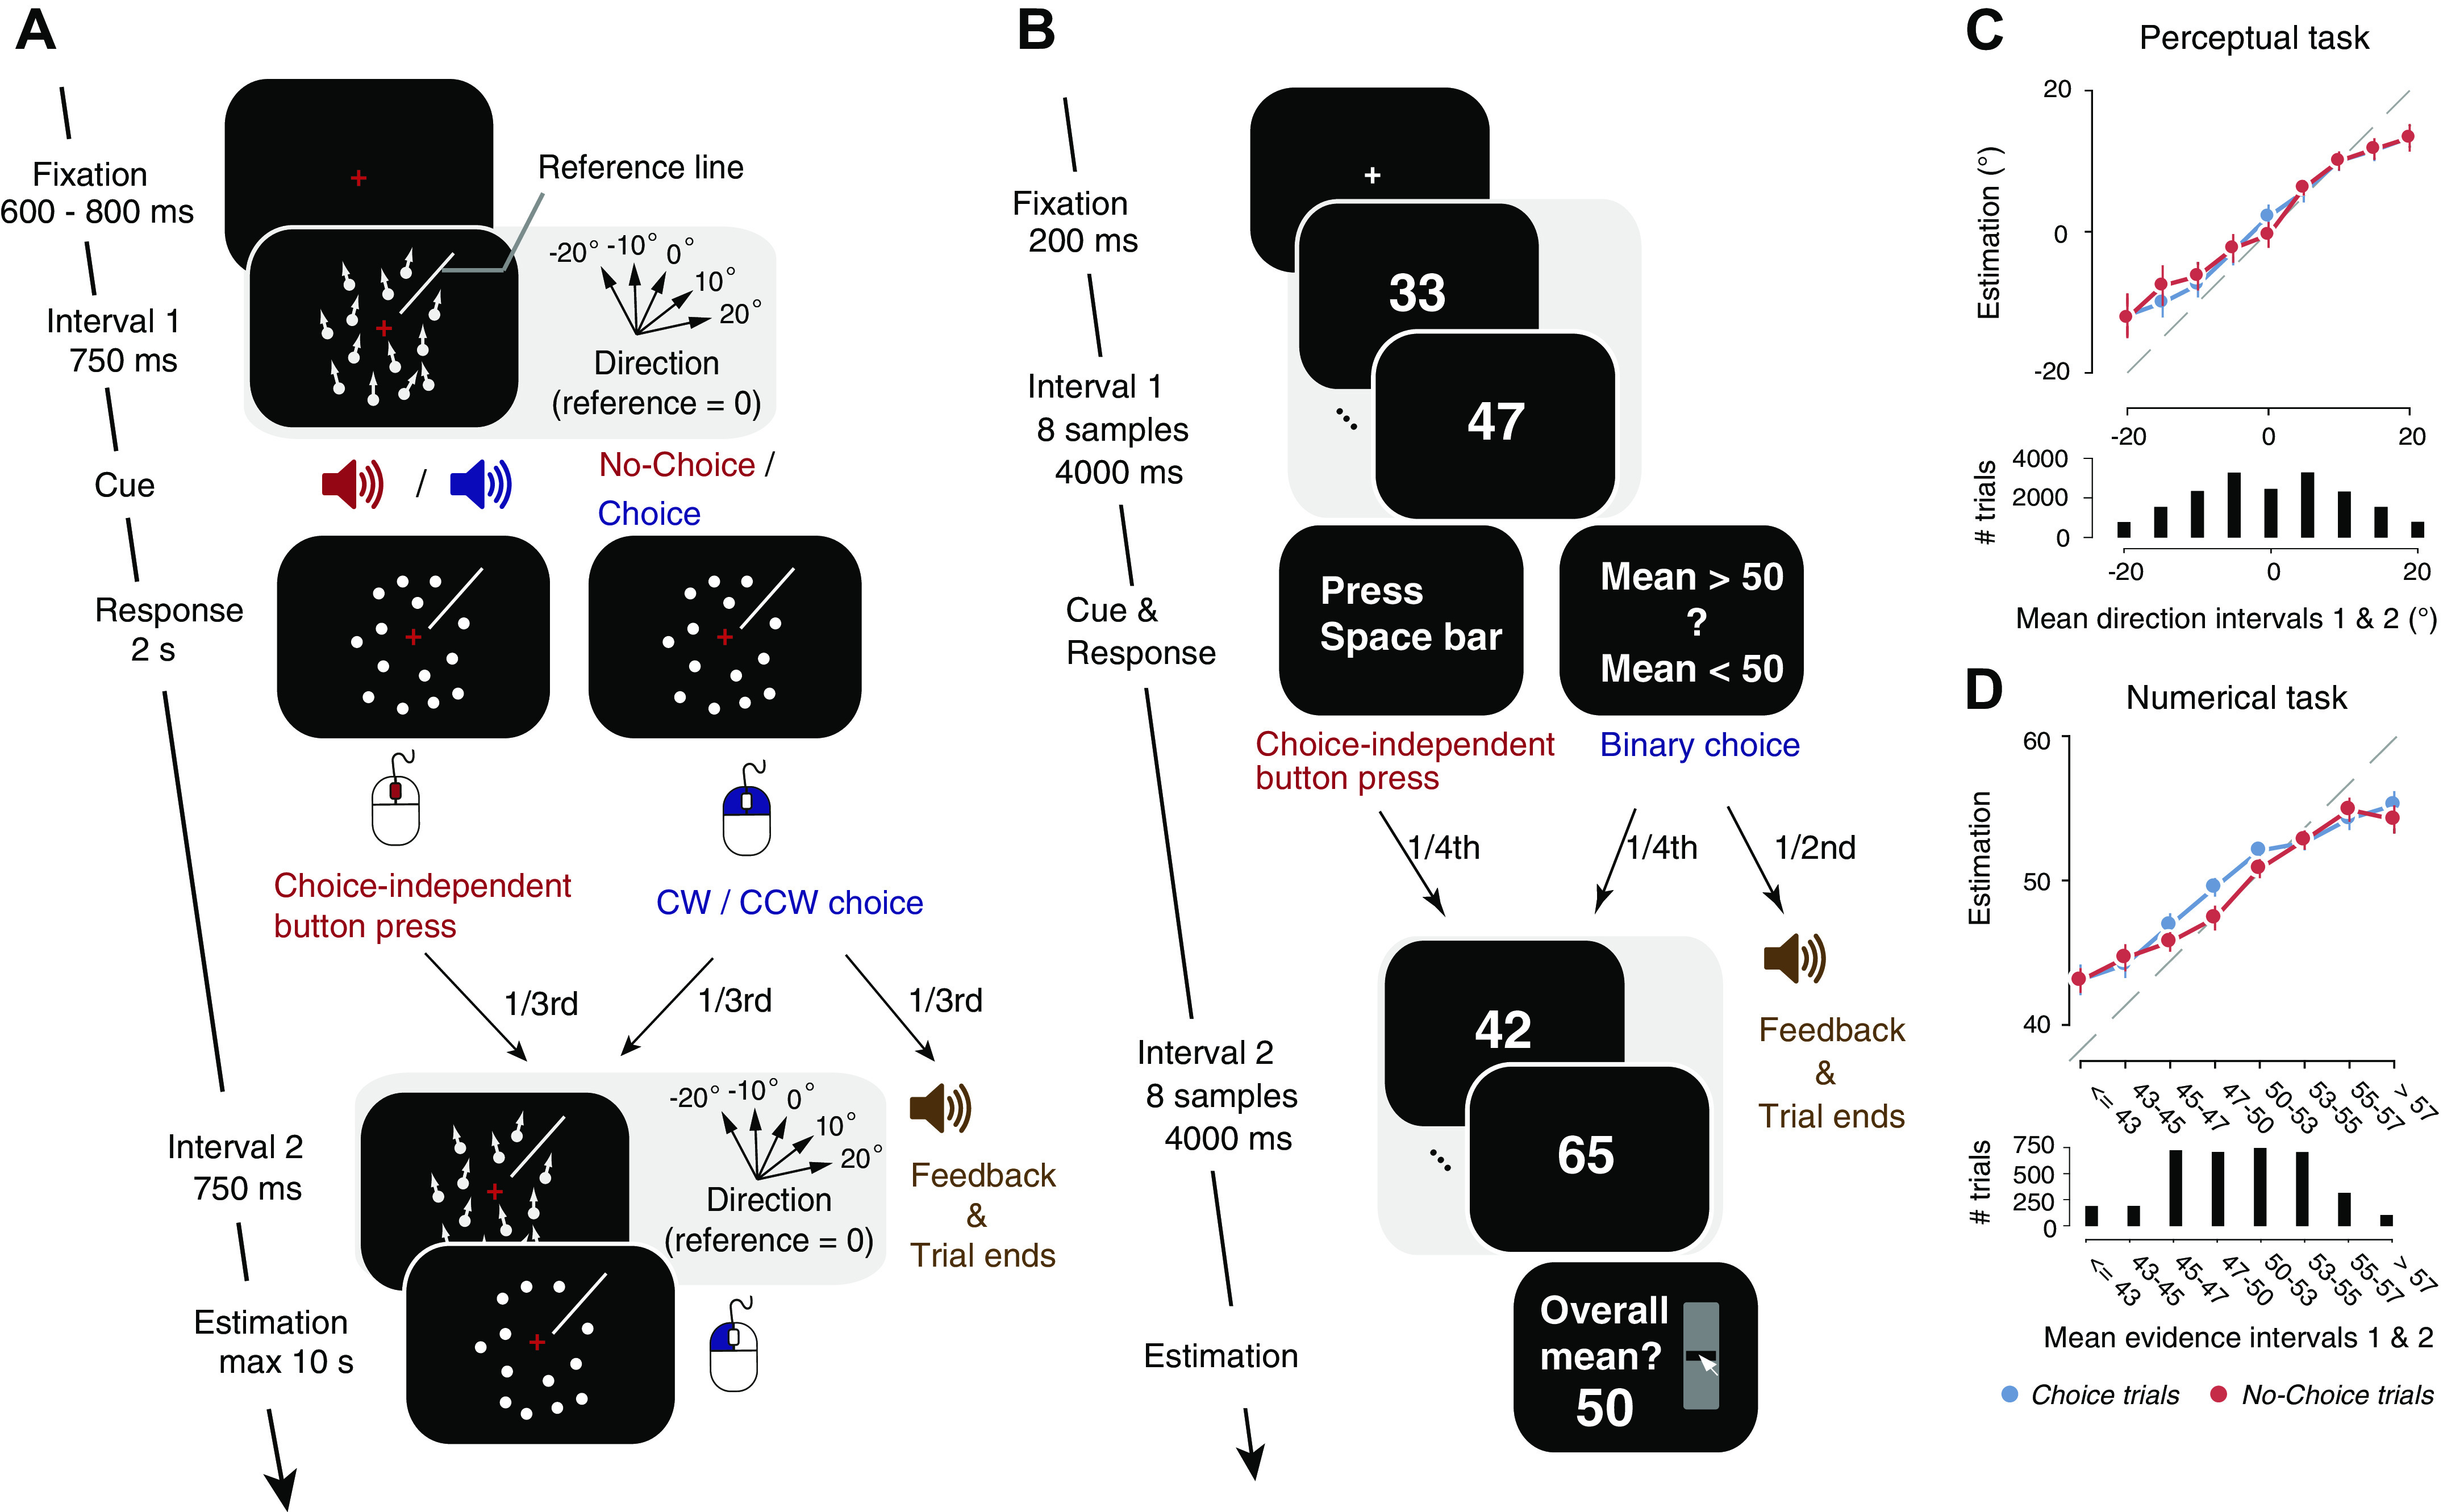
Behavioral tasks: schematic of sequence of events within a trial. A: Perceptual task. After a first random dot motion stimulus was shown for 750 ms, participants received an auditory cue about whether to report a binary choice about the net motion direction (Choice trials) or to continue the trial (No-Choice trials). The choice entailed discriminating the motion direction as clockwise (CW) or counterclockwise (CCW) with respect to the reference (white line shown at about 45° in this example). On half the Choice trials, auditory feedback was then given and the trial terminated. In the other half, and in all No-Choice trials, a second motion stimulus was presented (with equal coherence as the first but different direction), and participants were asked to report a continuous estimate of the mean direction of both stimuli by dragging a line along the screen with the mouse. Directions in the first and second intervals were sampled from one of the five possible values shown, with respect to the reference (0° corresponds to direction along the white reference line). See Supplemental Video S1 for a video of the task structure. B: Numerical task. After the first sequence of eight numerical samples, participants were instructed to either press the space bar (a quarter of all trials; No-Choice trials), or to give their binary choice about the average of the eight samples (mean >50 or <50; Choice trials). On two-thirds of Choice trials (constituting a half of all trials), auditory feedback was presented and the trial terminated. In the rest, a second sequence of eight numerical samples was presented and participants were instructed to give a continuous estimate of the mean across the two sequences. Adapted from Ref. 42 under a CC-BY license. C, top: continuous estimations as a function of mean direction across both stimuli in the perceptual task. Bottom: distribution of mean directions across trials. Data points, group mean; error bars, SE. Stimulus directions and estimations were always expressed as the angular distance from the reference, the position of which varied from trial to trial (0° equals reference). D: same as C but for Numerical task. Mean evidence across intervals 1 and 2 in D split into discrete bins for illustration.
In all the analyses that follow, we used trials where participants made an estimation judgment (Choice trials and No-Choice trials). We excluded trials in which participants did not comply with the instructions, i.e., when they pressed the mouse wheel on Choice trials or a choice key on No-Choice trials, trials in which the binary choice response time was below 200 ms, and trials where estimations were outliers. Outliers were defined as those trials whose estimations fall beyond 1.5 times the interquartile range above the upper-quartile or below the lower-quartile of estimations. Together, these excluded trials corresponded to ∼7% of the total trials across participants. The distributions of trials used for analysis are shown in Supplemental Fig. S1, A and B.
We analyzed data from the same set of participants as in our earlier report (42). Please refer to this report for a detailed description of the task, participants, and stimuli used in the experiments.
Numerical task.
We reanalyzed data from the numerical integration task in Ref. 38 using the same analyses methods as the perceptual task. The task has a similar structure as the perceptual task (Fig. 1B), with the exception that participants saw 16 numerical samples displayed in succession and reported their mean as a continuous estimate. Like in the perceptual task, participants received a cue midway through the trial (i.e., after the first 8 samples) to either report a binary choice about the mean of the eight samples (greater or less than 50) or to make a choice-independent motor response (by pressing the space bar). In 50% of all trials, the trial terminated with feedback after the binary choice. On another 25% of the trials, participants saw the second stream of eight numerical samples and made the continuous estimation judgment at the end (Choice trials). In the rest 25% of trials, participants made a choice-independent motor response (No-Choice trials) instead of the binary choice and a continuous estimation judgment at the end. We analyzed data from all the trials where participants made the estimation judgment (50% of all trials).
The sequence of eight numbers in each interval was generated from one of the four predefined triangular skewed-density distributions with means of 40, 46, 54, or 60 (38). The numbers ranged between 10 and 90. Numbers were sampled such that two identical numbers were never presented in succession. The first eight numbers were sampled from one of the two distributions with means at 46 or 54, and the second eight numbers were independently sampled from one of the four distributions, randomized between trials. This ensured that subjects could not guess the mean of the second sequence of numbers after the first interval.
We analyzed data from 20 out of 21 participants participated in the study. The remaining subject (subject 21) failed to do the task (Spearman’s correlation between estimation and mean evidence in No-Choice trials: rho = 0.18, P = 0.117; and in Choice trials: rho = 0.17, P = 0.156). Please see the earlier reports (38, 42) for more detailed description of the task, stimuli, and participants.
Pupillometry
Horizontal and vertical gaze position as well as pupil diameter were recorded at 1000 Hz using an EyeLink 1000 (SR Research). The eye tracker was calibrated before each block. Blinks detected by the EyeLink software were linearly interpolated from −150 ms to 150 ms around the detected velocity change. All further data analysis was done using FieldTrip (50) and custom Matlab scripts. We estimated the effect of blinks and saccades on the pupil response through deconvolution (35, 48, 51) and removed these responses from the data using linear regression. The residual pupil signal was bandpass filtered from 0.01 to 10 Hz using a second-order Butterworth filter, Z-scored per block of trials, and downsampled to 50 Hz. We extracted epochs of the pupil time series comprising the trials of the behavioral task and baseline corrected the pupil time-course in each trial by subtracting the mean pupil diameter 500 ms before the onset of the first evidence stream on each trial. This yielded a single measure of the task-evoked pupil response as used in previous studies (35, 48).
Within each experimental condition (Choice, No-Choice, Consistent, Inconsistent), we averaged the corrected pupil responses across trials, time-locked to the onset of the first evidence sequence and spanning up to the onset of the next trial, or a maximum duration of 6 s.
Modeling Discrimination Judgments
Participants’ binary choices in the perceptual and numerical tasks were modeled using a sigmoidal probit psychometric function, relating the proportion of CW choices (>50 choices in the numerical task) to the stimulus direction (mean of the 8 numerical samples) in the first interval, as follows:
| (1) |
where ϕ1 was the stimulus direction (mean of 8 numerical samples in Numerical task) in the first interval, was the cumulative Gaussian function, α was the slope of the psychometric function (perceptual sensitivity), and δ was the horizontal shift of the psychometric function (systematic bias toward one of the two choice alternatives). The free parameters α and δ were estimated using maximum likelihood estimation (52). In the data from the numerical task, the sample means from the first interval were binned into six bins, three on each side of the reference (50) before fitting the psychometric function.
Modeling Estimation Reports
General approach.
We used a statistical modeling approach to estimate the relative contribution of the evidence (i.e., physical stimulus or numerical evidence corrupted by noise) conveyed by successive dot motion stimuli in each interval (mean of numerical samples in each interval in the Numerical task) to participants’ trial-by-trial estimation reports. The noisy sensory (or numerical) evidence was described by:
| (2) |
where i ∈ (1, 2) denotes the interval, ϕi is the physical stimulus direction (or the mean of 8 numerical samples in the Numerical task), N (0, σ2) was zero mean Gaussian noise with standard deviation σ (= 1/α), δ and α were each observer’s individual overall bias and sensitivity parameters respectively taken from the psychometric function fit to the binary choice data (Eq. 1).
Global Gain Model
We modeled a global, choice-related change in sensitivity to evidence following an overt choice, by allowing the weights to vary separately in Choice trials and No-Choice trials. The estimations were modeled by:
| (3.1) |
| (3.2) |
where yc (ync) was the vector of estimations across all Choice (No-Choice) trials, w1c (w1nc) and w2c (w2nc) were the weights for the noisy evidence X1c (X1nc) and X2c (X2nc) encoded in intervals 1 and 2 in Choice (No-Choice) trials, respectively. N (0, ξ2) was zero-mean Gaussian estimation noise with variance ξ2 that captured additional noise in the estimations, separately for Choice (ξc), and No-Choice (ξnc) trials, over and above the sensory noise corrupting the binary choice.
Quantifying Confirmation Bias in Choice Trials
Using data from the sensory and numerical tasks, we showed in our previous work that people exhibited confirmation bias by overweighting evidence in the second interval that was consistent with the intermittent binary choice (42). To this end, we fitted a model referred to as “choice-based selective gain” model to Choice trials (42). The model is described below:
| (4.1) |
| (4.2) |
where w1cc (w2cc) and w1ic (w2ic) were the weights, ξcc and ξic were the estimation noise parameters for Consistent and Inconsistent trials, respectively, ϕ2 was the vector of physical stimulus directions (mean of 8 samples in the Numerical task) from the second interval, and D was the vector of intermediate binary choice (values: 1 or −1 for CCW and CW reports in the perceptual task, and for <50 and >50 reports in the Numerical task, respectively). We excluded the subset of trials where consistency is not defined in Eq. 4, i.e., ϕ2 = 0° in Perceptual task, and 50 in the Numerical task. Confirmation bias is quantified as the difference in the weights w2cc and w2ic.
Fitting Procedure
The models described in Eqs. 3 and4 assume that the stimuli and estimation judgments are corrupted by Gaussian noise. Thus, on a given trial (comprising a unique combination of experimental variables: first and second stimuli and choice), the estimation that is predicted by a certain model parametrization is a continuous random variable characterized by a probability density function (hereafter, the estimation distribution). Similar to our earlier report (42), we fitted the models to the data using a maximum likelihood approach. For each trial, we calculated the log-likelihood of the estimation judgment provided by the participant given the estimation distribution predicted by the model. Using the Subplex algorithm (53, 54), which is a generalization of the Nelder–Mead simplex method, we searched for the parameter set that maximized the sum of the log-likelihood values across all trials.
Importantly, we obtained the estimation distributions of the models numerically, which allowed us to estimate maximum likelihood parameters accurately without relying on stochastic stimulations. To illustrate our numerical approach, we next describe how the estimation distribution is calculated in the global gain model (Eqs. 3.1 and 3.2). In a No-Choice trial, the estimation predicted by the model is the sum of three Gaussian variables (Eq. 3.2): the weighted noisy (see Eq. 2) representation of the stimulus in interval 1 (w1ncX1nc∼N(w1nc(ϕ1 + δ), w1nc2σ2)), the weighted noisy representation of the stimulus in interval 2 (w2ncX2nc∼N(w2nc(ϕ2 + δ), w2nc2σ2)), and estimation noise (N(0, ξnc2)). The estimation report, being the sum of three Gaussian variables, is a Gaussian variable itself with the following density function (or estimation distribution):
Akin to a No-Choice trial, in a Choice trial, the estimation report is also the sum of three random variables (Eq. 3.1). In contrast to a No-Choice trial, however, the weighted noisy representation of the stimulus in interval 1 is conditioned upon the categorical choice that was given at the end of that interval. Specifically, conditioning upon the choice means that the density of the N(w1c(ϕ1 + δ), w1c2σ2) probability function is set to zero for all positive (negative) stimulus values, if a negative (positive) categorical choice was made (positive refers to the side on the right of the reference and negative to the side on the left). This density truncation captures the fact that the noisy instantiation of the interval 1 stimulus gives rise (and thus cannot be incongruent) to the categorical choice. Due to the truncation, the weighted noisy representation of the interval 1 stimulus is a non-Gaussian variable and, accordingly, the estimation report in Choice trials is also a non-Gaussian variable. To derive the estimation distribution, we thus numerically convolved the interval 1 non-Gaussian density function with the other two Gaussian density functions [w2cX2c∼N(w2c(ϕ2 + δ), w2c2σ2) and N(0, ξc2)]. A similar convolution approach was used when deriving the estimation distribution of the selective gain model (Eq. 4).
ROC Analysis for Differences in Sensitivity to Evidence in Interval 2
We assessed the impact of an overt choice on the evidence in interval 2 from participants’ estimations in a model-free fashion, using the so-called ROC analysis. This analysis was based on the receiver operating characteristic (ROC) (55), similar to the one used in our earlier report (see “model-free analysis of estimation reports” in 42). The ROC index quantified the extent of separability between two distributions, with the value 0.5 if the distributions were identical, and 1 if they were completely separable. By computing ROC indices between estimation distributions of sets of trials that differed in their input, we could assess the sensitivity of the observer in using that input to guide their estimation reports.
For the perceptual task, in each condition (Choice and No-Choice), we first sorted trials based on the directional evidence in interval 1 (ϕ1). For each ϕ1, we ran the ROC analysis on all pairs of estimation distributions, separated by 10° of directional evidence in interval 2 (ϕ2): −20° versus −10°, −10° versus 0°, 0° versus 10°, and 10° versus 20°. This gave us four ROC indices per ϕ1, one index for every pair of distributions compared. We then computed a weighted average ROC index for each ϕ1, weighting the individual ROC indices by the number of trials that went into the ROC analysis. This approach ensured that the resulting ROC indices are robust to changes in ϕ1. These indices are averaged to obtain one single ROC index per subject for each condition.
ROC indices for the numerical task were computed similar to the above procedure with the following exceptions: mean evidence in interval 1 and interval 2 were binarized (mean >50 or mean <50) resulting in two bins for interval 1 and interval 2, respectively. We obtained qualitatively similar results using four bins to compute ROC indices. These binarized values were treated equivalent to ϕ1 and ϕ2 in the perceptual task above.
Simulated Estimation from Best Fitting Parameters
We simulated estimations for Choice trials using the trial distributions and best fitting parameters of the Global Gain model (Eq. 3.1) in individual participants in both the tasks. To this end, we first calculated the noisy representations X1 and X2 corresponding to intervals 1 and 2, using Eq. 2 above. We ensured that the sign of representations in X1 matches the binary choices of subjects (by randomly sampling the representations until a sample with the correct sign as that of the subjects’ choice was obtained), and then combined the representations from both intervals with the corresponding parameters for each individual subject using Eq. 3.1. The choice-based selective gain model (Eqs. 4.1 and 4.2) was fit to the simulated estimations to recover consistent and inconsistent weights (Fig. 4B).
Figure 4.
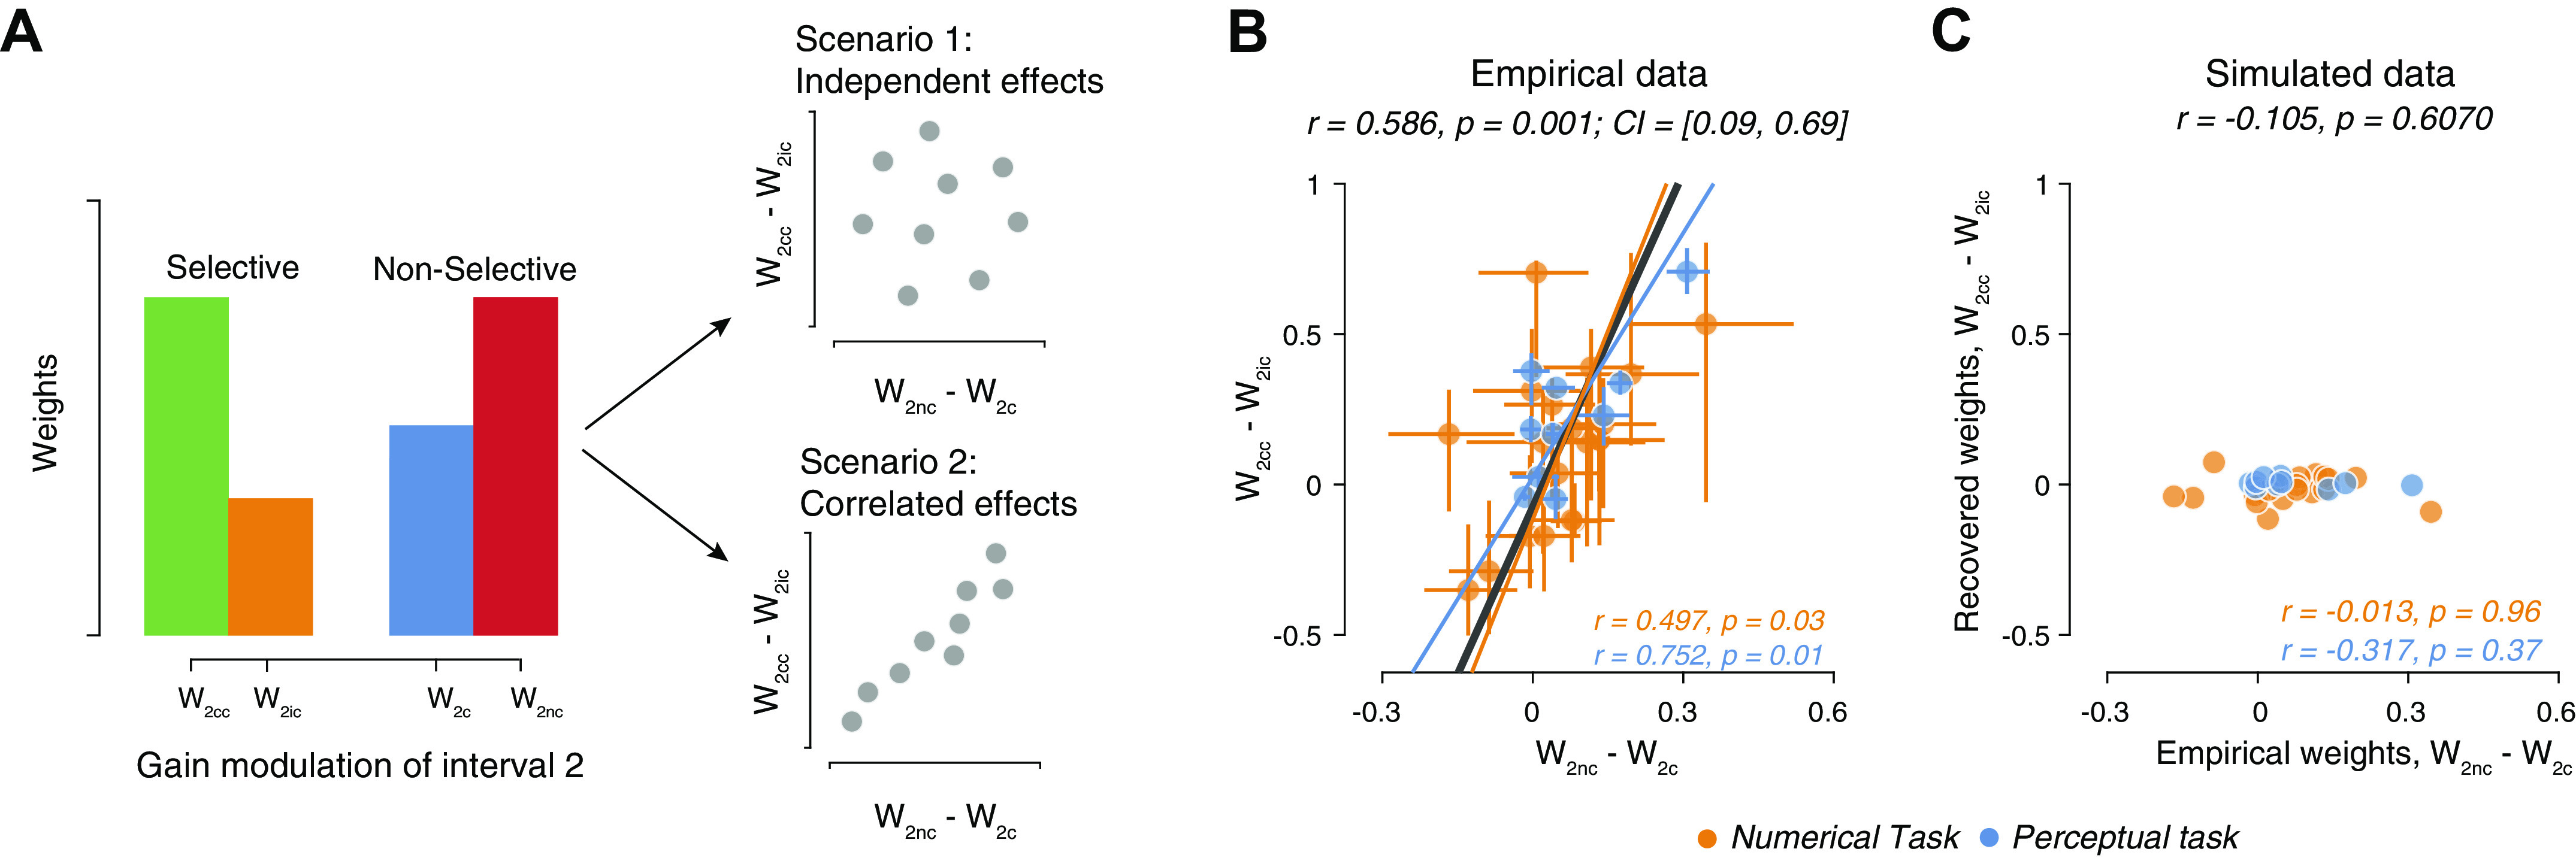
Relationship between global and consistency-dependent sensitivity modulation of subsequent evidence. A: schematic of two alternative relationships between the magnitudes of the observed nonselective and selective sensitivity modulations. Scenario 1: the two effects are produced by distinct mechanisms and thus their magnitudes are independent across subjects. Scenario 2: the two effects result from a common underlying mechanism and are therefore correlated across subjects. B: relationship between nonselective (quantified as the difference in weights to second interval between No-Choice and Choice conditions) and selective sensitivity modulation giving rise to Confirmation bias [quantified as the difference in weights to second interval between Consistent and Inconsistent conditions (42)], across participants from both tasks. C: same as B, but for simulated data. The parameters of the selective gain model (Consistent and Inconsistent weights) were estimated from data simulated using the best-fitting parameters of the Global Gain model for each participant (see materials and methods). Data points, individual participants; error bars on each data point, 66% bootstrap confidence intervals; solid lines, best fitting lines; dashed lines, identity lines; r, Pearson’s correlation coefficients; CI, 95% bootstrap confidence intervals for the correlation coefficients. w2c, weight for the noisy evidence in interval 2 in Choice trial; w2cc, weight for the noisy evidence in interval 2 in Consistent trial; w2ic, weight for the noisy evidence in interval 2 in Inconsistent trial; w2nc, weight for the noisy evidence in interval 2 in No-Choice trial.
Confidence Intervals for Individual Measures
We used bootstrapping (56) to obtain confidence intervals for the fitted parameters and ROC indices for each subject. Within each subject, we randomly selected trials with replacement and computed the model-based and model-free metrics on the bootstrapped data set. To compute model weights, we used the same fitting procedure but using the best fitting parameters of the actual data as starting points. We repeated this procedure 500 times and obtained confidence intervals from the distribution of estimated metrics.
Computation of Correlation Values
We used Pearson’s correlation coefficients to examine how different measures are related to each other in each task. We then estimated the confidence intervals of the correlation coefficients by generating a distribution of 10,000 bootstrapped Pearson’s correlations for each task. To compute each of these correlations, we randomly sampled, with replacement, the pair of parameters to be correlated from the bootstrapped estimates in every subject. We repeated this process 10,000 times and computed the confidence intervals from this distribution.
To obtain the correlation values for data pooled from both of the tasks (Figs. 3 and 4), we first obtained Pearson’s correlation coefficient for data set from each task (also reported in the figures). We then applied Fisher transformation on the correlation values and calculated their weighted average to obtain the pooled Fisher-transformed correlation coefficient. This quantity was used to obtain the pooled Pearson’s correlation coefficient (using inverse Fisher transformation). To obtain confidence intervals for the pooled correlation coefficient, we generated a distribution of 10,000 bootstrapped pooled correlation coefficients by combining 10,000 randomly sampled (with replacement) bootstrapped correlation coefficients in the Perceptual task data set with 10,000 randomly sampled (with replacement) bootstrapped correlation coefficients in the Numerical data set. We computed the confidence intervals of the pooled correlation coefficient from this distribution.
Figure 3.

Choice-dependent alteration of temporal weighting profiles. A: mean model weights for both stimulus intervals in Choice and No-Choice conditions in Perceptual task (left, n = 10 participants) and Numerical task (right, n = 20 participants). Error bars, SE; F-statistic, interaction between interval and condition (repeated measures 2-way ANOVA). B: direction of temporal weighting quantified as difference in model weights between interval 2 and interval 1, separately for each task; *P < 0.05, **P < 0.01, permutation tests across participants (100,000 permutations). C: sum of weights across both intervals in Choice and No-Choice conditions, across participants from both tasks. D: difference between weights in Choice condition and No-Choice condition, in both intervals across participants from both tasks. Data points, individual participants; error bars on each data point, 66% bootstrap confidence intervals; solid lines, best fitting lines; r, Pearson’s correlation coefficients along with 95% bootstrap confidence intervals. CI, confidence interval; w1c, weight for the noisy evidence in interval 1 in Choice trial; w1nc, weight for the noisy evidence in interval 1 in No-Choice trial; w2c, weight for the noisy evidence in interval 2 in Choice trial; w2nc, weight for the noisy evidence in interval 2 in No-Choice trial.
To compare the difference between two correlation coefficients (Fig. 5, C and D), we applied Fisher-transformation on the correlation coefficients and computed the absolute difference between the Fisher-transformed correlation coefficients. This quantity was used to obtain the corresponding P value.
Figure 5.
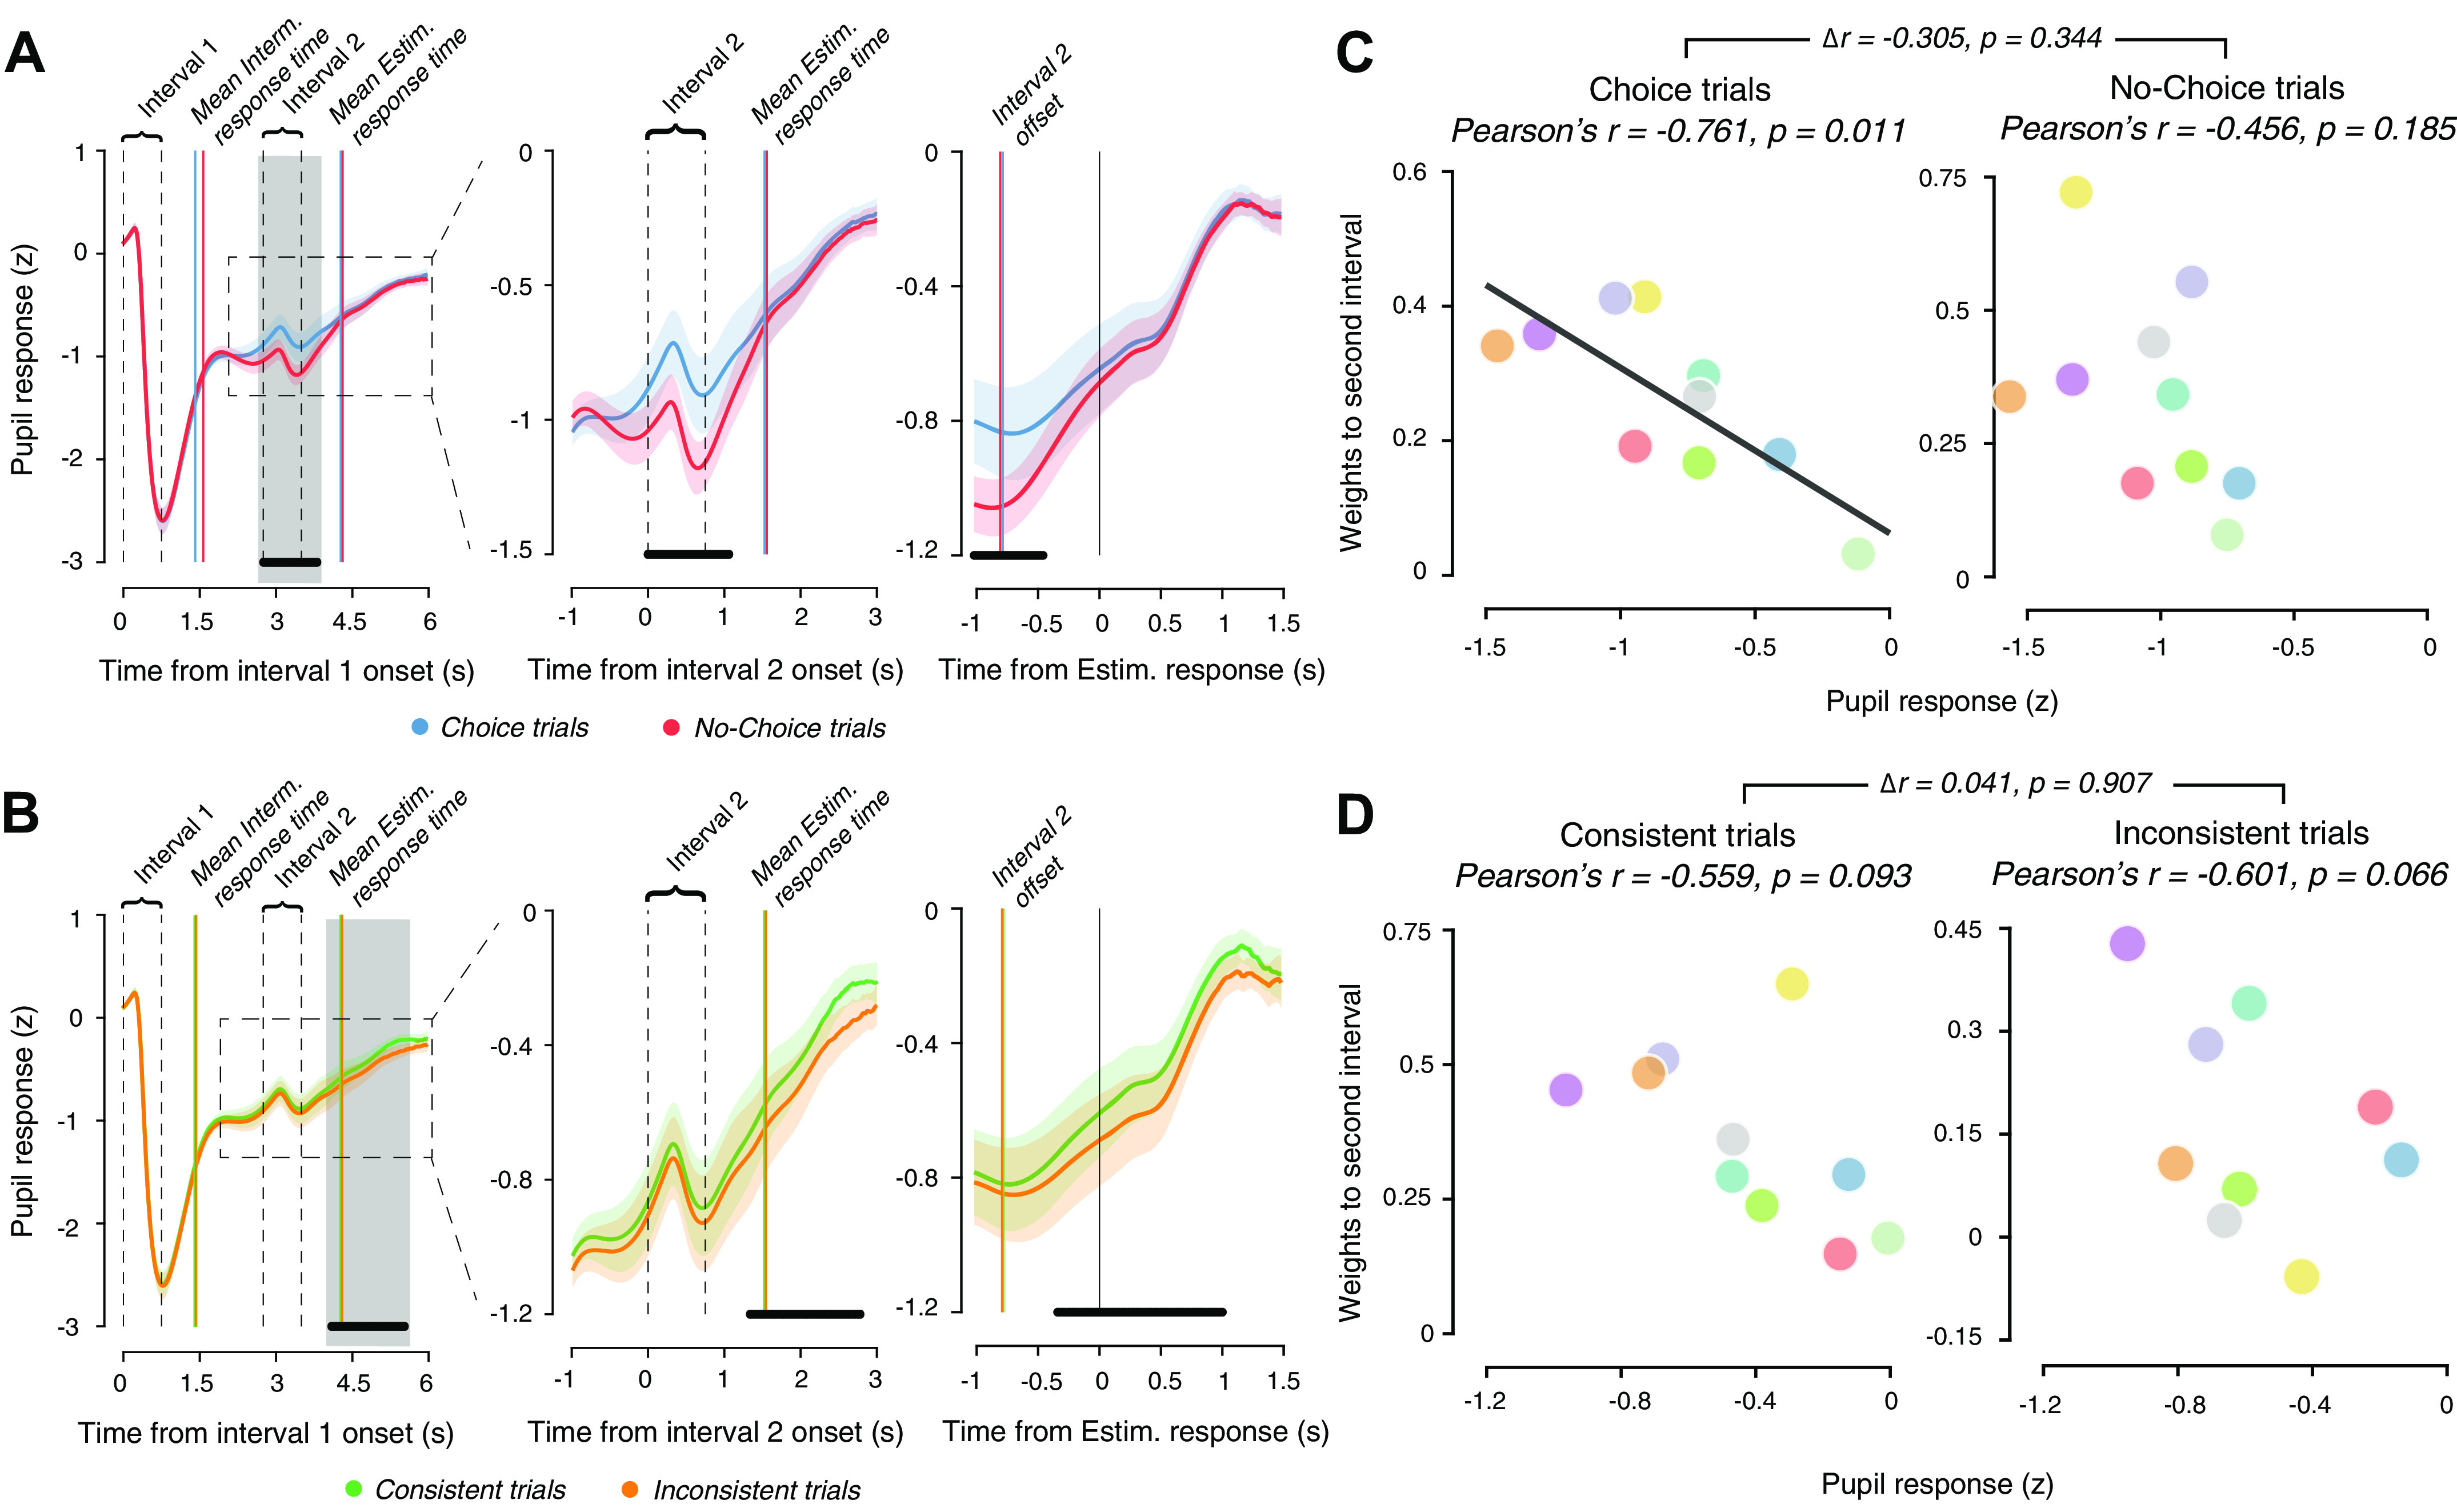
Evoked pupil responses reflect cognitive factors that drive evidence reweighting. A: time courses of average pupil diameter aligned to onset of interval 1 for Choice and No-Choice conditions in the Perceptual task. Left: average time course across whole trial. Middle: close-up of time course during second stimulus interval (following intermediate response). Right: time-course aligned to estimation response (following second stimulus interval). Solid vertical lines after interval 1, mean intermittent response times across participants; solid vertical lines after interval 2, mean estimation response times across participants; dashed gray vertical lines, different events during the trial. All panels: solid lines, mean across participants; shaded region, SE; black horizontal bars, P < 0.05, cluster-based permutation test Choice vs. No-Choice. B: same as A, but for Consistent and Inconsistent trials. C: relationship between pupil response (computed as the mean pupil response in the gray-shaded time window in A) and model weights to second interval, in Choice trials (left) and in No-Choice trials (right). Solid line, best fitting line. D: as C, but for pupil responses and model weights in Consistent or Inconsistent trials and for the gray interval from B.
Statistical Tests
Nonparametric permutation tests (56) were used to test for group-level significance of individual measures for each task, unless otherwise specified. This was done by randomly switching the condition labels of individual observations between the two paired sets of values in each permutation. After repeating this procedure 100,000 times, we computed the difference between the two group means on each permutation and obtained the P value as the fraction of permutations that exceeded the observed difference between the means. All P values reported were computed using two-sided tests, unless otherwise specified.
For the Perceptual task, the number of unique permutations was 210 = 1,024, substantially less than the above number of permutations. All qualitative results reported here were unchanged when using exactly these 1,024 unique permutations of condition labels to compute the permutation distribution as described above.
We used repeated measures two-way analysis of variance (ANOVA) with interval and condition (Choice, No-Choice) as factors to test for group-level significance of the interaction between condition and interval for both the tasks (Fig. 3A). We used standard parametric methods to assess statistical significance of correlation coefficients.
Data and Analysis Code
Behavioral data for the Perceptual Task are available at https://doi.org/10.6084/m9.figshare.7048430 (42) and for the Numerical Task are available at https://datadryad.org/resource/doi:10.5061/dryad.40f6v (38). Raw pupil data from the Perceptual task are made available at https://doi.org/10.6084/m9.figshare.14039294. Analysis code reproducing all the analyses in the paper is made available at https://github.com/BharathTalluri/choice-commitment-bias.
RESULTS
Participants reported a continuous estimate of the mean of fluctuating sensory (perceptual task, Fig. 1A, Supplemental Video S1) or symbolic (numerical task, Fig. 1B) evidence across two successive intervals. This estimate needed to be based on integrating some internal representation of the fluctuating evidence—motion direction or numerical value in the perceptual or numerical tasks, respectively—across the two stimulus intervals.
On a subset of trials (so-called Choice trials), participants were also asked to report an intermediate choice after the first stimulus: a fine direction discrimination judgment relative to a visually presented reference line (Perceptual Task) or comparison of the numerical mean with 50 (Numerical Task). On the remaining set of trials (No-Choice trials), participants were asked to press a button for continuing the trial, without judging the first evidence stream. The cue informing participants whether to report the discrimination judgment or to press a choice-independent button press came after the first stimulus interval. This design enabled us to quantify the degree to which evidence in each interval contributed to the final estimation and whether this depended on the overt report of a categorical choice (see materials and methods).
The mean accuracy of the intermediate choice was 81% ± 10.8% (mean ± SD) for the perceptual task and 67% ± 6.7% for the numerical task. Estimation responses in both tasks increased with mean directional evidence across the two intervals (Fig. 1, C and D) and did not differ between Choice and No-Choice trials, with negligible and statistically nonsignificant differences in the regression slopes for estimations as a function of mean evidence (perceptual task: 0.0256, P = 0.8449; numerical task: 0.0125, P = 0.9083).
Down-Weighting of Evidence following Intermittent Choice
We previously found lower sensitivity to subsequent evidence in the Choice condition compared with the No-choice condition in the Numerical Task (38). Here, we replicated this pattern of results, now also for the Perceptual Task, using a somewhat different statistical modeling approach as well as a model-free approach based on ROC analysis (see materials and methods). Both approaches quantified the sensitivity of the final estimation judgments for evidence in each interval. Across participants, model weights for the second evidence stream were significantly smaller in Choice trials compared with No-Choice trials (Fig. 2, A and C). Likewise, a model-free measure of sensitivity to subsequent evidence (area under the ROC curve) was smaller on Choice trials compared with No-choice trials (Fig. 2, B and D). This shows that the reduction in sensitivity following a categorical judgment generalizes from the domain of numerical to perceptual decision-making.
Figure 2.

Sensitivity to second stimuli in Choice and No-Choice trials. A: model weights for sensitivity to second interval in Choice and No-Choice conditions in Perceptual task. Black cross, mean and SE; data points, individual participants, with identical color scheme from A and B; error bars on each data point, 66% bootstrap confidence intervals; dashed line, identity of Choice and No-Choice; points above diagonal indicate larger weights to No-Choice. B: same as C, but for receiver operating characteristic (ROC) indices quantifying the sensitivity to second interval in a model-free way in Perceptual task. C and D: same as A and B, but for Numerical task. Perceptual task, n = 10 participants; Numerical task, n = 20 participants; P values, permutation tests across participants (100,000 permutations).
Flip of Temporal Weighting of Sensory Evidence between Choice and No-Choice Conditions
We next assessed if and how the intermittent choice affected the relative weighting of early versus late evidence in the decision process underlying the final estimation judgments. For both tasks, the weights in Choice trials were higher than in No-Choice trials for the first interval, and lower than in No-Choice trials for the second interval (Fig. 3A). Correspondingly, we found a significant interaction between trial type (Choice vs. No-Choice) and interval for both tasks (Fig. 3A, see Supplemental Fig. S2 for the corresponding interaction in ROC indices). This effect could also explain the similarity in overall estimation accuracy between Choice and No-Choice conditions (Fig. 1, C and D).
The interaction yielded a marked change in the temporal evidence weighting profiles across both intervals: a flip from recency in the No-Choice condition to primacy in the Choice condition (Fig. 3B). This flip was evident in the individual data: while the sums of weights from both intervals were highly similar for Choice and No-Choice trials in each subject (Fig. 3C), the difference in Choice and No-Choice weights was negatively correlated between intervals (Fig. 3D). No such constraint was imposed in the statistical models used to estimate the weights (see materials and methods). These results indicate the distribution of a limited cognitive resource across both intervals: The intermittent choice after the initial evidence boosted sensitivity to that early evidence, at the cost of reducing sensitivity to subsequent evidence.
Non-selective Sensitivity Reduction Is Coupled to Selective Confirmation Bias
Our previous analyses of the Choice conditions in the same data sets have shown that sensitivity is selectively enhanced for information consistent with the intermittent choice and reduced for choice-inconsistent evidence, yielding a bias to confirm the initial choice (42). We wondered whether the individual degree of this selective gain modulation (confirmation bias) was related to the nonselective gain modulation (overall reduction in sensitivity) applied to new evidence. We quantified the overall gain modulation as the difference in weights of interval 2 between the Choice trials and the No-Choice trials, and the selective gain modulation as the difference in weights of interval 2 between trials with choice-consistent and choice-inconsistent evidence (Fig. 4). These two gain modulations could be independent, suggesting different mechanistic bases for the modulations, or tightly correlated across subjects, suggesting a common underlying mechanism (Fig. 4A). We found the latter to be the case in the data: participants with a stronger global gain reduction also showed a stronger selective gain modulation (Fig. 4B). This was neither trivial (both are conceptually distinct effects) nor was it an artefact of our fitting procedure. We ruled out fitting artefacts by recovering the selective gain weights from data produced by simulating the Global gain model. In stark contrast to the empirical data (Fig. 4B), the recovered (from Global gain model simulations) selective gain effect was uncorrelated with the empirical nonselective gain effect (Fig. 4C).
Pupil Responses during Decisions Reflect Cognitive Factors Shaping Evidence Reweighting
Taken together, the behavioral effects are in line with a change in the state of the decision-making machinery brought about by the initial choice. Such state changes may emerge from the recurrent dynamics of cortical decision circuits alone (57, 58). Another factor that may instigate a state change is the transient neuromodulatory input from central arousal (e.g., locus coeruleus noradrenaline) systems that occurs during decisions (48, 59–61). Such a neuromodulatory transient may be useful when the choice is prompted before decision circuits have reached a stable decision state through evidence accumulation (1)—a condition likely to hold for the intermittent choice in our task.
These considerations led us to analyze participants’ pupil size during the perceptual task (no pupil data were recorded in the numerical task). Nonluminance-mediated dilations of the pupil are a marker of the responses of brainstem arousal systems (48, 59, 62–64). As expected, the random dot stimulus at the start of trial elicited a pupil constriction, which was invariant between Choice and No-Choice trials (Fig. 5A, left, “interval 1”), reflecting the pupil response to retinal illumination (65). The initial pupil constriction was followed by a smaller increase in pupil diameter during the second interval following the intermittent response, and a larger response following the estimation report at the end of trial (Fig. 5, A and B). These later, nonluminance-mediated pupil responses may be due to cognitive factors and/or the motor responses associated with the behavioral reports of both decisions (47, 48, 66).
Critically, the pupil response after the intermittent response was bigger for Choice than No-Choice trials (Fig. 5A, middle), an effect that can neither be explained by the motor responses which occurred in both conditions, nor by the longer response times in the Choice condition [and the associated longer accumulation of central inputs in the peripheral pupil apparatus (47, 48)]: response times were, in fact, shorter in Choice than No-choice trials (see blue and red vertical lines respectively in Fig. 5A; permutation test, P = 0.0112). Thus, the stronger pupil response during Choice than No-Choice trials likely reflected the intermittent decision (47–49).
Pupil responses after interval 2 exhibited another cognitive effect, being larger for Consistent trials than Inconsistent trials emerging ∼500 ms before the estimation reports (Fig. 5B, right). Due to the delay of the pupil response relative to the central arousal response (47–49), the differential arousal response likely emerged during the second interval of evidence processing, here dependent on the consistency of the evidence with the preceding choice. Again, this difference could not be explained by response times for the estimation reports, which were about equally long in both conditions (group mean response times: 0.78 s and 0.79 s for Consistent and Inconsistent trials respectively; condition difference: P = 0.4532, permutation test). In sum, pupil responses in different phases of the trial reflected the cognitive factors that were associated with the dynamic changes in evidence weighting: the need to report an initial judgment of the first evidence stream (Fig. 5A) and the consistence of the second evidence stream with the initial judgment (Fig. 5B).
Association between Evoked Pupil Responses and Evidence Sensitivity
We finally performed exploratory analyses relating the pupil responses in the respective two trial intervals to the evidence weighting as inferred from our behavioral analysis. The complex and prolonged temporal profile of evoked pupil responses in our task complicates the within-subject analyses of this association at the single-trial level, which have proved useful in the context of simpler tasks with more transient responses (48, 49, 67). Specifically, the ramping of the pupil during the final estimation judgment was protracted well into the baseline interval of subsequent trials (Fig. 5, A and B), and thus affected single-trial baseline measurements in a fashion that complicates the quantification of single-trial response amplitudes. In rough first analyses, we found no systematic within-subject associations between evidence sensitivity for the second interval and the amplitude of pupil responses (data not shown) but did not pursue this further due to these complexities.
Across-subjects correlations of the mean pupil responses and model weights for the different conditions were not affected by this problem but were limited by the comparably low number of individuals measured in the perceptual task. We found a strong, negative across-subjects correlation between mean pupil response following the intermittent report and the evidence from the second interval in the Choice condition (Fig. 5C, left), but not the No-Choice condition (Fig. 5C, right). The difference in pupil response amplitude between Choice and No-Choice conditions did not predict the corresponding difference between second-interval weights in these two conditions (Pearson’s r = −0.205, P = 0.5697). We did not find an across-subjects correlation between mean pupil response amplitudes during the second interval on Consistent or Inconsistent trials and the corresponding weights for the second evidence (Fig. 5D).
DISCUSSION
Recent work has begun to expose the impact of choices on the accumulation of subsequent decision evidence, revealing an overall reduction in sensitivity to subsequent evidence (38) combined with a selective suppression of the gain of evidence inconsistent with the initial choice (confirmation bias; 42). Here, we extended this nascent line of work, by showing that an intermittent discrimination judgment about an evidence stream introduces a change in the temporal weighting of the evidence on a final estimation judgment from recency to primacy, compared with an intermittent behavioral response independent of the evidence. We also showed that the above three effects are tightly related, consistent with a common underlying mechanism. Finally, we have found that these behavioral phenomena are accompanied by pupil-linked arousal responses that are modulated by the same factors that produce the evidence reweighting: intermittent choice and consistency of later evidence with that choice.
The here-discovered, strong relationship between the individual strength of the choice-induced, global sensitivity reduction and choice-induced, selective confirmation bias is not a given. Both effects were operationalized in terms of two orthogonal comparisons: the choice-induced sensitivity reduction by comparing sensitivity between trials with an intermittent choice and trials without such a choice; the confirmation bias by comparing trials with subsequent evidence that was consistent or inconsistent with the choice, within the trials that contain an intermittent choice. Thus, the presence of a global sensitivity reduction effect does not imply presence of the confirmation bias, and vice versa. Even so, their correlations were tight, in line with a common underlying mechanism.
The present data add to a growing body of literature indicating that the dynamics of evidence weighting for decision-making is highly context dependent. Both the timescale and the temporal profile of this weighting applied to the same physical evidence are affected by a range of factors including the type of judgment (68, 69), the type of information available in the stimulus (15), reliability of the sensory information (70), and the temporal statistics of the environment (3, 5, 71). We here extend this body of evidence, by showing that the temporal weighting profile, within a given individual and a given task, can be flipped by asking the participant for an intermittent choice in the middle of the evidence stream. Previous studies characterizing the dynamics of evidence accumulation during decision-making reported diverse temporal weighting profiles ranging from recency to uniform to primacy. But the differences between these studies in the stimuli, task protocols, and participants have complicated direct comparisons and mechanistic conclusions. Along with other recent findings (15), our findings establish that these temporal weighting profiles are neither fixed task properties nor fixed traits of decision-makers and lend themselves to mechanistic interpretation.
One possibility is that the effects of intermittent choices identified here are behavioral signatures of decision-related cortical circuit dynamics (57, 58, 72). Previous studies showed that these dynamics were task dependent and exhibit distinct state trajectories depending on whether the judgment is coarse categorization or fine discrimination (73). In a protracted task involving sequential categorical and estimation judgments such as ours, it is possible that the same decision circuits underlie both judgments. Once these decision circuits have settled in an attractor (choice commitment), this will reduce the network’s sensitivity to all new evidence (1, 57, 58, 74)—an effect that may hold regardless of whether that evidence is consistent or inconsistent with the choice (also see Ref. 38, Supplement). In this scenario, the attractor also boosts the estimations for the evidence preceding the categorical judgment resulting in increased sensitivity to that evidence we see in our data. Due to selective feedback from the accumulator circuit to early sensory regions encoding the evidence, the attractor state in accumulator networks may additionally modulate the processing of subsequent evidence in a selective fashion (15, 58) that depends on the consistency of that evidence with the initial choice, yielding a confirmation bias effect. These ideas should be explored with extended, hierarchical circuit models adapted to our task.
Another possibility, mutually nonexclusive with the above, is that transient neuromodulatory inputs to the decision circuits from brainstem arousal systems play a role in the overall sensitivity reduction to postdecisional evidence. The intermittent choices were always prompted after the first interval by the experimenter and under uncertainty. This is a setting in which the cortical decision circuits might not yet have reached a stable decision state on individual trials. In such a setting, the release of neuromodulators in the cortex induced by the choice may push decision circuits into an attractor state (1). Note that this effect is different from a gain modulation of sensory responses, which should increase evidence sensitivity, provided that the neuromodulatory input is still present when the new evidence arrives. Our pupil results, although exploratory and limited in nature, are roughly consistent with this idea: we found bigger pupil responses during the intermittent choice than the evidence-independent button press, and the individual amplitude of that choice-related response was negatively related to the individual sensitivity to subsequent evidence. Because of the task-related limitations of the current pupil analyses (outlined in results), the pupil results should be regarded as a starting point for future investigations into the role of phasic arousal in the weighting phenomena studied here.
Although our task design allows for assessing so far understudied aspects of decision-making, it also has limitations that open up alternative possibilities for explaining our findings. First, in all the No-Choice trials, the intermittent button press was followed by additional evidence in the second interval, whereas a proportion of Choice trials (50% in Perceptual task and 66% in Numerical task) ended with feedback about the categorical judgment without additional evidence. Consequently, participants may have expected a second stimulus on the No-Choice, but not the Choice trials, which may have affected (improved) the sensitivity for the upcoming stimulus (75–78). Second, and relatedly, participants may have only expected feedback on Choice trials, but not on No-Choice trials, again with differential effects on subsequent evidence processing (79, 80). Third, our task entailed a key role of certain forms of memory, as it required participants to store some format of representation of the evidence from the first interval in short-term memory across the intermittent response interval, in order to combine it with the second interval evidence. Indeed, evidence accumulation can be based not only on current sensory input but also on information from the visual processing pipeline (81, 82) or even stored in iconic memory for up to 500 ms (83), and working memory plays a critical role in related tasks (40, 84). In our task, the necessity to form and report a categorization judgment on Choice trials may have interacted with this memory in ways that contribute to the pattern of results. However, it is worth noting that neither of these alternate mechanisms can account for the confirmation bias observed in the task (42) without requiring additional assumptions. Future investigations should disambiguate between these different explanations by removing the feedback trials from the task design and verifying if participants exhibit the observed changes in sensitivity to the second stimulus interval.
To conclude, we have shown that intermittent choices on protracted streams of decision evidence have versatile and coupled effects on evidence accumulation, which lead to a reweighting of evidence sensitivity over time as well as to confirmation bias. These insights open the door for connecting laboratory studies of decision-making to realistic settings requiring protracted evaluation of time-varying evidence in multiple successive decisions.
GRANTS
This research was supported by the German Academic Exchange Service (DAAD) (to A. E. Urai), a European Research Council Starting Grant under the European Union’s Horizon 2020 research and innovation program (Grant 802905) (to K. Tsetsos), and the following grants from the German Research Foundation (DFG): DO 1240/2-1, DO 1240/2-2, DO 1240/3-1, and DO 1240/4-1 (all to T. H. Donner). We acknowledge computing resources provided by Dutch Research Council (NWO) Physical Sciences.
DISCLOSURES
No conflicts of interest, financial or otherwise, are declared by the authors.
AUTHOR CONTRIBUTIONS
M.U. and T.H.D. conceived and designed research; A.E.U. performed experiments; B.C.T. and A.E.U. analyzed data; B.C.T., A.E.U., Z.Z.B., N.B., and K.T. interpreted results of experiments; B.C.T. prepared figures; B.C.T. and T.H.D. drafted manuscript; B.C.T., A.E.U., Z.Z.B., N.B., K.T., M.U., and T.H.D. edited and revised manuscript; B.C.T., A.E.U., Z.Z.B., N.B., K.T., M.U., and T.H.D. approved final version of manuscript; T.H.D. acquired funding for the research.
ENDNOTE
At the request of the authors, readers are herein alerted to the fact that additional materials related to this manuscript may be found at https://doi.org/10.6084/m9.figshare.7048430, https://datadryad.org/resource/doi:10.5061/dryad.40f6v, https://doi.org/10.6084/m9.figshare.14039294, and https://github.com/BharathTalluri/choice-commitment-bias. These materials are not a part of this manuscript and have not undergone peer review by the American Physiological Society (APS). APS and the journal editors take no responsibility for these materials, for the website address, or for any links to or from it.
ACKNOWLEDGMENTS
We thank Ana Vojvodic for help with data collection and Jose Mari Esnaola-Acebes and Klaus Wimmer for discussion.
Present address of Anne E. Urai: Cognitive Psychology Unit, Institute of Psychology and Leiden Institute for Brain and Cognition, Leiden University, The Netherlands.
REFERENCES
- 1.Bogacz R, Brown E, Moehlis J, Holmes P, Cohen JD. The physics of optimal decision making: a formal analysis of models of performance in two-alternative forced-choice tasks. Psychol Rev 113: 700–765, 2006. doi: 10.1037/0033-295X.113.4.700. [DOI] [PubMed] [Google Scholar]
- 2.Gold JI, Shadlen MN. The neural basis of decision making. Annu Rev Neurosci 30: 535–574, 2007. doi: 10.1146/annurev.neuro.29.051605.113038. [DOI] [PubMed] [Google Scholar]
- 3.Glaze CM, Kable JW, Gold JI. Normative evidence accumulation in unpredictable environments. eLife 4: e08825, 2015. doi: 10.7554/eLife.08825. [DOI] [PMC free article] [PubMed] [Google Scholar]
- 4.Murphy PR, Wilming N, Hernandez-Bocanegra DC, Ortega GP, Donner TH. Normative circuit dynamics across human cortex during evidence accumulation in changing environments (Preprint). bioRxiv 924795, 2020. 10.1101/2020.01.29.924795. [DOI] [PubMed]
- 5.Ossmy O, Moran R, Pfeffer T, Tsetsos K, Usher M, Donner TH. The timescale of perceptual evidence integration can be adapted to the environment. Curr Biol 23: 981–986, 2013. doi: 10.1016/j.cub.2013.04.039. [DOI] [PubMed] [Google Scholar]
- 6.Kiani R, Hanks TD, Shadlen MN. Bounded integration in parietal cortex underlies decisions even when viewing duration is dictated by the environment. J Neurosci 28: 3017–3029, 2008. doi: 10.1523/JNEUROSCI.4761-07.2008. [DOI] [PMC free article] [PubMed] [Google Scholar]
- 7.Nienborg H, Cumming BG. Decision-related activity in sensory neurons reflects more than a neuron’s causal effect. Nature 459: 89–92, 2009. doi: 10.1038/nature07821. [DOI] [PMC free article] [PubMed] [Google Scholar]
- 8.Odoemene O, Pisupati S, Nguyen H, Churchland AK. Visual evidence accumulation guides decision-making in unrestrained mice. J Neurosci 38: 10143–10155, 2018. doi: 10.1523/JNEUROSCI.3478-17.2018. [DOI] [PMC free article] [PubMed] [Google Scholar]
- 9.Zylberberg A, Barttfeld P, Sigman M. The construction of confidence in a perceptual decision. Front Integr Neurosci 6: 79, 2012. doi: 10.3389/fnint.2012.00079. [DOI] [PMC free article] [PubMed] [Google Scholar]
- 10.Cheadle S, Wyart V, Tsetsos K, Myers N, de Gardelle V, Herce Castañón S, Summerfield C. Adaptive gain control during human perceptual choice. Neuron 81: 1429–1441, 2014. doi: 10.1016/j.neuron.2014.01.020. [DOI] [PMC free article] [PubMed] [Google Scholar]
- 11.Drugowitsch J, Wyart V, Devauchelle A-D, Koechlin E. Computational precision of mental inference as critical source of human choice suboptimality. Neuron 92: 1398–1411, 2016. doi: 10.1016/j.neuron.2016.11.005. [DOI] [PubMed] [Google Scholar]
- 12.Tsetsos K, Chater N, Usher M. Salience driven value integration explains decision biases and preference reversal. Proc Natl Acad Sci USA 109: 9659–9664, 2012. doi: 10.1073/pnas.1119569109. [DOI] [PMC free article] [PubMed] [Google Scholar]
- 13.Bronfman ZZ, Brezis N, Usher M. Non-monotonic temporal-weighting indicates a dynamically modulated evidence-integration mechanism. PLoS Comput Biol 12: e1004667, 2016. doi: 10.1371/journal.pcbi.1004667. [DOI] [PMC free article] [PubMed] [Google Scholar]
- 14.Keung W, Hagen TA, Wilson RC. A divisive model of evidence accumulation explains uneven weighting of evidence over time. Nat Commun 11: 2160, 2020. doi: 10.1038/s41467-020-15630-0. [DOI] [PMC free article] [PubMed] [Google Scholar]
- 15.Lange RD, Chattoraj A, Beck JM, Yates JL, Haefner RM. A confirmation bias in perceptual decision-making due to hierarchical approximate inference (Preprint). bioRxiv 440321, 2020. 10.1101/440321. [DOI] [PMC free article] [PubMed]
- 16.Okazawa G, Sha L, Purcell BA, Kiani R. Psychophysical reverse correlation reflects both sensory and decision-making processes. Nat Commun 9: 3479, 2018. doi: 10.1038/s41467-018-05797-y. [DOI] [PMC free article] [PubMed] [Google Scholar]
- 17.Tsetsos K, Gao J, McClelland JL, Usher M. Using time-varying evidence to test models of decision dynamics: bounded diffusion vs. the leaky competing accumulator model. Front Neurosci 6: 79, 2012. doi: 10.3389/fnins.2012.00079. [DOI] [PMC free article] [PubMed] [Google Scholar]
- 18.Ding L, Gold JI. Neural correlates of perceptual decision making before, during, and after decision commitment in monkey frontal eye field. Cereb Cortex 22: 1052–1067, 2012. doi: 10.1093/cercor/bhr178. [DOI] [PMC free article] [PubMed] [Google Scholar]
- 19.Tsunada J, Cohen Y, Gold JI. Post-decision processing in primate prefrontal cortex influences subsequent choices on an auditory decision-making task. eLife 8: e46770, 2019. doi: 10.7554/eLife.46770. [DOI] [PMC free article] [PubMed] [Google Scholar]
- 20.Hwang EJ, Dahlen JE, Mukundan M, Komiyama T. History-based action selection bias in posterior parietal cortex. Nat Commun 8: 1242, 2017. doi: 10.1038/s41467-017-01356-z. [DOI] [PMC free article] [PubMed] [Google Scholar]
- 21.Scott BB, Constantinople CM, Akrami A, Hanks TD, Brody CD, Tank DW. Fronto-parietal cortical circuits encode accumulated evidence with a diversity of timescales. Neuron 95: 385–398.e5, 2017. doi: 10.1016/j.neuron.2017.06.013. [DOI] [PMC free article] [PubMed] [Google Scholar]
- 22.Abrahamyan A, Silva LL, Dakin SC, Carandini M, Gardner JL. Adaptable history biases in human perceptual decisions. Proc Natl Acad Sci USA 113: E3548–E3557, 2016. doi: 10.1073/pnas.1518786113. [DOI] [PMC free article] [PubMed] [Google Scholar]
- 23.Akaishi R, Umeda K, Nagase A, Sakai K. Autonomous mechanism of internal choice estimate underlies decision inertia. Neuron 81: 195–206, 2014. doi: 10.1016/j.neuron.2013.10.018. [DOI] [PubMed] [Google Scholar]
- 24.Braun A, Urai AE, Donner TH. Adaptive history biases result from confidence-weighted accumulation of past choices. J Neurosci 38: 2418–2429, 2018. doi: 10.1523/JNEUROSCI.2189-17.2017. [DOI] [PMC free article] [PubMed] [Google Scholar]
- 25.Busse L, Ayaz A, Dhruv NT, Katzner S, Saleem AB, Scholvinck ML, Zaharia AD, Carandini M. The detection of visual contrast in the behaving mouse. J Neurosci 31: 11351–11361, 2011. doi: 10.1523/JNEUROSCI.6689-10.2011. [DOI] [PMC free article] [PubMed] [Google Scholar]
- 26.Fernberger SW. Interdependence of judgments within the series for the method of constant stimuli. J Exp Psychol 3: 126–150, 1920. doi: 10.1037/h0065212. [DOI] [Google Scholar]
- 27.Fischer J, Whitney D. Serial dependence in visual perception. Nat Neurosci 17: 738–743, 2014. doi: 10.1038/nn.3689. [DOI] [PMC free article] [PubMed] [Google Scholar]
- 28.Fritsche M, Mostert P, de Lange FP. Opposite effects of recent history on perception and decision. Curr Biol 27: 590–595, 2017. doi: 10.1016/j.cub.2017.01.006. [DOI] [PubMed] [Google Scholar]
- 29.Fründ I, Wichmann FA, Macke JH. Quantifying the effect of intertrial dependence on perceptual decisions. J Vis 14: 9, 2014. doi: 10.1167/14.7.9. [DOI] [PubMed] [Google Scholar]
- 30.Kim TD, Kabir M, Gold JI. Coupled decision processes update and maintain saccadic priors in a dynamic environment. J Neurosci 37: 3632–3645, 2017. doi: 10.1523/JNEUROSCI.3078-16.2017. [DOI] [PMC free article] [PubMed] [Google Scholar]
- 31.Liberman A, Fischer J, Whitney D. Serial dependence in the perception of faces. Curr Biol 24: 2569–2574, 2014. doi: 10.1016/j.cub.2014.09.025. [DOI] [PMC free article] [PubMed] [Google Scholar]
- 32.Pape A-A, Siegel M. Motor cortex activity predicts response alternation during sensorimotor decisions. Nat Commun 7: 13098, 2016. doi: 10.1038/ncomms13098. [DOI] [PMC free article] [PubMed] [Google Scholar]
- 33.Raviv O, Ahissar M, Loewenstein Y. How recent history affects perception: the normative approach and its heuristic approximation. PLoS Comput Biol 8: e1002731, 2012. doi: 10.1371/journal.pcbi.1002731. [DOI] [PMC free article] [PubMed] [Google Scholar]
- 34.St John-Saaltink E, Kok P, Lau HC, de Lange FP. Serial dependence in perceptual decisions is reflected in activity patterns in primary visual cortex. J Neurosci 36: 6186–6192, 2016. doi: 10.1523/JNEUROSCI.4390-15.2016. [DOI] [PMC free article] [PubMed] [Google Scholar]
- 35.Urai AE, Braun A, Donner TH. Pupil-linked arousal is driven by decision uncertainty and alters serial choice bias. Nat Commun 8: 14637, 2017. doi: 10.1038/ncomms14637. [DOI] [PMC free article] [PubMed] [Google Scholar]
- 36.Urai AE, de Gee JW, Tsetsos K, Donner TH. Choice history biases subsequent evidence accumulation. eLife 8: e46331, 2019. doi: 10.7554/eLife.46331. [DOI] [PMC free article] [PubMed] [Google Scholar]
- 37.Yu AJ, Cohen JD. Sequential effects: superstition or rational behavior? Adv Neural Inf Process Syst 21: 1873–1880, 2008. [PMC free article] [PubMed] [Google Scholar]
- 38.Bronfman ZZ, Brezis N, Moran R, Tsetsos K, Donner TH, Usher M. Decisions reduce sensitivity to subsequent information. Proc Biol Sci 282: 20150228, 2015. doi: 10.1098/rspb.2015.0228. [DOI] [PMC free article] [PubMed] [Google Scholar]
- 39.Jazayeri M, Movshon JA. A new perceptual illusion reveals mechanisms of sensory decoding. Nature 446: 912–915, 2007. doi: 10.1038/nature05739. [DOI] [PMC free article] [PubMed] [Google Scholar]
- 40.Luu L, Stocker AA. Post-decision biases reveal a self-consistency principle in perceptual inference. eLife 7: e33334, 2018. doi: 10.7554/eLife.33334. [DOI] [PMC free article] [PubMed] [Google Scholar]
- 41.Stocker AA, Simoncelli EP. A Bayesian model of conditioned perception. Adv Neural Inf Process Syst 2007: 1409–1416, 2007. [PMC free article] [PubMed] [Google Scholar]
- 42.Talluri BC, Urai AE, Tsetsos K, Usher M, Donner TH. Confirmation bias through selective overweighting of choice-consistent evidence. Curr Biol 28: 3128–3135.e8, 2018. doi: 10.1016/j.cub.2018.07.052. [DOI] [PubMed] [Google Scholar]
- 43.Zamboni E, Ledgeway T, McGraw PV, Schluppeck D. Do perceptual biases emerge early or late in visual processing? Decision-biases in motion perception. Proc Biol Sci 283: 20160263, 2016. doi: 10.1098/rspb.2016.0263. [DOI] [PMC free article] [PubMed] [Google Scholar]
- 44.Fleming SM, van der Putten EJ, Daw ND. Neural mediators of changes of mind about perceptual decisions. Nat Neurosci 21: 617–624, 2018. doi: 10.1038/s41593-018-0104-6. [DOI] [PMC free article] [PubMed] [Google Scholar]
- 45.Rollwage M, Dolan RJ, Fleming SM. Metacognitive failure as a feature of those holding radical beliefs. Curr Biol 28: 4014–4021.e8, 2018. doi: 10.1016/j.cub.2018.10.053. [DOI] [PMC free article] [PubMed] [Google Scholar]
- 46.Einhäuser W, Stout J, Koch C, Carter O. Pupil dilation reflects perceptual selection and predicts subsequent stability in perceptual rivalry. Proc Natl Acad Sci USA 105: 1704–1709, 2008. doi: 10.1073/pnas.0707727105. [DOI] [PMC free article] [PubMed] [Google Scholar]
- 47.de Gee JW, Knapen T, Donner TH. Decision-related pupil dilation reflects upcoming choice and individual bias. Proc Natl Acad Sci USA 111: E618–E625, 2014. doi: 10.1073/pnas.1317557111. [DOI] [PMC free article] [PubMed] [Google Scholar]
- 48.de Gee JW, Colizoli O, Kloosterman NA, Knapen T, Nieuwenhuis S, Donner TH. Dynamic modulation of decision biases by brainstem arousal systems. eLife 6: e23232, 2017. doi: 10.7554/eLife.23232. [DOI] [PMC free article] [PubMed] [Google Scholar]
- 49.de Gee JW, Tsetsos K, Schwabe L, Urai AE, McCormick D, McGinley MJ, Donner TH. Pupil-linked phasic arousal predicts a reduction of choice bias across species and decision domains. eLife 9: e54014, 2020. doi: 10.7554/eLife.54014. [DOI] [PMC free article] [PubMed] [Google Scholar]
- 50.Oostenveld R, Fries P, Maris E, Schoffelen J-M. FieldTrip: open source software for advanced analysis of MEG, EEG, and invasive electrophysiological data. Comput Intell Neurosci 2011: 156869, 2011. doi: 10.1155/2011/156869. [DOI] [PMC free article] [PubMed] [Google Scholar]
- 51.Knapen T, de Gee JW, Brascamp J, Nuiten S, Hoppenbrouwers S, Theeuwes J. Cognitive and ocular factors jointly determine pupil responses under equiluminance. PLoS One 11: e0155574, 2016. doi: 10.1371/journal.pone.0155574. [DOI] [PMC free article] [PubMed] [Google Scholar]
- 52.Wichmann FA, Hill NJ. The psychometric function: I. Fitting, sampling, and goodness of fit. Percept Psychophys 63: 1293–1313, 2001. doi: 10.3758/bf03194544. [DOI] [PubMed] [Google Scholar]
- 53.Bogacz R, Cohen JD. Parameterization of connectionist models. Behav Res Methods Instrum Comput 36: 732–741, 2004. doi: 10.3758/bf03206554. [DOI] [PubMed] [Google Scholar]
- 54.Rowan TH. Functional Stability Analysis of Numerical Algorithms (Dissertation). Austin, TX: University of Texas, 1990. [Google Scholar]
- 55.Green DM, Swets JA. Signal Detection Theory and Psychophysics. New York: John Wiley and Sons, 1966. [Google Scholar]
- 56.Efron B, Tibshirani R. Bootstrap methods for standard errors, confidence intervals, and other measures of statistical accuracy. Statist Sci 1: 54–75, 1986. doi: 10.1214/ss/1177013815. [DOI] [Google Scholar]
- 57.Wang X-J. Decision making in recurrent neuronal circuits. Neuron 60: 215–234, 2008. doi: 10.1016/j.neuron.2008.09.034. [DOI] [PMC free article] [PubMed] [Google Scholar]
- 58.Wimmer K, Compte A, Roxin A, Peixoto D, Renart A, de la Rocha J. Sensory integration dynamics in a hierarchical network explains choice probabilities in cortical area MT. Nat Commun 6: 6177, 2015. doi: 10.1038/ncomms7177. [DOI] [PMC free article] [PubMed] [Google Scholar]
- 59.Aston-Jones G, Cohen JD. An integrative theory of locus coeruleus-norepinephrine function: adaptive gain and optimal performance. Annu Rev Neurosci 28: 403–450, 2005. doi: 10.1146/annurev.neuro.28.061604.135709. [DOI] [PubMed] [Google Scholar]
- 60.Niyogi RK, Wong-Lin K. Dynamic excitatory and inhibitory gain modulation can produce flexible, robust and optimal decision-making. PLoS Comput Biol 9: e1003099, 2013. doi: 10.1371/journal.pcbi.1003099. [DOI] [PMC free article] [PubMed] [Google Scholar]
- 61.Shea-Brown E, Gilzenrat MS, Cohen JD. Optimization of decision making in multilayer networks: the role of locus coeruleus. Neural Comput 20: 2863–2894, 2008. doi: 10.1162/neco.2008.03-07-487. [DOI] [PubMed] [Google Scholar]
- 62.Breton-Provencher V, Sur M. Active control of arousal by a locus coeruleus GABAergic circuit. Nat Neurosci 22: 218–228, 2019. doi: 10.1038/s41593-018-0305-z. [DOI] [PMC free article] [PubMed] [Google Scholar]
- 63.Joshi S, Li Y, Kalwani RM, Gold JI. Relationships between pupil diameter and neuronal activity in the locus coeruleus, colliculi, and cingulate cortex. Neuron 89: 221–234, 2016. doi: 10.1016/j.neuron.2015.11.028. [DOI] [PMC free article] [PubMed] [Google Scholar]
- 64.Reimer J, McGinley MJ, Liu Y, Rodenkirch C, Wang Q, McCormick DA, Tolias AS. Pupil fluctuations track rapid changes in adrenergic and cholinergic activity in cortex. Nat Commun 7: 13289, 2016. doi: 10.1038/ncomms13289. [DOI] [PMC free article] [PubMed] [Google Scholar]
- 65.Loewenfeld IE, Lowenstein O. The Pupil: Anatomy, Physiology, and Clinical Applications (2nd ed.).Boston, MA: Butterworth-Heinemann, 1999. [Google Scholar]
- 66.Hupé J-M, Lamirel C, Lorenceau J. Pupil dynamics during bistable motion perception. J Vis 9: 10, 2009. doi: 10.1167/9.7.10. [DOI] [PubMed] [Google Scholar]
- 67.Krishnamurthy K, Nassar MR, Sarode S, Gold JI. Arousal-related adjustments of perceptual biases optimize perception in dynamic environments. Nat Hum Behav 1: 0107, 2017. doi: 10.1038/s41562-017-0107. [DOI] [PMC free article] [PubMed] [Google Scholar]
- 68.Ganupuru P, Goldring AB, Harun R, Hanks TD. Flexibility of timescales of evidence evaluation for decision making. Curr Biol 29: 2091–2097.e4, 2019. doi: 10.1016/j.cub.2019.05.037. [DOI] [PMC free article] [PubMed] [Google Scholar]
- 69.Harun R, Jun E, Park HH, Ganupuru P, Goldring AB, Hanks TD. Timescales of evidence evaluation for decision making and associated confidence judgments are adapted to task demands. Front Neurosci 14: 826, 2020. doi: 10.3389/fnins.2020.00826. [DOI] [PMC free article] [PubMed] [Google Scholar]
- 70.Deneve S. Making decisions with unknown sensory reliability. Front Neurosci 6: 75, 2012. doi: 10.3389/fnins.2012.00075. [DOI] [PMC free article] [PubMed] [Google Scholar]
- 71.Levi AJ, Yates JL, Huk AC, Katz LN. Strategic and dynamic temporal weighting for perceptual decisions in humans and macaques. eNeuro 5: ENEURO.0169-18.2018, 2018. doi: 10.1523/eneuro.0169-18.2018. [DOI] [PMC free article] [PubMed] [Google Scholar]
- 72.Rolls ET, Deco G. The Noisy Brain. Oxford: Oxford University Press, 2010. [Google Scholar]
- 73.Tajima S, Koida K, Tajima CI, Suzuki H, Aihara K, Komatsu H. Task-dependent recurrent dynamics in visual cortex. eLife 6: e26868, 2017. doi: 10.7554/eLife.26868. [DOI] [PMC free article] [PubMed] [Google Scholar]
- 74.Wong K-F, Wang X-J. A recurrent network mechanism of time integration in perceptual decisions. J Neurosci 26: 1314–1328, 2006. doi: 10.1523/JNEUROSCI.3733-05.2006. [DOI] [PMC free article] [PubMed] [Google Scholar]
- 75.Chalk M, Seitz AR, Seriès P. Rapidly learned stimulus expectations alter perception of motion. J Vis 10: 2, 2010. doi: 10.1167/10.8.2. [DOI] [PubMed] [Google Scholar]
- 76.de Lange FP, Rahnev DA, Donner TH, Lau HC. Prestimulus oscillatory activity over motor cortex reflects perceptual expectations. J Neurosci 33: 1400–1410, 2013. doi: 10.1523/JNEUROSCI.1094-12.2013. [DOI] [PMC free article] [PubMed] [Google Scholar]
- 77.Stein T, Peelen MV. Content-specific expectations enhance stimulus detectability by increasing perceptual sensitivity. J Exp Psychol Gen 144: 1089–1104, 2015. doi: 10.1037/xge0000109. [DOI] [PubMed] [Google Scholar]
- 78.Yu AJ, Dayan P. Uncertainty, neuromodulation, and attention. Neuron 46: 681–692, 2005. doi: 10.1016/j.neuron.2005.04.026. [DOI] [PubMed] [Google Scholar]
- 79.Johnson B, Verma R, Sun M, Hanks TD. Characterization of decision commitment rule alterations during an auditory change detection task. J Neurophysiol 118: 2526–2536, 2017. doi: 10.1152/jn.00071.2017. [DOI] [PMC free article] [PubMed] [Google Scholar]
- 80.Purcell BA, Kiani R. Neural mechanisms of post-error adjustments of decision policy in parietal cortex. Neuron 89: 658–671, 2016. doi: 10.1016/j.neuron.2015.12.027. [DOI] [PMC free article] [PubMed] [Google Scholar]
- 81.Resulaj A, Kiani R, Wolpert DM, Shadlen MN. Changes of mind in decision-making. Nature 461: 263–266, 2009. doi: 10.1038/nature08275. [DOI] [PMC free article] [PubMed] [Google Scholar]
- 82.van den Berg R, Anandalingam K, Zylberberg A, Kiani R, Shadlen MN, Wolpert DM. A common mechanism underlies changes of mind about decisions and confidence. eLife 5: e12192, 2016. doi: 10.7554/eLife.12192. [DOI] [PMC free article] [PubMed] [Google Scholar]
- 83.Vlassova A, Pearson J. Look before you leap: sensory memory improves decision making. Psychol Sci 24: 1635–1643, 2013. doi: 10.1177/0956797612474321. [DOI] [PubMed] [Google Scholar]
- 84.Qiu C, Luu L, Stocker AA. Benefits of commitment in hierarchical inference. Psychol Rev 127: 622–639, 2020. doi: 10.1037/rev0000193. [DOI] [PubMed] [Google Scholar]