

Abstract
Necrotising enterocolitis (NEC) is a potentially serious illness with significant mortality and morbidity in preterm infants. Previous studies have reported association of volume and colour (bile and blood stained) of gastric residuals (GR) with NEC. We aimed to study this association in our cohort of extremely preterm (EP) infants. In a case–control study using retrospective data (January 2006–December 2011), EP (gestation < 28 weeks) infants with confirmed NEC ≥ stage II (cases) were compared with infants without NEC (controls) matched for birth weight (BW) and gestational age (GA). Forty cases of NEC ≥ stage II diagnosed at a median (IQR) age of 16.5 days (10.3–23) were compared with 40 controls matched for gestation (± 3 days) and birth weight (± 680 g). Median maximum GR volume (GRV) from birth to the day of occurrence of NEC was significantly higher in cases vs. controls (5.9 vs.3.7 ml; p < 0.001). Increased maximum GRV was associated with NEC ≥ Stage II in adjusted analysis (aOR 1.36, 95%CI 1.06–1.75, p = 0.017). There was no significant difference in GRV between cases and controls throughout the clinical course, including 72, 48 and 24 h before the onset of NEC. However, green (65.0% vs. 27.5%, p = 0.001) and haemorrhagic GRs (45.0% vs. 27.5%, p = 0.092) were higher 24 h before the diagnosis of NEC.
Conclusion: GRV was not associated with NEC ≥ stage II. However, green and haemorrhagic GRs were significantly higher 24 h before the diagnosis of the illness. Adequately powered prospective studies are needed to confirm the significance of our findings.
|
What is Known: •It is unclear whether large volume, dark-coloured and blood-stained GRs are associated with NEC. •The value of routine monitoring of gastric residuals in preterm infants is currently being questioned. | |
|
What is New: •Volume of gastric residuals was not associated with significant NEC. •Green and haemorrhagic GRs were significantly higher 24 hours before diagnosis of NEC. |
Keywords: Gastric residuals, Necrotising enterocolitis, Preterm infant
Introduction
Necrotising enterocolitis (NEC) is a potentially devastating gastrointestinal emergency predominantly affecting preterm infants, with significant health burden [1–3]. Survivors of surgical NEC are at a high risk for complications such as short bowel syndrome, failure to thrive and neurodevelopmental impairment [4–7]. The pathogenesis of NEC is poorly understood [1–3]. Prematurity is the most single most important risk factor for NEC. Other factors that contribute to its pathogenesis include gut dysbiosis, gestation-dependent excessive pro-inflammatory response to toxins such as lipopolysaccharides from intestinal gram-negative organisms, formula feeding and intestinal ischemia [1–3]. Preventive strategies include antenatal steroids, exclusive human milk feeding, standardized feeding regimen, prophylactic probiotics and antimicrobial stewardship [8].
Feeding intolerance is defined as ‘the inability to digest feedings presenting as gastric residual volume (GRV) > 50%, abdominal distension or emesis or both, disrupting the feeding plan [9]. Preterm infants frequently experience feed intolerance due to gastrointestinal immaturity and decreased intestinal motility [10, 11]. Excessive GRV has been variably defined (e.g. > 2 or > 5 ml/kg) and its reliability as a predictor of NEC remains unclear [12].
Bertino et al. [13] compared GRV from birth till development of NEC in very low birth weight (VLBW) infants (cases = 17) with control infants (n = 17) matched for GA and BW who did not develop the illness [13]. The mean maximum residual (7.46 ml vs 4 ml; p = 0.04) and the mean maximum residual as a percentage of the previous feed (113.24% vs 42.87%; p = 0.018) were significantly higher in cases. They concluded that large GRV and haemorrhagic residuals were early markers of NEC [13]. Cobb et al. [14] compared 51 VLBW infants who had proven NEC (cases) with 102 controls matched for birth weight, gestation, race and sex who were born in the same period [14]. The median birth weight and gestation was 822 g and 26 weeks in both groups. Feeds were started on day 5, with a planned increase to full feeds over 10 days (median) in both groups. Median time to full feeds (TFF) was 13 days in both groups. Median age of onset of NEC was day 24. Overall, infants who developed NEC had more GRs, but there was overlap with data from control infants. Of the various GR parameters assessed, only maximum GR seemed to be the best predictor for later development of NEC [14]. Mihatsch et al. assessed the prognostic significance of GRs (volume and colour) in upgrading feeds in preterm extremely low birth weight (extremely low birth weight/ELBW: BW < 1000 g) infants [15]. Regression analysis showed a direct correlation of feeding volume (FV) on day 14 with a negative (GRV = 0) or milky GR and no significant association with mean GRV or blood or bile-stained aspirates [15]. Shulman et al. [16] prospectively studied the relationship between reaching full feeds and measures such as GRV and abdominal distention and non-invasive gastrointestinal tests in preterm infants (N = 50, GA 25–32 weeks) [16]. The mean ± standard deviation (SD) BW and GA was 1200 g (± 330) and 28.6 weeks (± 2.2). Overall, there was no correlation between feeding outcomes and GRV (ml/day), GRV > 50%, GRV > 2 ml/kg. GRV was unreliable in predicting attainment of full feeding [16]. Recent studies have questioned the value of routine monitoring of GRs in preterm VLBW infants [17–19]. Considering the lack of clarity and clinical significance of the issue, we aimed to study the association between GRV and colour with NEC in preterm infants.
Hypothesis
We hypothesized that volume of GRs will be higher in infants who developed NEC ≥ stage II compared to controls who did not develop the illness.
Methods
Design and setting
Case–control study in a tertiary neonatal intensive care unit (NICU).
Ethics approval
Approval from the institutional ethics committee (project number 2015232EW) was obtained prior to commencing the study.
Participants
Eligibility: All preterm ELBW infants born < 28 weeks of gestation and admitted to the NICU between January 2006 and December 2011 were eligible considering their higher risk of NEC [23–27]
Exclusion: Out-born infants, those with congenital gastrointestinal malformations or chromosomal abnormalities
Cases: Preterm ELBW infants with NEC ≥ stage II as per Bell’s criteria [20]
Controls: Preterm ELBW infants matched for gestation (± 3 days) and BW (± 50 g) who did not develop NEC ≥ stage II, and born within the same year. One control was selected for each case.
Pre-planned subgroups
Surgical vs. medical NEC and Surgical NEC vs. matched controls.
Variables
Our outcome of interest was correlation of GRV with NEC ≥ stage II as per modified Bell’s staging [20].
Approach to feeding
A standardized protocol for enteral nutrition of preterm infants was followed during the study period [21]. Mother’s own milk (MOM) was preferred for feeding. Pasteurized donor milk was used when MOM was unavailable. (a) Two hourly bolus feeding through an orogastric tube was initiated as soon as possible after clinical stability defined as: (i) no/minimal respiratory assistance (e.g. mean airway pressure < 8 cm H2O, continuous positive airway pressure (CPAP) support < 5–6 cm H2O and oxygen < 30%), (ii) normal blood pressure, (iii) no hemodynamically significant patent ductus arteriosus, (iv) no sepsis or sepsis treated with antibiotics for at least 48 h and no respiratory or hemodynamic compromise. (b) Minimal enteral feeds: These were started at 5 ml/kg/day (GA < 25+6 weeks) or 10 ml/kg/day (appropriate for GA neonates 26–28 weeks). (c) Nutritional feeds: (i) GA < 25+6 weeks: Start feeding at 15 ml/kg/day and increase by 7.5 ml/kg every 12 h. (ii) GA 26–28 weeks: start at 20 ml/kg/day and upgrade by 10 ml/kg every 12 h. (iii) After reaching 100 ml/kg/day feeds, the eight hourly increments were by 7.5 ml/kg and 10 ml/kg/day for neonates < 25+6 weeks and 26–28 weeks respectively. (iv) Maximum daily total milk volume was 170 ml/kg/day. (d) Feeding intolerance: (i) GRs checked before every feed. Feeding was withheld in presence of pre-feed GRV > 50% of the previous two feedings, dark green or blood-stained GRs, or abdominal distension, and during red cell transfusions. (ii) Continuous feeding was used for infants with BW < 750 g with persistent feed intolerance. (e) Fortification.
This was started when FV reached 100 ml/kg/day at the discretion of the attending neonatologist.
Data source and measurements
Neonatal demographic and clinical data until the time of NEC in each matched pair were extracted from the neonatal electronic database. Maternal demographic and risk factors (e.g. pregnancy induced hypertension, prolonged rupture of membranes, chorioamnionitis and antenatal glucocorticoids) were recorded. Data collection for each control was up to the postnatal day on which NEC ≥ stage II was confirmed in the matched ‘case’. Data specific to the study included the type and volume of feeds, the volume and colour of GRs from day 1 of life till development of NEC, including in the 72, 48 and 24 h prior to the diagnosis of the illness, postnatal age at first and maximum feeding and maximum residual volume.
Statistical analysis
Continuous data were summarised using median, interquartile range (IQR) and range and categorical data using frequency distributions. Univariable comparisons between case–control pairs were made using the Wilcoxon signed-rank test for continuous outcomes and the McNemar test for categorical data. Conditional logistic regression analysis was conducted to assess the influence of GRV characteristics on NEC cases and controls while adjusting for sex and assessing other characteristics known to influence NEC such as intrauterine growth restriction, CRIB score, chorioamnionitis and antenatal steroid coverage. Time until feeds were commenced was analysed using survival methods. For each matched case–control pair, infants who had not received any feeds before developing NEC were censored in the analysis. Results were presented as unadjusted and adjusted odds ratios or hazard ratios (OR, aOR, HR, aHR) and corresponding 95% confidence intervals (CIs). IBM SPSS 20.0 statistical software (IBM Corp, Armonk, NY) and Stata 12 statistical software (StataCorp. 2011, College Station, TX) were used for data analysis. p-values < 0.05 were considered statistically significant.
Reporting
The STROBE (Strengthening the Reporting of Observational Studies in Epidemiology) guidelines were used for reporting [22].
Results
Forty cases of NEC ≥ stage II diagnosed at a median age of 16.5 days (IQR 10.3–23.8; range 5–54 days) were matched with 40 controls for GA (± 0.7 weeks), BW (± 680 g) and birth year (2006–2011). There was no change in antenatal management obstetric guidelines during this period. The median GA of the cases and controls were 24.9 (24.0–26.3; 23.0–27.7) and 24.6 weeks (24.0–26.4; 23.1–27.7) with median BW of 698 (567–829; 455–1505) and 693 g (603–823; 455–1015) respectively.
The cases and controls were compared on many antenatal and postnatal risk factors for NEC as shown in Table 1. The case–control pairs were comparable for most pregnancy, labour and neonatal characteristics including median CRIB score. The proportion of infants exposed to antenatal steroids (70% vs 50%, p = 0.039) and infants with male gender (75% vs 42.5%, p = 0.007) was higher in cases who developed NEC compared to controls.
Table 1.
Pregnancy, labour and neonatal characteristics
| Cases (NEC) N = 40 |
Controls (no NEC) N = 40 |
p-value | |
|---|---|---|---|
| Pregnancy and labour | |||
| APHb | 8 (20.0%) | 9 (22.5%) | 1.000 |
| PIHb | 5 (12.5%) | 5 (12.5%) | 1.000 |
| PROMb | 11 (27.5%) | 15 (37.5%) | 0.481 |
| CAb | 8 (20.0%) | 8 (20.0%) | 1.000 |
| Steroids completeb | 28 (70.0%) | 20 (50.0%) | 0.039 |
| Antibioticsb | 27 (67.5%) | 31 (77.5%) | 0.388 |
| Labourb | 29 (72.5%) | 28 (70.0%) | 1.000 |
| Caesarean sectionb | 15 (37.5%) | 22 (55.0%) | 0.167 |
| Inbornb | 37 (92.5%) | 40 (100%) | 0.250 |
| Neonatal characteristics | |||
| Gestational age (weeks)a | 24.9 (24.0–26.3) | 24.6 (24.0–26.4) | 0.538 |
| Maleb | 30 (75.0%) | 17 (42.5%) | 0.007 |
| Birth weight (g)a | 698 (567–829) | 693 (603–823) | 0.814 |
| Length (cm)a | 32 (30–34) | 32 (30–34) | 0.838 |
| Head circumference (cm)a | 23 (21–24) | 23 (21–24) | 0.505 |
| IUGRb | 7 (17.5%) | 7 (17.5%) | 1.000 |
| Apgar at 1 min < 7b | 36 (90.0%) | 30 (75.0%) | 0.146 |
| Apgar at 5 min < 7b | 13 (32.5%) | 13 (32.5%) | 1.000 |
| CRIBa | 13 (11–15) | 13 (11–14) | 0.711 |
APH antepartum haemorrhage, CRIB clinical risk index for babies, PIH pregnancy-induced hypertension, PROM prolonged rupture of membranes, IUGR intrauterine growth restriction
Data represents—amedian and interquartile range
bRange or number (%)
Primary outcomes (Table 2)
Table 2.
Association of gastric residual characteristics on infants with and without NEC
| Cases (NEC) N = 40 |
Controls (no NEC) N = 40 |
p-value | Unadjusted OR (95% CI) | Adjusted OR (95% CI) | Adjusted p-value | |
|---|---|---|---|---|---|---|
| Maximum residual volume | 5.9 (2.6–10.9) | 3.7 (2.3–5.1) | < 0.001 | 1.47 (1.09–1.99) | 1.36 (1.06–1.75) | 0.017 |
| Day of maximum residual | 12 (8–22) | 13 (8–18) | 0.182 | 1.08 (0.97–1.21) | 1.06 (0.94–1.19) | 0.367 |
| FV at maximum residuala | 2.5 (0–50) | 9 (1–88) | 0.326 | 0.84 (0.67–1.06) | 1.03 (0.77–1.35) | 0.861 |
|
Maximum residual as % of FVa (n = 22 pairs on feeds) |
36 (13–108) | 15 (6–77) | 0.277 | 1.20 (0.85–1.71) | 0.99 (0.63–1.53) | 0.949 |
|
24 h GRV as % of FV# (n = 16 pairs on feeds) |
13 (2–31) | 2 (0.3–19) | 0.382 | 1.55 (0.93–2.58) | 1.46 (0.85–2.50) | 0.170 |
| Commenced on enteral feeds | 30 (75%) | 35 (88%) | 0.180 | 0.29 (0.06–1.38) | 0.23 (0.04–1.27) | 0.091 |
| Days until enteral feeds startedb | 8 (5–10) | 6 (4–8) | 0.025 | 0.59 (0.38–0.91) | 0.63 (0.39–1.00) | 0.050 |
Data represent median, interquartile range and range or number (%) and unadjusted and adjusted odds ratios (OR) and 95% confidence intervals (CIs), unless otherwise stated. p-value represents the univariate comparison between cases and controls and the adjusted p-value represents the effect of the gastric residual variable on NEC in a conditional logistic regression model adjusted for completed antenatal steroids and sex of infant
FV feeding volume, GRV gastric residual volume
aVariable transformed to the base-2 logarithm in regression analysis
bSummaries represent median (25th–75th percentile) Kaplan–Meier survival estimates, and hazard ratios and 95% confidence intervals from Cox proportional hazards regression model adjusted for completed antenatal steroids and sex of infant
The median maximum GRV from birth to the day of occurrence of NEC was significantly higher in cases vs. controls (5.9 vs. 3.7 ml; p < 0.001), and increased maximum GRV was associated with NEC ≥ stage II (aOR 1.36, 95%CI 1.06–1.75, p = 0.017) in univariable analysis and with adjustment for sex of infant and completed antenatal steroids. There were no significant differences in the day of maximum GRV, feeding volume (FV) at maximum GRV, maximum GRV as percentage of FV and 24-h GRV as % of FV in infants on feeds. A total of 25% of cases developed NEC ≥ stage II without being commenced on enteral feeds. Feeds were commenced late in cases compared to controls (median 8 vs. 6 days, p = 0.025; aHR 0.63, 95%CI 0.39–1.00, p = 0.050) (Table 2).
Secondary outcomes (Table 3)
Table 3.
Gastric residual characteristics 72, 48 and 24 h before the diagnosis of NEC
| Cases (NEC) N = 40 |
Controls (no NEC) N = 40 |
p-value | |
|---|---|---|---|
| Haemorrhagic residualb | 38 (95%) | 36 (90%) | 0.500 |
| Day of haemorrhagic residual (n = 36 pairs)a | 4 (2–8) | 3 (2–5) | 0.061 |
| 72 h prior | |||
| GR volumea | 0.6 (0.2–1.7) | 1.2 (0.4–2.5) | 0.077 |
| FVa | 0.3 (0–84) | 12 (1–90) | 0.570 |
| % GR volume (n = 19 pairs on feeds)* | 2.5 (0.7–5.9) | 3 (0.5–74) | 0.151 |
| Bloodb | 7 (17.5%) | 14 (35.0%) | 0.118 |
| Colourb | 15 (37.5%) | 15 (37.5%) | 1.000 |
| Colour type | |||
| Lime | 7 | 6 | NT |
| Wasabi | 7 | 8 | |
| Avocado | 1 | 0 | |
| Spinach | 0 | 1 | |
| 48 h prior | |||
| GR volumea | 0.9 (0.3–2.0) | 0.9 (0.3–2.1) | 0.326 |
| FVa | 1 (0–89.4) | 22 (0.3–95) | 0.304 |
| % GR volume (n = 19 pairs on feeds)* | 1.5 (0.5–1) | 3.3 (0.4–10) | 0.509 |
| Bloodb | 10 (25.0%) | 6 (15.0%) | 0.388 |
| Colourb | 19 (47.5%) | 10 (25.0%) | 0.049 |
| Colour type | |||
| Lime | 9 | 3 | NT |
| Wasabi | 10 | 6 | |
| Avocado | 0 | 0 | |
| Spinach | 0 | 1 | |
| 24 h prior | |||
| GR volumea | 1.8 (0.3–6.1) | 1.1 (0.3–3.0) | 0.159 |
| FVa | 0 (0–56.0) | 21.9 (1.3–99.6) | 0.002 |
| % GR volume (n = 16 pairs on feeds)a | 13 (2–31) | 2 (0.3–19) | 0.382 |
| Bloodb | 18 (45.0%) | 11 (27.5%) | 0.092 |
| Colourb | 26 (65.0%) | 11 (27.5%) | 0.001 |
| Colour type | |||
| Lime | 9 | 5 | NT |
| Wasabi | 15 | 5 | |
| Avocado | 2 | 0 | |
| Spinach | 0 | 1 |
FV feeding volume, GR gastric residual, NT not statistically tested
aMedian and IQR
bNumber and percentage
Overall, the frequency of haemorrhagic GRVs and the age at first haemorrhagic residual was comparable in cases vs. control infants. GRVs were comparable at 72, 48 and 24 h prior to NEC diagnosis in cases and controls (Table 3; Fig. 1). Coloured aspirates were significantly more frequent among NEC cases at 48 h (47.5% vs 25.0%, p = 0.049) and at 24 h prior to development of NEC (65.0% vs 27.5%, p = 0.001) compared with controls. Coloured aspirates were classified into pale green (lime, wasabi) and dark green (avocado and spinach) shades; however, these were not individually statistically tested. Haemorrhagic aspirates were more common in cases at 24 h prior to NEC diagnosis as compared to controls but not statistically significant.
Fig. 1.
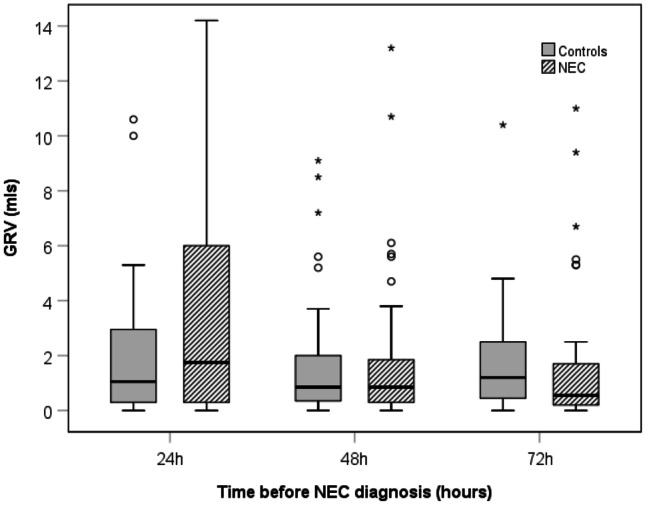
Boxplots showing gastric residual volumes 24, 48 and 72 h before NEC diagnosis. GRV gastric residual volume, NEC necrotising enterocolitis
Subgroup analysis: surgical NEC vs. Medical NEC
Out of the 40 NEC cases, 50% (n = 20) had surgical NEC, and the remaining received conservative management (medical NEC). There was no difference in GRV (OR 0.73; 95% CI 0.46–1.16, p = 0.189), coloured (OR 1.03; 95% CI 0.24–4.35, p = 0.96) and haemorrhagic aspirates (OR 1; 95% CI 0.23–4.27, p = 1) between surgical (n = 20) and medical NEC (n = 20) cases.
Subgroup analysis: surgical NEC vs. controls
No differences were found between surgical NEC cases and controls (n = 20 pairs). However, the analyses were underpowered due to the small sample size. The high ORs and wide CIs are indicative of this, especially for the analysis of shade of aspirate colour (OR 3.45; 95% CI 0.59–20.04, p = 0.168) and presence of haemorrhagic aspirate (OR 6.43; 95% CI 0.61–68.08, p = 0.122).
Discussion
Our results showed that the mean maximum GRV from birth to the day NEC occurrence was significantly higher in cases than controls. The GRV did not differ significantly between cases and controls throughout the clinical course, including 72, 48 and 24 h before the onset of NEC. However, green and haemorrhagic GRVs were higher 24 h before the diagnosis of NEC in cases. There was no significant difference in other GRV variables in cases vs controls (e.g. day of maximum GRV, volume of feeds at maximum GRV, maximum GRV as percentage of feeding volume).
Comparing our results with previous studies is difficult due to the differences in participant characteristics, methodology (e.g. feeding protocol, GRV monitoring) and the time periods. Compared to our study, the mean (SD) GA and BW of infants were higher in Bertino et al. [13] and comparable in Cobb et al. [14]. Limitations of the study design, long list of factors influencing GRs (e.g. degree of prematurity, infant and feeding tube position, frequency, type and osmolality of feeds, medications, fortifiers) and changes in clinical practice over time make comparison with old studies difficult [23]. Commenting on haemorrhagic residuals as a predictor of NEC is difficult considering they may relate to gastric mucosal injury by frequent aspirations to check GRs, stress-induced gastritis or airway injury during endotracheal intubation [23, 24].
Recent studies have questioned the utility of routine monitoring of GRVs—a practice lacking robust evidence [17–19]. They show that the fear of NEC based on signs of ‘feed intolerance’ on routine monitoring of GRs is probably causing more harm (suboptimal nutrition due to frequent stopping of feedings) than benefit.
Riskin et al. [17] evaluated the effect of change in practice from ‘routine’ to ‘selective’ evaluation of pre-feed GRV on time to full feeds (TFF 150 ml/kg/day) and incidence of NEC in preterm infants [17]. Data was collected from 2 years before (n = 239) and 2 years after the change (n = 233). The median (IQR) gestation of infants after the change was higher (before vs. after 32.0 (29.7–33.0) vs. 32.4 (30.4–33.4) weeks, p = 0.02). Compared with historic controls, infants with selective evaluations of GRV were weaned from parenteral nutrition 1 day earlier (p < 0.001) and achieved full feeds 1 day earlier (p = 0.002). The incidence of NEC stage ≥ II was not significantly different between the two groups (selective GRV 1.7 vs. historical controls 3.3%, p = 0.4). Gestation was the strongest predictor of TFF on regression analysis. Routine monitoring of GRV and increasing time on non-invasive ventilation prolonged the TFF. Findings were consistent in VLBW infants (BW < 1500 g). Not monitoring GRV routinely significantly contributed to higher weight at discharge [17].
A Cochrane systematic review (2019) has assessed the effects of routine GRV monitoring in preterm infants [18]. Two randomised controlled trials (RCTs) (n = 141 preterm VLBW infants) were included in the meta-analysis. The effect of routine GRV monitoring on NEC was uncertain (RR 3.07, 95% CI 0.50 to 18.77; quality of evidence: low), and such practice may increase the risk of feeding interruptions (RR 2.07, 95% CI 1.39 to 3.07), the TFF (MD 3.92, 95% CI 2.06 to 5.77 days) and duration of parenteral nutrition (PN) (MD 3.29, 95% CI 1.66 to 4.92 days). It may also increase the time to regain birth weight (MD 1.70, 95% CI 0.01 to 3.39 days; n = 80; one study). Only one trial (n = 87, BW 1500–2000 g) allowed comparison of two different GRV criteria to stop feeds. The effect of such a policy on various outcomes including NEC, TFF and time to regain birth weight was uncertain. Given the inadequate data, further RCTs were recommended [18].
Parker et al. [19] evaluated the effect of avoiding routine assessment of pre-feed GRs on nutritional outcomes in preterm infants in a RCT [19]. Infants (GA ≤ 32 weeks, BW ≤ 1250 g) were enrolled within 72 h after birth and within 24 h after starting feeds and followed for 6 weeks. Feeding decisions were based on nutritional guidelines. All infants received only human milk. Weekly milk intake (ml/kg) for 6 weeks after birth was the primary outcome. Enrolled infants were randomized to ‘routine’ (n = 74) or ‘no GRV’ (n = 69) evaluation groups. The median (SD) GA and BW of infants in these groups were 27.1 weeks (2.4) and 888.8 g (206.6) vs. 27 weeks (1.2), and 915.2 g (180) respectively. Feeding was advanced quicker (mean weekly increase, 20.7 mL/kg/day vs 17.9 mL/kg/day; p = 0.02), and consumption of feeds was more at 5 weeks [137.2 (95% CI 128.6–145.8); p = 0.03) and 6 weeks [141.6 (95% CI 133.2–150.0); p = 0.03] in the ‘no’ vs ‘routine’ GRV evaluation group respectively. The no GRV evaluation group had higher mean estimated log weights (p = 0.03), and lesser frequency of abdominal distention (p = 0.001) and were discharged 8 days earlier (p = 0.01). The odds for NEC, death, late-onset sepsis and ventilator-associated pneumonia were comparable [19].
Akar and Turgut [25] recently assessed the impact of avoiding routine monitoring of GRV on TFF and incidence of NEC in preterm (GA ≤ 33 weeks) infants [25]. Their observational study compared infants in the historical (Epoch 1 169, routine GRV monitoring) vs. prospective cohort (Epoch 2: n = 122, no routine GRV monitoring). BW, male gender and mode of delivery were comparable, but mean (± SD) gestation was lower in epoch 2 [Epoch 1 30.37 (± 2.58) weeks vs. Epoch 2 29.31 (± 3.37) weeks, p < 0.05]. The TFF was significantly shorter in epoch 2 (p < 0.05), but NEC ≥ stage II, duration of parenteral nutrition and hospital stay and weight at discharge were comparable. Duration of invasive mechanical ventilator support was shorter in epoch 2 [25].
The limitations of our study include the case–control design and small numbers. We could not get 2 controls per case due to difficulties in matching. While best efforts have been made to reduce confounding by matching cases and controls on important characteristics and including covariate adjustment in analysis, our data are observational, and we cannot rule out the possibility of unmeasured residual confounding contributing to results. We also acknowledge that a whole database study or propensity score matching design may have improved precision and possible confounding issues. However, despite these limitations, we believe our study adds useful contemporary data on EP infants exclusively fed breast milk.
In summary, GRV was not associated with NEC ≥ stage II in EP infants in our study. However, green and haemorrhagic GRs were significantly higher 24 h before the occurrence of NEC. Adequately powered and well-designed RCTs are needed to confirm the significance of our findings in EP infants. The need for such a trial is further supported by a recent study in EP infants which showed that discarding dark green/yellow GRs may represent loss of beneficial nutrients including bile, which has an important role in nutrition [26]. The primary outcome should preferably be optimisation of enteral nutrition without increasing the risk of NEC. Masking of investigators and standardising the protocol for monitoring GRV will be important issues in designing such trials [27]. Results of current trials (NCT03111329, NCT04062851 and NCT04064398) will provide important data in this context.
Abbreviations
- BW
Birth weight
- CI
Confidence interval
- CRIB
Clinical risk index for babies
- EP
Extremely preterm
- FV
Feeding volume
- GA
Gestational age
- GRV
Gastric residual volume
- NEC
Necrotising enterocolitis
- NICU
Neonatal intensive care units
- PN
Parenteral nutrition
- RCT
Randomised controlled trial
- SD
Standard deviation
- VLBW
Very low birth weight
Authors’ contributions
GP: collected and summarized the data, wrote the initial draft of the manuscript, and revised it. PM: assisted with data collection and summary and helped with revisions of the manuscript. GAJ: assisted with data collection, accurate interpretation of summarized data and critically reviewed and revised the final draft of the manuscript. EN: statistically analysed the data and summarized it, checked accurate interpretation of data. SP: designed the study, supervised the project, critically reviewed and revised the final version of the manuscript. We had complete access to the study data that support the publication. All authors read and approved the final manuscript.
Availability of data and material
Neonatal demographic and clinical data until the time of NEC in each matched pair were extracted from the neonatal electronic database. Maternal demographic and risk factors (e.g. pregnancy induced hypertension, prolonged rupture of membranes, chorioamnionitis, and antenatal glucocorticoids) were recorded. Data collection for each control was up to the postnatal day on which NEC ≥ stage II was confirmed in the matched ‘case’. Data specific to the study included the type and volume of feeds, the volume and colour of GRs from day 1 of life till development of NEC, including in the 72, 48 and 24 h prior to the diagnosis of the illness, postnatal age at first and maximum feeding and maximum residual volume.
Code availability
Continuous data were summarised using median, interquartile range (IQR) and range and categorical data using frequency distributions. Univariable comparisons between case–control pairs were made using the Wilcoxon signed-rank test for continuous outcomes and the McNemar test for categorical data. Conditional logistic regression analysis was conducted to assess the influence of GRV characteristics on NEC cases and controls while adjusting for sex and assessing other characteristics known to influence NEC such as intrauterine growth restriction, CRIB score, chorioamnionitis and antenatal steroid coverage. Time until feeds were commenced was analysed using survival methods. For each matched case–control pair, infants who had not received any feeds before developing NEC were censored in the analysis. Results were presented as unadjusted and adjusted odds ratios or hazard ratios (OR, aOR, HR, aHR) and corresponding 95% confidence intervals (CI). IBM SPSS 20.0 statistical software (IBM Corp, Armonk, NY) and Stata 12 statistical software (StataCorp. 2011, College Station, TX) were used for data analysis. p-values < 0.05 were considered statistically significant.
Declarations
Ethics approval
Approval from the institutional ethics committee (project number 2015232EW) was obtained prior to commencing the study.
Competing interests
The authors declare no competing interests.
Footnotes
The original online version of this article was revised: The given names and family names of the authors presented in the authorship were inadvertently interchanged. The authors names are presented correctly above.
Publisher's Note
Springer Nature remains neutral with regard to jurisdictional claims in published maps and institutional affiliations.
Change history
8/17/2021
A Correction to this paper has been published: 10.1007/s00431-021-04230-9
Contributor Information
Gajanan Purohit, Email: gajanan.purohit@health.wa.gov.au.
Puja Mehkarkar, Email: puja.mehkarkar@health.wa.gov.au.
Gayatri Athalye-Jape, Email: gayatri.jape@health.wa.gov.au.
Elizabeth Nathan, Email: liz.nathan@uwa.edu.au.
Sanjay Patole, Email: sanjay.patole@health.wa.gov.au.
References
- 1.Neu J, Walker WA. Necrotizing enterocolitis. N Engl J Med. 2011;364(3):255–264. doi: 10.1056/NEJMra1005408. [DOI] [PMC free article] [PubMed] [Google Scholar]
- 2.Alganabi M, Lee C, Bindi E, Li B, Pierro A (2019) Recent advances in understanding necrotizing enterocolitis. F1000Res 8:F1000 Faculty Rev-107. 10.12688/f1000research.17228.1 [DOI] [PMC free article] [PubMed]
- 3.Niño DF, Sodhi CP, Hackam DJ. Necrotizing enterocolitis: new insights into pathogenesis and mechanisms. Nat Rev Gastroenterol Hepatol. 2016;13(10):590–600. doi: 10.1038/nrgastro.2016.119. [DOI] [PMC free article] [PubMed] [Google Scholar]
- 4.Jones IH, Hall NJ. Contemporary outcomes for infants with necrotizing enterocolitis-a systematic review. J Pediatr. 2020;220:86–92.e3. doi: 10.1016/j.jpeds.2019.11.011. [DOI] [PubMed] [Google Scholar]
- 5.Han SM, Knell J, Henry O, Riley H, Hong CR, Staffa SJ, Modi BP, Jaksic T. Long-term outcomes of severe surgical necrotizing enterocolitis. J Pediatr Surg. 2020;55(5):848–851. doi: 10.1016/j.jpedsurg.2020.01.019. [DOI] [PubMed] [Google Scholar]
- 6.Matei A, Montalva L, Goodbaum A, Lauriti G, Zani A. Neurodevelopmental impairment in necrotising enterocolitis survivors: systematic review and meta-analysis. Arch Dis Child Fetal Neonatal Ed. 2020;105(4):432–439. doi: 10.1136/archdischild-2019-317830. [DOI] [PubMed] [Google Scholar]
- 7.Hau EM, Meyer SC, Berger S, Goutaki M, Kordasz M, Kessler U. Gastrointestinal sequelae after surgery for necrotising enterocolitis: a systematic review and meta-analysis. Arch Dis Child Fetal Neonatal Ed. 2019;104(3):F265–F273. doi: 10.1136/archdischild-2017-314435. [DOI] [PubMed] [Google Scholar]
- 8.Jin YT, Duan Y, Deng XK, Lin J. Prevention of necrotizing enterocolitis in premature infants - an updated review. World J Clin Pediatr. 2019;8(2):23–32. doi: 10.5409/wjcp.v8.i2.23. [DOI] [PMC free article] [PubMed] [Google Scholar]
- 9.Moore TA, Wilson ME. Feeding intolerance: a concept analysis. Adv Neonatal Care. 2011;11:149–154. doi: 10.1097/ANC.0b013e31821ba28e. [DOI] [PubMed] [Google Scholar]
- 10.Jadcherla SR, Kliegman RM. Studies of feeding intolerance in very low birth weight infants: definition and significance. Pediatrics. 2002;109(3):516–517. doi: 10.1542/peds.109.3.516. [DOI] [PubMed] [Google Scholar]
- 11.Fanaro S. Feeding intolerance in the preterm infant. Early Hum Dev. 2013;89(Suppl 2):S13–20. doi: 10.1016/j.earlhumdev.2013.07.013. [DOI] [PubMed] [Google Scholar]
- 12.Li YF, Lin HC, Torrazza RM, Parker L, Talaga E, Neu J. Gastric residual evaluation in preterm neonates: a useful monitoring technique or a hindrance? Pediatr Neonatol. 2014;55(5):335–340. doi: 10.1016/j.pedneo.2014.02.008. [DOI] [PubMed] [Google Scholar]
- 13.Bertino E, Giuliani F, Prandi G, Coscia A, Martano C, Fabris C. Necrotizing enterocolitis: risk factor analysis and role of gastric residuals in very low birth weight infants. Journal of pediatric gastroenterology and nutrition. 2009;48(4):437–442. doi: 10.1097/MPG.0b013e31817b6dbe. [DOI] [PubMed] [Google Scholar]
- 14.Cobb BA, Carlo WA, Ambalavanan N (2004) Gastric residuals and their relationship to necrotizing enterocolitis in very low birth weight infants. Pediatrics 113:50e3. 10.1542/peds.113.1.50 [DOI] [PubMed]
- 15.Mihatsch WA, von Schoenaich P, Fahnenstich H, Dehne N, Ebbecke H, Plath C, von Stockhausen HB, Muche R, Franz A, Pohlandt F. The significance of gastric residuals in the early enteral feeding advancement of extremely low birth weight infants. Pediatrics. 2002;109(3):457–459. doi: 10.1542/peds.109.3.457. [DOI] [PubMed] [Google Scholar]
- 16.Shulman RJ, Ou CN, Smith EO. Evaluation of potential factors predicting attainment of full gavage feedings in preterm infants. Neonatology. 2011;99:38–44. doi: 10.1159/000302020. [DOI] [PMC free article] [PubMed] [Google Scholar]
- 17.Riskin A, Cohen K, Kugelman A, Toropine A, Said W, Bader D. The impact of routine evaluation of gastricr residual volumes on the time to achieve full enteral feeding in preterm infants. J Pediatr. 2017;189:128–134. doi: 10.1016/j.jpeds.2017.05.054. [DOI] [PubMed] [Google Scholar]
- 18.Abiramalatha T, Thanigainathan S, Ninan B (2019) Routine monitoring of gastric residual for prevention of necrotising enterocolitis in preterm infants. Cochrane Database Syst Rev 7: CD012937. 10.1002/14651858.CD012937.pub2 [DOI] [PMC free article] [PubMed]
- 19.Parker LA, Weaver M, Murgas Torrazza RJ, Shuster J, Li N, Krueger C, Neu J. Effect of gastric residual evaluation on enteral intake in extremely preterm infants: a randomized clinical trial. JAMA Pediatr. 2019;173(6):534–543. doi: 10.1001/jamapediatrics.2019.0800. [DOI] [PMC free article] [PubMed] [Google Scholar]
- 20.Bell MJ, Ternberg JL, Feigin RD, Keating JP, Marshall R, Barton L, Brotherton T. Neonatal necrotizing enterocolitis: therapeutic decisions based upon clinical staging. Ann Surg. 1978;187:1–7. doi: 10.1097/00000658-197801000-00001. [DOI] [PMC free article] [PubMed] [Google Scholar]
- 21.Shah P, Nathan E, Doherty D, Patole S. Optimising enteral nutrition in growth restricted extremely preterm neonates–a difficult proposition J. Matern Fetal Neonatal Med. 2015;28(16):1981–1984. doi: 10.3109/14767058.2014.974538. [DOI] [PubMed] [Google Scholar]
- 22.Von Elm E, Altman DG, Egger M, Pocock SJ, Gøtzsche PC, Vandenbroucke JP, STROBE Initiative (2008) The Strengthening the Reporting of Observational Studies in Epidemiology (STROBE) statement: guidelines for reporting observational studies. J Clin Epidemiol 61(4):344–9. 10.1016/j.jclinepi.2007.11.008 [DOI] [PubMed]
- 23.Kaminski MM, Clancy KL, Steward DK. Dilemmas surrounding interpretation of gastric residuals in the NICU setting. SAGE Journals. 2014;6(5):286–294. doi: 10.1177/1941406414539005. [DOI] [Google Scholar]
- 24.Kuusela AL, Mäki M, Ruuska T, Laippala P. Stress-induced gastric findings in critically ill newborn infants: frequency and risk factors. Intensive Care Med. 2000;26:1501–1506. doi: 10.1007/s001340051346. [DOI] [PubMed] [Google Scholar]
- 25.Akar S, Turgut M. Do we control gastric residuals unnecessarily in premature newborns? AGRA study: avoidance of gastric residual aspiration. World Journal of Pediatric Surgery. 2020;3:e000056. doi: 10.1136/wjps-2019-000056. [DOI] [PMC free article] [PubMed] [Google Scholar]
- 26.Gayatri AJ, Megan N, Ching-Tat L, Elizabeth N, Donna G, Karen S, Sanjay P. Composition of coloured gastric residuals in extremely preterm infants -a nested prospective observational study. Nutrients. 2020;12(9):2585. doi: 10.3390/nu12092585. [DOI] [PMC free article] [PubMed] [Google Scholar]
- 27.Parker L, Torrazza RM, Li Y, Talaga E, Shuster J, Neu J. Aspiration and evaluation of gastric residuals in the neonatal intensive care unit: state of the science. J Perinat Neonatal Nurs. 2015;29(1):51–59. doi: 10.1097/JPN.0000000000000080. [DOI] [PMC free article] [PubMed] [Google Scholar]
Associated Data
This section collects any data citations, data availability statements, or supplementary materials included in this article.
Data Availability Statement
Neonatal demographic and clinical data until the time of NEC in each matched pair were extracted from the neonatal electronic database. Maternal demographic and risk factors (e.g. pregnancy induced hypertension, prolonged rupture of membranes, chorioamnionitis, and antenatal glucocorticoids) were recorded. Data collection for each control was up to the postnatal day on which NEC ≥ stage II was confirmed in the matched ‘case’. Data specific to the study included the type and volume of feeds, the volume and colour of GRs from day 1 of life till development of NEC, including in the 72, 48 and 24 h prior to the diagnosis of the illness, postnatal age at first and maximum feeding and maximum residual volume.
Continuous data were summarised using median, interquartile range (IQR) and range and categorical data using frequency distributions. Univariable comparisons between case–control pairs were made using the Wilcoxon signed-rank test for continuous outcomes and the McNemar test for categorical data. Conditional logistic regression analysis was conducted to assess the influence of GRV characteristics on NEC cases and controls while adjusting for sex and assessing other characteristics known to influence NEC such as intrauterine growth restriction, CRIB score, chorioamnionitis and antenatal steroid coverage. Time until feeds were commenced was analysed using survival methods. For each matched case–control pair, infants who had not received any feeds before developing NEC were censored in the analysis. Results were presented as unadjusted and adjusted odds ratios or hazard ratios (OR, aOR, HR, aHR) and corresponding 95% confidence intervals (CI). IBM SPSS 20.0 statistical software (IBM Corp, Armonk, NY) and Stata 12 statistical software (StataCorp. 2011, College Station, TX) were used for data analysis. p-values < 0.05 were considered statistically significant.