

Abstract
Due to the specific hydrothermal conditions of dry‐hot valleys, temperature changes caused by the development of large‐scale hydropower projects may be more extreme than they are in other regions. In this study, we analyzed these temperature changes at four hydropower stations in both dry‐hot and non‐dry‐hot valleys. Based on the calculated relative temperatures of the downstream river and the areas surrounding the reservoirs, we employed two indices to quantify the influence of the reservoirs on the temperatures of these two regions: the downstream river temperature change and the reservoir effect change intensity. Our results are as follows: (a) In the downstream rivers, the temperature regulation effect was more pronounced in the wet season; in the regions surrounding the reservoirs, the temperature regulation effect was more pronounced in the dry season. (b) The downstream river temperature in both the dry‐hot and wet‐hot valleys exhibited noticeable warming in both the wet and dry seasons, while the cold‐dry valley was characterized by cooling in the dry season and warming in the wet season. With the exception of the Liyuan station (where the influence of the reservoir on the downstream temperatures only extended to a distance of 9 km from the dam) during the dry season, the existence of the hydropower stations affected the temperatures of the entire downstream region. (c) For the areas surrounding the reservoir, the presence of a hydropower station mainly caused the temperatures in the dry‐hot valleys to rise and the temperatures in the non‐dry‐hot valleys to decrease.
Keywords: dry‐hot valley, comparative study, relative temperature, downstream river temperature change, reservoir effect change intensity
Key Points
The difference of surface temperature affected by reservoirs was compared in dry‐hot and non‐dry‐hot valleys
To facilitate comparison of the different downstream river temperature changes, downstream river temperature change index was established
The reservoir effect change intensity was established to explore how reservoirs regulate the surface temperature in the surrounding areas
1. Introduction
While the development of large‐scale hydropower facilities is beneficial with respect to flood control, power generation, and shipping (Fan et al., 2015; Kuang, 2020), the facilities can distinctly alter the surrounding environments and ecosystems (Deemer et al., 2016; Endo & Eltahir, 2018; Sun, Miao, Hanel, et al., 2019; Zheng et al., 2019). Studies have shown that dam construction and reservoir storage are the primary causes of changes in the thermal state of rivers (Miao et al., 2018; Vatland et al., 2015; L. Yang, 2019); those river temperature changes in turn affect the health of the aquatic ecosystem and the growth and spatial distribution of aquatic organisms (Gou et al., 2021; Greenfield et al., 2017; Ling et al., 2017). Due to the relatively high specific heat capacity of water, the construction of large‐scale reservoirs heavily influences the temperature of the reservoir area (Zhao et al., 2013; D. C. Wang et al., 2020). Degu et al. (2011) found that dam construction may result in a decline in the number and intensity of extreme weather events in reservoir areas in North America. After dam construction, temperature changes appear to have a greater impact on the surrounding ecosystem of the entire reservoir area. Therefore, studying temperature changes induced by the presence of a dam provides valuable insight into ways of improving and protecting the ecological environment and maintaining biodiversity in reservoir areas.
Previous studies indicate that the influence of dams on the temperatures of the areas surrounding the reservoir depends on the study area and the dam specifications (Tashlykova, 2013; W. Y. Wang et al., 2012; Xiong et al., 2020). Song et al. (2017) analyzed the temperatures in the downstream area of the Three Gorges Reservoir and found that the surface temperatures decreased during the day in the summer and increased at night in the winter. D. Wang et al. (2018) found that the Xiluodu reservoir area experienced both cooling and warming in the same season. These variations are generally attributed to differences in the geographical location and the climate conditions (Y. Liu et al., 2013). Therefore, a comparative analysis of temperature changes produced by hydropower facilities in different study areas could highlight the variations in temperature regulation that occur at different reservoirs. As a region with special hydrothermal conditions (Huan‐cheng & McConchie, 2001), a dry‐hot valley is a fragile ecosystem characterized by a complex terrain; a hot, dry climate; little vegetation; barren soil; and ongoing soil erosion (Duan et al., 2015; F. Liu et al., 2010). Our analysis of the temperature changes in the downstream rivers and the areas surrounding the reservoir after the construction of a hydropower station in both dry‐hot and non‐dry‐hot valleys can deepen our understanding of the reservoir temperature regulation effect and provide a theoretical basis for the ecological restoration of dry‐hot valleys.
With the rapid development of remote sensing technology (Kuang et al., 2020), some recent studies have used remote sensing satellite images to conduct research on the cooling and warming effects of reservoirs; these studies demonstrate that satellite‐based surface temperature data play an increasingly important role in local climate monitoring (Y. Li et al., 2015; Peng et al., 2014; J. Yang et al., 2013).
The basic principle of comparative study is the principle of controlling differences, which aims to ensure that comparative study is a quantitative study based on common basis, and the study without common basis is meaningless (Xu, 2010). Based on this, we took reservoir capacity and topography, two important factors affecting surface temperature, as the control factors in this study. The Liyuan hydropower station and the Ahai hydropower station with similar reservoir capacity and topography in the middle reaches of Jinsha River were selected as the study subjects within the dry‐hot valley, and the Laxiwa hydropower station in the upper reaches of the Yellow River and the Jinghong hydropower station in the lower reaches of the Lancang River were selected as the study subjects in the cold dry valley and the wet thermal valley, respectively. We devised two indices, the downstream river temperature change (DRTC) index and the reservoir effect change intensity (RECI) index; both of these indices use relative temperature values to explore the reservoir temperature regulation differences that occur in the downstream river and in the areas surrounding the reservoir for both same climate (in the dry‐hot valley) and different climate (in the dry‐hot valley and non‐dry‐hot valleys). Our research goals are (a) to quantify the surface temperatures variations that occur before and after hydropower station construction in different types of valleys during the wet and dry seasons, (b) to capture the differences in the downstream temperature variations and the downstream extent of the temperature regulation effect in the wet and dry seasons, and (c) to explore the differences in the reservoir regulation effect on the temperatures of the areas surrounding the reservoirs in the wet and dry seasons.
2. Materials and Methods
2.1. Study Areas
The four hydropower stations of interest are the Liyuan, Ahai, Jinghong, and Laxiwa hydropower stations (Table 1). In each study area, we analyzed both the head area of the reservoir and the downstream areas within the basin (Figure 1).
Table 1.
Parameters Describing the Four Hydropower Stations
| Name | Total storage (108 m3) | Regulating storage (108 m3) | Total installed capacity (MW) | Maximum dam height (m) | Normal pool level (m) | Regulation cycle (day) | Construction period | Study area (km2) |
|---|---|---|---|---|---|---|---|---|
| Liyuan | 8.05 | 1.73 | 2,400 | 155 | 1,618 | 7 | 2008–2016 | 570.52 |
| Ahai | 8.82 | 2.38 | 2,000 | 138 | 1,504 | 1 | 2008–2014 | 583.68 |
| Jinghong | 11.39 | 3.09 | 1,750 | 110 | 602 | 7 | 2008–2009 | 604.91 |
| Laxiwa | 10.79 | 1.5 | 4,200 | 250 | 2,452 | 1 | 2004–2010 | 523.98 |
Figure 1.
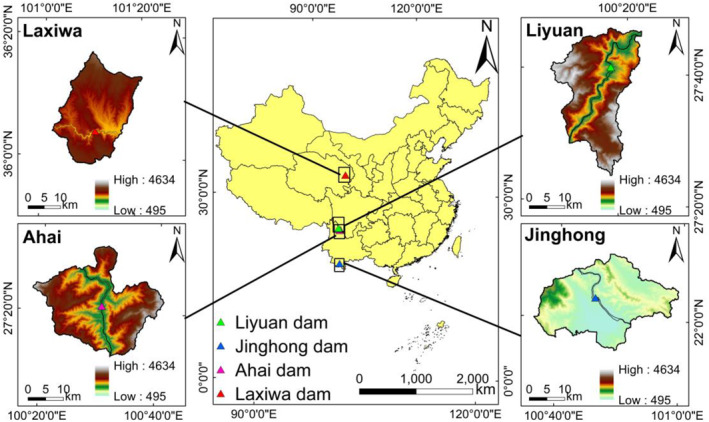
Geographic and elevation maps of our study areas.
The Liyuan hydropower station is located in the main stream of the Jinsha River at the junction of Yulong County and Shangri‐La County. The Ahai hydropower station is located in the middle reaches of the Jinsha River at the junction of Yulong County and Ninglang County. Both of these hydropower stations are located in dry‐hot valleys characterized by high mountains, low valleys, and complex terrain. Due to the steep topography, atmospheric circulation, and foehn effect present in these two areas, the land around the Liyuan and Ahai hydropower stations have low annual precipitation (∼610–817 mm) and high annual evaporation (∼2,600–3,700 mm). The dry and wet seasons are distinct, with the wet season (May‐October) precipitation accounting for more than 90% of the annual precipitation. The months outside of the wet season are known as the dry season. The average annual temperature is 20.7–24.1°C and the temperature decreases at higher altitudes (Gu et al., 2016; Ji et al., 2009).
The Jinghong hydropower station is located ∼5 km from the northern suburb of Jinghong City in the lower reaches of the Lancang River. The region has a tropical monsoon climate with significant variations between the dry and wet seasons. In this area, the year is divided into three seasons: the dry‐hot season (March–April), the humid‐hot season (May–October), and the foggy‐cool season (November–February). Nearly 85% of the annual precipitation falls in the humid‐hot season. The annual average temperature is 21.5°C and the topography of this humid‐hot valley region is 95% mountains and 5% intermontane basins (Kong et al., 2015).
The Laxiwa hydropower station is located in the main stream of the Yellow River at the junction of Guide County and Guinan County in the Laxiwa River Valley. This cold, arid region is largely made up of plateaus; the dryness and lack of rain result in harsh winters and cool summers. The average annual temperature, average annual rainfall, and evaporation are 7.2°C, 255.8 mm, and 2,096 mm, respectively. Most of the rain falls from July to September, while the winter and spring seasons are dry and windy. This cold‐dry valley region is characterized by steep canyons, multi‐level river terraces, and basin hills (Hu et al., 2017; Sui & Yang, 2005).
2.2. Land Surface Temperature
There are many possible algorithms that can be applied to the task of retrieving surface temperatures from remote sensing images. Some examples of these algorithms include the atmospheric correction, mono‐window, split‐window, and multiple‐channels algorithms (Du et al., 2014; Qin et al., 2001; Sobrino et al., 1996; Wu et al., 2016). In this study, our data set consists of data from thermal infrared band 6 of the Landsat 5 TM sensor and data from thermal infrared band 10 of the Landsat 8 TIRS sensor. Based on previous work (Ling et al., 2017), we ultimately chose the simplified atmospheric correction because it is easy to implement and because acquiring the required parameter values is a fairly straightforward process (Sobrino et al., 2004).
2.3. The Relative Temperature
In order to improve the accuracy of our assessment of the temperature variations in the downstream rivers of each reservoir, we propose the concept of relative temperature on the basis of absolute temperature, and calculate the difference between the temperature of the downstream rivers and that of the reservoir, which we call the river relative temperature.
| (1) |
where k is the kth kilometer distance from the dam (k = 0, 1, 2, 3…), (°C) is the value of the downstream river relative temperature within the range of [k, k+1] from the dam, (°C) is the average value of the downstream river temperature within the range of [k, k+1] from the dam, and (°C) is the average value of the reservoir surface temperature in the study area.
Once we define the relative temperature, we can quantify the influence the reservoir has on the temperatures of the surrounding areas. We define the temperature difference (TD) as the difference between the temperature of the surrounding area and the temperature of the reservoir. Based on the Euclidean allocation method (Jiang et al., 2011), we calculated the TD (also known as the surrounding relative temperature) values for each grid point around the reservoir area:
| (2) |
where (°C) is the surrounding relative temperature value for each grid point, (°C) is the surface temperature of each grid point, and (°C) is the temperature of the reservoir centerline that is closest to that grid point.
2.4. The Downstream River Temperature Change (DRTC) Index
To quantify the downstream temperature changes and the extent to which the reservoir regulation effect influences the temperatures in the downstream river, we created the downstream river temperature change (DRTC) index:
| (3) |
where is the downstream river temperature change index within the range of [k, k+1] from the dam, k is the kth kilometer distance from the dam (k = 0, 1, 2, 3…), and and are the relative downstream river temperatures within the range of [k, k+1] from the dam before and after the hydropower station construction, respectively.
If the value of the index is greater than zero, then the downstream river temperature is increasing. Similarly, if the value of the index is less than zero, the downstream river temperature is decreasing.
2.5. The Reservoir Effect Change Intensity (RECI) Index
To analyze the warming and cooling regulation effects of the reservoir, we built on the work of D. Wang et al. (2018) to define the reservoir effect change intensity (RECI) index:
| (4) |
where RECI is the reservoir effect change intensity index and and respectively represent the relative temperatures of the surrounding areas before and after the hydropower station construction.
We then defined four possible warming and cooling scenarios with positive and negative TD and RECI values (Table 2). For example, scenario 1 assumes a river water temperature of 2°C before the dam is built and a surrounding area grid point temperature of 4°C (TD F = 2°C). After the dam is built, the reservoir water temperature is 2°C and the temperature of the same grid point in the surrounding area is 3°C (TD L = 1°C, RECI = −1°C), which indicates that the reservoir caused the temperature of that grid point to decrease. However, for another situation in scenario 1, where the values of TD F and TD L are both greater than zero, and RECI is also greater than or equal to zero, the warming effect is not clear enough to be recognized.
Table 2.
Four Possible Reservoir Temperature Regulation Effect Scenarios
| Scenario | TD F | TD L | RECI | Regulation effect |
|---|---|---|---|---|
| 1 | >0 | ≥0 | ≥0 | ― |
| <0 | ↓ | |||
| 2 | ≥0 | <0 | ≥0 | ― |
| <0 | ↓ | |||
| 3 | ≤0 | >0 | >0 | ↑ |
| ≤0 | ― | |||
| 4 | <0 | ≤0 | >0 | ↑ |
| ≤0 | ― |
Note. “―” represents no regulation effect, “↓” represents the cooling effect, and “↑” represents the warming effect. Bold values denotes the scenarios with temperature regulation effect.
In scenario 3, the river water temperature before the dam is built is 4°C and the temperature of a surrounding area grid point is 2°C (TD F = −2°C). After the dam is built, the reservoir water temperature is 4°C, and the temperature of that same grid point in the surrounding area is 3°C (TD L = −1°C, RECI = 1°C), which indicates that the reservoir imparts a warming effect on the surrounding grid point. However, for another situation in scenario 3, the values of TD F and RECI are either less than or equal to zero, and the value of TD L is greater than zero, which does not exist and is not recognized in this study. In addition, the principles of scenarios 2 and 4 are similar to those of scenarios 1 and 3.
3. Data
We used three types of data in this study: (a) the retrieved temperature data from the Landsat TM and Landsat TIRS images captured by the United States Geological Survey (http://www.usgs.gov/), (b) the watershed vector data extracted from the DEM data that is stored on the Geospatial Data Cloud website (http://www.gscloud.cn/, only available in Chinese.), and (c) the daily surface temperature data at an elevation of 0 cm recorded in the China Meteorological Data Network (http://data.cma.cn/en/?r=data/detail&dataCode=SURF_CLI_CHN_MUL_DAY_CES_V3.0). This last data set was used to validate the accuracy of the temperature values we retrieved from the Landsat images and to track the spatial and temporal temperature changes in our study area.
Based on the timing of the hydropower station construction, we analyzed remote sensing images that spanned from 2004 (before the hydropower station construction) to 2019 (after the hydropower station construction). We also calculated the annual average surface temperatures for each study area using meteorological data collected in 2003, 2004, 2005, 2017, 2018, and 2019 (Table 3) to avoid sampling extreme weather events. Because of the uneven distribution of the seasonal precipitation in the study area, there are distinct dry and wet seasons. In this study, we define May to October as the wet season and February to December as the dry season. However, because of certain climate differences, we define the period from June to July as the wet season in the cold‐dry valley. Due to image quality issues (i.e., too much cloud cover in a given study area), four images were replaced by images from the same month in the year immediately preceding or following the year in which the bad data occurred. At the same time, based on the daily surface temperature data from the meteorological stations, the difference between the average temperature of the replaced month in each study area and the average temperature of the month used in the corresponding previous or following year was calculated. The results showed that the difference between the two values for all the replacement months did not exceed 0.3°C, indicating that the replacement study was feasible (Table 4).
Table 3.
Average Annual Surface Temperatures at 0 cm in Each Study Area (Unit: °C)
| Year | Study area | ||
|---|---|---|---|
| Liyuan/Ahai | Jinghong | Laxiwa | |
| 2003 | 22.74 | 17.06 | 8.66 |
| 2004 | 22.09 | 16.47 | 8.78 |
| 2005 | 22.75 | 17.31 | 8.97 |
| 2017 | 22.20 | 16.72 | 9.65 |
| 2018 | 21.72 | 16.91 | 9.68 |
| 2019 | 23.35 | 18.12 | 8.88 |
Note. We used data from the same meteorological station for the Liyuan and Ahai stations.
Table 4.
Instances Where We Replaced Certain Remote Sensing Images
| Study area | Month replaced | Month adopted | Average temperature difference (°C) |
|---|---|---|---|
| Jinghong | 2004.12 | 2003.12 | 0.02 |
| 2019.10 | 2018.10 | 0.22 | |
| Laxiwa | 2004.06 | 2005.06 | 0.21 |
| Liyuan/Ahai | 2019.10 | 2018.10 | 0.02 |
Note. We used data from the same meteorological station for the Liyuan and Ahai stations.
4. Results
4.1. Temperature Retrieval Results
We used the atmospheric correction algorithm to retrieve the temperatures in each research area before and after the hydropower station construction. In this study, the inversion temperatures represent the surface temperatures of the reservoir, the areas surrounding the reservoir, and the downstream river. For a given season, we summed and averaged the temperature data from every month in that season. As shown in Figure 2, by calculating the average surface temperature in each study area, the results show that the surface temperature of each study area in 2019 was higher than it was in 2004. The spatial temperature patterns in both dry‐hot valley study areas are relatively similar, with higher temperatures in the valley floor region and progressively lower temperatures occurring at increasing distances from the river. However, for the non‐dry‐hot valley study areas, the temperature changes were closely related to the local climate. The wet‐hot valley was consistently warm and humid with relatively little annual temperature variation. Of the four study regions, the wet‐hot valley exhibited the smallest temperature difference between the dry season and the wet season. Due to its location in the Tibetan Plateau, which is characterized by severe winters, the temperature difference between the dry and wet seasons was the greatest in the cold‐dry valley.
Figure 2.
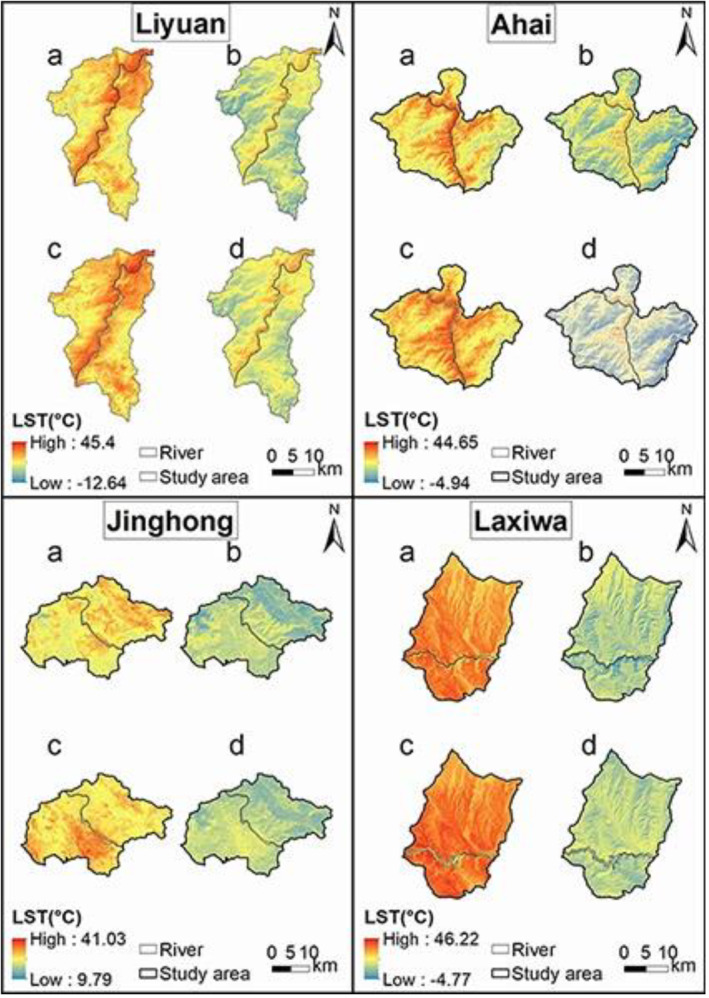
Surface temperatures in each study region in (a) the wet season before the dam construction, (b) the dry season before the dam construction, (c) the wet season after the dam construction, and (d) the dry season after the dam construction.
Due to the different geographical locations of the four study areas and the length of time spanned by the remote sensing images, it is difficult to obtain the measured surface temperature values that exactly correspond to the time at which the remote sensing images were taken. Therefore, in this study, we used the 0 cm daily surface temperature data from certain meteorological stations to verify the accuracy of our retrieved surface temperature data (H. Li et al., 2007). Using the 0 cm mean surface temperatures recorded at the Ninglang, Weixi, and Jinghong meteorological stations as a point of reference, we ensured the validity of the surface temperature inversion results for the Ahai, Liyuan, and Jinghong hydropower stations. As shown in Figure 3, the meteorological data and our calculated inversion results are similar to one another; the average temperature difference between these two data sets is 2.68°C. Due to the lack of site data for the Laxiwa study area, we were unable to verify the temperatures in this study area. However, because our remote sensing images yielded accurate surface temperatures for the other three hydropower stations, we assume that the temperatures reliably reproduce the temperatures observed at the fourth hydropower station.
Figure 3.
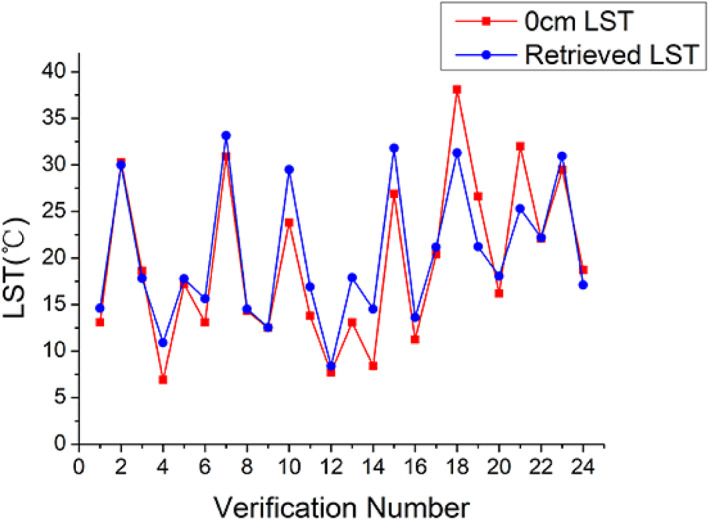
Comparison of the LST data retrieved from the remote sensing images and the 0 cm meteorological data LST data.
4.2. Analysis of the Temperature Changes and the Extent of the Reservoir Regulation Effect in the Downstream River
We calculate the temperature changes in the downstream river areas at different distances from the dam using Equation 3. If the DRTC value is greater than zero, the downstream river temperature is increasing; if the DRTC value is less than zero, the downstream river temperature is decreasing. However, if the overall temperature of the study exhibits a warming trend, we ignore any outlier points with negative DRTC values.
As shown in Figure 4, the temperature change index for the downstream rivers in the dry‐hot and humid‐hot valleys indicates that the surface temperatures of these rivers were all increasing. Moreover, the rising temperatures observed in the wet season were higher than those observed in the dry season. Indeed, the degree of warming varied depending on the season and the study area. For the Liyuan station, the temperature of the downstream river (i.e., within 20 km from the dam) increased in the wet season, but the DRTC index was less than zero within 10–16 km from the dam in the dry season. As such, the warming effect only extended to a distance of 9 km from the dam in the dry season. For the Ahai station, the downstream river temperature within 15 km of the dam increased during both seasons. In the humid‐hot valley, at distances less than 14 km from the Jinghong station dam, the temperatures of the downstream river increased in the wet season. In the dry season, the temperature decreased at distances less than 2 km from the dam, but this local cooling effect was not large enough to overcome the general warming trend that extended throughout the downstream river. The downstream river temperature variation in the cold‐dry valley was distinctly different from the temperature variations observed at the other three hydropower stations. At downstream distances of less than 9 km from the dam—the entire downstream region of the dam being the study area—the river temperature increased in the wet season and decreased in the dry season.
Figure 4.
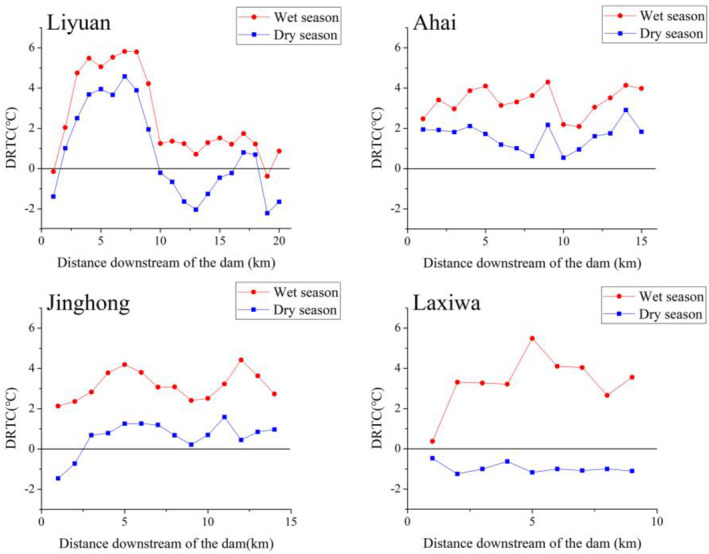
Variations in the downstream river temperature change index with distance from the dam in each of the four study areas.
4.3. Spatial Variations in the Reservoir Temperature Regulation Effect in the Areas Surrounding the Reservoir
In this study, our analysis of the scope of the reservoir temperature regulation effect on the surrounding area includes the head area of the reservoir and the area downstream from the dam. The size of the downstream area is obtained based on the elevation and the extent to which the reservoir regulation effect influences the downstream river temperatures.
The presence of the four reservoirs resulted in different degrees of warming and cooling of the temperatures in the areas surrounding the reservoirs during different time periods. As shown in Figure 5, two reservoirs in the dry‐hot valley produced similar temperature regulation effects on their surrounding areas; for both reservoirs, the warming effect was much more pronounced than the cooling effect. The cooled areas are relatively localized and are typically concentrated in the valley floor region and some lower altitude regions. Additionally, the intensity of the reservoir cooling effect was higher in the downstream area than it was in the head area of the reservoir. Furthermore, the cooling was more pronounced in the dry season than it was in the wet season. The warming effect, which was mostly observed in the mountains or in other high‐elevation areas, was more widespread than the localized instances of cooling. As shown in Figure 6, the temperature regulation effect in the two reservoirs in the non‐dry‐hot valleys caused the surface temperatures to decrease in the areas surrounding the reservoirs, especially in the dry season. In these study areas, cooling was much more pronounced in the downstream area than it was in the reservoir head area during the wet season. In the cold‐dry valley, the cooling effect in the wet season was confined to the downstream area. At both the Laxiwa and Jinghong stations, there were very few (or no) instances where the surface temperature increased. Overall, while there were some similarities in the reservoir temperature regulation effect on the surrounding areas in both the hot‐dry and non‐hot‐dry valleys, the differences were also very obvious. In the hot‐dry valley, the temperatures of the areas surrounding the reservoir mostly increased, while in the non‐hot‐dry valley, the temperatures of the areas surrounding the reservoir mostly decreased.
Figure 5.
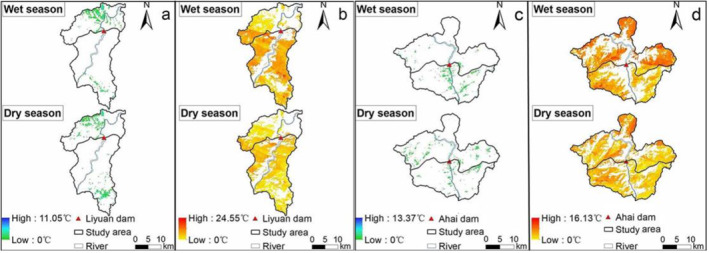
Spatial extent of the temperature regulation effect in the dry‐hot valley. (a) The cooling effect at the Liyuan station. (b) The warming effect at the Liyuan station. (c) The cooling effect at the Ahai station. (d) The warming effect at the Ahai station.
Figure 6.
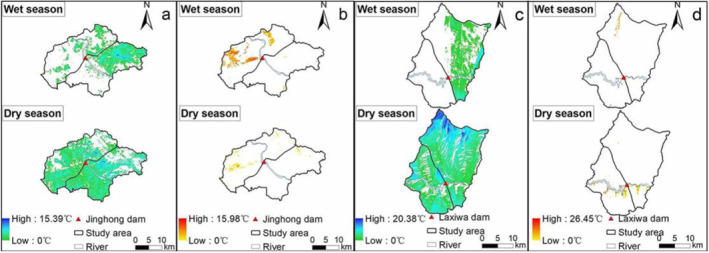
Spatial extent of the temperature regulation effect in non‐dry‐hot valleys. (a) The cooling effect at the Jinghong station. (b) The warming effect at the Jinghong station. (c) The cooling effect at the Laxiwa station. (d) The warming effect at the Laxiwa station.
5. Discussion
Clearly, the presence of a hydropower station has a significant impact on the downstream river temperature. Gathering temperature data for these downstream rivers can be done manually during field surveys or remotely by applying algorithms to Landsat series thermal infrared data. The latter method is more efficient than the manual data collection method in part because the remote sensing technique is not limited by accessibility issues that may arise during field surveys (Handcock et al., 2012). Furthermore, the remote sensing images provide information about the long‐term continuous water temperature at each point in those images. This data can be used to evaluate the temperature changes in large rivers (Ling et al., 2017).
The reservoirs have a smaller impact on downstream river temperatures in the dry season than in the wet season because the river runoff caused by reservoir impoundment decreases in the dry season (Gou et al., 2020; Z. Liu et al., 2018). Additionally, hydrological and meteorological factors also affect the downstream river temperature (Cai et al., 2018; Sun, Miao, AghaKouchak, et al., 2019). For example, we attribute the local cooling of the downstream river areas close to the Liyuan and Jinghong station dams to the fact that the impact of these hydrological and meteorological factors on the downstream river temperature is greater than that of the reservoir temperature regulation effect.
In dry‐hot valley and humid‐hot valley, because of the larger specific heat capacity of the water body, the temperature of downstream river is higher than that of reservoir in the wet season, then the temperature of downstream river increase compared with that before dam construction. And in the dry season when the reservoir is stored, its temperature is higher compared to the downstream river temperature, then the reservoir release causes the downstream river temperature to increase. Because the outlet of the Laxiwa station in the cold‐dry river valley is located in the middle and upper parts of the dam, the upper water layer of the reservoir is discharged downstream. In the dry season, the runoff decreases, and the duration of the reservoir storage period increases, which results in thermal stratification. However, some studies have shown that severe cold climates can cause thermal stratification phenomena with reversal of temperature gradients (F. Li et al., 2020). As such, the cooler water temperature of the upper layer of the reservoir at the Laxiwa station results in decreasing downstream river temperatures in the dry season.
The construction of a reservoir increases the surface area of the water body and causes seasonal changes in the surface temperatures of the surrounding areas. As we have demonstrated, the reservoir regulation effect is more prominent in the downstream area (Toffolon et al., 2010). In the dry‐hot valley, the warming and cooling effects existed simultaneously. The cooling effect was confined to the valley floor area, while the warming effect was observed in the high‐altitude regions. In general, the construction of a large hydropower station in a dry‐hot valley contributes to the decreasing and increasing temperatures observed in the valley floor and in high‐altitude areas, respectively (D. Wang et al., 2018). The cold‐dry valley was dominated by cooling temperatures, while the humid‐hot valley experienced widespread cooling with localized instances of warming. Furthermore, the cooling effect was more pronounced in the dry season than it was in the wet season. These observations are consistent with previous reports of the summer cooling effect (W. Y. Wang et al., 2012) and the water storage cooling effect (Zhang et al., 2019). Overall, the strength and extent of the reservoir regulation effect depend on the geographical location of and the climate conditions at the reservoir (Degu et al., 2011; Rastorguev & Roshchina, 1987; Xiong et al., 2020).
Our results indicate that the reservoir regulation effect varies depending on whether the area of interest lies in a dry‐hot valley or in a non‐dry‐hot valley. In the dry‐hot valley, the construction of a hydropower station could result in decreased temperatures in the valley floor area and increased temperatures in the mountains or in other high‐altitude areas. To some extent, the presence of the hydropower station regulates the climate of the dry‐hot valley and contributes to the improvement of the ecological environment in this area. In the non‐dry‐hot valleys, the large‐scale cooling observed in the wet season offsets the hotter temperatures that occur during the summer; furthermore, the warming effect also regulates the cooler climate conditions in the high‐altitude areas. However, the widespread cooling that occurs in the dry season ultimately contributes to an increased number of severe weather events. Specifically, the cooling observed in the dry season at the Laxiwa station exacerbates the severe cold climate conditions and negatively impacts the ecological environment (Gao et al., 2015). Therefore, the operation mode of the reservoir should be adjusted to account for local climate conditions. These operational changes should minimize the environmental damage that occurs at hydropower stations in non‐dry‐hot valleys during the dry season (Olden & Naiman, 2010; Xiao et al., 2020). Accounting for the local climatic conditions in the design and operation of these reservoirs will help to maintain the safety and stability of the ecological environment in these areas.
6. Conclusions
In this study, we retrieved LST data from Landsat remote sensing images and calculated the DRRT and TD values for four different study areas. We defined and quantified the DRTC and RECI indices to discuss the extent to which the reservoir temperature regulation effect affects the temperature of the downstream river and the surrounding area in both dry‐hot valleys and non‐dry‐hot valleys in different flood seasons. Our conclusions are as follows:
In both dry‐hot valleys and non‐dry‐hot valleys, the presence of the reservoir had a more pronounced effect on the downstream river temperature in the wet season than it does in the dry season. By contrast, the temperatures in the surrounding areas were more heavily influenced by the temperature regulation effect during the dry season.
Depending on the conditions in the study area, the amount of influence exerted by the reservoir on the downstream river temperature varies. In the dry‐hot and humid‐hot valleys, the presence of a reservoir generally resulted in a warmer downstream river temperature for the entire downstream river area. However, in the dry season at the Liyuan station, the warming effect only extended to a distance of 9 km from the dam. In the cold‐dry valley, the downstream river temperature decreased in the dry season and increased in the wet season throughout the downstream study area.
The impact of the reservoir temperature regulation effect varies in different regions. In the dry‐hot valley, there was widespread warming at higher altitudes and more localized cooling in the valley floor area. In the non‐dry‐hot valleys, the cooling effect was more widespread than warming. In the cold‐dry valley in particular, the cooling effect persisted year‐round.
Conflict of Interest
The authors declare no conflict of interest. The founding sponsors had no role in the design of the study; in the collection, analysis, or interpretation of data; in the writing of the manuscript; or in the decision to publish the results.
Acknowledgments
This research was supported by The Second Tibetan Plateau Scientific Expedition and Research (STEP) program (Grant No. 2019QZKK0608) and National Natural Science Foundation of China (Grant No 41971310). We thank LetPub (www.letpub.com) for its linguistic assistance during the preparation of this manuscript.
Wang, D. C. , Zhang, X. , Huang, Y. , Wang, X. , Zhang, W. , Cao, Z. J. , et al. (2021). Comparative study on temperature response of hydropower development in the dry‐hot valley. GeoHealth, 5, e2021GH000438. 10.1029/2021GH000438
Data Availability Statement
The meteorological temperature data for our study areas were downloaded from the China Meteorological Data Network (http://data.cma.cn/en/?r=data/detail&dataCode=SURF_CLI_CHN_MUL_DAY_CES229_V3.0). DEM data for the study areas were downloaded from the Geographic Spatial Data Cloud website (http://www.gscloud.cn/, only available in Chinese). LST retrieval was based on data provided by the National Aeronautics and Space Administration. The data that support the findings of this study are openly available in the figshare repository, http://doi.org/10.6084/m9.figshare.14350562.
References
- Cai, H. , Piccolroaz, S. , Huang, J. , Liu, Z. , Liu, F. , & Toffolon, M. (2018). Quantifying the impact of the Three Gorges Dam on the thermal dynamics of the Yangtze River. Environmental Research Letters, 13(5), 054016. 10.1088/1748-9326/aab9e0 [DOI] [Google Scholar]
- Deemer, B. R. , Harrison, J. A. , Li, S. , Beaulieu, J. J. , DelSontro, T. , Barros, N. , et al. (2016). Greenhouse gas emissions from reservoir water surfaces: A new global synthesis. BioScience, 66(11), 949–964. 10.1093/biosci/biw117 [DOI] [PMC free article] [PubMed] [Google Scholar]
- Degu, A. M. , Hossain, F. , Niyogi, D. , Pielke, R. , Shepherd, J. M. , Voisin, N. , & Chronis, T. (2011). The influence of large dams on surrounding climate and precipitation patterns. Geophysical Research Letters, 38(4). 10.1029/2010gl046482 [DOI] [Google Scholar]
- Du, C. , Ren, H. , Qin, Q. , Meng, J. , & Li, J. (2014). Split‐window algorithm for estimating land surface temperature from Landsat 8 TIRS data. IEEE Geoscience and Remote Sensing Symposium, 2014, 3578–3581. 10.1109/igarss.2014.6947256 [DOI] [Google Scholar]
- Duan, X. , Zhang, G. , Rong, L. , Fang, H. , He, D. , & Feng, D. (2015). Spatial distribution and environmental factors of catchment‐scale soil heavy metal contamination in the dry‐hot valley of Upper Red River in southwestern China. CATENA, 135, 59–69. 10.1016/j.catena.2015.07.006 [DOI] [Google Scholar]
- Endo, N. , & Eltahir, E. A. B. (2018). Environmental determinants of malaria transmission around the KokXa reservoir in Ethiopia. GeoHealth, 2(3), 104–115. 10.1002/2017gh00010 [DOI] [PMC free article] [PubMed] [Google Scholar]
- Fan, H. , He, D. , & Wang, H. (2015). Environmental consequences of damming the mainstream Lancang‐Mekong River: A review. Earth‐Science Reviews, 146, 77–91. 10.1016/j.earscirev.2015.03.007 [DOI] [Google Scholar]
- Gao, Y. , Liu, P. X. , Yao, Y. L. , Yong, G. Z. , & Wang, Y. (2015). Spatial‐temporal characteristics and factor analysis of the cold island effect in the Shihezi oasis based on remote sensing images. Journal of Natural Resources, 30, 1319–1331. 10.11849/zrzyxb.2015.08.007 [DOI] [Google Scholar]
- Gou, J. , Miao, C. , Duan, Q. , Tang, Q. , Di, Z. , Liao, W. , et al. (2020). Sensitivity analysis‐based automatic parameter calibration of the variable infiltration capacity (VIC) model for streamflow simulations over China. Water Resources Research, 56. 10.1029/2019wr025968 [DOI] [Google Scholar]
- Gou, J. , Miao, C. , Samaniego, L. , Xiao, M. , & Guo, X. (2021). Cnrd v1.0: A high‐quality natural runoff dataset for hydrological and climate studies in china. Bulletin of the American Meteorological Society, 102, 1–57. 10.1175/BAMS-D-20-0094.1 [DOI] [Google Scholar]
- Greenfield, D. I. , Gooch Moore, J. , Stewart, J. R. , Hilborn, E. D. , George, B. J. , Li, Q. , et al. (2017). Temporal and environmental factors driving Vibrio Vulnificus and V. Parahaemolyticus populations and their associations with harmful algal blooms in South Carolina detention ponds and receiving tidal creeks. GeoHealth, 1(9), 306–317. 10.1002/2017gh000094 [DOI] [PMC free article] [PubMed] [Google Scholar]
- Gu, Z. , Duan, X. , Liu, B. , Hu, J. , & He, J. (2016). The spatial distribution and temporal variation of rainfall erosivity in the Yunnan Plateau, Southwest China: 1960–2012. CATENA, 145, 291–300. 10.1016/j.catena.2016.06.028 [DOI] [Google Scholar]
- Handcock, R. N. , Torgersen, C. E. , Cherkauer, K. A. , Gillespie, A. R. , Tockner, K. , Faux, R. N. , & Tan, J. (2012). Thermal infrared remote sensing of water temperature in riverine landscapes. Fluvial Remote Sensing for Science and Management, 1, 85–113. 10.1002/9781119940791.ch5 [DOI] [Google Scholar]
- Hu, X. , Huang, Q. , & Jin, L. (2017). The litter and its soil hydrological function of tropical mountain rain forest in Xishuangbanna. Chinese Journal of Applied Ecology, 28(1), 55–63. 10.13287/j.1001-9332.201701.018 [DOI] [PubMed] [Google Scholar]
- Huan‐cheng, M. , & McConchie, J. A. (2001). The dry‐hot valleys and forestation in southwest China. Journal of Forestry Research, 12(1), 35–39. 10.1007/bf02856797 [DOI] [Google Scholar]
- Ji, Z. , Fang, H. , Yang, Y. , Pan, Z. , & Sha, Y. (2009). Evaluation of the ecological function of vegetation restoration in the degraded ecosystem of the dry‐hot valley of the Jinsha River—Taking the typical model of Yuanmou small watershed as an example. Journal of Ecological Environment, 18(04), 1383–1389. 10.16258/j.cnki.1674-5906.2009.04.040 [DOI] [Google Scholar]
- Jiang, L. , Yang, X. , & Tang, G. (2011). Research on extraction method of surface river axis based on Euclidean region allocation. Surveying and Mapping bulletin, 9(8), 21–24. [Google Scholar]
- Kong, D. , Miao, C. , Borthwick, A. G. L. , Duan, Q. , Liu, H. , Sun, Q. , et al. (2015). Evolution of the Yellow River Delta and its relationship with runoff and sediment load from 1983 to 2011. Journal of Hydrology, 520, 157–167. 10.1016/j.jhydrol.2014.09.038 [DOI] [Google Scholar]
- Kuang, W. (2020). 70 years of urban expansion across China: Trajectory, pattern, and national policies. Science Bulletin, 65(23), 1970–1974. 10.1016/j.scib.2020.07.005 [DOI] [PubMed] [Google Scholar]
- Kuang, W. , Du, G. , Lu, D. , Deng, Y. , Li, X. , Zhang, S. , et al. (2020). Global observation of urban expansion and land‐cover dynamics using satellite big‐data. Science Bulletin, 66(4), 297–300. 10.1016/j.scib.2020.10.022 [DOI] [PubMed] [Google Scholar]
- Li, F. , Jiang, X. , & Cui, C. (2020). Thermal structure and response on local climate and hydrological changes in a reservoir with an icebound season. Journal of Hydro‐Environment Research, 31, 48–61. 10.1016/j.jher.2020.05.001 [DOI] [Google Scholar]
- Li, H. , Zeng, Y. , Fu, P. , Huang, J. , Yang, K. , & Zou, J. (2007). Inversion of urban surface temperature using multi‐source remote sensing data. Journal of Remote Sensing, 6, 891–898. [Google Scholar]
- Li, Y. , Zhao, M. , Motesharrei, S. , Mu, Q. , Kalnay, E. , & Li, S. (2015). Local cooling and warming effects of forests based on satellite observations. Nature Communications, 6(1), 1–8. 10.1038/ncomms7603 [DOI] [PMC free article] [PubMed] [Google Scholar]
- Ling, F. , Foody, G. , Du, H. , Ban, X. , Li, X. , Zhang, Y. , & Du, Y. (2017). Monitoring Thermal Pollution in Rivers Downstream of Dams with Landsat ETM+ Thermal Infrared Images. Remote Sensing, 9(11), 1175. 10.3390/rs9111175 [DOI] [Google Scholar]
- Liu, F. , Li, K. , Sun, Y. , Tang, G. , & Zhang, C. (2010). Climate of dry and hot valley in Hengduan Mountains and its influence on vegetation restoration. Resources and Environment in the Yangtze River Basin, 19(12), 1386–1391. [Google Scholar]
- Liu, Y. , Xuan, C. , & Quan, W. (2013). Analysis of thermal environmental effects of land surface water bodies in Beijing based on satellite data. Journal of Lake Science, 25(001), 73–81. [Google Scholar]
- Liu, Z. , Chen, X. , Liu, F. , Lin, K. , He, Y. , & Cai, H. (2018). Joint dependence between river water temperature, air temperature, and discharge in the Yangtze River: The role of the Three Gorges Dam. Journal of Geophysical Research: Atmospheres, 123(21), 11–938. 10.1029/2018jd029078 [DOI] [Google Scholar]
- Miao, C. , Duan, Q. , Sun, Q. , Lei, X. , & Li, H. (2018). Non‐uniform changes in different categories of precipitation intensity across China and the associated large‐scale circulations. Environmental Research Letters, 14(2), 025004. 10.1088/1748-9326/aaf306 [DOI] [Google Scholar]
- Olden, J. D. , & Naiman, R. J. (2010). Incorporating thermal regimes into environmental flows assessments: Modifying dam operations to restore freshwater ecosystem integrity. Freshwater Biology, 55(1), 86–107. 10.1111/j.1365-2427.2009.02179.x [DOI] [Google Scholar]
- Peng, S.‐S. , Piao, S. , Zeng, Z. , Ciais, P. , Zhou, L. , Li, L. Z. X. , et al. (2014). Afforestation in China cools local land surface temperature. Proceedings of the National Academy of Sciences, 111(8), 2915–2919. 10.1073/pnas.1315126111 [DOI] [PMC free article] [PubMed] [Google Scholar]
- Qin, Z. , Karnieli, A. , & Berliner, P. (2001). A mono‐window algorithm for retrieving land surface temperature from Landsat TM data and its application to the Israel‐Egypt border region. International Journal of Remote Sensing, 22(18), 3719–3746. 10.1080/01431160010006971 [DOI] [Google Scholar]
- Rastorguev, V. I. , & Roshchina, I. M. (1987). Consideration of changes in the local climate in the region of the reservoir and lower pool of hydroelectric stations. Hydrotechnical Construction, 21(10), 580–583. 10.1007/bf01423925 [DOI] [Google Scholar]
- Sobrino, J. A. , Jiménez‐Muñoz, J. C. , & Paolini, L. (2004). Land surface temperature retrieval from LANDSAT TM 5. Remote Sensing of Environment, 90(4), 434–440. 10.1016/j.rse.2004.02.003 [DOI] [Google Scholar]
- Sobrino, J. A. , Li, Z. L. , Stoll, M. P. , & Becker, F. (1996). Multi‐channel and multi‐angle algorithms for estimating sea and land surface temperature with ATSR data. International Journal of Remote Sensing, 17(11), 2089–2114. 10.1080/01431169608948760 [DOI] [Google Scholar]
- Song, Z. , Liang, S. , Feng, L. , He, T. , Song, X.‐P. , & Zhang, L. (2017). Temperature changes in Three Gorges Reservoir Area and linkage with Three Gorges Project. Journal of Geophysical Research: Atmospheres, 122(9), 4866–4879. 10.1002/2016jd025978 [DOI] [Google Scholar]
- Sui, X. , & Yang, Z. (2005). Analysis on the change trend of the climate effect of Longyangxia Reservoir in the east of Qinghai‐Tibet Plateau. Journal of Mountain Research, 03, 280–287. 10.16089/j.cnki.1008-2786.2005.03.005 [DOI] [Google Scholar]
- Sun, Q. , Miao, C. , AghaKouchak, A. , Mallakpour, I. , Ji, D. , & Duan, Q. (2019). Possible increased frequency of ENSO‐related dry and wet conditions over some major watersheds in a warming climate. Bulletin of the American Meteorological Society, 101(4), E409–E426. 10.1175/bams-d-18-0258.1 [DOI] [Google Scholar]
- Sun, Q. , Miao, C. , Hanel, M. , Borthwick, A. G. L. , Duan, Q. , Ji, D. , & Li, H. (2019). Global heat stress on health, wildfires, and agricultural crops under different levels of climate warming. Environment International, 128, 125–136. 10.1016/j.envint.2019.04.025 [DOI] [PubMed] [Google Scholar]
- Tashlykova, T. A. (2013). Changes in local climate in the neighbourhood of the Ust‐Ilimsk water reservoir on the Angara, Russia. Environmental & Socio‐Economic Studies, 1(1), 9–16. 10.1515/environ-2015-0002 [DOI] [Google Scholar]
- Toffolon, M. , Siviglia, A. , & Zolezzi, G. (2010). Thermal wave dynamics in rivers affected by hydropeaking. Water Resources Research, 46(8), W08536. 10.1029/2009wr008234 [DOI] [Google Scholar]
- Vatland, S. J. , Gresswell, R. E. , & Poole, G. C. (2015). Quantifying stream thermal regimes at multiple scales: Combining thermal infrared imagery and stationary stream temperature data in a novel modeling framework. Water Resources Research, 51(1), 31–46. 10.1002/2014wr015588 [DOI] [Google Scholar]
- Wang, D. , Wang, F. , Huang, Y. , Duan, X. , Liu, J. , Hu, B. , et al. (2018). Examining the effects of hydropower station construction on the surface temperature of the Jinsha River dry‐hot valley at different seasons. Remote Sensing, 10(4), 600. 10.3390/rs10040600 [DOI] [Google Scholar]
- Wang, D. C. , Liu, J. Y. , Huang, Y. , Duan, X. W. , Wang, X. , Zhang, X. , et al. (2020). Quantifying the effect of Xiluodu reservoir on the temperature of the surrounding mountains. GeoHealth, 4(5). 10.1029/2019gh000242 [DOI] [PMC free article] [PubMed] [Google Scholar]
- Wang, W. Y. , Liu, W. , & Ma, X. J. (2012). Analysis for influence upon local climate factors of reservoir area of hydropower station after water storage. Applied Mechanics and Materials, 212–213, 245–252. 10.4028/www.scientific.net/amm.212-213.245 [DOI] [Google Scholar]
- Wu, Z. G. , Jiang, T. , Fan, Y. L. , & Chen, L. J. (2016). Land Surface temperature retrieval and result analysis based on Landsat 8 data in Wuhan City. Chinese Journal of Engineering Geophysics, 13, 135–142. 10.3969/j.issn.1672-7940.2016.01.023 [DOI] [Google Scholar]
- Xiao, Y. , Xiao, Q. , Xiong, Q. , & Yang, Z. (2020). Effects of ecological restoration measures on soil erosion risk in the Three Gorges Reservoir area since the 1980s. GeoHealth, 4(12). 10.1029/2020GH000274 [DOI] [PMC free article] [PubMed] [Google Scholar]
- Xiong, Y. J. , Yin, J. , Paw U, K. T. , Zhao, S. H. , Qiu, G. Y. , & Liu, Z. (2020). How the three Gorges Dam affects the hydrological cycle in the mid‐lower Yangtze River: A perspective based on decadal water temperature changes. Environmental Research Letters, 15(1), 014002. 10.1088/1748-9326/ab5d9a [DOI] [Google Scholar]
- Xu, Y. (2010). Comparative linguistics (2nd ed.). Shanghai Foreign Language Education Press. [Google Scholar]
- Yang, J. , Gong, P. , Fu, R. , Zhang, M. , Chen, J. , Liang, S. , et al. (2013). The role of satellite remote sensing in climate change studies. Nature Climate Change, 3(10), 875–883. 10.1038/nclimate1908 [DOI] [Google Scholar]
- Yang, L. (2019). Contrasting methane emissions from upstream and downstream rivers and their associated subtropical reservoir in eastern China. Scientific Reports, 9(1), 1–10. 10.1038/s41598-019-44470-2 [DOI] [PMC free article] [PubMed] [Google Scholar]
- Zhang, J. , Liu, J. , Xiao, W. , & Wang, H. (2019). Analysis on the change trend of climate elements in the Three Gorges Reservoir area after the impoundment. Yangtze River, 50(03), 113–116. [Google Scholar]
- Zhao, Q. , Liu, S. , Deng, L. , Dong, S. , Yang, Z. , & Liu, Q. (2013). Determining the influencing distance of dam construction and reservoir impoundment on land use: A case study of Manwan Dam, Lancang River. Ecological Engineering, 53, 235–242. 10.1016/j.ecoleng.2012.12.050 [DOI] [Google Scholar]
- Zheng, H. , Miao, C. , Wu, J. , Lei, X. , Liao, W. , & Li, H. (2019). Temporal and spatial variations in water discharge and sediment load on the Loess Plateau, China: A high‐density study. The Science of the Total Environment, 666, 875–886. 10.1016/j.scitotenv.2019.02.246 [DOI] [PubMed] [Google Scholar]
Associated Data
This section collects any data citations, data availability statements, or supplementary materials included in this article.
Data Availability Statement
The meteorological temperature data for our study areas were downloaded from the China Meteorological Data Network (http://data.cma.cn/en/?r=data/detail&dataCode=SURF_CLI_CHN_MUL_DAY_CES229_V3.0). DEM data for the study areas were downloaded from the Geographic Spatial Data Cloud website (http://www.gscloud.cn/, only available in Chinese). LST retrieval was based on data provided by the National Aeronautics and Space Administration. The data that support the findings of this study are openly available in the figshare repository, http://doi.org/10.6084/m9.figshare.14350562.