Abstract
Bioceramic calcium phosphorus (CaP) coatings were prepared on self-designed Mg–xZn–0.6Ca (x = 3.0, 4.5, 6.0 wt. %) alloy by microarc oxidation (MAO). The corrosion resistance, bioactivity, and biodegradability of the CaP coatings prepared on alloys with different zinc (Zn) contents were systematically studied and discussed by potentiodynamic polarization and in vitro immersion tests in the simulated body fluid solution. The CaP coatings and corrosion products were characterized by scanning electron microscopy, energy dispersive spectrometry, x-ray diffraction, and Fourier transform infrared spectroscopy. Based on the difference of microstructure caused by zinc content, the effect of microstructure on the properties of MAO coatings was analyzed by taking grain boundary and second phase defects as examples. Results showed that the CaP coatings could be prepared on the surface of the self-designed Mg–Zn–0.6Ca alloy by MAO. The CaP coatings have good bioactivity. Meanwhile, the Zn content has a significant effect on the microstructure of the CaP coatings. When the Zn content is 3.0 wt. %, the corrosion resistance and biocompatibility of the CaP coatings are obviously improved with good biological properties.
I. INTRODUCTION
Since 1990s, the research focusing on biomedical metal-based implant materials has been shifted from biostable materials to biodegradable materials.1,2 After biodegradable implants were implanted into organisms, the integrity of the implants would be maintained during the growth and healing processes of the lesion or defect tissues. The role of self-bone guidance and bone induction would also be exerted. With further growth of tissue, the implant materials gradually degraded, the degradation products were absorbed and consumed by the body, and then metabolized out of the body, and finally, completely replaced by new tissues. The ideal biodegradable bone repair materials should have appropriate mechanical properties, degradation rate, good biocompatibility, and bioactivity that should be well matched with the natural bone tissue.3 Magnesium and its alloys are the most potential biodegradable implants, which have better properties than stainless steel, titanium alloys, and other metal materials. The biodegradability, mechanical strength, and elastic modulus well matched with that of human bone tissues and they are the most attractive properties of magnesium and its alloys.4–6 Moreover, from a physiological point of view, magnesium is beneficial to the human body. The existence of magnesium is beneficial for the formation of biological bonelike apatite, the growth of bone tissues, and the improvement of bone strength.7 However, the rapid degradation rate of magnesium alloys reduces the mechanical integrity of implants prematurely and leads to unphysiological pH and hydrogen evolution.8,9 The factors affecting the degradation of magnesium alloys include alloy phase composition and distribution, surface morphology, microstructure and composition, the composition of surrounding corrosion medium, and so on.10
Among biodegradable magnesium alloys for biomedical applications, elemental alloying is an effective way to improve corrosion resistance and mechanical properties.9,11,12 The selection of alloying elements must be carefully done. Generally speaking, most heavy metal elements are harmful, so magnesium alloys containing heavy metal elements cannot be used to prepare biodegradable implant materials. Aluminum (Al) is a commonly used alloying element in magnesium alloys, but it is considered harmful to the human body. Studies have shown that Al3+ ions are easily bound to inorganic phosphate in the physiological environment of the organism, which leads to the lack of phosphate in the organism, thereby inducing Alzheimer’s disease.13 It has also been reported that the Al element is neurotoxic and that magnesium alloys containing the Al element can produce moderate rejection in in vivo physiological tests. Witte et al.14 pointed out that commercial magnesium alloys such as Mg–Al series could only be used as test carriers for surface coating and in vivo biological evaluation temporarily before commercial biological magnesium alloys were introduced and they could not be implanted into the human body. Many alloying elements, such as silicon (Si), calcium (Ca), zinc (Zn), manganese (Mn), zirconium (Zr), and a small amount of low toxicity rare earth (RE) elements, are potential candidate elements for the development of the magnesium alloys used as implant biodegradable materials. Taking biocompatibility into consideration, among all these alloying elements, Ca and Zn are commonly selected as alloying elements for Mg alloys. The Ca element can improve the corrosion resistance and mechanical stability of Mg alloys in the NaCl solution. It is not only necessary for organisms but also the main component of the human skeleton. In addition, the formation of the calcium phosphate (CaP) phase during the degradation process provides a more suitable local environment for bone mineralization.15 It has been reported that the suitable content of calcium in implant Mg alloys medical materials was about 0.5–0.8 wt. %.16 The addition of the Zn element is beneficial to obtain biomagnesium alloys with better comprehensive properties. Kubásek et al.17 studied the role of Zn in Mg–Zn alloys, and they found that zinc improved the corrosion resistance of binary Mg–Zn alloys compared with pure Mg. Xu et al.18 found that the Zn and Mn elements distributed homogeneously in the residual Mg–Mn–Zn implant, the degradation layer, and the surrounding bone tissue after 18 weeks implantation. Results indicated that Zn and Mn elements were easily absorbed in bio-environment. However, the corrosion resistance of bare magnesium alloys still cannot meet the needs of clinical application. Numerous investigations have shown that the corrosion resistance and biocompatibility of magnesium alloys can be improved by surface modification. Among a variety of surface modification methods, microarc oxidation (MAO) becomes the most advantageous surface treatment method for the potential biomedical magnesium alloys relying on easy operation, nonpollution and controllable composition, and microstructure. The ceramic CaP coatings with a porous outer layer, strong internal adhesion, corrosion resistance, biocompatibility, and bioactivity can be prepared on the surface of the magnesium alloy by MAO treatment.10,19–22
Thus far, there are few reports focusing on the effect of different Zn contents on the bioactivity and biodegradability of MAO coatings prepared on the Mg–Zn–Ca alloy. In this paper, bioactive ceramic coatings containing Ca and P elements were prepared on the Mg–Zn–Ca alloy by the MAO treatment. The corrosion properties of the CaP coatings were evaluated by electrochemical and in vitro immersion tests in the simulated body fluid (SBF) solution. The microstructures of the CaP coatings before and after corrosion were observed by scanning electron microscopy (SEM). The phase and element compositions of the CaP coatings before and after corrosion were characterized by x-ray diffractometer (XRD), energy-disperse spectrometer (EDS), and Fourier transform infrared spectrometer (FT-IR). The effect of different Zn contents on the microstructure, corrosion behavior, and apatite formation of Mg–xZn–Ca alloys and MAO coatings were discussed.
II. EXPERIMENTAL METHODS
A. Substrate alloy and MAO treatment
The Mg–Zn–Ca alloy was cast as the substrate alloys. The Ca contents were designed to be 0.6 wt. %, and the Zn contents were designed to be 3.0, 4.5, and 6.0 wt. %. The samples were referred to as ZC1, ZC2, and ZC3, respectively. The Mg–Zn–Ca alloy was machined into the samples with a cuboidal shape of 8 × 8 × 6 mm3. All the samples were progressively ground with the SiC paper from 80 to 1000 grit, washed with distilled water, and then dried in a drying oven.
The electrolyte for the preparation of MAO coating was prepared from a solution containing 2.852 45 g/l (C6H5O7)2Ca3 ⋅ 4H2O, 1.90065 g/l Na3PO4, 5.0 g/l KOH, 7.0 g/l NH4HF2, 5.0 ml/l C3H8O3, 5.0 ml/l N(CH2CH2OH)3, and 7.5 ml/l H2O2 in distilled water. All drugs used were of analytical grade. Prior to the coating preparation, each sample was polished with up to 1000 grit silicon carbide sandpaper, cleaned, washed in acetone, absolute ethanol, and de-ionized water, respectively, and then dried in air. The MAO treatment device consists of a pulse power supply unit, a stirring and a cooling circulating system, and a stainless-steel container that served as the cathode. The specimens served as the anode. The applied positive voltage was 450 V, while the negative voltage was 0 V. The pulse frequency, positive duty ratio, negative duty ratio, ratio of positive and negative pulses, and oxidizing time were set to be 600 Hz, 30%, 20%, 1:1, and 10 min, respectively. The electrolyte temperature was kept below 30 °C. After treatment, the samples were washed with distilled water and dried in a drying oven.
B. Microstructural and phase characterization
The optical microscope (Leica MeF3A, Germany) was used to characterize the metallurgical structures of the Mg–xZn–Ca alloy. The phase composition of the samples was analyzed by XRD (Shimadzu XRD-6100, Japan) using Cu-Kα radiation with a continuous scanning mode at a rate of 4° min−1. A field emission SEM (FEI Sirion200, FEI Co., USA) was used to observe the surface and cross-sectional morphologies. In addition, the elemental concentrations of the samples after the SBF soaking test were detected by an EDS equipped on the SEM system. FT-IR (Bruker Tensor-37, Germany) was used to study the functional groups of MAO coatings before and after the immersion test. The FT-IR experiment was carried out in the scanning range of 4000–400 cm−1 at a resolution of 4 cm−1.
C. In vitro degradation tests
The in vitro degradation of all MAO treated samples were evaluated by the immersion test in the SBF solution, which was similar in composition and concentration of the inorganic fraction of the human plasma, proposed by Kokubo.23 The SBF solution (1 l) was prepared by dissolving the reagents in the following content and order: 7.996 g NaCl, 0.350 g NaHCO3, 0.224 g KCl, 0.228 g K2HPO4 ⋅ 3H2O, 0.305 g MgCl2 ⋅ 6H2O, 40 ml HCl (1 mol/l), 0.278 g CaCl2, and 0.071 g Na2SO4. pH was adjusted to 7.25 with Tris ((CH2OH)3CNH2) and HCl. The temperature of SBF was controlled at about 36.5 ± 0.5 °C and soaked in a constant temperature water bath. Triplicate samples were used during the soaking process. The ratio of the surface plane area to the solution volume was 0.08 cm2/ml. The SBF solution was renewed every other day and kept colorless and deposit-free. Samples were collected from the solution after 6, 12, and 18 days immersion, respectively, cleaned in a chromic solution (200 g/l CrO3 + 10 g/l AgNO3) to remove the corrosion products, then washed with distilled water, and dried in a drying oven. The weight loss of samples and the pH value of solutions were monitored during the immersion test.
D. Electrochemical corrosion tests
Potentiodynamic polarization experiments were performed on the electrochemical workstation (CHI 660E, Shanghai Chenhua Co., China). The typical three-electrode cell measurements were carried out in a 300 ml beaker at 36.5 ± 0.5 °C. A saturated calomel electrode (SCE) was used as a reference electrode, while a platinum wire was used as the counter electrode. The MAO treated sample immersed in the SBF solution with a specific surface area of 0.64 cm2 was used as working electrode.
III. RESULTS
A. Microstructure and elemental composition
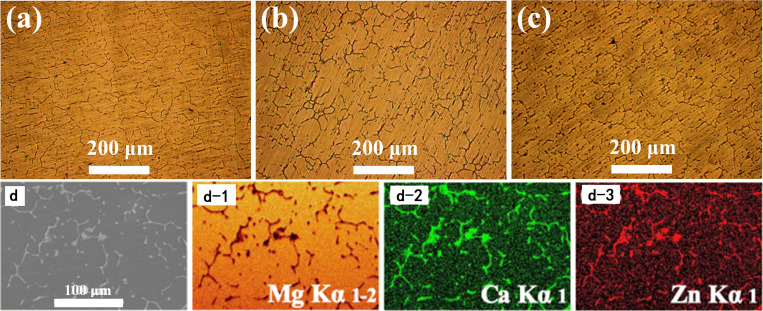
The optical microstructure and elemental mapping of the Mg–Zn–0.6Ca alloy are shown in Fig. 1. As is shown in Fig. 1(a)–1(c), with the increase of the Zn content in the Mg–Zn–0.6Ca alloy, the grain size of the alloys shows a downward trend, indicating that the Zn content in the range of 3.0–6.0 wt. % can refine the grain size of the Mg–Zn–0.6Ca alloy. Meanwhile, the grain boundaries become coarser and the precipitation of the second phase at the grain boundaries increases gradually. As is shown in Fig. 1(d), the Ca and Zn elements are enriched at grain boundaries.
FIG. 1.
Optical microstructure and elemental mapping of Mg–Zn–0.6Ca alloy: (a) ZC1; (b) ZC2; (c) ZC3; and (d) elemental mapping of ZC3.
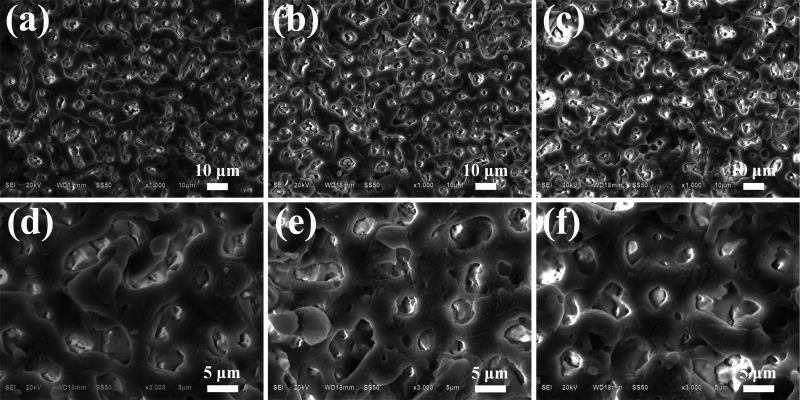
The SEM images of the MAO coated samples are shown in Fig. 2. As can be seen from Fig. 2, micropores with different sizes and homogeneous distribution are observed on the surface of the MAO coatings. There are no microcracks on the coating surfaces. However, compared with the sample ZC2 and ZC3, when the Zn content is 3.0 wt. % (ZC1), the micropore diameter of the MAO coatings is the smallest, the depth is the shallowest, the gap between micropores is the smallest, and the microsurface is the smoothest.
FIG. 2.
SEM images of the MAO coated samples: (a) and (d) Mg–3.0Zn–0.6Ca; (b) and (e) Mg–4.5Zn–0.6Ca; (c) and (f) Mg–6.0Zn–0.6Ca.
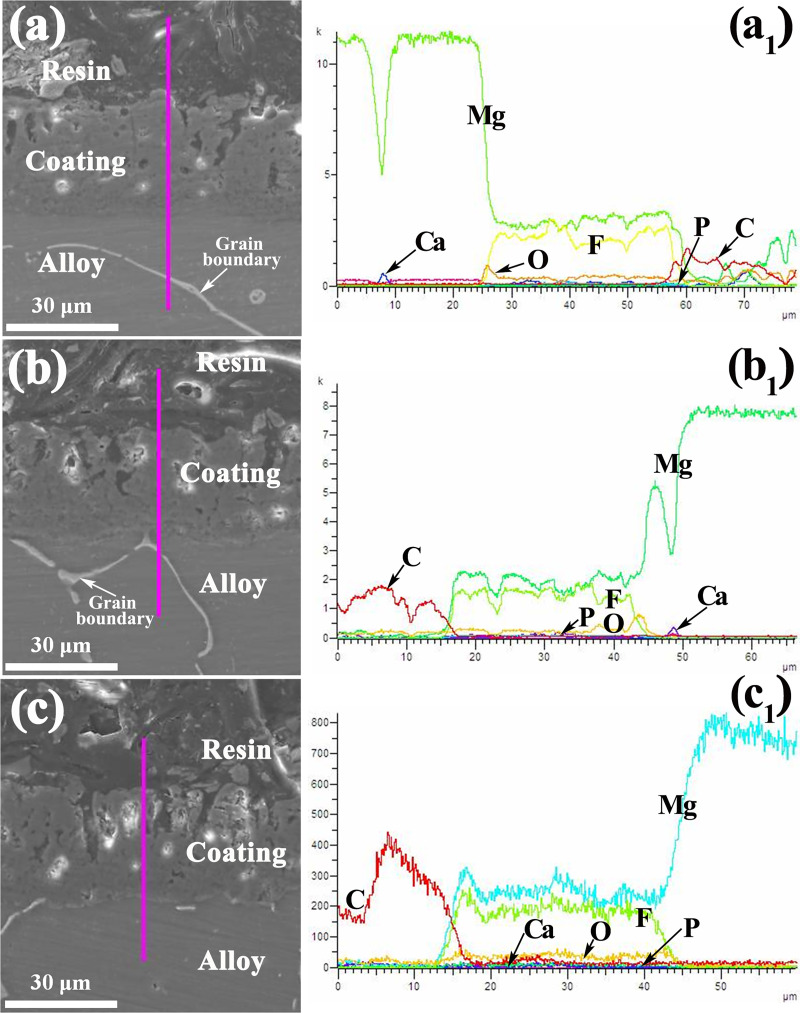
Figure 3 shows the cross-sectional morphology and linear composition of the MAO coatings. From the cross-sectional images in Fig. 3, it can be seen that there is no obvious discontinuity in the bonding zone between the substrate and coating interface in spite of different Zn contents. The thickness of the coatings is about 35 μm. The coating can be divided into three parts. The outer layer is loose, porous, and thicker. The inner layer is dense, nonporous, and thinner. The middle one is the transition layer. It can be seen from the linear composition of elements that the coatings are mainly composed of Mg, F, O, Ca, and P elements. However, the content of Ca and P in the coating is low. With the increase of the Zn content, through microholes and microcracks appeared in the MAO coatings, the bond between the coating and the substrate becomes loose. Meanwhile, when the Zn content is 6.0 wt. % (sample ZC3), it can be seen that the depth of the micropores becomes larger and deeper. It is consistent with the results described in Fig. 2.
FIG. 3.
Cross section (a)–(c) morphology and linear composition (a1, b1, c1) of the MAO coatings: (a) ZC1; (b) ZC2; and (c) ZC3.
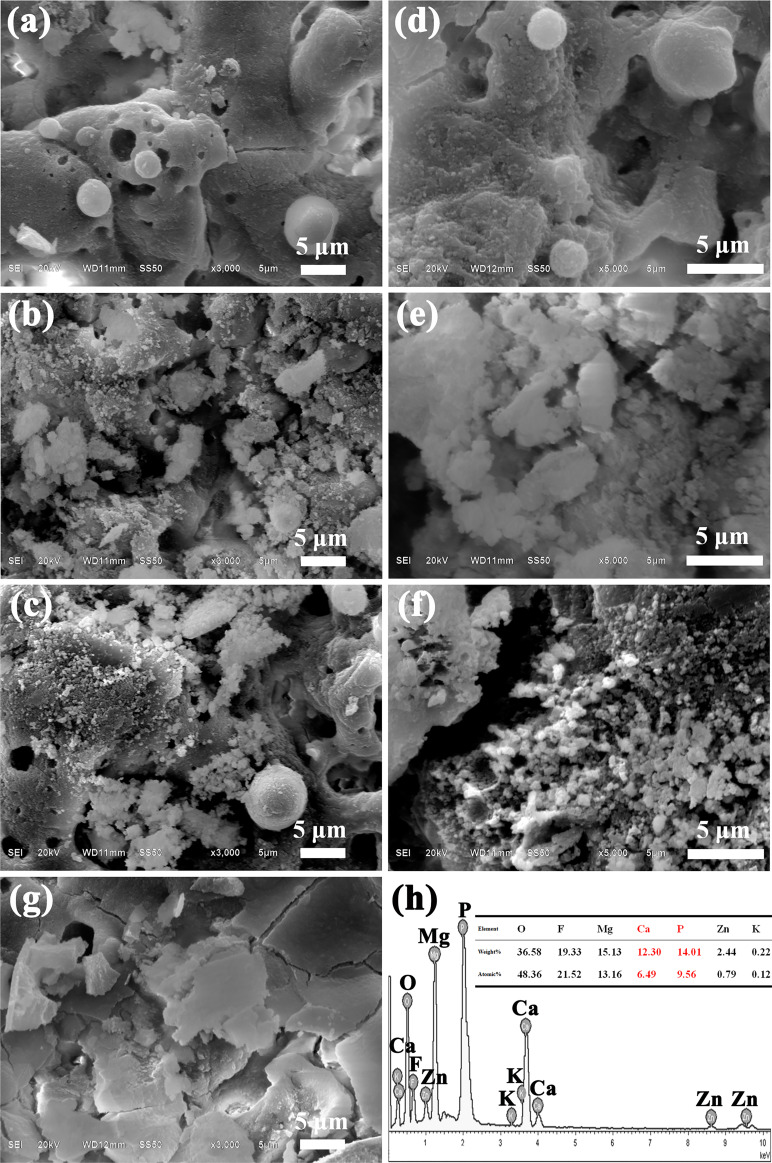
Figure 4 shows the surface corrosion morphology and element composition of the MAO coated samples after soaking in the SBF solution for 18 days. As is shown in Fig. 4, the porous surface morphology of the MAO coatings is invisible, and the coating surface is covered by numerous spherical and blocky particles after 18 days SBF immersion. However, with the increase of the Zn content, the content of corrosion products on the surface of the samples increases, the particle size of the corrosion products on the coating surface becomes smaller, the corrosion becomes more severe. According to the EDS analysis in Fig. 4(h), these particles are composed of O, F, Mg, Ca, P, Zn, and K elements.
FIG. 4.
Surface corrosion morphology and element composition (h) of the MAO coated samples after soaking in the SBF solution for 18 days: (a), (d), (g), and (h) ZC1; (b) and (e) ZC2; (c) and (f) ZC3.
B. Phase analysis
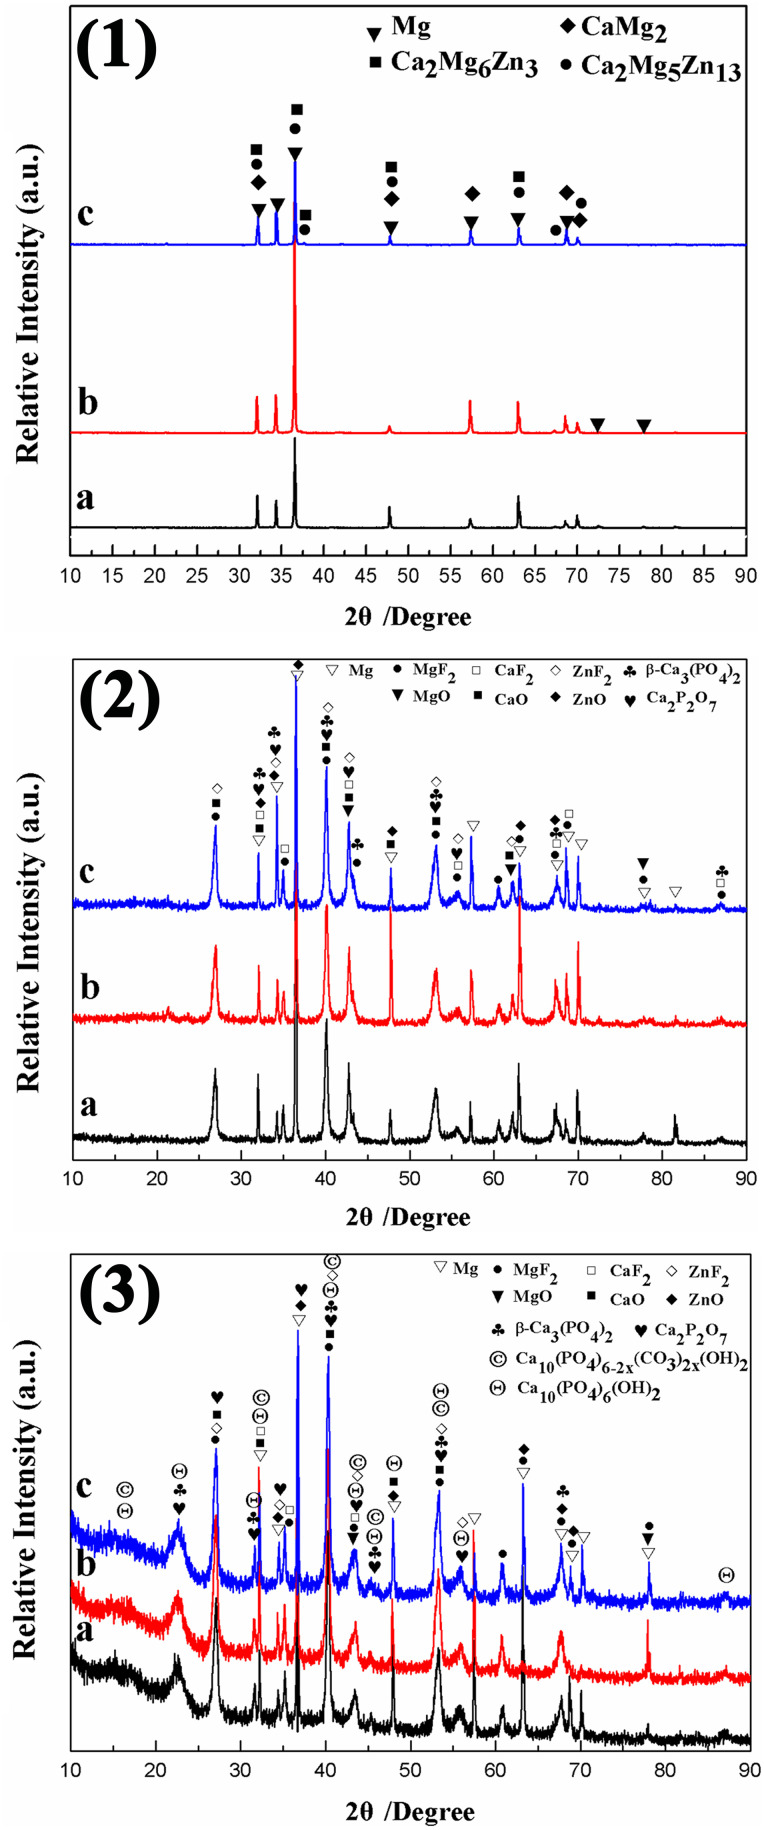
The XRD patterns of MAO coating before and after 18 days immersion in the SBF solution are shown in Fig. 5. From Fig. 5(1), it can be observed that in the bare Mg–Zn–0.6Ca alloy, Mg, CaMg2, Ca2Mg6Zn3, and Ca2Mg5Zn13 phases are detected in spite of different Zn contents. From Fig. 5(2), it can be observed that the MAO coating before immersion is mainly composed of MgO, CaO, ZnO, MgF2, CaF2, ZnF2, β-Ca3(PO4)2 (tricalcium phosphatein, β-TCP), and Ca2P2O7 (calcium pyrophosphate, CPP). As is shown in Fig. 5(3), after 18 days of immersion in SBF, the preexisting phases in MAO coatings are still visible. Moreover, Ca10(PO4)6(OH)2 (hydroxyapatite, HA) and Ca10(PO4)6−2x(CO3)2x(OH)2 (carbonated hydroxyapatite, CHA) are detected after SBF immersion. Besides, the presence of an amorphous region of less than 20° (2θ) in Fig. 5(3) indicates the formation of the amorphous phases in the immersed MAO coatings.
FIG. 5.
XRD patterns of the bare alloys (1) and the MAO coatings before (2) and after (3) immersion in SBF solution for 18 days: (a) ZC1; (b) ZC2; and (c) ZC3.
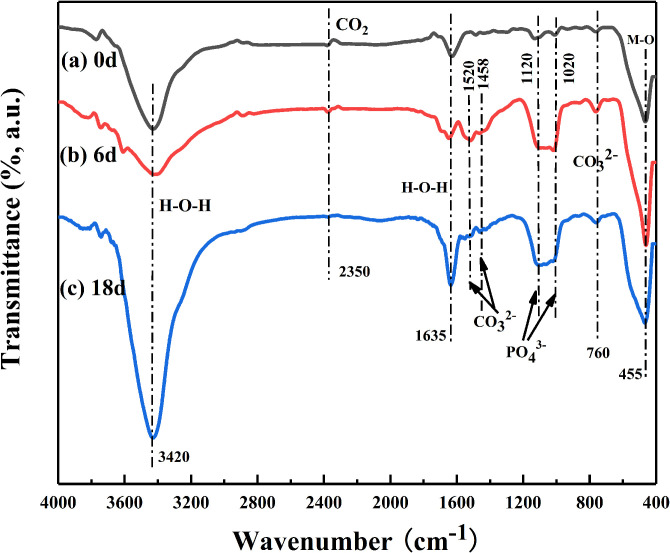
Figure 6 shows the infrared spectra of MAO coatings formed on the surface of the ZC1 sample before and after immersion in SBF. The FT-IR spectrum in Fig. 6(a) shows the characteristic bands of the MAO coatings before immersion: a wide absorption band at about 455 cm−1 is due to the existence of M–O (M = Mg, Zn, Ca) bonds, two weak bands around 1020–1120 cm−1 is assigned to the v3 asymmetric stretching mode of PO43− and P2O74−, a strong and broad band at about 3420 cm−1 is assigned to the stretching mode of free water and a weak band at about 1635 cm−1 is attributed to the H–O–H bending mode of crystal water.18,23,24 After immersion in SBF for 6 and 18 days, the spectra display one doublet bands at 1520 and 1458 cm−1 and one weak band at 760 cm−1 [Figs. 6(b) and 6(c)], which are assigned to the v3 antisymmetric stretching and v4 in-plane bending modes of CO32−, respectively.18,23 Besides, with the prolonging of immersion time, the absorption band of phosphate around 1020–1120 cm−1 becomes strong and sharp as shown in Figs. 6(b) and 6(c). It may be due to the increase of the crystalline phase of calcium phosphate.
FIG. 6.
FT-IR spectra of the MAO coated samples (ZC1) before and after immersion in the SBF solution for 6 and 18 days: (a) 0 d; (b) 6 d; and (c) 18 d.
C. Electrochemical corrosion behaviors
The typical potentiodynamic polarization curves and electrochemical parameters of the bare and MAO coated Mg–xZn–0.6Ca alloys are shown in Fig. 7. As is shown in Fig. 7, compared with Ecorr and Icorr of the bare alloys and MAO coated samples, Ecorr of the MAO coated samples shifts to the positive direction and Icorr decreases, indicating that MAO technology can significantly improve the electrochemical corrosion performance of the bare alloys. By comparing Figs. 7(1)–7(3), it can be seen that the ZC1 and ZC2 samples have similar corrosion potential. However, the Icorr value of the ZC1 sample coating is one order of magnitude lower than that of the ZC2 sample coating. Although the ZC3 sample showed more positive corrosion potential, its corrosion current density was higher than those for the ZC1 sample and ZC2 sample. The anode Tafel slope, cathode Tafel slope, and polarization impedance of samples with different zinc content are summarized in Table I. The polarization impedance (RP) value can be calculated by the Stern–Geary formula,25
FIG. 7.
Typical potentiodynamic polarization curves of the bare alloy and MAO coated samples immersion in the SBF solution: (1) ZC1; (2) ZC2; and (3) ZC3.
TABLE I.
The anodic Tafel slopes, cathodic Tafel slopes, and polarization impedance value of the potentiodynamic corrosion test.
| Samples | ba (V) | bc (V) | Rp (Ω cm2) | |
|---|---|---|---|---|
| Mg–3.0Zn–0.6Ca | Bare alloy | 0.4209 | 0.6457 | 2.351 × 10² |
| MAO coated | 0.1739 | 0.3478 | 7.945 × 10³ | |
| Mg–4.5Zn–0.6Ca | Bare alloy | 0.2434 | 0.5654 | 1.438 × 10² |
| MAO coated | 0.1791 | 0.5044 | 4.813 × 10³ | |
| Mg–6.0Zn–0.6Ca | Bare alloy | 0.2665 | 0.5047 | 1.687 × 10² |
| MAO coated | 0.1714 | 0.3267 | 4.026 × 10³ | |
It can be seen from Table I that the RP values of the MAO coated samples are at least 20–40 times higher than that of the corresponding bare alloys, which indicates that the MAO coatings improve the electrochemical corrosion resistance of the bare alloy matrix. In addition, the MAO coated Mg–3.0Zn–0.6Ca (ZC1) sample possesses the highest RP value.
D. In vitro degradation test in the SBF solution
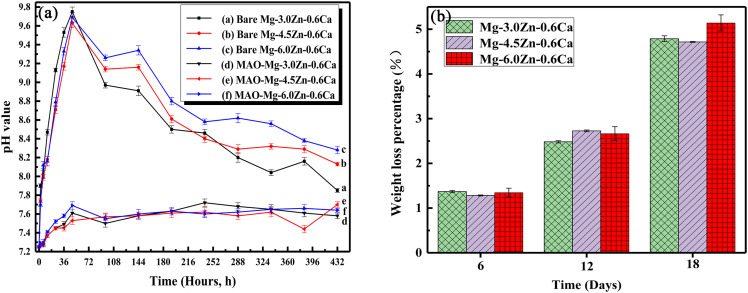
Figure 8 shows the changes in the pH value and weight loss rate of the bare alloys and MAO coated samples with the prolongation of SBF soaking time. It can be seen from Fig. 8(a) that the pH value of the solution with bare alloys immersed is higher than that of the solution with MAO coated samples immersed. For the solution with bare alloys immersed, the pH value increases intensely to the maximum value (9.75) in the initial stage of immersion, and then decreases gradually to a stable value. For the bare alloys, the Zn content has little effect on the pH value variation at the initial stage of immersion. During the decrease process of the pH value, with the increase of the Zn content, the decrease degree of the pH value decreases. The pH value of ZC1 sample after stabilization is close to that after MAO coated specimens. However, the pH value of the solutions with MAO coated samples immersed is stable and kept below the value of 7.8. The ZC2 sample has the largest fluctuation of the pH value. The final pH value is the closest to that of the human body fluid (7.9). As is shown in Fig. 8(b), the weight loss of each sample increases with the elongation of immersion time. After immersed in SBF for 18 days, the ZC3 sample shows the highest weight loss percentage (5.14%), and the ZC2 sample presents the lowest weight loss percentage (4.71%).
FIG. 8.
pH value (a) and weight loss percentage (b) changes as a function of immersion time. Error bars in Figs. 7(a) and 7(b) represent standard error of mean, N = 3.
IV. DISCUSSION
With the increase in the Zn content in the Mg–Zn–0.6Ca alloy, Ca and Zn elements are enriched at grain boundaries, the second phases (Ca2Mg6Zn3, Ca2Mg5Zn13) at grain boundaries increase gradually, and the precipitates become coarser. It can be inferred that Zn has good refining ability for the Mg–Zn–0.6Ca alloy. As is shown in Fig. 2, the porous structure is conducive to the application of Mg alloys as implant materials in the biomedical field. These micropores will be conducive to cell attachment, thereby promoting the healing and growth of bone tissue.26 As can be seen from Figs. 3 and 4, the bond between the alloys and MAO coatings is strong. However, with the increase of the Zn content, the micropore size of the MAO coatings becomes larger and deeper, and microcracks occurred at the contact between the MAO coatings and the substrate. It can be inferred that the increase of the Zn element changed the microstructure and conductivity of the Mg–Zn–0.6Ca alloy, which makes the breakdown of the MAO coating easier and the MAO reaction more intense. Thus, the surface micropores of the MAO coatings on the ZC3 sample are larger and deeper.
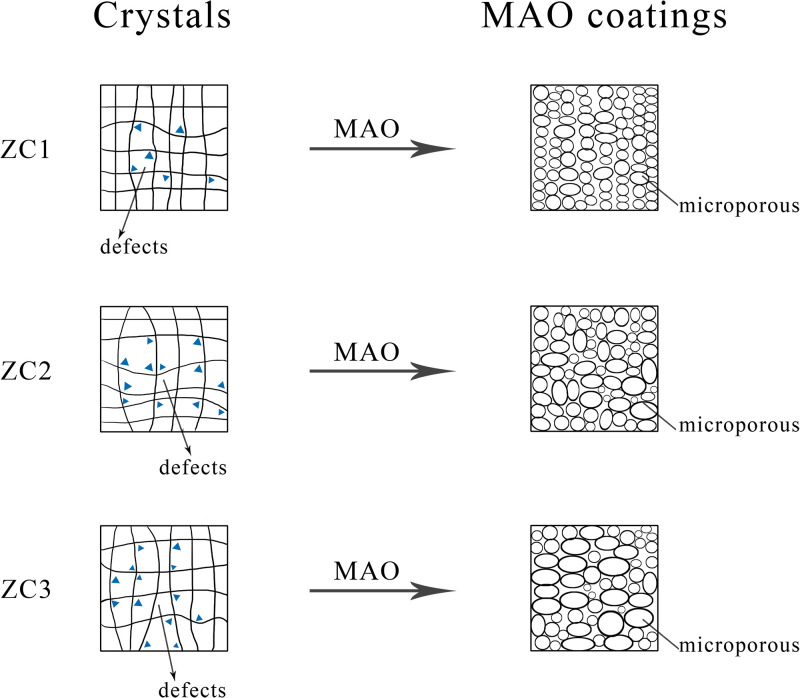
The schematic diagram of the effects of defects (grain boundary, secondary phase, dislocations, etc.) in the Mg–Zn–0.6Ca alloy with different Zn contents on the surface microstructure evolution of MAO coated samples is shown in Fig. 9. The difference of the surface micropores morphology of the MAO coatings may be due to the difference of the defects (grain boundary, secondary phase, dislocations, etc.) formed in the Mg–Zn–0.6Ca alloy with different Zn contents. Taking the second phase as an example, the amount and distribution of the second phases in the Mg–Zn–0.6Ca alloy vary with the Zn content. The formation and distribution of the second phase compounds will lead to the change of the amount and uniformity of grain boundaries, dislocations, and other crystal defects in the alloys. Meanwhile, the property of the second phases (CaMg2, Ca2Mg6Zn3, Ca2Mg5Zn13) is brittle compared with the Mg matrix. The interfaces between the second phases and the Mg matrix are favorable sites for the microcracks during the spark discharge process. The MAO coating formed subsequently at the microcrack sources is prone to bring forth crack. The continuous excessive electrical discharges will exacerbate the phenomenon, lead to larger and unevenly distributed surfaces micropores, and even cause surface erosion. The content of the second phases in the ZC1 alloy is relatively small, the distribution of the second phases in the ZC1 alloy is relatively uniform, so the micropores on the surface of the MAO coated ZC1 sample are evenly distributed and the size is uniform. The induced microcracks are less for the coating of the MAO coated ZC1 sample. The MAO coated ZC1 sample shows excellent corrosion resistance in the electrochemical corrosion and SBF soaking tests. The above conclusions are consistent with the experimental results.
FIG. 9.
Schematic diagram of the effects of defects in the Mg–Zn–0.6Ca alloy with different Zn contents on the surface microstructure evolution of MAO coated samples.
Large micropores and microcracks are easy to make corrosive medium enter into the coating. Once the interface is eroded, corrosion and degradation will accelerate, and the appearance of crevice corrosion will aggravate this corrosion process. The content of the Zn element influences the porosity, number of microcracks, and the thickness of the coatings by changing the microstructure of the Mg–Zn–0.6Ca alloy. Moreover, the Zn element can help to form passivation films on the surface of the Mg–Zn–0.6Ca alloy and reduce the adverse effect of the impurities such as Fe and Ni, etc. However, when the content of Zn is more than 5 wt. %, the Zn element will make the protective film on the Mg–Zn–0.6Ca alloy surface loose and easy to fall off, which will have a great negative impact on the corrosion resistance of the Mg–Zn–0.6Ca alloy and reduce the corrosion resistance of the Mg–Zn–0.6Ca alloy.27 The above factors lead to the difference in corrosion and degradation behaviors.
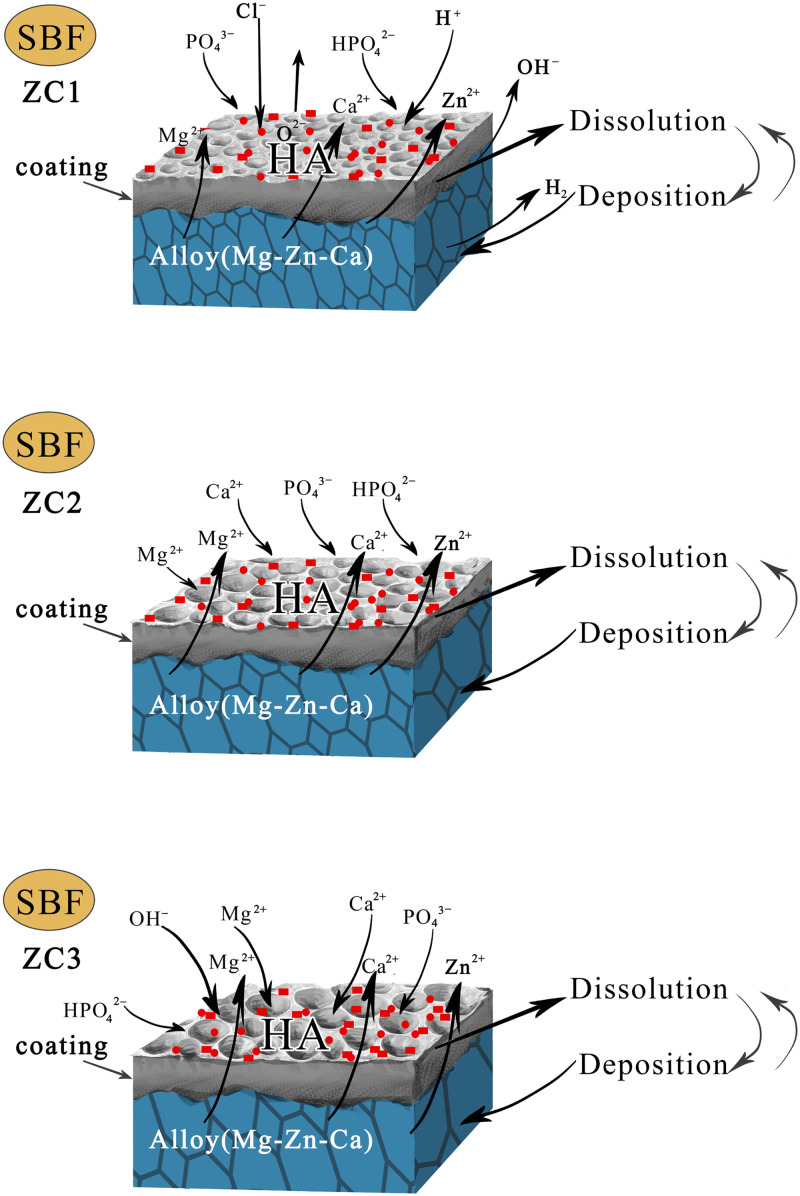
Figure 10 shows the corrosion and degradation mechanisms of MAO coated samples with different Zn contents after SBF immersion. The secondary phase (CaMg2, Ca2Mg6Zn3, Ca2Mg5Zn13) and Mg matrix formed an electrochemical circuit (the secondary phase acted as a cathode, while the α-Mg alloy matrix acted as an anode) in the SBF solution to accelerate the corrosion of the coatings.28 When the secondary phase is immersed in the SBF solution, it will be dissolved under the action of H+ and Cl−, which may form the pitting corrosion. Then, Cl− substitutes for O2− to dissolve the passivation film on the alloy surface, exposes the matrix, and reacts with the matrix of the alloys to make it dissolved. The atoms of Mg and Ca in the matrix are converted into Mg2+, Ca2+ ions, which are peeled off from the matrix to free ions. OH− and H2 are produced at the same time, which increases the pH value of the solution and decreases the weight of the alloy matrix. The content of the second phase in the ZC1 alloy is relatively small, most of which is the α-Mg matrix. Compared with the α-Mg matrix, the standard electrode potential of the secondary phase is more positive.28 Meanwhile, the volume fraction and grain boundary of the secondary phase increase gradually. Due to the dissolution of the anode, corrosion pits appeared on the alloy surface. The solution ions penetrated into the surface of the matrix through the micropores of the MAO coating, increasing the contact area between the solution and matrix. Therefore, the corrosion of MAO coatings and alloy matrix of samples ZC2 and ZC3 is more serious than that of sample ZC1.
FIG. 10.
Schematic diagram of corrosion and degradation mechanisms of MAO coatings with different Zn contents after immersion in SBF.
However, during the soaking process in the SBF solution, the derivatives of the CaP phase precipitated gradually, and the pores with the larger specific surface area left by the dissolution of matrix and MAO coatings provided the location conditions for the nucleation of the CaP phase. Because of the different corrosion degree of the Mg alloy with different Zn contents, the content and morphology of corrosion derivatives on the coating’s surface are different. The surface corrosion degree of sample ZC1 is the smallest, so the corrosion derivatives on the coating surface are in the regular spherical shape. Unlike samples ZC2 and ZC3, the corrosion derivatives are smaller in particle size and in sheet shape. The formation of the CaP phase consumed OH− in the solution, slowed down the rise of the pH value, and began to show a downward trend. Meanwhile, it makes up for the weight loss of sample degradation. By comparing the XRD patterns and the FT-IR spectrum of MAO coated samples before and after immersion in the SBF solution, it can be determined that a layer of bonelike apatites is formed on the surface of the MAO coatings after immersion in the SBF solution. The content of Ca and P in the MAO coatings is relatively high. The formation of hydroxyapatite is due to HPO42− and Ca2+ ions in the SBF solution. The formation of hydroxyapatite can be interpreted as the interaction of β-TCP with the following ions in body fluids:29
Hydroxyapatite is considered one of the most suitable ceramic materials for hard tissue implants, which shows no toxic effect and can bond directly to osteoblasts.30 The above results indicate that the CaP-MAO coatings have good biocompatibility and bioactivity. The detection of the HA on the surface of the MAO coatings shows that the coatings have good biocompatibility and bioactivity.
V. CONCLUSION
Element alloying is an effective way to develop special magnesium alloys for biomedical applications. Ca and Zn elements have good alloying ability for the Mg–Zn–Ca alloy. The MAO treatment can be used to improve the surface morphology and corrosion resistance of the magnesium alloys. Bioactive CaP-MAO coatings with porous outer and compact inner layers were successfully prepared on the Mg–Zn–0.6Ca alloy. The difference of different Zn contents in the MAO coatings may be due to the formation of the second phase in the base alloys. The degradation of the Mg–Zn–0.6Ca alloy can be divided into three stages. The Zn content has a significant effect on the microstructure, corrosion, and degradation of the MAO coated Mg–Zn–0.6Ca alloy. The Mg–3.0Zn–0.6Ca alloy after MAO coating has the most excellent coating microstructure. The micropores on the coating surface are evenly distributed and the surface is smooth. When the content of Zn is 3.0 wt. %, the corrosion resistance and biocompatibility of the Mg–Zn–0.6Ca alloy are improved with good biological properties. They have great potential as biodegradable materials for medical implantation in clinical application.
ACKNOWLEDGMENTS
This work was financed by the Shandong Provincial Natural Science Foundation, China (No. ZR2020QE022), Zibo Key Research and Development Program of CHINA (SDUT & Zibo City Integration Development special plan, No. 2019ZBXC400 and SDUT & Zhoucun District Integration Development special plan, No. 2020ZCXCZH07), Research Award Fund for Outstanding Young and Middle-aged Scientists of Shandong Province (No. ZR2016EMB22), and Shandong Provincial Training Programs of Innovation and Entrepreneurship for Undergraduates (Nos. 2018104331168, S2019104331158, and S2019104331832). The authors declare no conflicts of interest.
DATA AVAILABILITY
The data that support the findings of this study are available within the article. Derived data that support the findings of this study are available from the corresponding author upon reasonable request.
REFERENCES
- 1.Hench L. L., Biomaterials 19, 1419 (1998). 10.1016/S0142-9612(98)00133-1 [DOI] [PubMed] [Google Scholar]
- 2.Nair L. S. and Laurencin C. T., Prog. Polym. Sci. 32, 762 (2007). 10.1016/j.progpolymsci.2007.05.017 [DOI] [Google Scholar]
- 3.Jafari S., Harandi S. E., and Singh Raman R. K., J. Miner. Met. Mater. Soc. 67, 1143 (2015). 10.1007/s11837-015-1366-z [DOI] [Google Scholar]
- 4.Singh Raman R. K., Jafari S., and Harandi S. E., Eng. Fract. Mech. 137, 97 (2015). 10.1016/j.engfracmech.2014.08.009 [DOI] [Google Scholar]
- 5.Sheikh Z., Najeeb S., Khurshid Z., Verma V., Rashid H., and Glogauer M., Materials 8, 5744 (2015). 10.3390/ma8095273 [DOI] [PMC free article] [PubMed] [Google Scholar]
- 6.Mraied H., Wang W., and Cai W., J. Mater. Chem. B 7, 6399 (2019). 10.1039/C9TB00388F [DOI] [PubMed] [Google Scholar]
- 7.Subasi Y., Turen Y., Zengin H., Ahlatci H., and Sun Y., Mater. Res. Express 6, 1165f9 (2019). 10.1088/2053-1591/ab51ab [DOI] [Google Scholar]
- 8.Castellani C., Lindtner R. A., Hausbrandt P., Tschegg E., Stanzl-Tschegg S. E., Zanoni Beck G. S., and Weinberg A. M., Acta Biomater. 7, 432 (2011). 10.1016/j.actbio.2010.08.020 [DOI] [PubMed] [Google Scholar]
- 9.Vaira V. R., Padmanaban R., Mohan D. K., and Govindaraju M., Met. Mater. Int. 26, 409 (2020). 10.1007/s12540-019-00346-8 [DOI] [Google Scholar]
- 10.Witte F., Kaese V., Haferkamp H., Switzer E., Lindenberg A. M., Wirth C. J., and Windhagen H., Biomaterials 26, 3557 (2005). 10.1016/j.biomaterials.2004.09.049 [DOI] [PubMed] [Google Scholar]
- 11.Sankara Narayanan T. S. N., Park I. S., and Lee M. H., Prog. Mater. Sci. 60, 1 (2014). 10.1016/j.pmatsci.2013.08.002 [DOI] [Google Scholar]
- 12.Wan D. Q., Hu Y. L., Ye S. T., Li Z. M., Li L. L., and Huang Y., Int. J. Min. Met. Mater. 26, 760 (2019). 10.1007/s12613-019-1789-6 [DOI] [Google Scholar]
- 13.Ho Y. S., Porter J. F., and Mckay G., Water Air Soil Pollut. 141, 1 (2002). 10.1023/A:1021304828010 [DOI] [Google Scholar]
- 14.Witte F., Hort N., Vogt C., Cohen S., Kainer K. U., Willumeit R., and Feyerabend F., Curr. Opin. Solid State Mater. Sci. 12, 63 (2008). 10.1016/j.cossms.2009.04.001 [DOI] [Google Scholar]
- 15.Uskoković Vuk, J. Mater. Chem. B 7, 3982 (2019). 10.1039/C9TB00444K [DOI] [PMC free article] [PubMed] [Google Scholar]
- 16.Pan Y. K., Chen C. Z., Feng R., Cui H. W., Gong B. K., Zheng T. T., and Ji Y. R., Biointerphases 13, 011003 (2018). 10.1116/1.5003320 [DOI] [PubMed] [Google Scholar]
- 17.Kubásek J. and Vojtěch D., J. Mater. Sci. Mater. Med. 24, 1615 (2013). 10.1007/s10856-013-4916-3 [DOI] [PubMed] [Google Scholar]
- 18.Xu L. P., Yu G. N., Zhang E. L., Pan F., and Yang K., J. Biomed. Mater. Res. A 83, 703 (2007). 10.1002/jbm.a.31273 [DOI] [PubMed] [Google Scholar]
- 19.Hao S. and Li M., Nucl. Instrum. Methods Phys. Res. B 375, 1 (2016). 10.1016/j.nimb.2016.03.035 [DOI] [Google Scholar]
- 20.Wang Y., Li X., Chen M. F., Zhao Y., You C., Li Y. K., and Chen G. R., ACS Biomater. Sci. Eng. 5, 2858 (2019). 10.1021/acsbiomaterials.9b00564 [DOI] [PubMed] [Google Scholar]
- 21.Lin X., Yang X., Tan L. L., Li M., Wang X., Zhang Y., Yang K., Hu Z. Q., and Qiu J. H., Appl. Surf. Sci. 288, 718 (2014). 10.1016/j.apsusc.2013.10.113 [DOI] [Google Scholar]
- 22.Kumar V. R. and Muthupandi V., Trans. Indian Inst. Met. 72, 1617 (2019). 10.1007/s12666-019-01707-y [DOI] [Google Scholar]
- 23.Kokubo T., Kushitani H., Sakka S., Kitsugi T., and Yamamuro T., J. Biomed. Mater. Res. 24, 721 (1990). 10.1002/jbm.820240607 [DOI] [PubMed] [Google Scholar]
- 24.Zhang E. L. and Yang L., Mater. Sci. Eng. A 497, 111 (2008). 10.1016/j.msea.2008.06.019 [DOI] [Google Scholar]
- 25.Stern M. and Geary A. L., J. Electrochem. Soc. 104, 56 (1957). 10.1149/1.2428496 [DOI] [Google Scholar]
- 26.Chen B., Yin K. Y., Lu T. F., Sun B. Y., Dong Q., Zheng J. X., Lu C., and Li Z. C., J. Mater. Sci. Technol. 32, 858 (2016). 10.1016/j.jmst.2016.06.010 [DOI] [Google Scholar]
- 27.Boehlert C. J. and Knittel K., Mater. Sci. Eng. A 417, 315 (2006). 10.1016/j.msea.2005.11.006 [DOI] [Google Scholar]
- 28.Ma Y. Z., Yang C. L., Liu Y. J., Yuan F. S., Liang S. S., Li H. X., and Zhang J. S., Int. J. Miner. Metall. Mater. 10, 1274 (2019). 10.1007/s12613-019-1860-3 [DOI] [Google Scholar]
- 29.Dou J. H., You Q. Y., Gu G. C., Chen C. Z., and Zhang X. H., Biointerphases 11, 031006 (2016). 10.1116/1.4959127 [DOI] [PubMed] [Google Scholar]
- 30.Agnieszka S. K., Pluta K., Drabczyk A., Monika W., and Bożena T., Ceram. Int. 44, 13630 (2018). 10.1016/j.ceramint.2018.04.199 [DOI] [Google Scholar]
Associated Data
This section collects any data citations, data availability statements, or supplementary materials included in this article.
Data Availability Statement
The data that support the findings of this study are available within the article. Derived data that support the findings of this study are available from the corresponding author upon reasonable request.


