Abstract
Functional magnetic resonance imaging (fMRI) has become the leading method for measuring the human brain response to sensory stimuli. However, olfaction fMRI lags behind vision and audition fMRI for 2 primary reasons: First, the olfactory brain areas are particularly susceptible to imaging artifacts, and second, the olfactory stimulus is particularly difficult to control in the fMRI environment. A component of the latter is related to the odorant delivery human–machine interface, namely the point where odorants exit the dispensing apparatus to reach at the nose. Previous approaches relied on either nasal cannulas or nasal masks, each associated with particular drawbacks and discomforts. Here, we provide detailed descriptions and instructions for transforming the MRI head-coil into an olfactory microenvironment, or odor canopy, where odorants can be switched on and off in less than 150 ms without cannula or mask. In a proof-of-concept experiment, we demonstrate that odor canopy provides for clearly dissociable odorant presence and absence, with no nonolfactory cues. Moreover, we find that odor canopy is rated more comfortable than nasal mask, and we demonstrate that using odor canopy in the fMRI generates a typical olfactory brain response. We conclude in recommending this approach for minimized discomfort in fMRI of olfaction.
Keywords: anosmia, functional magnetic resonance imaging (fMRI), olfaction, olfactometry, olfactory hedonics, olfactory perception
Introduction
A major challenge in olfaction research is stimulus control and delivery. This challenge has been met by the development of odorant dispensers, oddly termed olfactometers. We say oddly, because most of them do not meter odorants, but rather merely dispense them. One of the very first olfactometers used in science is attributed to Zwaardemaker (1927). In essence, it relied on initially odorless air passing through an odorized source en route to the nose. Conceptually, olfactometers have not changed much since this initial design, yet now they rely on precise control offered by computers and instrumentation software (e.g., LabView) driving mass flow controllers (MFCs). MFCs allow precise determination of airflow regardless of the pressure provided (within specified limits), and form the backbone of modern olfactometers. MFC capability is critical in olfactometers that provide an airflow against minimal yet often fluctuating resistance. Such components were used in a series of pioneering modern olfactometers in the late 1980s (Kobal and Hummel 1988), and versions of these remain commercially available to this day (Vigouroux et al. 2005; Cohen et al. 2019). Several groups that developed conceptually similar devices, concentrated on affordability, and on magnetic resonance imaging (MRI) compatibility (Sobel et al. 1997; Lorig et al. 1999; Johnson et al. 2003; Lowen and Lukas 2006; Lundström et al. 2010; Sommer et al. 2012; Bestgen et al. 2016; Lowen et al. 2017; Hosseini et al. 2020). The latter is becoming essential, as MRI is now the primary tool for investigating function in the intact human brain, and to investigate olfactory function, we need MRI-compatible olfactometers. The key restrictions on MRI compatibility are that ferrous materials cannot be introduced into the vicinity of the participant within the magnet bore (not even a plastic check valve that contains a tiny steel spring within), and that ideally, electrical currents should not be carried by wires crossing between the MRI control room and magnet room. This is added to the existing requirements of science-grade olfactometers, namely optimal stimulus and flow control, no nonolfactory sources of variance (sounds, temperature, flows, etc.), and minimal contamination across conditions and time.
A critical component of olfactometers that has received only minimal attention is the end-piece, namely the human–machine interface at which odorants are delivered to the nose. Here, odorants can be directed into the nose, either monorhinally or birhinally using a nozzle (Ikeda et al. 1999) or nasal cannulas, or they can be dispersed surrounding the nose, typically within a nasal mask. Each of these methods has advantages and disadvantages. The advantages of a cannula are that it allows for monorhinal delivery, which is sometimes a scientific interest. Also, a cannula allows for stimulation without concurrent sniffing, which can also be a scientific preference in some cases. Finally, delivery by cannula allows for optimal temporal resolution, which is particularly important when recording electrical activity. In turn, using a cannula for delivery requires significant heating and humidification of the stimulus stream in order to prevent nasal crusting. Odorant delivery through nasal cannulas also requires optimal control over nonolfactory sources of variance, as even the slightest perturbations in total flow provide for a somatosensory cue when stimuli are delivered by intranasal cannula. A nasal mask presents the flip side of all this. Although it has reduced temporal resolution, it allows for reduced humidification and heating, it is more tolerant to perturbations in flow that are obscured by mask volume, and it enables natural sniffing. In turn, it contaminates easily, and above all, masks can be uncomfortable. This becomes critical in the MRI environment that is challenging in this respect as it is. The MRI magnet bore and head-coil can provide for an uncomfortable experience (Mackenzie et al. 1995; Dewey et al. 2007), and nasal masks do not help this. It has been our experience that this results in a higher rate of participant attrition in olfaction MRI studies compared with other sensory studies in the MRI environment (we acknowledge that this is an impression, as we are unaware of any formal comparison of this type). With this major consideration in mind, we set out to develop a more comfortable method of odorant delivery in the MRI environment. We reached at a solution we call odor canopy: a Teflon-coated Plexiglas canopy surrounding the head-coil, which together with a constant high-flow vacuum applied to the rear of the head-coil, makes for a well-controlled odorant microenvironment. This allows for olfaction MRI experiments with minimal added discomfort, and a generally natural sense of odor perception without resistance. The details of this solution follow.
Materials and methods
Building the odor canopy
This manuscript is not about the olfactometer body (such bodies have been described extensively [Johnson et al. 2003; Lowen and Lukas 2006]), but rather only about its end-piece. The end-piece approach, we propose can be utilized with nearly any olfactometer. Here, we used a basic olfactometer that we will describe only in brief. A conceptual decision with every MRI olfactometry setup is whether to place the odorant source within the olfactometer body in the control room, or to separate the olfactometer body (MFCs, valves, etc.) from the odorant-containing component, placing the former in the control room and the latter in the magnet bore. Again, each approach has advantages and disadvantages. An advantage of odorants within the olfactometer body is that one can use odorants in their liquid form, whereas one should not introduce liquids into the magnet bore for safety considerations. Using odorants in their liquid form allows more consistent control over concentration and ensuing intensity. In contrast, separating the odorant-containing component from the olfactometer body and placing it within the magnet bore allows for minimal distance of odorant-carrying tubing. Rather than odorant airstreams traveling from the control room to the nose, a distance of typically ~8 m, now odorant airstreams flow only from the in-magnet odorant canisters to the nose, a distance of typically ~60 cm. This makes for minimal odorant-carrying tubing, reducing risks of contamination. Here, we opted for the latter.
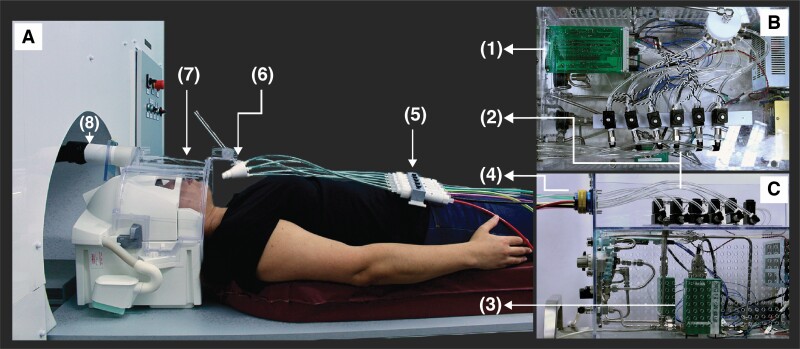
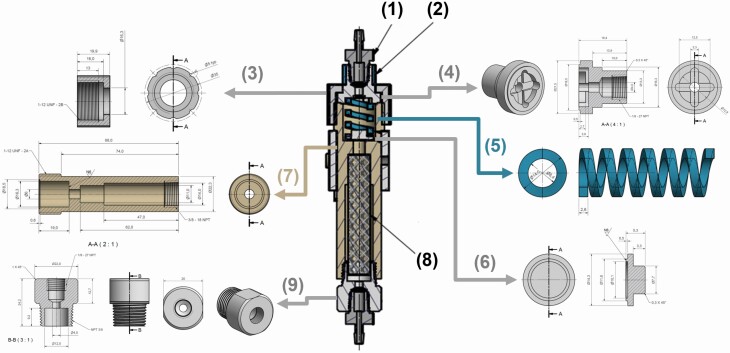
We used an olfactometer with a single MFC (MKS, M100B) that drove breathable air (Atlas Copco; TM24-SDP, model 8115410279) at 1.5 liters per minute (LPM) to a manifold of 6 solenoid valves (Amisco, EVI 7/9, 24 VDC, 6.5W; Figure 1). The 6 separate airflow lines from the solenoids culminated at an 8-port female connector (Twintec 2BC-8S) on the external surface of the olfactometer (Figure 1B). The corresponding male connector (Twintec 2BC-8P) was at the end of an 8 m long, 6-tube braid of 1/4-inch color-coded Tygon tubing, which crossed through a waveguide from the control room and into the magnet bore. Each tube from the braid connected to a separate Teflon odorant canister within the odorant canister holder. The canister is described in detail in Figure 2, and its measurements are in Supplementary File: Complete System Schematics. An additional ~40 cm color-coded 1/4-inch Tygon tube connects each odorant canister to the pyramid-shaped Teflon odorant emitter port. This port, which merges several inlets (here 6, but can be modified to many more) into 1 outlet, is in Figure 3, and its measurements are in Supplementary File: Complete System Schematics. We note that the 40 cm Tygon tubes obviously become contaminated by odorant, and are thus deemed odorant specific, to be replaced with any shift in the odorants used across experiments.
Figure 1.
Odor canopy setup overview. Odorant delivery setup from (A) side view of scanner-bed, (B) top view in control room, and (C) side view in control room. Setup is composed of a (1) control board, controlling (2) 6 solenoids and (3) MFC, with airflow lines connecting the MFC to the solenoids and from solenoids to (4) 8-female connector. Colored braided tubes were connected from this connector to (5) Teflon canisters within Teflon odorant cassette placed over the participant’s torso. The outputs of the Teflon canisters were connected to a (6) 6-port nozzle, which directed to the participant (7) headspace. Air was (8) vacuumed out constantly using a vacuum located outside the scanning room. This allows ongoing airflow with added odorants imbedded at high temporal resolution.
Figure 2.
Odor canopy Teflon odorant canister schematics. Teflon odorant canister, used to ensure flow in 1-direction only, from MFC to the participant. The canister schematics is in the center, and composed from the following parts: (1) 1/8″ fitting CPC component, (2) Delrin grip ring (outer diameter: 16.3 mm; inner diameter: 13.3 mm; height: 10 mm), (3) Delrin top plug, (4) Teflon spring holder plug, (5) Teflon spring (length: 31 mm), (6) Teflon 1-way valve (used to prevent flowing of air from the canister base, unless the flow increased in 1 direction), (7) Teflon canister base (used to hold the odorant sponge), (8) odorant-absorbed sponge, and (9) Teflon bottom plug. Airflows from the bottom through the sponge, pressing the spring until it exits through the top plug. All these parts can be easily made using the drawings in Supplementary File: Complete System Schematics.
Figure 3.
Odor canopy Teflon odorant emitter port schematics. Teflon pyramid-shaped odorant emitter, used to merge 6 inlets into 1 outlet, from (A) 3D view, (B) side view, and (C) back view. This part can be easily made using Supplementary File: Complete System Schematics.
Whereas the above components of this setup can remain universal, the following components may slightly change in shape as a function of the scanner and head-coil in use. Here, we describe implementation using the popular Siemens 32-channel head-coil (Siemens part# 10185400). Adaptation to other head-coils may involve minor modifications. We used clear Plexiglas (diameter of 30 cm, length of 20.3, and thickness of 1 mm) to form a canopy around a Siemens Mirror Holder (Siemens part# 10185701). The Plexiglas was glued to the holder, and its interior face was then coated with clear Teflon tape (our experience has been that this added protection is not really necessary). The rear of the canopy was formed into a connector for a 2″ vacuum tube. Once the scanner-bed was in place, this was connected to an 8 m long 2″ vacuum extension hose that passed through a waveguide in the scanner room, and connected to a shop vacuum (Kärcher, WD 3 Premium Multi-Purpose vacuum cleaner, #16298410, suction power = 200 air watts) placed in the scanner machine room. At the front of the canopy, about 10 cm anterior to the nose, we placed a 6 degrees-of-freedom holder for the pyramid-shaped Teflon odorant emitter port (Figure 1A). Together, this setup provided for a constant (albeit somewhat turbulent) flow across the participants face, with embedded odorant pulses on demand.
Estimating odorant timing in the odor canopy
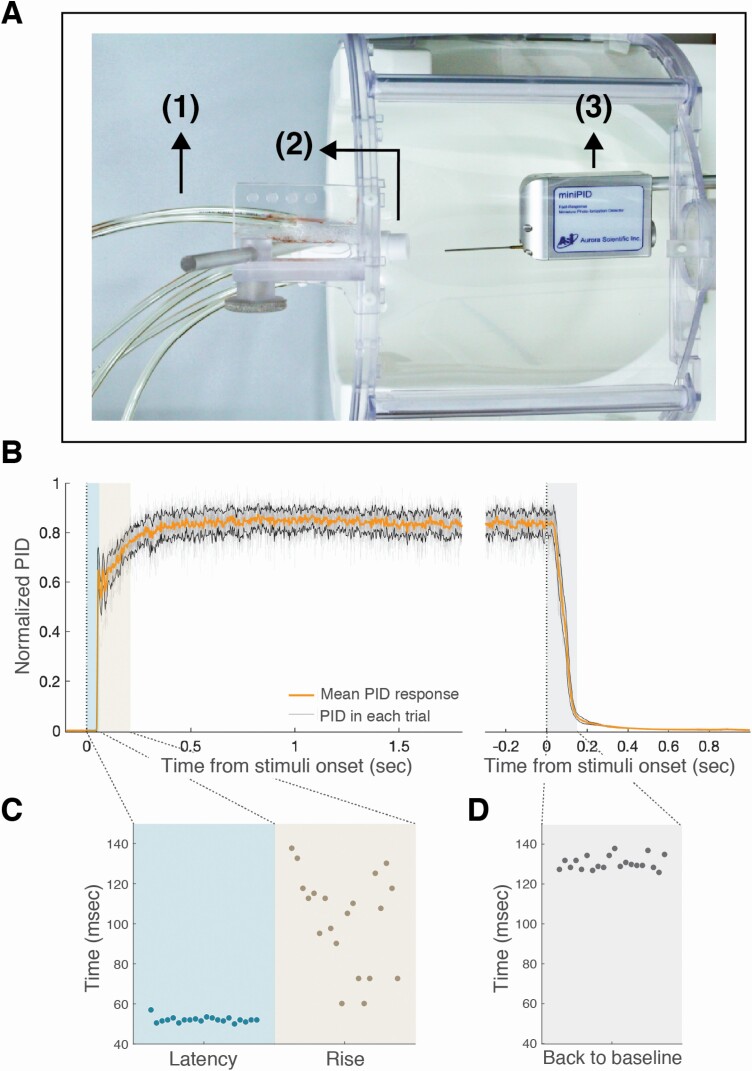
In order to test odorant rise and fall times using this setup, we substituted the participant with a photoionization detector (miniPID, Aurora Scientific) (Figure 4A). We then administered an odorant (orange oil, Frutarom Inc.; 360 µl) at a temporal regimen similar to that of a typical functional magnetic resonance imaging (fMRI) experiment: 20 trials, 1.85–1.95 s stimulus duration, 22–26 s (jittered) interstimulus interval, and measured the concentration at the area of the nose. We used the median measurement during 500 ms before odorant onset as trial-specific baseline, and divided the entire recording by its maximal value to generate a normalized trace. To determine latency, rise time, and fall time (return to baseline), we referenced to the median value during the last second of odorant delivery, and defined latency as the time to reach 10% of that value, the rise time as the duration from 10% to 90% of that value, and the fall time as the time from odorant termination to 10% of that value again. Beyond analytical measurement, to also visualize odorant flow at the nose we used a smoke machine (Concept, Air Trace MK2, AT-O-KIT) to deliver a stream of theatrical smoke instead of odor, and a manikin instead of live participant and video recorded the outcome.
Figure 4.
Odor canopy provided rapid and consistent switching between conditions. (A) Top view of measurement system: odorant line (1), odorant nozzle (2), and PID (3). (B) Averaged response (n = 20) to orange oil, normalized by max response in all epochs, aligned to stimuli onset and stimuli offset, with mean and standard deviation of PID responses in orange and black lines. (C) Latency, rise, and (D) back to baseline times.
Testing the odor canopy in an experiment
Participants
Ten normosmics (5 men, 5 women, age 25–49) participated in a comfort estimation control experiment. Twenty normosmic women (age 21–33) participated in imaging experiments, and 2 additional congenital anosmics (man, 31 Y; woman, 33 Y) participated in a control experiment aimed at estimating the level of nonolfactory sources of activation. These data were also reported on as the control group of a different study (Weiss et al. 2020). All participants provided written informed consent to procedures approved by the Wolfson Hospital Helsinki Committee and by the Weizmann Institute IRB committee.
Comfort estimation experiment
The notion that removing a tethering device such as a nasal mask will increase comfort, especially over time, seems obvious, but nevertheless demands at least some verification. To this end, participants completed 2 short mock scans, 1 with odor canopy and 1 with nasal mask, counter balanced for order. We used the most comfortable mask we are aware of for this experiment, with a gel-based cushion against the face (IQ Blue Nasal Mask, from SleepNet). Each mock scan lasted 5 min, containing ~15 trials with the odorant banana oil (Frutarom Inc.; 200 µl). At the end of each 5-min mock scan, participants rated level of comfort on a 10-point scale, rated the time they expected they could endure in the setup, and rated how claustrophobic they felt on a 10-point scale. After both conditions were completed, participants also made a categorical statement on whether they preferred mask, canopy, or had no preference. This experiment was conducted in a mock scanner that is identical in all ways to the actual scanner, but without magnetic field.
Functional MRI paradigm
Four odorants with previously verified isointense perception were used: The pleasant banana oil (Frutarom Inc.; 200 µl) and orange oil (Frutarom Inc.; 360 µl), and the unpleasant asafetida oil (DreamAir, NYC; 160 µl) and smelly cheese (isovaleric acid CAS no. 503-74-2, Sigma-Aldrich; 100 µl). In each of 2 functional runs, we delivered 5 stimuli per odor, culminating in 40 odorant events—20 pleasant and 20 unpleasant. Stimulus duration = 3 s, interstimulus interval = 20–26 s (jittered), odorant onset triggered by respiration (Owen et al. 2002). More specifically, participants wore a 2 mm nasal cannula (Salter Labs, #4804), linked to a spirometer (ML141, ADInstruments), and instrumentation amplifier (PowerLab 16SP, ADInstruments). Using the resultant respiratory trace, we triggered the odorant at the transition from exhalation to inhalation. Participants were instructed to breathe naturally, to keep their eyes closed, and if they noted an odorant, to rate odorant pleasantness (1–4) using a button box placed in their dominant hand. Because we were specifically interested in validating the lack of nonolfactory cues in this setup, the anosmic participants were instructed to try and identify any change, such as change in flow, that may indicate odorant onset, and to press the button if they sensed anything at all.
Functional imaging acquisition
MRI was performed using a 3-Tesla scanner (Siemens MAGNETOM Prisma) and a 32-channel receive head-neck coil (Siemens). The field of view for fMRI was limited to the ventral aspects of the brain. We used a T2*-weighted gradient echo Echo Planar Imaging (EPI) sequence with the following parameters: repetition time (TR) = 1500 ms, echo time (TE) = 25 ms, flip angle = 70°, FOV = 220 × 220 mm2, matrix = 110 × 110 mm2, 2 × 2 × 2 mm3 isotropic voxels, no gap, 27 slices, GRAPPA-2 acceleration. Image acquisition was tilted at 15° off AC–PC plane to reduce susceptibility artifact in olfactory regions. An anatomical image substrate was acquired using a 3D T1-weighted MP-RAGE (magnetization prepared rapid gradient echo) sequence, with the following parameters: TR = 2300 ms, TE = 2.32 ms, inversion time = 900 ms, flip angle = 8°, FOV = 256 × 256 mm2, 192 slices, resolution 0.94 × 0.94 mm2, slice thickness: 0.9 mm, GRAPPA-2 acceleration.
Functional MRI analysis
We used FSL (FMRIB’s Software Library, www.fmrib.ox.ac.uk/fsl), FEAT (FMRI Expert Analysis Tool) Version 6.00 (Woolrich et al. 2001), and MATLAB R2018a (MathWorks, Inc.).
Preprocessing
Preprocessing steps included motion correction using MCFLIRT, removal of nonbrain regions using brain extraction tool, high-pass temporal filtering (cutoff period = 125 s) to remove signal drift, and spatial smoothing using a Gaussian kernel of 6 mm full width at half-maximum. This was followed by correction of time series autocorrelation, resampling of functional data to 1 × 1 × 1 mm3 isotropic voxels, and registration to MNI template space using nonlinear registration (warp resolution = 10 mm).
Statistical parametric maps of odorant-induced activation
For each participant, a first-level general linear model included 1 regressor of interest, and its temporal derivative. The start time and duration of each inhale during odorant presentation were modeled and convolved with a canonical (double gamma) hemodynamic response function. This model also included a regressor of no interest for each volume, with >0.9 mm framewise displacement. Voxel-wise beta values were estimated for odorant events. The 2 functional runs of each participant were submitted to a fixed effects analysis and we used FLAME 1 + 2 (FMRIB’s Local Analysis of Mixed Effects) for group analysis.
Valence-related activity estimation
We repeated the analysis using the participant pleasantness rating as a parametric modulation value (weightings for the most unpleasant: −0.75, unpleasant: −0.25, pleasant: 0.25, and the most pleasant: 0.75). This model also included a regressor of no interest for each volume, with >0.9 mm framewise displacement (Siegel et al. 2014).
Time-course extraction
We used previously published statistical localization for odor versus baseline contrasts (Seubert et al. 2013): the right and left piriforms were defined by the peak coordinates [22, 2, −12], [−22, 0, −14], and the right and left orbitofrontal cortex (OFC) were defined by peak coordinates [28, 34, −12], [−24, 30, 10]. Since those regions are characterized by different volumes (Shen et al. 2013), we used 6 mm sphere for piriform, and 8 mm sphere for OFCs. We used the Featquery tool for parametric estimation extraction (the mean percent signal change) across all voxel in each region of interest for each participant. The averaged percent signal change graph was created by extraction of the percent signal change time course at each voxel (fslmeants, followed by dividing by the mean measurement) and averaging of all epochs.
Nasal airflow analysis
We used a recently published method for nasal airflow analysis (Arzi et al. 2020). This method allowed comparing of respiration across a session and between sessions, and used low-pass filters and adaptive hysteresis to automatically identify inhales and exhales. After each stimulus, the nasal inhalation volume was normalized by dividing by the baseline inhalation volume (an average of last 3 inhalations before stimulus onset).
Results
Odor canopy provided a stable odorant stimulus
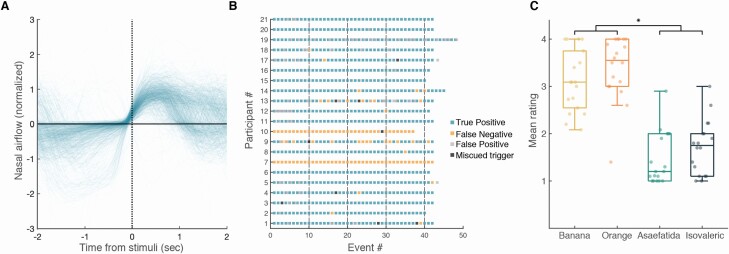
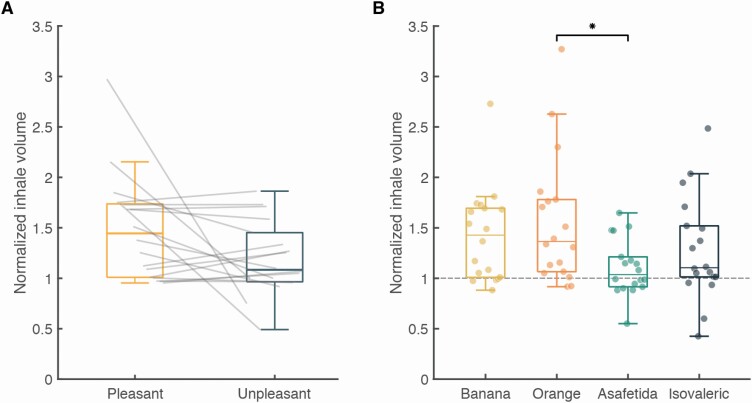
The architecture of the apparatus provided for an effective odorant airflow across the participant’s nose (see Online Video). The photoionization detector (PID) measurement revealed that odorant events were highly stable and consistent (Figure 4B). The latency from odorant trigger to 10% PID signal was 52.1 ± 1.4 ms, rise time to 90% PID signal was 102.1 ± 23.3 ms, and return to PID signal baseline was at 130.2 ± 3.3 ms from trigger offset (Figure 4C). In other words, the canopy environment which is on the one hand relatively naturalistic (in that participants are not tethered by mask or cannula), allowed for administration of nearly square-wave odorant events. These events were also effectively timed by the respiratory trace. To test for the accuracy of the triggering program, we compared the odorant trigger timeline to the respiratory timeline during the MRI scans. For each event (range: 37–48 events per participant, median: 42, interquartile range (IQR): 1) in each of 22 participants, we denoted whether the trigger occurred at its intended point of transition from exhale to inhale (Figure 5A). We observed that triggering occurred at the intended time point in 98.9 ± 1.57% of cases (Figure 5B, 908 events out of 918 events), and the 1 participant with the largest number of miscued triggers had only 4.76% miscues, i.e., odorant events triggered after inhale. Analysis of the perceptual responses further revealed an effective system: after excluding ratings from 2 normosmic participants with technical failures in pressing the button box, the detection rate in normosmic participants was 98.5 ± 1.7% true positive (Figure 5B). Analysis of the pleasantness ratings revealed a significant difference between the intended valence groups (pleasant = 3.26 ± 0.51, unpleasant = 1.59 ± 0.52, t17 = 11.21, P < 0.01), but as intended, no difference between the 2 odorants within each valence group (orange = 3.4 ± 0.67, banana = 3.11 ± 0.65, t17 = 1.62; isovaleric = 1.72 ± 0.57, asafetida = 1.46 ± 0.55, t17 = 1.462; all Pholms > 0.22, Figure 5C). Next, we examined the number of false positives (rating an odor when no odorant delivered), and after excluding 1 participant who did not follow instructions, we found that normosmic participants had 0–20 false positives (median: 2, IQR: 5, Figure 5B). In contrast, the 2 anosmic controls had 0% positive responses (either true of false) and did not report any nonolfactory sensations during the experiment, further indicating no nonolfactory cues associated with odorant onset in this system (Figure 5B). Finally, participants were instructed to breathe through their nose as constantly and consistently as possible, and not take a deliberate sniff if they sense an odor. To test whether they followed these instructions, we compared the average respiratory spirometry traces per odorant valence. We observed that the difference between the normalized inhale volumes for pleasant and unpleasant odors was not significantly different (volume pleasant = 149 ± 52.5%, volume unpleasant = 119.4 ± 36.4%, t17 = 1.946, P = 0.068, Figure 4). None of the participants reported any nonodorant sensations or discomfort from the constant airflow.
Figure 5.
Odorants were delivered to participants as intended. (A) Nasal airflow from 918 events, aligned to stimulus delivery, with 98.9% of the events locked successfully to inhales. (B) Colored map of events for each participant, indicating trials delivered during inhale and rated (true positive), trials delivered during inhale and not rated (false negative), ratings without an odorant delivered (false positive), and trials delivered during exhale (miscued trigger). Participants 7 and 10 were anosmics, and had 0% positive responses (either true or false). (C) Mean rating of each participant for each odor, *P < 0.05 (pleasant vs. unpleasant—t = 11.21, P < 0.001; all other ts < 1.62, Pholms > 0.22).
Moreover, the latter trend emerged only because of 1 outlier (volume pleasant = 297%, volume unpleasant = 75%, Figure 6), and with this participant removed the comparison yields t16 = 1.69, P = 0.11. Finally, pairwise comparisons between individual odors revealed a significant difference only when comparing orange to asafetida (volume orange = 156 ± 64%, volume asafetida = 110 ± 28%, t17 = 3.193, Pholm = 0.014, Figure 6). This respiratory shift was the only deviation from experimental instructions.
Figure 6.
Normalized inhale volume as a function of odorant valence and identity. Average inhale volume for each participant, normalized by the average volume in the inhales before each trial. (A) Pleasant vs. unpleasant odorants (t17 = 1.946, P = 0.068) and (B) average volume for each odorant, *P < 0.05 (orange vs. asafetida—t = 3.193, Pholm = 0.14; all other ts < 2.21, Pholms > 0.15).
Odor canopy was more comfortable than a nasal mask
Of the 10 participants in this control verification, 8 found the canopy to be more comfortable (canopy mean rating: 7.4 ± 1.4, mask mean rating: 5.8 ± 2.5, binomial P = 0.003) (Figure 7A), and 7 estimated they could last longer in a canopy experiment versus mask experiment (canopy: 47.5 ± 36.7 min, mask: 28.5 ± 17.5 min, binomial P = 0.02) (Figure 7B). In turn, the rated level of claustrophobia did not differ, with 4 estimating less claustrophobia with canopy, 4 with mask, and 2 stating no difference (mean rating canopy: 4 ± 2.2, mean rating mask: 4.1 ± 2.6, binomial P = 0.8) (Figure 7C). In sum, consistent with our estimation, canopy is more comfortable, and is estimated to enable longer duration studies.
Figure 7.
The canopy was more comfortable than a nasal mask. (A) Each dot reflects the mean comfort ratings by an individual. The dots accumulate above the unit slope line (X = Y), indicating increased comfort in the canopy. Pie chart inlay reflects binomial decision. (B) Each dot reflects the mean time a given individual estimated they could last. The dots accumulate above the unit slope line (X = Y), indicating increased predicted duration in the canopy. Pie chart inlay reflects binomial decision. (C) Each dot reflects the mean claustrophobia ratings by an individual. The dots accumulate around the unit slope line (X = Y), indicating no difference across conditions. Pie chart inlay reflects binomial decision.
The canopy environment gave rise to a typical odorant-induced response
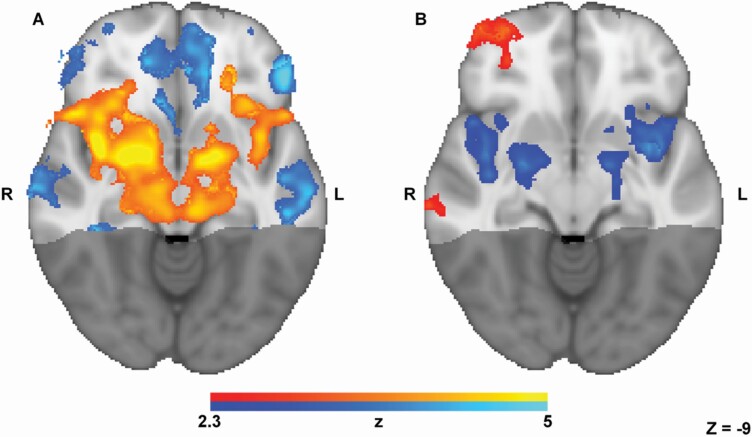
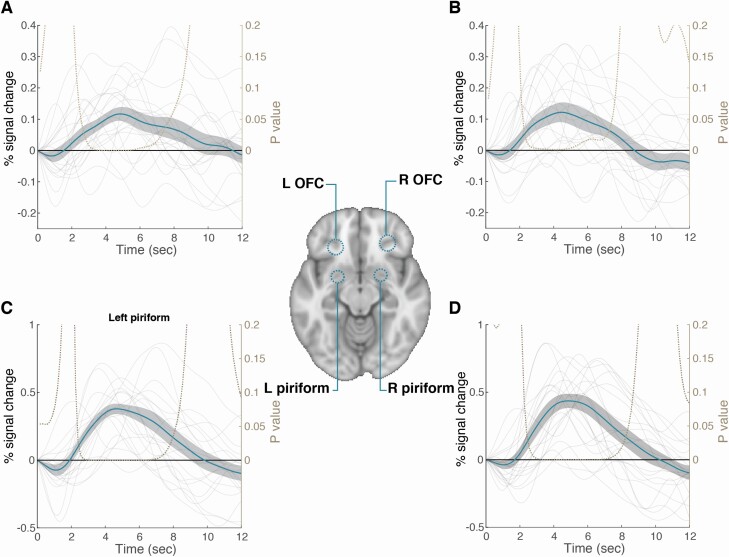
Three of the normosmic participants were excluded from fMRI analysis due to a structural brain anomaly (participants without olfactory bulbs reported in Weiss et al. 2020). The group image of the remaining 17 participants uncovered a typical odorant-induced response (Poellinger et al. 2001; Gottfried et al. 2006; Zelano et al. 2011; Bao et al. 2016; Lane et al. 2020), which included pronounced activation in piriform (primary) and orbitofrontal (secondary) olfactory regions (Figure 8A). The peak activation locations were at [24, 0, −13] (right piriform), [−18, 1, −14] (left piriform), [21, 33, −16] (right orbitofrontal cortex), and [−23, 33, −19] (left orbitofrontal cortex), and the odorant-induced hemodynamic response was typical, with peak at 4.5–4.8 s following odorant onset (Figure 9). We further investigated the fMRI response as a function of odorant valence, and consistent with previous literature (Gottfried and Zald 2005; Fjaeldstad et al. 2017; Freiherr 2017), we observed increased activity associated with increased unpleasantness in bilateral primary olfactory and amygdaloid regions (peak activations at [42, 0, −11], [26, 3, −16], [−27, 2, −19], and [−41, 8, −2]), yet increased activity associated with increased pleasantness in right orbitofrontal cortex (peak activation at [34, 57, −8]) (Figure 8B).
Figure 8.
Typical valence-dependent odorant-induced activity. Group image (n = 17) contrast of increased activity (axial slice, Z = −9) during (A) odorant presence (hot colors) vs. odorant absence (cold colors), and (B) parametric group image, activity associated with increased pleasantness in hot colors, and increased unpleasantness in cold colors.
Figure 9.
Average hemodynamic response in olfactory regions. Averaged odorant-induced hemodynamic response (n = 17) to odorants in percent of signal change, aligned to odorant onset, with mean and standard error in blue line and gray envelope. (A) Left orbitofrontal cortex (max at 4.8 s from stimuli), (B) right orbitofrontal cortex (max at 4.5 s from stimuli), (C) left piriform (max at 4.65 s from stimuli), and (D) right piriform (max at 4.8 s from stimuli).
Discussion
In this methods manuscript, we presented a possible solution to a very specific problem; how to deliver odorants in the fMRI environment without increasing discomfort. We describe odor canopy, a method of transforming the entire MRI head-coil into a well-controlled olfactory microenvironment. The method is simple and cheap to implement using any existing olfactometer, and we demonstrate that it allows effective experimentation. Importantly, unlike nasal masks, this method does not exacerbate the discomfort associated with fMRI experiments (Dewey et al. 2007), and this is its primary advantage. All this is not to say that there is anything inherently wrong with using nasal masks or cannulas, but the current method can make experimentation easier, and more real life-like. These are advantages worth considering.
In a series of analytical measurements, we demonstrated that the system is fast and robust, and perhaps more importantly than the analytical measurements; human participants sensed a realistic sense of odor, that was reliably timed. Moreover, anosmic participants failed to sense any nonolfactory cues associated with the system’s operation, even though they were instructed to try and detect when an odorant was generated using whatever cues they could identify. Finally, application of the system in fMRI experiments generated stable activation patterns consistent with the literature (Poellinger et al. 2001; Anderson et al. 2003; Gottfried et al. 2006; Zelano et al. 2011; Seubert et al. 2013; Bao et al. 2016; Lane et al. 2020). Together, we conclude that odor canopy is an appropriate delivery method for odorant stimuli in the MRI environment.
That said, the described system is not without drawbacks. First, our visualizations imply that the flow is rather turbulent, and this may result in somatosensory stimulation, although we note that no such sensations were reported here. Second, if participants retain an open mouth, odorants may activate taste receptors, potentially contaminating the experiment. Third, the 2″ vacuum line is in fact quite noisy. This is not a noise hazard for the participant who is typically with earplugs in the MRI, but it does render any auditory instructions or concurrent intended auditory stimulation harder to hear. Finally, the canopy itself may complicate the concurrent placement of a mirror for visual stimulation, although this was not a problem in the current setup where the mirror can be placed above the holder.
Finally, although this is a methods manuscript with no essential reason for extensive discussion, we will end in voicing our opinion that poor odorant delivery techniques remain, in our view, the primary limiting factor in an effective olfactory science. Compared with the monitors in the hands of vision scientists, or the amplifiers in the hands of audition scientists, olfactometers remain a poor solution. We are simply nowhere near the resolution of the sensory system we are studying. This lack of basic tools literally prevents fundamentally understanding olfaction. We must find an alternative to merely bubbling/passing an airstream through an odorant source in order to create a stimulus, which as noted in the introduction, has not ostensibly changed for more than 100 years. Given the potential commercial value of an effective odorant generator (Olofsson et al. 2017), it is surprising that this problem has yet to be solved by neither science nor industry, but it has not. Its time for a completely new approach to precisely generating odorants, and this remains an open goal with unimaginable potential and importance. Although odor canopy does not solve many of these problems, we submit that it is an effective tool with added comfort, and that this is a modest step in the right direction.
Supplementary Material
Funding
This work was funded by an European Research Council AdG grant (SocioSmell 670798) awarded to Noam Sobel.
Author contributions
Writing software applications: L.G. and E.L. Planning hardware setup: L.G., E.L., T.W., A.W., and N.S. Designed experiments: L.G., T.W., and N.S. Ran experiments: L.G., T.W., and R.W. Optimized scanning parameters: E.F.H. Analyzed functional data: T.W., L.G., and N.S. Helped write the paper: L.G., T.W., R.W., E.M., and N.S.
Conflict of interest
The authors declare no competing interests.
References
- Anderson AK, Christoff K, Stappen I, Panitz D, Ghahremani DG, Glover G, Gabrieli JD, Sobel N. 2003. Dissociated neural representations of intensity and valence in human olfaction. Nat Neurosci. 6(2):196–202. [DOI] [PubMed] [Google Scholar]
- Arzi A, Rozenkrantz L, Gorodisky L, Rozenkrantz D, Holtzman Y, Ravia A, Bekinschtein TA, Galperin T, Krimchansky B-Z, Cohen G, et al. 2020. Olfactory sniffing signals consciousness in unresponsive patients with brain injuries. Nature . 581(7809):428–433.. [DOI] [PubMed] [Google Scholar]
- Bao X, Raguet LLG, Cole SM, Howard JD, Gottfried J. 2016. The role of piriform associative connections in odor categorization. eLife. 5:e13732. [DOI] [PMC free article] [PubMed] [Google Scholar]
- Bestgen AK, Schulze P, Kuchinke L, Suchan B, Derdak T, Otto T, Jettkant B, Sucker K. 2016. An extension of olfactometry methods: an expandable, fully automated, mobile, MRI-compatible olfactometer. J Neurosci Methods. 261:85–96. [DOI] [PubMed] [Google Scholar]
- Cohen AO, Matese NG, Filimontseva A, Shen X, Shi TC, Livne E, Hartley CA. 2019. Aversive learning strengthens episodic memory in both adolescents and adults. Learn Mem. 26(7):272–279. [DOI] [PMC free article] [PubMed] [Google Scholar]
- Dewey M, Schink T, Dewey CF. 2007. Claustrophobia during magnetic resonance imaging: cohort study in over 55,000 patients. J Magn Reson Imaging. 26(5):1322–1327. [DOI] [PubMed] [Google Scholar]
- Fjaeldstad A, Fernandes HM, Van Hartevelt TJ, Gleesborg C, Møller A, Ovesen T, Kringelbach ML. 2017. Brain fingerprints of olfaction: a novel structural method for assessing olfactory cortical networks in health and disease. Sci Rep. 7:42534. [DOI] [PMC free article] [PubMed] [Google Scholar]
- Freiherr J. 2017. Cortical olfactory processing. Cham, Switzerland: Springer International Publishing. p. 97–98. [Google Scholar]
- Gottfried JA, Winston JS, Dolan RJ. 2006. Dissociable codes of odor quality and odorant structure in human piriform cortex. Neuron. 49(3):467–479. [DOI] [PubMed] [Google Scholar]
- Gottfried JA, Zald DH. 2005. On the scent of human olfactory orbitofrontal cortex: meta-analysis and comparison to non-human primates. Brain Res Rev.50(2): 287–304.. [DOI] [PubMed] [Google Scholar]
- Hosseini SF, Kamrava SK, Asadi S, Maleki S, Zare-Sadeghi A, Shakeri-Zadeh A. 2020. A multimodal MR-compatible olfactometer with real-time controlling capability. J Med Eng Technol . 44(6):317–323.. [DOI] [PubMed] [Google Scholar]
- Ikeda K, Tabata K, Oshima T, Nishikawa H, Hidaka H, Takasaka T. 1999. Unilateral examination of olfactory threshold using the Jet Stream Olfactometer. Auris Nasus Larynx. 26(4):435–439. [DOI] [PubMed] [Google Scholar]
- Johnson BN, Mainland JD, Sobel N. 2003. Rapid olfactory processing implicates subcortical control of an olfactomotor system. J Neurophysiol. 90(2):1084–1094. [DOI] [PubMed] [Google Scholar]
- Kobal G, Hummel C. 1988. Cerebral chemosensory evoked potentials elicited by chemical stimulation of the human olfactory and respiratory nasal mucosa. Electroencephalogr Clin Neurophysiol. 71(4):241–250. [DOI] [PubMed] [Google Scholar]
- Lane G, Zhou G, Noto T, Zelano C.. 2020. Assessment of direct knowledge of the human olfactory system. Exp Neurol. 329(2020):113304.. [DOI] [PMC free article] [PubMed] [Google Scholar]
- Lorig TS, Elmes DG, Zald DH, Pardo JV. 1999. A computer-controlled olfactometer for fMRI and electrophysiological studies of olfaction. Behav Res Methods Instrum Comput. 31(2):370–375. [DOI] [PubMed] [Google Scholar]
- Lowen SB, Farmer SL, Lukas SE. 2017. Improved low-cost, MR-compatible olfactometer to deliver tobacco smoke odor. Behav Res Methods. 49(1):74–82. [DOI] [PMC free article] [PubMed] [Google Scholar]
- Lowen SB, Lukas SE. 2006. A low-cost, MR-compatible olfactometer. Behav Res Methods. 38(2):307–313. [DOI] [PMC free article] [PubMed] [Google Scholar]
- Lundström JN, Gordon AR, Alden EC, Boesveldt S, Albrecht J. 2010. Methods for building an inexpensive computer-controlled olfactometer for temporally-precise experiments. Int J Psychophysiol. 78(2):179–189. [DOI] [PMC free article] [PubMed] [Google Scholar]
- MacKenzie R, Sims C, Owens RG, Dixon AK. 1995. Patients’ perceptions of magnetic resonance imaging. Clin Radiol. 50(3):137–143. [DOI] [PubMed] [Google Scholar]
- Olofsson JK, Niedenthal S, Ehrndal M, Zakrzewska M, Wartel A, Larsson M. 2017. Beyond smell-o-vision: possibilities for smell-based digital media. Simul Gaming. 48:455–479. [Google Scholar]
- Owen CM, Patterson J, Simpson DG. 2002. Development of a continuous respiration olfactometer for odorant delivery synchronous with natural respiration during recordings of brain electrical activity. IEEE Trans Biomed Eng. 49(8):852–858. [DOI] [PubMed] [Google Scholar]
- Poellinger A, Thomas R, Lio P, Lee A, Makris N, Rosen BR, Kwong KK. 2001. Activation and habituation in olfaction—an fMRI study. Neuroimage. 13(4):547–560. [DOI] [PubMed] [Google Scholar]
- Seubert J, Freiherr J, Djordjevic J, Lundström JN. 2013. Statistical localization of human olfactory cortex. Neuroimage. 66:333–342. [DOI] [PubMed] [Google Scholar]
- Shen J, Kassir MA, Wu J, Zhang Q, Zhou S, Xuan SY, Li Q, Ye Y, Hu J. 2013. MR volumetric study of piriform-cortical amygdala and orbitofrontal cortices: the aging effect. PLoS One. 8(9):e74526. [DOI] [PMC free article] [PubMed] [Google Scholar]
- Siegel JS, Power JD, Dubis JW, Vogel AC, Church JA, Schlaggar BL, Petersen SE. 2014. Statistical improvements in functional magnetic resonance imaging analyses produced by censoring high-motion data points. Hum Brain Mapp. 35(5):1981–1996. [DOI] [PMC free article] [PubMed] [Google Scholar]
- Sobel N, Prabhakaran V, Desmond JE, Glover GH, Sullivan EV, Gabrieli JD. 1997. A method for functional magnetic resonance imaging of olfaction. J Neurosci Methods. 78(1–2):115–123. [DOI] [PubMed] [Google Scholar]
- Sommer JU, Maboshe W, Griebe M, Heiser C, Hörmann K, Stuck BA, Hummel T. 2012. A mobile olfactometer for fMRI-studies. J Neurosci Methods. 209(1):189–194. [DOI] [PubMed] [Google Scholar]
- Vigouroux M, Bertrand B, Farget V, Plailly J, Royet JP. 2005. A stimulation method using odors suitable for PET and fMRI studies with recording of physiological and behavioral signals. J Neurosci Methods. 142(1):35–44. [DOI] [PubMed] [Google Scholar]
- Weiss T, Soroka T, Gorodisky L, Shushan S, Snitz K, Weissgross R, Furman-Haran E, Dhollander T, Sobel N. 2020. Human olfaction without apparent olfactory bulbs. Neuron. 105(1):35–45.e5. [DOI] [PMC free article] [PubMed] [Google Scholar]
- Woolrich MW, Ripley BD, Brady M, Smith SM. 2001. Temporal autocorrelation in univariate linear modeling of FMRI data. Neuroimage. 14(6):1370–1386. [DOI] [PubMed] [Google Scholar]
- Zelano C, Mohanty A, Gottfried JA. 2011. Olfactory predictive codes and stimulus templates in piriform cortex. Neuron. 72(1):178–187. [DOI] [PMC free article] [PubMed] [Google Scholar]
- Zwaardemaker H. 1927. The sense of smell. Acta Otolaryngol. 11:3–15. [Google Scholar]
Associated Data
This section collects any data citations, data availability statements, or supplementary materials included in this article.


