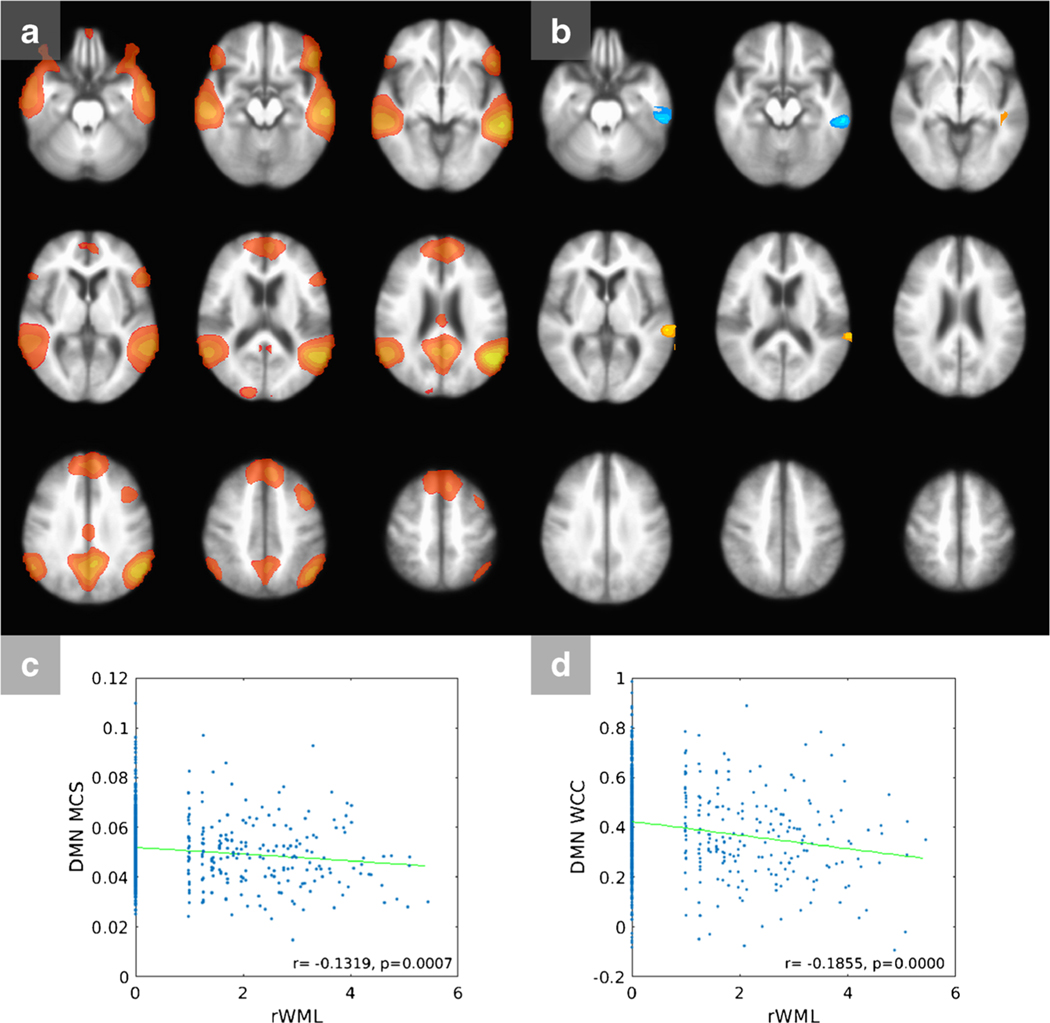
Fig. 1.
Default mode network (DMN). a Masked DMN map. B Connectivity—rWML correlation t map, indicating regions within the network where FC is correlated to rWML. Shades of red/yellow are positive and shades of blue are negative correlations. c Scatter plot of rWML vs. mean connectivity score. d Scatter plot of rWML vs. WML-related cluster connectivity. DMN, default mode network; MCS, mean connectivity score; rWML, regional white matter lesion volume; WCC, WML-related cluster connectivity

