

Abstract
Consumption of energy drinks has been associated with adverse cardiovascular effects; however, little is known about the ingredients that may contribute to these effects. We therefore characterized the chemical profiles and in vitro effects of energy drinks and their ingredients on human induced pluripotent stem cell (iPSC)-derived cardiomyocytes, and identified the putative active ingredients using a multivariate prediction model. Energy drinks from 17 widely-available over-the-counter brands were evaluated in this study. The concentrations of six common ingredients (caffeine, taurine, riboflavin, pantothenic acid, adenine, and L-methionine) were quantified by coupling liquid chromatography with a triple quadrupole mass spectrometer for the acquisition of LC-MS/MS spectra. In addition, untargeted analyses for each beverage were performed with a platform combining LC, ion mobility spectrometry and mass spectrometry (LC-IMS-MS) measurements. Approximately 300 features were observed across samples in the untargeted studies, and of these ~100 were identified. In vitro effects of energy drinks and some of their ingredients were then tested in iPSC-derived cardiomyocytes. Data on the beat rate (positive and negative chronotropy), ion channel function (QT prolongation), and cytotoxicity were collected in a dilution series. We found that some of the energy drinks elicited adverse effects on the cardiomyocytes with the most common being an increase in the beat rate, while QT prolongation was also observed at the lowest concentrations. Finally, concentration addition modeling using quantitative data from the 6 common ingredients and multivariate prediction modeling was used to determine potential ingredients responsible for the adverse effects on the cardiomyocytes. These analyses suggested theophylline, adenine, and azelate as possibly contributing to the in vitro effects of energy drinks on QT prolongation in cardiomyocytes.
Keywords: Cardiovascular, Heart rate, QT interval, Theophylline, Adenine, Azelate
1. Introduction
Energy drinks are soft beverages that typically contain high levels of caffeine and other stimulants, and may also be fortified with plant extracts and nutrients (e.g., vitamin B, taurine, and amino acids). These beverages are increasingly popular among adolescents and young adults in the United States (Heckman et al., 2010; Pomeranz et al., 2013) and worldwide (Dwaidy et al., 2018; Mansour et al., 2019; Pound et al., 2017), mainly due to their purported ergogenic effects (Ballard et al., 2010; Campbell et al., 2013; Souza et al., 2017). A recent survey of energy drink use showed that nearly two-thirds of U.S. teenagers have ever consumed these beverages (Miller et al., 2018). Concomitantly, the retail sales of energy drinks in the U.S. have markedly increased in the past 5 years (Statista, 2020) with global sales estimated at US $53 billion in 2018 and an expected annual growth rate of 7% (Allied Analytics, 2019).
Because the consumption of these beverages is not regulated and they are widely accessible over the counter to all age groups, the potential for adverse health effects of these products is a subject of great concern and needed research. Indeed, the use of energy drinks has been associated with a wide range of adverse health effects in humans (Fig. 1). Interestingly, the majority of human epidemiological studies and case reports identified cardiovascular adverse effects as a major health concern in young adolescents and adults (Gray et al., 2017; Kozik et al., 2016; Mangi et al., 2017; Sanchis-Gomar et al., 2016; Somers and Svatikova, 2020). Overconsumption of alcohol-laced or neat (as sold) energy drinks has also been associated with ventricular (Osman et al., 2019) and atrial (Enriquez and Frankel, 2017; Mattioli et al., 2016, 2018; Sattari et al., 2016) arrhythmias, cardiomyopathy (Belzile et al., 2020; Wajih Ullah et al., 2018), and QT prolongation syndromes (Basrai et al., 2019; Fletcher et al., 2017; Gray et al., 2017; Kozik et al., 2016; Rottlaender et al., 2012; Shah et al., 2014, 2019a; Tomcsanyi and Javor, 2015). Furthermore, acute ingestion can result in increased systolic and diastolic blood pressure (Elitok et al., 2015; Franks et al., 2012; Grasser et al., 2014; Hajsadeghi et al., 2016; Majeed et al., 2017; Miles-Chan et al., 2015). The hemodynamic impacts of energy drinks have been attributed to effects of caffeine and sugar, with other common ingredients (i.e., taurine and vitamin B complex) receiving less attention (Grasser et al., 2016). Indeed, while most studies on the cardiovascular effects of energy drinks focus on caffeine, a recent review concluded that caffeine intake alone is not associated with elevated risk of total cardiovascular diseases, arrhythmia, heart failure, or hypertension in healthy individuals (Turnbull et al., 2017). Other ingredients or chemical-to-chemical interactions therefore may play a critical role in effecting the purported cardiovascular hazard of some or all energy drinks.
Fig. 1.

A literature tree visualization of the 370 studies returned during the search for “Energy drink cardiovascular toxicity” using HAWCproject.org (https://hawcproject.org/assessment/1022/), and their assignment to binned categories. The numbers in each circle indicate the applicable number of studies. Bins that include additional categories are colored in blue and bins that are terminal are colored in white. Included categories subdivide into bins describing the type of a study (human, animal or in vitro), species or sub-type of a study, and organ system that was investigated. Bibliographic information on the individual studies included in each bin are accessible through the link provided above. (For interpretation of the references to color in this figure legend, the reader is referred to the Web version of this article.)
Aside from caffeine, energy drinks contain a large number of ingredients and plant extracts. Common constituents include taurine, vitamin B complex, guarana, ginseng, L-carnitine, glucuronolactone, theobromine, and theophylline (Ali et al., 2015; De Sanctis et al., 2017). Taurine is purported to have an inotropic effect (Huxtable and Bressler, 1974), and the combination of caffeine and taurine may further increase cardiac contractility (Baum and Weiss, 2001). However, another study suggested that the presence of taurine is more likely to reduce the cardiovascular effects of caffeine (Schaffer et al., 2014). Little is known about potential cardiovascular effects of other ingredients, and the composition of these beverages remains largely undetermined, which presents a challenge to identifying the potential cardiovascular effects of the ingredients.
This study aimed to characterize the relationships between constituents of a set of 17 popular energy drinks and their potential cardiac effects. To evaluate these effects, first both targeted and untargeted mass spectrometry (MS)-based studies were performed. The targeted tandem MS studies were performed on the 6 main molecules of interest in energy drinks using liquid chromatography and a triple quadrupole mass spectrometer (LC-MS/MS). For the untargeted analyses, LC was coupled with ion mobility spectrometry, and MS (LC-IMS-MS) (Dodds and Baker, 2019) to study the chemical profiles of energy drinks. IMS can rapidly separate ions in a millisecond timescale based on their shape, size, and charge state. When coupled with LC and high resolution MS, IMS provides additional confidence in compound identification through the measurement of collision cross section (CCS, Å2) values, which are calculated from the ions’ mobilities in a nitrogen gas-filled drift region (Dodds and Baker, 2019). Effects of the extracts of energy drinks and their key ingredients on beating parameters and ion channel (Ca2+) activity were then studied using human iPSC-derived cardiomyocytes (Sirenko et al., 2013a, 2013b). To determine what ingredients may contribute to the observed effects on cardiomyocytes, we conducted concentration addition modeling using quantitative data from the 6 common ingredients, as well as multivariate prediction modeling based on the LC-IMS-MS chemical composition data. Overall, this study detailed key constituents of over-the-counter energy drinks from 17 widely-marketed brands, showcased concentration-dependent effects on human iPSC-derived cardiomyocytes, and identified energy drink constituents potentially responsible for the observed effects on beating parameters and QT prolongation.
2. Methods
2.1. Materials
Energy drinks from 17 brands (Table 1) used in these experiments were acquired from a general grocery store in December 2019. For use as standards, the following chemicals were obtained from Sigma-Aldrich (St. Louis, MO): 2-acetylpyrazine (CAS: 22,047–25-2), adenine (CAS:73–24-5), L-methionine (CAS: 63–68-3), 10-hydroxydecanoic acid (CAS: 1679–53-4), sucralose (CAS: 56,038–13-2), calcium pantothenate (CAS:137–08-6), taurine (CAS: 107–35-7), riboflavin (CAS: 83–88-5), 13C2-taurine (CAS: 70,155–54-3), caffeine (CAS: 58–08-2), 13C6-nicotinic acid (CAS: 1,189,954–79-7), 13C3-caffeine (CAS:78,072–66-9) and ammonium acetate (CAS: 631–61-8), 6-gingerol (CAS: 23,513–14-6), nicotinic acid (CAS: 59–67-6), pyridoxine (CAS: 65–23-6), methyl anthranilate (CAS: 134–20-3), theobromine (CAS: 83–67-0), quercetin (CAS: 6151–25-3), and benomyl (CAS: 17,804–35-2). LC-MS grade solvents were purchased from Fisher Scientific (Hampton, NH). Dimethyl sulfoxide (DMSO, cell-culture grade, ≥99%) was purchased from Santa Cruz Biotechnology (Santa Cruz, CA). Human iPSC-derived cardiomyocytes (catalogue #CMC-100–010-001), corresponding cell culture media (catalogue# CMM-100–110-005) and supplements were from Fujifilm Cellular Dynamics (Madison, WI). Ca2+ dye EarlyTox™ Cardiotoxicity Kits (Part#R8211) were purchased from Molecular Devices (San Jose, CA). Other materials were as detailed below.
Table 1.
List of energy drink beverages used in this study.
| Abbreviation | Full Beverage Name | Manufacturer | Declared Caffeine (mg/L)a |
|---|---|---|---|
| Adrenaline Shoc | Adrenaline Shoc Smart Energy - O2 Frozen Ice | A Shoc Beverage (Austin, TX) | 634.2 |
| Bang Star | Bang-Star Blast | Vital Pharmaceuticals (Weston, FL) | 634.2 |
| C4 | C4-Zero Sugar (Original) | Cellucor (Austin, TX) | 422.8 |
| CELSIUS HEAT | CELSIUS HEAT Orangesicle | Celsius Holdings (Boca Raton, FL) | 634.2 |
| EBOOST | EBOOST-Your Kick in a Can SUPER FUEL | EBOOST (New York, NY) | 310.7 |
| Game Fuel | Game Fuel –Charged Cherry Burst | Pepsico (Harrison, NY) | 190.3 |
| GURU | GURU-Organic Energy | GURU Beverage Co. (Montreal, Canada) | 395.5 |
| Kill Cliff | Kill Cliff IGNITE-Performance Energy Blend | Kill Cliff (Atlanta, GA) | 423.7 |
| Kickstart | Kickstart-Energizing Orange Citrus | Pepsico (Harrison, NY) | 194.5 |
| Monster Energy | Monster Energy (Green) | Monster Energy Company (Corona, CA) | 338.3 |
| Red Bull | Red Bull Energy Drink | Red Bull North America (Santa Monica, CA) | 320 |
| Reign | Reign-Sour Apple | Reign Beverage Company (Los Angeles, CA) | 634.2 |
| Rockstar | Rockstar Energy Drink-Gears5 | Rockstar (Las Vegas, NV) | 338.3 |
| RUNA | RUNA-Pineapple | Runa (Brooklyn, NY) | 480 |
| UPTIME | UPTIME-Original | Uptime Energy Co. (Van Nuys, CA) | 401.1 |
| Venom Energy | Venom Energy-Black Mamba | Keurig Dr Pepper (Burlington, MA) | 338.3 |
| Xyience Energy | Xyience Energy-Frostberry Blast | Xyience (Austin, TX) | 372.1 |
, data are from https://www.caffeineinformer.com/caffeine-content/.
2.2. Untargeted analysis of chemical composition using liquid chromatography-ion mobility spectrometry-mass spectrometry (LC-IMS-MS)
For the LC-IMS-MS analyses, neat energy drink samples were diluted 10-fold either in de-ionized water for positive ion mode analyses and with 5 mM ammonium acetate for the negative ion mode studies. The diluted samples (90 μL) were spiked with 10 μL of 1 ppm 13C3-caffeine, injected via an auto-sampler and chromatographed on a ZORBOX Eclipse Plus C18 column (3.0 × 50 mm, 1.8 μm; Agilent, Santa Clara, CA) with mobile phase A (aqueous phase) and mobile phase B (organic phase) using Agilent 1260 Infinity II LC system. The mobile phases A and B were water+0.1% formic acid and methanol+0.1% formic acid for the analyses in positive ion mode. Initial chromatographic condition was maintained at 0% B for 0.5 min, then increased to 30% B by 2 min, 95% B by 14 min, 100% B by 14.5 min, and then held at 100% B for 2 min. Prior to the next injection, the column was equilibrated with the initial condition for 6 min. The column temperature was maintained at 40 ◦C, and the flow rate was set at 0.4 mL/min throughout the entire gradient. For the analyses in negative ion mode, the LC conditions were identical to positive ion mode, except that the mobile phases consisted of 5 mM ammonium acetate in water (A) and 5 mM ammonium acetate in 95% methanol (B). IMS-MS analyses were performed in positive or negative ion mode using an electrospray ionization source coupled with a 6560 IM-QTOF mass spectrometer (Agilent). The instrumental parameters are detailed in SI File 1.
Feature extraction and alignment was performed using Agilent Mass Profiler software (ver. B.08.00). Thresholds for feature retention were set at a Q-score (Agilent MassHunter peak quality metric that ranges from 0 to 100, which is an algorithmic estimate of how likely a feature is an actual molecule) > 50 (for each feature) and abundance >5000 (average across all samples). Only −1 and +1 ions were evaluated. For the features that were present in both experimental and blank samples, the blank sample’s abundance was subtracted from the experimental data. This data matrix was used for tentative compound identification using an IMS-MS database (Picache et al., 2019) which contains >3800 experimentally acquired CCS values for a wide range of food-use ingredients such as amino acids, lipids, and pyridines. In addition, a list of ingredients identified on the product labels for the energy drinks used in this study was created (SI Files 2–3) and IMS-MS features corresponding to those substances were identified based on m/z. Features match tolerance levels were set at ±1% for CCS and/or ±5 ppm for m/z. The features that were without identification but passed the threshold on abundance and peak quality were also retained. Finally, all features were manually validated and aligned across all energy drink samples by using an open-source application Skyline (MacCoss Lab Software, University of Washington, Seattle, WA; https://skyline.ms). All data for the features retained in this process are included in SI Files 4–5.
2.3. Targeted analysis of common energy drink ingredients using liquid chromatography tandem mass spectrometry (LC-MS/MS)
First, 10 μL of the diluted samples (as described in section 2.2) were injected into the Agilent 1290 Infinity II LC system and chromatographed on a ZORBOX Eclipse Plus C18 column (3.0 × 50 mm, 1.8 μm, Agilent, Santa Clara, CA). Chromatographic conditions were identical with those detailed in section 2.2. The multiple reaction monitoring (MRM) parameters for caffeine, riboflavin, and pantothenic acid are summarized in SI File 6 as they were the only ones targeted in the C18 LC analyses. Calibration standard solutions for these chemicals were prepared in deionized water at 0, 0.05, 0.1, 0.5, 1, 2.5, 5, and 10 μM, where the peak area ratios of standard and internal standard (13C3-caffeine) were used for the quantitation.
Second, hydrophilic interaction chromatography (HILIC) was applied for the quantification of highly polar compounds (adenine, taurine, and L-methionine). Original energy drink solutions were diluted 10-fold with acetonitrile, and then centrifuged at 10,000×g for 10 min. Ninety microliters of the supernatant were spiked with 10 μL of 1 ppm 13C6-nicotinic acid for subsequent LC-MS/MS analysis. Samples (10 μL) were chromatographed on an Acquity UPLC@BEH HILIC column (2.1 × 50 mm, 1.7 μm) and a guard column (2.1 × 5 mm, 1.7 μm, Waters, Milford, MA) with binary mobile phases A (95:5 acetonitrile/water with 10 mM ammonium formate) and B (50:50 acetonitrile/water with 10 mM ammonium formate) using Agilent 1290 Infinity II LC system. The column temperature and the flow rate were set at 40 ◦C and 0.4 mL/min, respectively. Initial chromatographic conditions were maintained at 0% B for 1 min, increased to 50% B by 3 min, then 90% B by 4 min, held for 0.5 min, and returned to initial condition by 5 min. The column was further equilibrated with the initial condition for 3 min prior to the next sample run. The MRM parameters for adenine, taurine, and L-methionine are summarized in SI File 6 based on their HILIC assessments. Concentrations for the calibration curve were set at 0, 0.05, 0.1, 0.5, 1, 2.5, 5, and 10 μM, where the peak area ratios of standard and internal standard (13C6-nicotinic acid) were used for quantitation of adenine, taurine, and L-methionine.
2.4. Cell culture and treatments
For in vitro experiments, energy drinks were extracted as follows. First, 5 mL of each beverage was aliquoted into five individual 1.5 mL microcentrifuge tubes (1 mL each). Second, tubes were dried using a vacuum concentrator (Savant SPD1010, Thermo Scientific, Waltham, MA). Third, dried residue in each tube was resuspended in 1 mL of iCell cardiomyocytes cell culture media by vortexing, media samples from each tube were combined into 15 mL conical polypropylene tubes and 1 mL washes were repeated for a total volume of 10 mL. Finally, the pH of each sample was adjusted to 7.4–7.6 using 0.1 N NaOH/HCl (SI File 7). These samples were used as representing the top stock concentration of 50% of the original energy drink beverage.
iCell cardiomyocytes were cultured in 384-well flat clear bottom black polystyrene tissue culture-treated plates (Catalogue #3764, Corning, NY) as detailed elsewhere (Grimm et al., 2015). In brief, cells were seeded at a density of 5000 cells per well in pre-gelatinized (2 h at 37 ◦C with 25 μL 0.1% gelatin in water) plates at 37 ◦C and 5% CO2. After 48 h, the plating medium was replaced with 40 μL of fresh maintenance medium containing 1:500 penicillin/streptomycin solution per well. Cardiomyocyte-specific synchronous contractions started approximately on day 5 in culture. Cells were maintained in culture for a total of 14 days prior to the treatments. On the assay day, the 50% stocks prepared as detailed above were used to prepare five 10 × dilutions using cell culture media. Then, 25 μL of Ca2+ dye was added into each well containing 25 μL of fresh maintenance medium and incubated at 37 ◦C for 2 h. Prior to treatments, the baseline Ca2+ flux was recorded. Next, 12.5 μL of each sample was added to each well to create final test concentrations that were as high as 10% of the original beverage to as low as 0.001%. This range of test concentrations was used based on the following considerations. The highest concentration was selected based on the hydrophilicity of energy drinks and the high volume of distribution of caffeine (0.7 L/kg). Assuming that an adult (70 kg) consumes 0.5 L of an energy drink as one serving, the theoretical highest blood concentration of caffeine will be approximately 10% of the amount in the beverage. Indeed, clinical trials with energy drinks routinely use volumes of 500–1000 mL that are consumed rapidly and cardiovascular effects are observed within 1–2 h after dosing (Basrai et al., 2019; Fletcher et al., 2017; Kozik et al., 2016). Stock solutions of the individual test compounds (either known components of energy drinks (SI File 8), or positive controls [cisapride, isoproterenol, sotalol, and propranolol]) were prepared in cell culture-grade DMSO at 20 mM concentration. For experiments, stock solutions were pre-diluted 40 × in cell culture medium to 5 × working solutions in 2.5% DMSO. The highest concentration of the individual ingredients and positive controls was 100 μM. The final concentration of DMSO was 0.5%.
2.5. Ca2+ flux assay
Intracellular Ca2+ flux in iCell cardiomyocytes exposed to the testing solutions for 90 min was measured using the EarlyTox Cardiotoxicity Kit with a FLIPR tetra instrument (Molecular Devices), as described previously (Grimm et al., 2015; Sirenko et al., 2013a). Briefly, cardiomyocytes were incubated at 37 ◦C for 2 h following the addition of one volume of pre-equilibrated Ca2+-dye reagent. Prior to the exposure to testing solutions, baseline Ca2+ flux of cardiomyocytes was measured at 515–575 nm following excitation at 470–495 nm and at a frequency of 8 Hz for 100 s. The internal instrument temperature was maintained at 37 ◦C. Cells were then simultaneously exposed to testing solutions using the internal fluidics handling system. At 90 min post-exposure, the beating behavior of cardiomyocytes was recorded as specified above. Data were further processed in ScreenWorks 4.0 software (Molecular Devices), and the derived data were exported as Microsoft Excel files for the concentration-response assessments as detailed elsewhere (Burnett et al., 2019). From these data, the phenotypes of positive and negative chronotropy and duration of QT were derived (see section 2.7).
2.6. Cytotoxicity assay
The potential cytotoxicity of test substances on cardiomyocytes was assessed using high-content live cell imaging 90-min post-exposure using the same plates as tested for calcium flux assay. After imaging as detailed in section 2.5, Ca2+-dye reagent was aspirated from each well. Next, cells were rinsed with 25 μL of pre-warmed Hanks’ balanced Salt Solution (reference # 21–022-CV, Corning, NY), and then stained with one volume of 2 × concentrated Hoechst 33,342 (4 μg/mL) at 37 ◦C and 5% CO2 for 30 min prior to image acquisition. Images were acquired using the ImageXpress Micro XL system (Molecular Devices) using the DAPI (Hoechst 3342) filter at 10 × magnification. Acquired images were processed using the multi-wavelength cell scoring applications module in MetaXpress image processing software (Molecular Devices, Sunnyvale, CA) and quantitative data were extracted for concentration-response assessments.
2.7. Data processing and concentration-response modeling
Ca2+ flux imaging assay data was imported and processed in RStudio (version February 1, 1335, R version 3.6.0) utilizing an algorithm as previously described (Blanchette et al., 2020). Four phenotypes were chosen from the processed Ca2+ flux data and the quantitative cell imaging data related to cardiomyocyte function and viability: positive chronotropy, negative chronotropy, QT prolongation, and cytotoxicity. For each ingredient and drink mixture, points of departure (PODs) were derived using two similar concentration-response Hill models depending on the directionality of the phenotype. The POD for the “upwards” phenotypes (positive chronotropy and QT prolongation) was set at 10% increase compared to baseline (Blanchette et al., 2020) and modeled using a three-parameter Hill model parametrized as where y is the response at the nominal concentration or dilution factor d, b is the concentration at 10% of the maximal response (EC10), and n is the Hill coefficient. The POD for the “downward” phenotypes (negative chronotropy and cytotoxicity) were represented as 10% decreases compared to baseline of peak frequency and total cells, and modeled as . Regardless of the directionality, model parameters for b (EC50) and n (the Hill coefficient) were assumed to be uniformly distributed. The prior for b was log10 transformed due to the several of orders of magnitude the PODs can span. The error was assumed to follow a Student’s t distribution centered at zero, with five degrees of freedom (Chiu et al., 2017; Hsieh et al., 2021). Modeling files are included as supplementary material (SI File 9). Sampling of the posterior distribution was conducted utilizing the Markov chain Monte Carlo algorithm through interfacing STAN software (version 2.17.3) with R. Simulations consisted of 3 chains of 24,000 iterations each for the ingredients screened in this study and 3 chains of 32,000 iterations each for the drink mixtures. The tuning parameters of adapt_delta and max_treedepth were adjusted from their default values of 0.8 and 10 to 0.99 and 15, respectively to improve modeling performance and decrease the occurrence of divergent transitions. Convergence was assessed for each parameter through assessment of both inter- and intrachain variability, with a potential scale reduction factor indicating that convergence was reached for that parameter (Gelman et al., 2019). A total of 750 posterior samples (3 chains, 250 random samples/chain) were saved for subsequent analyses.
2.8. Concentration addition modeling
Given the assumption that energy drink ingredients share similar targets or mechanisms of action, in vitro effects on cardiomyocyte phenotypes were modeled based on the quantitative data and in vitro effects of caffeine, taurine, riboflavin, pantothenic acid, adenine, and L-methionine. The concentration addition modeling was performed using the following formula:
Here, EC10%, ED or EC10%, i is the effect concentration of an ED or ingredient i that causes 10% effect in cardiomyocytes and pi is the proportion of ingredient i in the ED. The highest test concentration (100 μM) was used to replace the EC10%, i of ingredient i if the value was greater than 100 μM, in which case the additivity-based EC10%, ED is considered a conservative “lower bound.” If the modeled EC10%, ED was greater than 100%, a 100% (original energy drink) would be reported.
2.9. Prediction between chemical composition and in vitro datasets
An understanding of the relationships between chemical feature abundances and the in vitro assays and derived phenotypes can provide important clues for future testing, and potentially be used to predict toxicity responses for future samples. To test association of the chemical features with biological assays, we computed Pearson correlations, with p-values converted to false-discovery control q-values using the Benjamini-Hochberg procedure (Benjamini and Hochberg, 1995). Linear regression cannot be performed when the number of predictors exceeds the sample size of 17, and we used a modified version of the approach of (Chen et al., 2021). Briefly, we used a form of ridge regression to perform the predictions, with a common ridge shrinkage parameter λ in the range 10−6 to 106, evaluated on a log10-scale grid and applied to toxicity assays simultaneously. Compared to running individual ridge regressions, the approach is simpler and allows potential performance improvement using shared information across toxicity assays. The approach first normalizes all chemical features to mean zero, variance 1, and was run twice: first with seven toxicity features plus ToxPi score, and then with the six assay values as point of departure values (EC10). After finding the λ value providing the minimum mean-squared error, we performed leave-one-out cross-validation on the prediction model and recorded the set of toxicity predictions for all 13 phenotypes simultaneously. Other forms of k-fold cross-validation may have modest advantages in estimation of mean-squared prediction error, but our approach provides easily interpretable predictions with no need for averaging multiple k-fold data splits. The Pearson and Spearman correlations between predicted and actual phenotype values were computed and the p-values subjected to Benjamini-Hochberg correction. Analyses were performed using R v3.5.3.
2.10. Scoping literature search
A scoping literature search was conducted to collect, evaluate, and catalogue published studies on the topic of adverse health effects of the energy drinks. We followed best practices of systematic evidence evaluation in toxicology (Shapiro et al., 2018) and created an online database of studies where the abstracts, search terms, inclusion/exclusion criteria, and the interactive literature tree (Fig. 1) are publicly accessible (https://hawcproject.org/assessment/1022/). Specifically, hawcpr oject.org webtool was used to conduct a search using the following literature search string – ((((energy drink) AND toxicity)) OR ((((in vitro) AND energy drink)) OR ((Cardiovascular disease) AND energy drink))) from PubMed (last search date November 13, 2020).
3. Results
3.1. Analytical characterization of the chemical complexity of energy drink composition
In this study, we assessed 17 energy drink samples which were purchased from a local general food retailer (Table 1). The chemical compositions were evaluated with LC-IMS-MS and LC-MS/MS. Fig. 2 shows the total ion chromatograms and nested LC-IMS-MS spectra illustrating features detected in instrumental blank and individual energy drinks. Among tested beverages, the highest total ion abundance was observed in RUNA (Fig. 2A) and the lowest was for C4. The nested IMS-MS spectra (Fig. 2B) further illustrate the observed features in RUNA, Kickstart and C4.
Fig. 2. Representative total ion chromatograms (A) and nested IMS-MS spectra (B) in positive ion mode for an instrumental blank and energy drink samples (RUNA, Kickstart and C4).

(A) Total ion chromatograms for an instrumental blank (left) and RUNA (right). (B) The summed IMS-MS nested spectra for an instrumental blank (top left) and three energy drinks (identified with a brand name in each figure). Shown are m/z on the x-axis and IMS drift time on the y-axis.
To first demonstrate the ability of LC-IMS-MS for quantitative analysis of chemical composition of tested beverages, we compared its observed concentrations of caffeine and 5 other common ingredients with LC-MS/MS. Caffeine was listed on the nutrition labels of all energy drinks and was detected in all samples (Fig. 3A). Experimentally-derived caffeine levels ranged from 200.3 to 795.4 mg/L; five of 17 energy drinks caffeine levels exceeded the lower bound typical in the medium roast brewed coffee (500–3800 mg/L) (IARC, 2018). Our experimentally-derived caffeine concentrations correlated strongly (r = 0.96, Fig. 3B) with, but were slightly higher than, the values stated on the product labels. Next, we compared LC-MS/MS-derived caffeine levels with those from LC-IMS-MS using 13C3-caffeine response ratios (Fig. 3C) and strong correlations (r = 0.95) were observed. Quantitative (LC-MS/MS) analysis of 5 additional common ingredients listed on the product labels is shown in Fig. 3D. Fifteen tested beverages listed taurine as an ingredient; however, we detected taurine in quantifiable levels in only 6 samples (one in excess of 2000 mg/L).
Fig. 3. Comparative analysis of caffeine and other ingredient content in energy drinks.

(A) A bar graph illustrates concentrations of caffeine in 17 tested energy drinks as determined by LC-MS/MS. Dotted line indicates a lower bound on the range (gray shading) of caffeine concentrations in a medium-roast coffee. (B) The correlation between measured (LC-MS/MS) caffeine levels in the test beverages and those declared by the manufacturers. Correlation coefficients are shown. The solid line is the best fit and the dotted line is 45◦ diagonal. (C) The correlation between LC-MS/MS and LC-IMS-MS values for caffeine in the test beverages. (D) A heatmap showing measured concentrations of six major ingredients in energy drinks. Red squares indicate which ingredients were listed on the product label. (For interpretation of the references to color in this figure legend, the reader is referred to the Web version of this article.)
Next, we performed untargeted analyses of the samples using LC-IMS-MS to assess other present features (Fig. 4). From a total of 4293 features detected in positive ion mode by LC-IMS-MS and 2641 in negative ion mode, 51 and 47 features (Fig. 4A), were identified with confidence using both CCS and m/z values and of these, 6 ingredients (i. e., pyridoxine, biotin, riboflavin, taurine, L-tyrosine, and pantothenate) were observed in both modes. Additional 124 LC-IMS-MS features in positive ion mode and 79 negative ion mode features (Fig. 4B) with high abundance were retained as “unknowns of interest” for subsequent analyses. Overall, the highest total abundance of the high-confidence LC-IMS-MS features was found in RUNA and the lowest in GURU (Fig. 4C); however, the abundance of the identifiable features (Fig. 4D) was only 2.6–8.6% of the total abundance, and most features across all tested beverages remained without a confident formula/name assignment as is currently typical for small molecule analyses (Monge et al., 2019).
Fig. 4. Relative abundance of LC-IMS-MS features in energy drinks.

Heatmaps illustrate the relative abundance of identified (A) and unknown (B, top 50 are shown for each ionization mode) LC-IMS-MS features. See SI Files 4–5 for the data and feature identification. (C) Bar graphs show the total abundance of LC-IMS-MS features detected (in both positive and negative ion modes) in each test beverage. (D) The percentage of declared, and newly identified by LC-IMS-MS (identified and unknown) features in each test beverage. Energy drink labels displayed in panel D also apply to panel C.
3.2. Effects of tested beverages and their ingredients on human iPSC-derived cardiomyocytes
Human iPSC-derived cardiomyocytes retain in vivo-relevant phenotypes linked to familial syndromes that result in cardiovascular disease (Egashira et al., 2012; Huang et al., 2011; Itzhaki et al., 2011; Sun et al., 2012). In addition, these cells are a widely used in vitro model in drug and chemical safety evaluation (Cohen et al., 2011; Guo et al., 2011; Ma et al., 2011); highly clinically-informative data on potential pro-arrhythmogenic effects of drugs can be derived using this model (Blanchette et al., 2019, 2020). Therefore, we tested concentration-dependent effects of energy drink extracts (up to 10% of the original concentration) and 16 of their common ingredients on four clinically-relevant cardiac phenotypes - positive chronotrope, negative chronotrope, QT prolongation, and cytotoxicity using human iPSC-derived cardiomyocytes (Figs. 5 and SI File 10).
Fig. 5. In vitro effects of energy drinks and their major ingredients on human iPSC-derived cardiomyocytes.
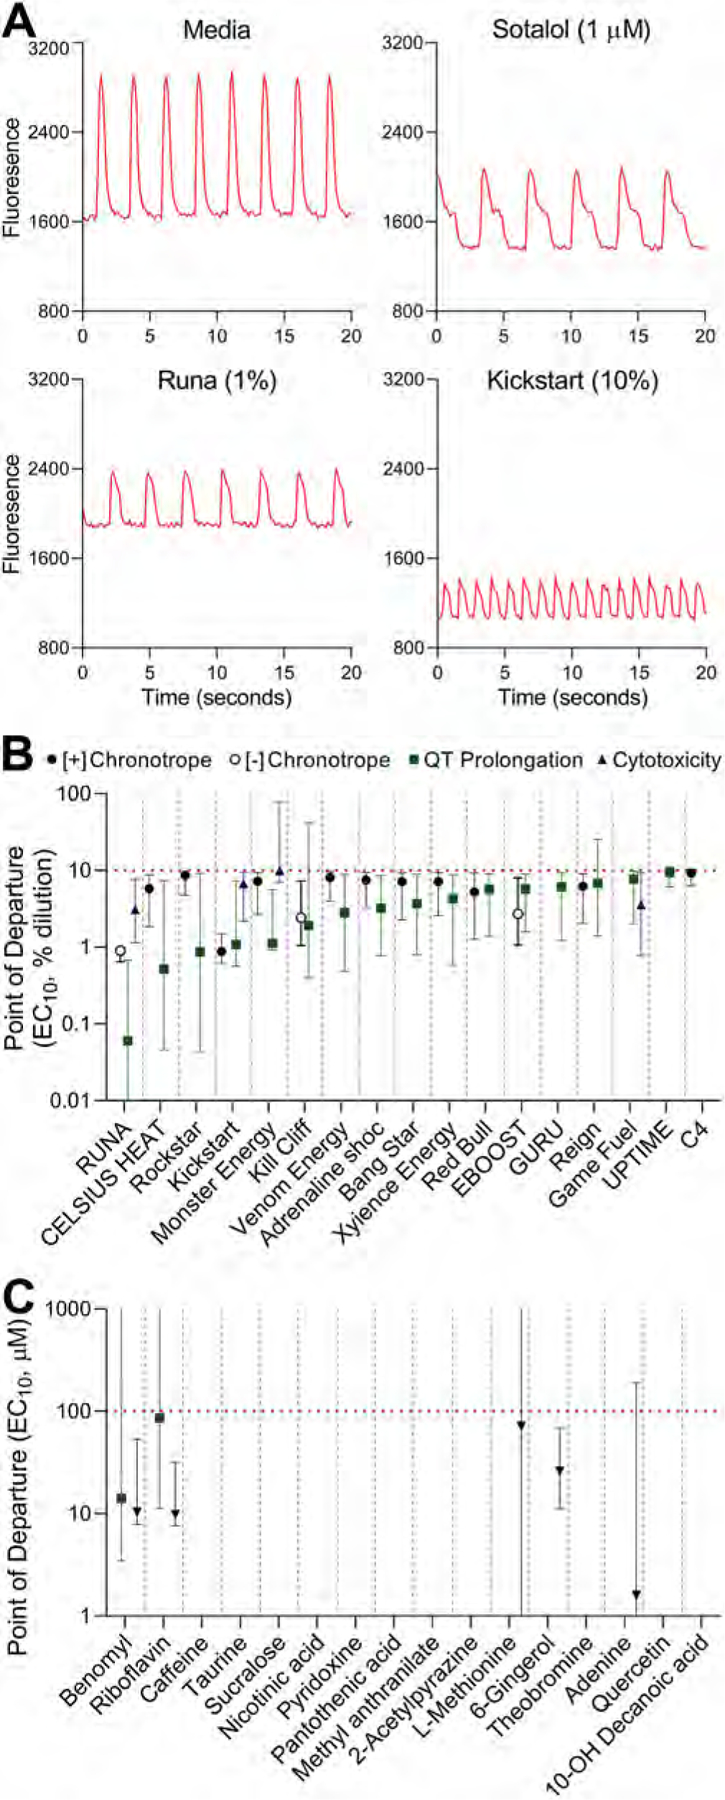
(A) Representative Ca2+ flux traces for cells exposed to media, positive QT-prolongation control (Sotalol, 1 μM), and representative energy drinks (Runa, 1%; and Kickstart, 10%). The x-axis shows time (seconds) and y-axis shows relative fluorescence units. (B and C) Summary graphs illustrate the in vitro point of departure (POD) values for four phenotypes (filled circle, positive [+] chronotropy; open circle, negative [−] chronotropy; square, QT prolongation; and triangle, cytotoxicity) effected by either energy drinks (B) or their major ingredients (C). POD values are shown (mean and 95% confidence interval) only for the substances that had a mean effect lower than the maximum concentration tested. If no symbol is shown, no effect was observed up to the highest concentration tested (horizontal dotted line). Vertical dotted lines separate the delineate data for each energy drink or ingredient shown in the y-axes. See SI File 10 for the representative Ca2+ flux traces and concentration-response plots for all tested beverages.
Fig. 5A shows representative Ca2+ flux traces of control cells (media), cells treated with a QT prolongation-positive control (Sotalol, 1 μM), or two representative energy drink samples (RUNA, 1%; and Kickstart, 10%). Fig. 5B shows the results of the concentration-response analysis of the effects of tested energy drinks on three most affected phenotypes, RUNA showed the lowest point of departure value (EC10, 0.06%). Across all samples, QT prolongation effects were detected at the highest dilution. Positive chronotropic effect was detected in fewer samples, with Kickstart having the lowest point of departure value (EC10, 0.88%) for this phenotype. Minimal cytotoxicity was observed at tested dilutions. Fig. 5C shows the same analysis for the 16 major ingredients in energy drinks, only benomyl and riboflavin showed some effects for QT prolongation (see Fig. 6).
Fig. 6. ToxPi visualization of the in vitro effects of energy drinks on human iPSC-derived cardiomyocytes.

Each pie chart consists of 4 phenotypes (positive chronotrope, red; negative chronotrope, pink; QT prolongation, blue; cytotoxicity, green). See SI File 11 for ToxPi output file. (For interpretation of the references to color in this figure legend, the reader is referred to the Web version of this article.)
Next, the quantitative data on four phenotypes was integrated using the Toxicological Prioritization Index (ToxPi) approach (Marvel et al., 2018) (Figs. 6 and SI File 11). When all data was used to compare the relative potency across energy drinks, RUNA was determined to be the most potent and C4 largely without effects. The higher relative ranking for other beverages was largely driven by one of the phenotypes, while RUNA demonstrated the highest potency in three phenotypes, except for the positive chronotropic effect.
3.3. Determining the likely bioactive ingredients in energy drinks
Because the chemical analysis showed that all tested beverages were highly complex substances (see Section 3.1), we conducted several analyses to determine whether identifiable or unknown ingredients may be responsible for the effects on cardiomyocytes. First, we used concentration addition modeling using the data on the amounts (Fig. 3) and effects (Fig. 5C) of 6 common ingredients to compare to the experimental-derived EC10,ED values for positive chronotropy, negative chronotropy, QT prolongation, and cytotoxicity (Fig. 7). Because most of the ingredients were inactive at the highest concentration, where the ingredient EC10,i is replaced by 100 μM, the derived additivity-based EC10,ED values are considered “lower bounds.” Indeed, for most tested beverages and phenotypes, the measured EC10,ED of the tested samples (solid circles) was higher than the concentration addition model predictions (open circles). This finding indicates that the effects of the 6 ingredients, if any, can fully account for the effects of the complex substances. However, there were several notable exceptions to this general observation. Specifically, even the “conservative” lower bound additivity-based EC10,ED for the effects of Kickstart and RUNA on the QT prolongation phenotype was higher than the observed EC10,ED, indicating that the additivity, even with “conservative” assumptions, substantially under-estimated these energy drink’s potency. This finding suggests that additional ingredients in those two energy drink types may be responsible for the overall effects of the whole sample.
Fig. 7. Measured and additivity-based points of departure (PODs).

For each energy drink, the measured PODs (solid circles) are compared to the minimum POD derived from concentration additivity of 6 quantified ingredients (open circles, with 95% CI). The additivity-based PODs are conservative “lower bounds” because a surrogate POD of 100 μM was used when ingredients were inactive at the highest tested concentration. If measured PODs < additivity-based PODs, then measured effects are inconsistent with being solely due to the declared ingredient components.
Second, we examined the associations among the chromatographic features and in vitro effects on cardiomyocytes using correlation testing a multivariate prediction model (Fig. 8). This analysis (Fig. 8A) revealed that 34 chromatographic features, about half of them unknown, have significant Pearson correlations (multiple testing-corrected, with false discovery q-value<0.05) with in vitro effects of energy drinks on cardiomyocytes. Most of the correlations were negative, consistent with the expected relationship of a higher abundance of a component eliciting lower POD in the in vitro test. Fig. 8B shows the relative abundance of those corresponding features across all tested beverages, creating a guide to generate hypotheses for specific ingredients that may be responsible for the unique effects of each energy drink. Next, we used the data on the chemical composition of each tested beverage to provide a cross-validated multivariate prediction model for its effect on human iPSC-derived cardiomyocytes. The overall prediction relationship was very strong for the vitro effects, using the collective chemical composition data (Fig. 8C). Specifically, by using semi-quantitative data on the abundance of the individual chemical ingredients, we were able to predict with high accuracy the overall adverse effect on cardiomyocytes (overall ToxPi), the effect on QT prolongation (QT prolongation ToxPi score) and even the EC10 for the QT prolongation, with correlations ranging from 0.75 to 0.94.
Fig. 8. Association of energy drink ingredients with in vitro measures of cardiomyocyte dysfunction.

(A) Features/compounds with at least one significant Pearson correlation with cardiotoxicity POD values (false discovery q < 0.05) are shown, as positive (blue) or negative (red). (B) Relative abundances for each feature, lines up with the corresponding ordering from panel (A). (C) For each phenotype or derived value (such as ToxPi scores) shown, the scatterplots show the predicted phenotype based on a multivariate regression prediction model. Each sample was held out in succession using leave-one-out cross validation for the fitted model, and then the fitted model was applied to produce a fitted value for the held-out point. (For interpretation of the references to color in this figure legend, the reader is referred to the Web version of this article.)
4. Discussion
Due to the growing popularity of energy drinks, the number of studies that investigate their potential unintended health effects is also increasing. A systematic literature search to collect, evaluate, and catalogue published studies on this topic (Fig. 1) identified cardiovascular system as a potential target for such effects. The associations between energy drink consumption and cardiovascular effects were identified in epidemiological studies (Bertoia et al., 2013; Grosso et al., 2016; Gunja and Brown, 2012; Kamijo et al., 2018), controlled clinical trials (Elitok et al., 2015; Fletcher et al., 2017; Gray et al., 2017; Kozik et al., 2016; Ragsdale et al., 2010; Svatikova et al., 2015), and through a large number of case reports (Berger and Alford, 2009; Kaoukis et al., 2012; Mattioli et al., 2018; Rottlaender et al., 2012; Scott et al., 2011; Shah et al., 2014). Overall, this body of evidence suggests that energy drinks, at least those that have been tested in the clinical trials and case reports, may have undesirable effects on hemodynamic parameters (e.g., blood pressure), heart rhythm (e.g., tachycardia), and ion channel activity (QT prolongation). Overall, the evidence for cardiovascular effects from studies in humans remains inconclusive as the controlled clinical trials were largely limited in the number of participants, tested only a limited number of energy drink types, and are difficult to compare directly as they employed different methods to evaluate the function of the cardiovascular system.
Some of the studies used in vitro models to assess the effects of energy drinks (Chaban et al., 2017; Doyle et al., 2012; Zeidan-Chulia et al., 2013) or their major ingredients, such as caffeine and taurine (Chaban et al., 2017); however, most of these studies were investigating effects on neuronal cell lineages, not cardiomyocytes. Chaban et al. (2017) showed that caffeine significantly altered the contractile behavior of the human myocardial tissue slices from the right atria, taurine did not have an effect, and there was no evidence of potentiation from taurine on the effects of caffeine. Human clinical trials indicated that the cardiovascular effects of energy drinks cannot be easily attributed to their common components such as caffeine and taurine (Basrai et al., 2019), and that additional study of non-caffeine ingredients within energy drinks is warranted (Fletcher et al., 2017). Given the complexity of composition of energy drinks, studies of the individual components in any model system, let alone human studies, are impractical. Therefore, we reasoned that to facilitate a comprehensive investigation of the potential effects of energy beverages on cardiovascular outcomes, a human in vitro model may be used, and, when coupled with chemical compositional analysis of these complex substances, yield important information on the ingredients that may pose hazard when included in these beverages.
Importantly, the complexity of chemical composition of energy drinks, which is largely unknown because of the proprietary nature of the formulations, is one of the primary impediments to studies of potential causative factors in purported adverse effects of these beverages on cardiovascular health. While the major common constituents of energy drinks are widely known and some of them, like caffeine and taurine, have been systematically investigated (Hu et al., 2018; Nguyen et al., 2019; Ricciutelli et al., 2014), little is known about other ingredients, especially those that may be derived from plants. Plant-derived ingredients and herbal medicines are widely acknowledged as highly variable in their composition (Catlin et al., 2018) which creates numerous challenges with assessment of their potential beneficial or detrimental human health effects.
In this study, we have taken a two-pronged approach to chemical characterization of the compositional complexity of the tested beverages. First, we used traditional targeted analytical chemistry to determine the presence and concentrations of the known ingredients. This approach resulted not only in the confirmation of the presence of those substances in tested beverages, but also yielded quantitative information for concentration addition modeling of the mixture effects. Second, we used an untargeted approach based on ion mobility spectrometry-mass spectrometry to resolve and potentially identify additional ingredients. While untargeted analytical methods present challenges with feature quantification and identification, we showed that the LC-IMS-MS method not only is highly accurate in quantifying caffeine content, but also can be used for relative quantification of other features and molecules of interest across samples – information that was used for the correlation analysis with in vitro effects to determine which ingredients may be responsible for the adverse events that we observed. Our analytical data are informative insofar they revealed many other ingredients in energy drinks. These include vitamins, amino acids, folic acid, specific sweeteners (e.g., rebaudioside analogues), and numerous ingredients derived from plant extracts (e.g., gingerol and theophylline). Even though the number of detectable chromatographic features that remain unknown exceeded those that we can identify with a degree of confidence, the information on their abundance can still be used as unique descriptor for subsequent chemical-biological correlation analyses.
With respect to the study of the potential adverse cardiac effects of the tested beverages, our use of a human clinically-relevant iPSC-derived cardiomyocytes represents an advance in studies of inter-relationships between nutrition and toxicology using in vitro techniques. This approach not only promotes the principles of replacement, reuse and refinement (3Rs) in toxicology, but also enables higher throughput for studies of multiple complex substances, as well as their key ingredients, in concentration-response. Recent studies of the individual chemicals or their metabolites (Chen et al., 2020; Grimm et al., 2020; Sirenko et al., 2017), complex substances (Grimm et al., 2016; House et al., 2020), and environmental samples (Chen et al., 2021) showed that human iPSC-derived cardiomyocytes can be effectively used for bioactivity-based similarity grouping and hazard identification.
We found that some energy drinks had effects on beating peak frequency and QT interval in human iPSC-derived cardiomyocytes. Interestingly, no positive chronotropic effect or QT prolongation was observed in cardiomyocytes treated with caffeine alone. These data are concordant with the results from a randomized controlled trial, where the overconsumption of an energy drink resulted in increases in the corrected QT interval and systolic blood pressure when compared with caffeine alone (Fletcher et al., 2017). Even though caffeine overdose may lead to tachycardia, it appeared that the exposure to energy drinks at a comparable caffeine level results in more pronounced effects. Still, most notable finding in our study is that QT prolongation was the most sensitive endpoint among the in vitro effects of energy drinks. These data provide additional support to findings of QT prolongation following energy drink consumption in clinical trials (Fletcher et al., 2017; Gray et al., 2017; Kozik et al., 2016) and case reports. The QT prolongation and T-wave abnormalities on the electrocardiogram are two key characteristics for clinical long QT syndrome (Shah et al., 2019b), a life-threatening arrhythmia syndrome that can result in sudden death, especially in young adolescents. Because human iPSC-derived cardiomyocytes have been shown to recapitulate the QT prolongation effects of several drugs (Blanchette et al., 2019), our findings raise additional concerns about the safety of unregulated energy drink consumption in the general population.
We also found great heterogeneity in the effects of tested energy drinks on cardiac phenotypes in vitro. On the one hand, this finding is not surprising given the wide compositional diversity of these beverages as determined from the analytical chemistry analysis. On the other hand, the heterogeneity of both composition and effects presented an opportunity to explore potential associations between ingredients and adverse effects on cardiomyocytes. The concentration addition modeling of the effects of tested energy drinks using quantitative data on 6 known ingredients showed that only several tested beverages contain ingredients that may have adverse effects not accounted for by the model. Specifically, the modeling underestimated the effects on QT prolongation for RUNA, Kickstart, Monster Energy, Kill Cliff, CELSIUS HEAT, and EBOOST. Through correlation analysis, we identified several identifiable ingredients or unknown components that may be responsible for the in vitro effects on cardiomyocytes. For instance, unknown features P28 (m/z = 249.1803, CCS = 163.11 Å2), N46 (m/z = 366.109, CCS = 174.48 Å2), and P105 (m/z = 455.1279, CCS = 220.03 Å2) were associated with positive chronotropy. With respect to the effects on QT prolongation in vitro, we found that colorants rebaudioside B/C/D, 25-hydroxycholecalciferol, 3-hydroxybenzaldehyde, theophylline, D-gluconate, adenine, folic acid, and azelate showed the strongest associations. For most of these identifiable ingredients, there are no reports of the potential adverse effects on QT prolongation. Limited evidence of the potential cardiac effects is available for theophylline, adenine and azelate. One study showed that the combined use of a beta-adrenergic agonist drug and theophylline may increase the number of ventricular premature beats (Coleman et al., 1986). The precursor of adenine, adenosine, was shown to induce QT prolongation and the reduction of the heart rate in rats (Kalkan et al., 2012). In addition, azelaic acid is an inhibitor of thioredoxin reductase which is cardioprotective (Das et al., 2020; Satoh et al., 2007). Our data also suggest that folic acid and 5-aminoimidazole-4-carboxamide ribonucleotide (AICAR) may contribute to QT prolongation by some energy drinks. However, this finding is inconsistent with studies of cardioprotective effects of folic acid (Ahmad et al., 2017) and AICAR (Moopanar et al., 2006; Viglino et al., 2019). Further analytical characterization of the presence of these ingredients, and studies of their in vitro effects are warranted to narrow the list of potential bioactive ingredients.
We note that this study has limitations. First, even though we investigated a wide range of energy drinks, the number of tested samples is still small as compared to the number of brands and variations of such beverages within each brand. This limitation may be addressed through testing of additional samples using the methods presented in our study and would allow for improved correlation analysis and grouping of complex substances based on their chemical and biological profiles. Second, these beverages vary in their acidity and careful pH adjustment was necessary prior to in vitro testing. The amounts of sodium present in various samples following the use of NaOH for pH adjustments may vary and may represent an important confounder. While sodium may have an impact on cardiomyocytes, we found no correlation between the effects on cardiomyocytes and original pH in tested energy drinks. Third, structural isomers may exist for the features identified based on m/z alone, which would result in imprecise chemical annotations. Finally, we note that, although the multivariate prediction modeling identified specific components that appeared to be predictive of in vitro phenotypes, such an analysis cannot distinguish causation from mere correlation, e.g. due to components that are themselves highly correlated, or features that were unobserved due to detection limitations. Nonetheless, such a prediction model might be of use as a screening tool for potential adverse effects.
These limitations notwithstanding, this study presents a comprehensive evaluation of the chemical composition and in vitro cardiac effects of energy drinks. Our data shed light on the potential bioactive ingredients in energy drinks that may have adverse effects on cardiovascular health. Further studies and quantitative analyses on the newly identified, bioactive ingredients are warranted to ensure their safe consumption by consumers, especially those with pre-existing health conditions associated with cardiovascular events.
Supplementary Material
Acknowledgments
Funding
This work was funded, in part, by a cooperative agreement with the United States Environmental Protection Agency (STAR RD83580201). The views expressed in this manuscript do not reflect those of the funding agency. The use of specific commercial products in this work does not constitute endorsement by the authors or the funding agencies.
Footnotes
Declaration of competing interest
The authors declare that they have no known competing financial interests or personal relationships that could have appeared to influence the work reported in this paper.
Appendix A. Supplementary data
Supplementary data to this article can be found online at https://doi.org/10.1016/j.fct.2021.111979.
References
- Ahmad S, Panda BP, Kohli K, Fahim M, Dubey K, 2017. Folic acid ameliorates celecoxib cardiotoxicity in a doxorubicin heart failure rat model. Pharm. Biol 55, 1295–1303. [DOI] [PMC free article] [PubMed] [Google Scholar]
- Ali F, Rehman H, Babayan Z, Stapleton D, Joshi DD, 2015. Energy drinks and their adverse health effects: a systematic review of the current evidence. Postgrad. Med 127, 308–322. [DOI] [PubMed] [Google Scholar]
- Analytics Allied, 2019. Energy Drinks Market by Type and End User: Global Opportunity Analysis and Industry Forecast, vols. 2019–2026, p. 186. [Google Scholar]
- Ballard SL, Wellborn-Kim JJ, Clauson KA, 2010. Effects of commercial energy drink consumption on athletic performance and body composition. Phys Sportsmed 38, 107–117. [DOI] [PubMed] [Google Scholar]
- Basrai M, Schweinlin A, Menzel J, Mielke H, Weikert C, Dusemund B, Putze K, Watzl B, Lampen A, Bischoff SC, 2019. Energy drinks induce acute cardiovascular and metabolic changes pointing to potential risks for young adults: a randomized controlled trial. J. Nutr 149, 441–450. [DOI] [PubMed] [Google Scholar]
- Baum M, Weiss M, 2001. The influence of a taurine containing drink on cardiac parameters before and after exercise measured by echocardiography. Amino Acids 20, 75–82. [DOI] [PubMed] [Google Scholar]
- Belzile D, Cinq-Mars A, Bernier M, Leblanc MH, Bourgault C, Morin J, Laflamme M, Charbonneau E, Senechal M, 2020. Do energy drinks really give you wings? Left ventricular assist device therapy as a bridge to recovery for an energy drink-induced cardiomyopathy. Can. J. Cardiol 36. [DOI] [PubMed] [Google Scholar]
- Benjamini Y, Hochberg Y, 1995. Controlling the false discovery rate - a practical and powerful approach to multiple testing. J. Roy. Stat. Soc. B 57, 289–300. [Google Scholar]
- Berger AJ, Alford K, 2009. Cardiac arrest in a young man following excess consumption of caffeinated “energy drinks. Med. J. Aust 190, 41–43. [DOI] [PubMed] [Google Scholar]
- Bertoia ML, Triche EW, Michaud DS, Baylin A, Hogan JW, Neuhouser ML, Freiberg MS, Allison MA, Safford MM, Li W, Mossavar-Rahmani Y, Rosal MC, Eaton CB, 2013. Long-term alcohol and caffeine intake and risk of sudden cardiac death in women. Am. J. Clin. Nutr 97, 1356–1363. [DOI] [PMC free article] [PubMed] [Google Scholar]
- Blanchette AD, Burnett SD, Grimm FA, Rusyn I, Chiu WA, 2020. A Bayesian method for population-wide cardiotoxicity hazard and risk characterization using an in vitro human model. Toxicol. Sci 178, 391–403. [DOI] [PMC free article] [PubMed] [Google Scholar]
- Blanchette AD, Grimm FA, Dalaijamts C, Hsieh NH, Ferguson K, Luo YS, Rusyn I, Chiu WA, 2019. Thorough QT/QTc in a dish: an in vitro human model that accurately predicts clinical concentration-QTc relationships. Clin. Pharmacol. Ther 105, 1175–1186. [DOI] [PMC free article] [PubMed] [Google Scholar]
- Burnett SD, Blanchette AD, Grimm FA, House JS, Reif DM, Wright FA, Chiu WA, Rusyn I, 2019. Population-based toxicity screening in human induced pluripotent stem cell-derived cardiomyocytes. Toxicol. Appl. Pharmacol 381, 114711. [DOI] [PMC free article] [PubMed] [Google Scholar]
- Campbell B, Wilborn C, La Bounty P, Taylor L, Nelson MT, Greenwood M, Ziegenfuss TN, Lopez HL, Hoffman JR, Stout JR, Schmitz S, Collins R, Kalman DS, Antonio J, Kreider RB, 2013. International Society of Sports Nutrition position stand: energy drinks. J Int Soc Sports Nutr 10, 1. [DOI] [PMC free article] [PubMed] [Google Scholar]
- Catlin NR, Collins BJ, Auerbach SS, Ferguson SS, Harnly JM, Gennings C, Waidyanatha S, Rice GE, Smith-Roe SL, Witt KL, Rider CV, 2018. How similar is similar enough? A sufficient similarity case study with Ginkgo biloba extract. Food Chem. Toxicol 118, 328–339. [DOI] [PMC free article] [PubMed] [Google Scholar]
- Chaban R, Kornberger A, Branski N, Buschmann K, Stumpf N, Beiras-Fernandez A, Vahl CF, 2017. In-vitro examination of the positive inotropic effect of caffeine and taurine, the two most frequent active ingredients of energy drinks. BMC Cardiovasc. Disord 17, 220. [DOI] [PMC free article] [PubMed] [Google Scholar]
- Chen Z, Liu Y, Wright FA, Chiu WA, Rusyn I, 2020. Rapid hazard characterization of environmental chemicals using a compendium of human cell lines from different organs. ALTEX 37, 623–638. [DOI] [PMC free article] [PubMed] [Google Scholar]
- Chen Z, Lloyd D, Zhou YH, Chiu WA, Wright FA, Rusyn I, 2021. Risk characterization of environmental samples using in vitro bioactivity and polycyclic aromatic hydrocarbon (PAH) concentrations data. Toxicol. Sci 179, 108–120. [DOI] [PMC free article] [PubMed] [Google Scholar]
- Chiu WA, Wright FA, Rusyn I, 2017. A tiered, Bayesian approach to estimating of population variability for regulatory decision-making. ALTEX 34, 377–388. [DOI] [PMC free article] [PubMed] [Google Scholar]
- Cohen JD, Babiarz JE, Abrams RM, Guo L, Kameoka S, Chiao E, Taunton J, Kolaja KL, 2011. Use of human stem cell derived cardiomyocytes to examine sunitinib mediated cardiotoxicity and electrophysiological alterations. Toxicol. Appl. Pharmacol 257, 74–83. [DOI] [PMC free article] [PubMed] [Google Scholar]
- Coleman JJ, Vollmer WM, Barker AF, Schultz GE, Buist AS, 1986. Cardiac-arrhythmias during the combined use of beta-adrenergic agonist drugs and theophylline. Chest 90, 45–51. [DOI] [PubMed] [Google Scholar]
- Das KC, Muniyappa H, Kundumani-Sridharan V, Subramani J, 2020. Thioredoxin decreases anthracycline cardiotoxicity, but sensitizes cancer cell apoptosis. Cardiovasc. Toxicol 10.1007/s12012-020-09605-2. [DOI] [PMC free article] [PubMed] [Google Scholar]
- De Sanctis V, Soliman N, Soliman AT, Elsedfy H, Di Maio S, El Kholy M, Fiscina B, 2017. Caffeinated energy drink consumption among adolescents and potential health consequences associated with their use: a significant public health hazard. Acta Biomed 88, 222–231. [DOI] [PMC free article] [PubMed] [Google Scholar]
- Dodds JN, Baker ES, 2019. Ion mobility spectrometry: fundamental concepts, instrumentation, applications, and the road ahead. J. Am. Soc. Mass Spectrom 30, 2185–2195. [DOI] [PMC free article] [PubMed] [Google Scholar]
- Doyle W, Shide E, Thapa S, Chandrasekaran V, 2012. The effects of energy beverages on cultured cells. Food Chem. Toxicol 50, 3759–3768. [DOI] [PubMed] [Google Scholar]
- Dwaidy J, Dwaidy A, Hasan H, Kadry S, Balusamy B, 2018. Survey of energy drink consumption and adverse health effects in Lebanon. Health Inf. Sci. Syst 6, 15. [DOI] [PMC free article] [PubMed] [Google Scholar]
- Egashira T, Yuasa S, Suzuki T, Aizawa Y, Yamakawa H, Matsuhashi T, Ohno Y, Tohyama S, Okata S, Seki T, Kuroda Y, Yae K, Hashimoto H, Tanaka T, Hattori F, Sato T, Miyoshi S, Takatsuki S, Murata M, Kurokawa J, Furukawa T, Makita N, Aiba T, Shimizu W, Horie M, Kamiya K, Kodama I, Ogawa S, Fukuda K, 2012. Disease characterization using LQTS-specific induced pluripotent stem cells. Cardiovasc. Res 95, 419–429. [DOI] [PubMed] [Google Scholar]
- Elitok A, Oz F, Panc C, Sarikaya R, Sezikli S, Pala Y, Bugan OS, Ates M, Parildar H, Ayaz MB, Atici A, Oflaz H, 2015. Acute effects of Red Bull energy drink on ventricular repolarization in healthy young volunteers: a prospective study. Anatol. J. Cardiol 15, 919–922. [DOI] [PMC free article] [PubMed] [Google Scholar]
- Enriquez A, Frankel DS, 2017. Arrhythmogenic effects of energy drinks. J. Cardiovasc. Electrophysiol 28, 711–717. [DOI] [PubMed] [Google Scholar]
- Fletcher EA, Lacey CS, Aaron M, Kolasa M, Occiano A, Shah SA, 2017. Randomized controlled trial of high-volume energy drink versus caffeine consumption on ECG and hemodynamic parameters. J Am Heart Assoc 6, e004448. [DOI] [PMC free article] [PubMed] [Google Scholar]
- Franks AM, Schmidt JM, McCain KR, Fraer M, 2012. Comparison of the effects of energy drink versus caffeine supplementation on indices of 24-hour ambulatory blood pressure. Ann. Pharmacother 46, 192–199. [DOI] [PubMed] [Google Scholar]
- Gelman A, Goodrich B, Gabry J, Vehtari A, 2019. R-squared for Bayesian regression models. Am. Statistician 73, 307–309. [Google Scholar]
- Grasser EK, Miles-Chan JL, Charriere N, Loonam CR, Dulloo AG, Montani JP, 2016. Energy drinks and their impact on the cardiovascular system: potential mechanisms. Adv Nutr 7, 950–960. [DOI] [PMC free article] [PubMed] [Google Scholar]
- Grasser EK, Yepuri G, Dulloo AG, Montani JP, 2014. Cardio- and cerebrovascular responses to the energy drink Red Bull in young adults: a randomized cross-over study. Eur. J. Nutr 53, 1561–1571. [DOI] [PMC free article] [PubMed] [Google Scholar]
- Gray B, Ingles J, Medi C, Driscoll T, Semsarian C, 2017. Cardiovascular effects of energy drinks in familial long QT syndrome: a randomized cross-over study. Int. J. Cardiol 231, 150–154. [DOI] [PubMed] [Google Scholar]
- Grimm FA, Iwata Y, Sirenko O, Bittner M, Rusyn I, 2015. High-content assay multiplexing for toxicity screening in induced pluripotent stem cell-derived cardiomyocytes and hepatocytes. Assay Drug Dev. Technol 13, 529–546. [DOI] [PMC free article] [PubMed] [Google Scholar]
- Grimm FA, Iwata Y, Sirenko O, Chappell GA, Wright FA, Reif DM, Braisted J, Gerhold DL, Yeakley JM, Shepard P, Seligmann B, Roy T, Boogaard PJ, Ketelslegers HB, Rohde AM, Rusyn I, 2016. A chemical-biological similarity-based grouping of complex substances as a prototype approach for evaluating chemical alternatives. Green Chem 18, 4407–4419. [DOI] [PMC free article] [PubMed] [Google Scholar]
- Grimm FA, Klaren WD, Li X, Lehmler HJ, Karmakar M, Robertson LW, Chiu WA, Rusyn I, 2020. Cardiovascular effects of polychlorinated biphenyls and their major metabolites. Environ. Health Perspect 128, 77008. [DOI] [PMC free article] [PubMed] [Google Scholar]
- Grosso G, Stepaniak U, Polak M, Micek A, Topor-Madry R, Stefler D, Szafraniec K, Pajak A, 2016. Coffee consumption and risk of hypertension in the Polish arm of the HAPIEE cohort study. Eur. J. Clin. Nutr 70, 109–115. [DOI] [PMC free article] [PubMed] [Google Scholar]
- Gunja N, Brown JA, 2012. Energy drinks: health risks and toxicity. Med. J. Aust 196, 46–49. [DOI] [PubMed] [Google Scholar]
- Guo L, Abrams RM, Babiarz JE, Cohen JD, Kameoka S, Sanders MJ, Chiao E, Kolaja KL, 2011. Estimating the risk of drug-induced proarrhythmia using human induced pluripotent stem cell-derived cardiomyocytes. Toxicol. Sci 123, 281–289. [DOI] [PubMed] [Google Scholar]
- Hajsadeghi S, Mohammadpour F, Manteghi MJ, Kordshakeri K, Tokazebani M, Rahmani E, Hassanzadeh M, 2016. Effects of energy drinks on blood pressure, heart rate, and electrocardiographic parameters: an experimental study on healthy young adults. Anatol. J. Cardiol 16, 94–99. [DOI] [PMC free article] [PubMed] [Google Scholar]
- Heckman MA, Sherry K, de Mejia EG, 2010. Energy drinks: an assessment of their market size, consumer demographics, ingredient profile, functionality, and regulations in the United States. Compr Rev Food Sci F 9, 303–317. [DOI] [PubMed] [Google Scholar]
- House JS, Grimm FA, Klaren WD, Dalzell A, Kuchi S, Zhang SD, Lenz K, Boogaard PJ, Ketelslegers HB, Gant TW, Wright FA, Rusyn I, 2020. Grouping of UVCB substances with new approach methodologies (NAMs) data. ALTEX [DOI] [PMC free article] [PubMed] [Google Scholar]
- Hsieh NH, Chen Z, Rusyn I, Chiu WA, 2021. Risk characterization and probabilistic concentration-response modeling of complex environmental mixtures using new approach methodologies (NAMs) data from organotypic in vitro human stem cell assays. Environ. Health Perspect 129, 17004. [DOI] [PMC free article] [PubMed] [Google Scholar]
- Hu Y, Wu HL, Yin XL, Gu HW, Xiao R, Xie LX, Liu Z, Fang H, Wang L, Yu RQ, 2018. Rapid and interference-free analysis of nine B-group vitamins in energy drinks using trilinear component modeling of liquid chromatography-mass spectrometry data. Talanta 180, 108–119. [DOI] [PubMed] [Google Scholar]
- Huang HP, Chen PH, Hwu WL, Chuang CY, Chien YH, Stone L, Chien CL, Li LT, Chiang SC, Chen HF, Ho HN, Chen CH, Kuo HC, 2011. Human Pompe disease-induced pluripotent stem cells for pathogenesis modeling, drug testing and disease marker identification. Hum. Mol. Genet 20, 4851–4864. [DOI] [PubMed] [Google Scholar]
- Huxtable R, Bressler R, 1974. Taurine concentrations in congestive heart failure. Science 184, 1187–1188. [DOI] [PubMed] [Google Scholar]
- IARC, 2018. Drinking Coffee, Mate, and Very Hot Beverages. International Agency for Research on Cancer , World Health Organization, Lyon, France. [PubMed] [Google Scholar]
- Itzhaki I, Maizels L, Huber I, Zwi-Dantsis L, Caspi O, Winterstern A, Feldman O, Gepstein A, Arbel G, Hammerman H, Boulos M, Gepstein L, 2011. Modelling the long QT syndrome with induced pluripotent stem cells. Nature 471, 225–229. [DOI] [PubMed] [Google Scholar]
- Kalkan S, Hocaoglu N, Oransay K, Buyukdeligoz M, Tuncok Y, 2012. Adenosine-mediated cardiovascular toxicity in amitriptyline-poisoned rats. Drug Chem. Toxicol 35, 423–431. [DOI] [PubMed] [Google Scholar]
- Kamijo Y, Takai M, Fujita Y, Usui K, 2018. A retrospective study on the epidemiological and clinical features of emergency patients with large or massive consumption of caffeinated supplements or energy drinks in Japan. Intern Med 57, 2141–2146. [DOI] [PMC free article] [PubMed] [Google Scholar]
- Kaoukis A, Panagopoulou V, Mojibian HR, Jacoby D, 2012. Reverse Takotsubo cardiomyopathy associated with the consumption of an energy drink. Circulation 125, 1584–1585. [DOI] [PubMed] [Google Scholar]
- Kozik TM, Shah S, Bhattacharyya M, Franklin TT, Connolly TF, Chien W, Charos GS, Pelter MM, 2016. Cardiovascular responses to energy drinks in a healthy population: the C-energy study. Am. J. Emerg. Med 34, 1205–1209. [DOI] [PubMed] [Google Scholar]
- Ma J, Guo L, Fiene SJ, Anson BD, Thomson JA, Kamp TJ, Kolaja KL, Swanson BJ, January CT, 2011. High purity human-induced pluripotent stem cell-derived cardiomyocytes: electrophysiological properties of action potentials and ionic currents. Am. J. Physiol. Heart Circ. Physiol 301, H2006–H2017. [DOI] [PMC free article] [PubMed] [Google Scholar]
- Majeed F, Yar T, Alsunni A, Alhawaj AF, AlRahim A, Alzaki M, 2017. Synergistic effect of energy drinks and overweight/obesity on cardiac autonomic testing using the Valsalva maneuver in university students. Ann. Saudi Med 37, 181–188. [DOI] [PMC free article] [PubMed] [Google Scholar]
- Mangi MA, Rehman H, Rafique M, Illovsky M, 2017. Energy drinks and the risk of cardiovascular disease: a review of current literature. Cureus 9, e1322. [DOI] [PMC free article] [PubMed] [Google Scholar]
- Mansour B, Amarah W, Nasralla E, Elias N, 2019. Energy drinks in children and adolescents: demographic data and immediate effects. Eur. J. Pediatr 178, 649–656. [DOI] [PubMed] [Google Scholar]
- Marvel SW, To K, Grimm FA, Wright FA, Rusyn I, Reif DM, 2018. ToxPi Graphical User Interface 2.0: dynamic exploration, visualization, and sharing of integrated data models. BMC Bioinf 19, 80. [DOI] [PMC free article] [PubMed] [Google Scholar]
- Mattioli AV, Pennella S, Farinetti A, Manenti A, 2018. Energy Drinks and atrial fibrillation in young adults. Clin Nutr 37, 1073–1074. [DOI] [PubMed] [Google Scholar]
- Mattioli AV, Pennella S, Manenti A, Farinetti A, 2016. Energy drink overconsumption can trigger atrial fibrillation. J. Cardiovasc. Med 17, 902–903. [DOI] [PubMed] [Google Scholar]
- Miles-Chan JL, Charriere N, Grasser EK, Montani JP, Dulloo AG, 2015. The blood pressure-elevating effect of Red Bull energy drink is mimicked by caffeine but through different hemodynamic pathways. Phys. Rep 3, e12290. [DOI] [PMC free article] [PubMed] [Google Scholar]
- Miller KE, Dermen KH, Lucke JF, 2018. Caffeinated energy drink use by US adolescents aged 13–17: a national profile. Psychol. Addict. Behav 32, 647–659. [DOI] [PMC free article] [PubMed] [Google Scholar]
- Monge ME, Dodds JN, Baker ES, Edison AS, Fernandez FM, 2019. Challenges in identifying the dark molecules of life. Annu. Rev. Anal. Chem 12, 177–199. [DOI] [PMC free article] [PubMed] [Google Scholar]
- Moopanar TR, Xiao XH, Jiang LL, Chen ZP, Kemp BE, Allen DG, 2006. AICAR inhibits the Na+/H+ exchanger in rat hearts - possible contribution to cardioprotection. Pflug Arch Eur J Phy 453, 147–156. [DOI] [PubMed] [Google Scholar]
- Nguyen TD, Nguyen MH, Vu MT, Duong HA, Pham HV, Mai TD, 2019. Dual-channeled capillary electrophoresis coupled with contactless conductivity detection for rapid determination of choline and taurine in energy drinks and dietary supplements. Talanta 193, 168–175. [DOI] [PubMed] [Google Scholar]
- Osman H, Tabatabai S, Korashy M, Hussein M, 2019. Caffeinated energy drink induced ventricular fibrillation: the price for overexcitement. Cureus 11, e6358. [DOI] [PMC free article] [PubMed] [Google Scholar]
- Picache JA, Rose BS, Balinski A, Leaptrot KL, Sherrod SD, May JC, McLean JA, 2019. Collision cross section compendium to annotate and predict multi-omic compound identities. Chem. Sci 10, 983–993. [DOI] [PMC free article] [PubMed] [Google Scholar]
- Pomeranz JL, Munsell CR, Harris JL, 2013. Energy drinks: an emerging public health hazard for youth. J. Publ. Health Pol 34, 254–271. [DOI] [PubMed] [Google Scholar]
- Pound CM, Blair B, Canadian Paediatric Society N, Gastroenterology Committee OO, 2017. Energy and sports drinks in children and adolescents. Paediatr. Child Health 22, 406–410. [DOI] [PMC free article] [PubMed] [Google Scholar]
- Ragsdale FR, Gronli TD, Batool N, Haight N, Mehaffey A, McMahon EC, Nalli TW, Mannello CM, Sell CJ, McCann PJ, Kastello GM, Hooks T, Wilson T, 2010. Effect of Red Bull energy drink on cardiovascular and renal function. Amino Acids 38, 1193–1200. [DOI] [PubMed] [Google Scholar]
- Ricciutelli M, Caprioli G, Cortese M, Lombardozzi A, Strano M, Vittori S, Sagratini G, 2014. Simultaneous determination of taurine, glucuronolactone and glucuronic acid in energy drinks by ultra high performance liquid chromatography-tandem mass spectrometry (triple quadrupole). J. Chromatogr. A 1364, 303–307. [DOI] [PubMed] [Google Scholar]
- Rottlaender D, Motloch LJ, Reda S, Larbig R, Hoppe UC, 2012. Cardiac arrest due to long QT syndrome associated with excessive consumption of energy drinks. Int. J. Cardiol 158, E51–E52. [DOI] [PubMed] [Google Scholar]
- Sanchis-Gomar F, Leischik R, Lippi G, 2016. Energy drinks: increasing evidence of negative cardiovascular effects. Int. J. Cardiol 206, 153. [DOI] [PubMed] [Google Scholar]
- Satoh M, Matter CM, Ogita H, Takeshita K, Wang CY, Dorn GW 2nd, Liao JK, 2007. Inhibition of apoptosis-regulated signaling kinase-1 and prevention of congestive heart failure by estrogen. Circulation 115, 3197–3204. [DOI] [PMC free article] [PubMed] [Google Scholar]
- Sattari M, Sattari A, Kazory A, 2016. Energy drink consumption and cardiac complications: a case for caution. J. Addiction Med 10, 280–282. [DOI] [PubMed] [Google Scholar]
- Schaffer SW, Shimada K, Jong CJ, Ito T, Azuma J, Takahashi K, 2014. Effect of taurine and potential interactions with caffeine on cardiovascular function. Amino Acids 46, 1147–1157. [DOI] [PubMed] [Google Scholar]
- Scott MJ, El-Hassan M, Khan AA, 2011. Myocardial infarction in a young adult following the consumption of a caffeinated energy drink. BMJ Case Rep 2011, bcr0220113854. [DOI] [PMC free article] [PubMed] [Google Scholar]
- Shah SA, Lacey CS, Bergendahl T, Kolasa M, Riddock IC, 2014. QTc interval prolongation with high dose energy drink consumption in a healthy volunteer. Int. J. Cardiol 172, e336–337. [DOI] [PubMed] [Google Scholar]
- Shah SA, Szeto AH, Farewell R, Shek A, Fan D, Quach KN, Bhattacharyya M, Elmiari J, Chan W, O’Dell K, Nguyen N, McGaughey TJ, Nasir JM, Kaul S, 2019a. Impact of high volume energy drink consumption on electrocardiographic and blood pressure parameters: a randomized trial. J Am Heart Assoc 8, e011318. [DOI] [PMC free article] [PubMed] [Google Scholar]
- Shah SR, Park K, Alweis R, 2019b. Long QT syndrome: a comprehensive review of the literature and current evidence. Curr. Probl. Cardiol 44, 92–106. [DOI] [PubMed] [Google Scholar]
- Shapiro AJ, Antoni S, Guyton KZ, Lunn RM, Loomis D, Rusyn I, Jahnke GD, Schwingl PJ, Mehta SS, Addington J, Guha N, 2018. Software tools to facilitate systematic review used for cancer hazard identification. Environ. Health Perspect 126, 104501. [DOI] [PMC free article] [PubMed] [Google Scholar]
- Sirenko O, Crittenden C, Callamaras N, Hesley J, Chen YW, Funes C, Rusyn I, Anson B, Cromwell EF, 2013a. Multiparameter in vitro assessment of compound effects on cardiomyocyte physiology using iPSC cells. J. Biomol. Screen 18, 39–53. [DOI] [PubMed] [Google Scholar]
- Sirenko O, Cromwell EF, Crittenden C, Wignall JA, Wright FA, Rusyn I, 2013b. Assessment of beating parameters in human induced pluripotent stem cells enables quantitative in vitro screening for cardiotoxicity. Toxicol. Appl. Pharmacol 273, 500–507. [DOI] [PMC free article] [PubMed] [Google Scholar]
- Sirenko O, Grimm FA, Ryan KR, Iwata Y, Chiu WA, Parham F, Wignall JA, Anson B, Cromwell EF, Behl M, Rusyn I, Tice RR, 2017. In vitro cardiotoxicity assessment of environmental chemicals using an organotypic human induced pluripotent stem cell-derived model. Toxicol. Appl. Pharmacol 322, 60–74. [DOI] [PMC free article] [PubMed] [Google Scholar]
- Somers KR, Svatikova A, 2020. Cardiovascular and autonomic responses to energy drinks-clinical implications. J. Clin. Med 9, 431. [DOI] [PMC free article] [PubMed] [Google Scholar]
- Souza DB, Del Coso J, Casonatto J, Polito MD, 2017. Acute effects of caffeine-containing energy drinks on physical performance: a systematic review and meta-analysis. Eur. J. Nutr 56, 13–27. [DOI] [PubMed] [Google Scholar]
- Statista, 2020. Energy Drink Sales in the United States from 2015 to 2019 Statista. [Google Scholar]
- Sun N, Yazawa M, Liu J, Han L, Sanchez-Freire V, Abilez OJ, Navarrete EG, Hu S, Wang L, Lee A, Pavlovic A, Lin S, Chen R, Hajjar RJ, Snyder MP, Dolmetsch RE, Butte MJ, Ashley EA, Longaker MT, Robbins RC, Wu JC, 2012. Patient-specific induced pluripotent stem cells as a model for familial dilated cardiomyopathy. Sci. Transl. Med 4, 130ra147. [DOI] [PMC free article] [PubMed] [Google Scholar]
- Svatikova A, Covassin N, Somers KR, Somers KV, Soucek F, Kara T, Bukartyk J, 2015. A randomized trial of cardiovascular responses to energy drink consumption in healthy adults. J. Am. Med. Assoc 314, 2079–2082. [DOI] [PubMed] [Google Scholar]
- Tomcsanyi J, Javor K, 2015. [Excessive energy drink consumption caused marked QT prolongation. Case report]. Orv. Hetil 156, 1758–1760. [DOI] [PubMed] [Google Scholar]
- Turnbull D, Rodricks JV, Mariano GF, Chowdhury F, 2017. Caffeine and cardiovascular health. Regul. Toxicol. Pharmacol. : RTP (Regul. Toxicol. Pharmacol.) 89, 165–185. [DOI] [PubMed] [Google Scholar]
- Viglino C, Foglia B, Montessuit C, 2019. Chronic AICAR treatment prevents metabolic changes in cardiomyocytes exposed to free fatty acids. Pflügers Archiv 471, 1219–1234. [DOI] [PubMed] [Google Scholar]
- Wajih Ullah M, Lakhani S, Siddiq W, Handa A, Kahlon Y, Siddiqui T, 2018. Energy drinks and myocardial infarction. Cureus 10, e2658. [DOI] [PMC free article] [PubMed] [Google Scholar]
- Zeidan-Chulia F, Gelain DP, Kolling EA, Rybarczyk-Filho JL, Ambrosi P, Terra SR, Pires AS, da Rocha JB, Behr GA, Moreira JC, 2013. Major components of energy drinks (caffeine, taurine, and guarana) exert cytotoxic effects on human neuronal SH-SY5Y cells by decreasing reactive oxygen species production. Oxid Med Cell Longev 2013, 791795. [DOI] [PMC free article] [PubMed] [Google Scholar]
Associated Data
This section collects any data citations, data availability statements, or supplementary materials included in this article.