Abstract
Although elevated plasma interleukin-8 (pIL8) has been associated with poor outcome to immune checkpoint blockade (ICB),1 this has not been comprehensively evaluated in large randomized studies. Here we analyzed circulating pIL8, and IL8 gene expression in peripheral blood mononuclear cells (PBMCs) and tumors of patients treated with atezolizumab (anti-PD-L1 mAb) from multiple randomized trials representing 1445 patients with metastatic urothelial carcinoma (mUC) and metastatic renal cell carcinoma (mRCC). High levels of IL8 in plasma, PBMCs, and tumors were associated with decreased efficacy of atezolizumab in mUC and mRCC patients, even in tumors that were classically CD8+ T cell inflamed. Low baseline pIL8 in mUC patients was associated with increased response to atezolizumab and chemotherapy. mUC patients who experienced on-treatment decrease in pIL8 exhibited improved overall survival when treated with atezolizumab but not with chemotherapy. Single-cell RNASeq (scRNAseq) of the immune compartment showed that IL8 is primarily expressed in circulating and intratumoral myeloid cells and that high IL8 expression is associated with downregulation of the antigen presentation machinery. Therapies that can reverse the impacts of IL8-mediated myeloid inflammation will be essential for improving outcomes of patients treated with immune checkpoint inhibitors.
While there is broad clinical evidence for the role of T cells in mediating anti-tumor immunity and clinical outcome to ICB, the role of myeloid cells is poorly characterized. Myeloid inflammation has been associated with poor outcomes to ICB in diseases such as renal cell carcinoma (RCC)2–6. IL8 (CXCL8) is a pro-inflammatory chemokine and a chemoattractant for myeloid leukocytes and induces neutrophil degranulation.7 IL8 may also enhance tumor cell growth and metastasis through multiple mechanisms, including epithelial-to-mesenchymal transition,8 angiogenesis,9 formation of neutrophil extracellular traps,10 and infiltration of immunosuppressive and pro-tumorigenic myeloid inflammatory cells that suppress anti-tumor cytotoxic T-cell functions.9 It was recently reported that elevated plasma IL8 (pIL8) was associated with reduced response to PD-1 blockade in small cohorts of melanoma and non-small cell lung cancer (NSCLC) patients.1,11 However, the effects of baseline or on-treatment changes in pIL8 on outcomes of ICB have not been evaluated in large randomized trials.
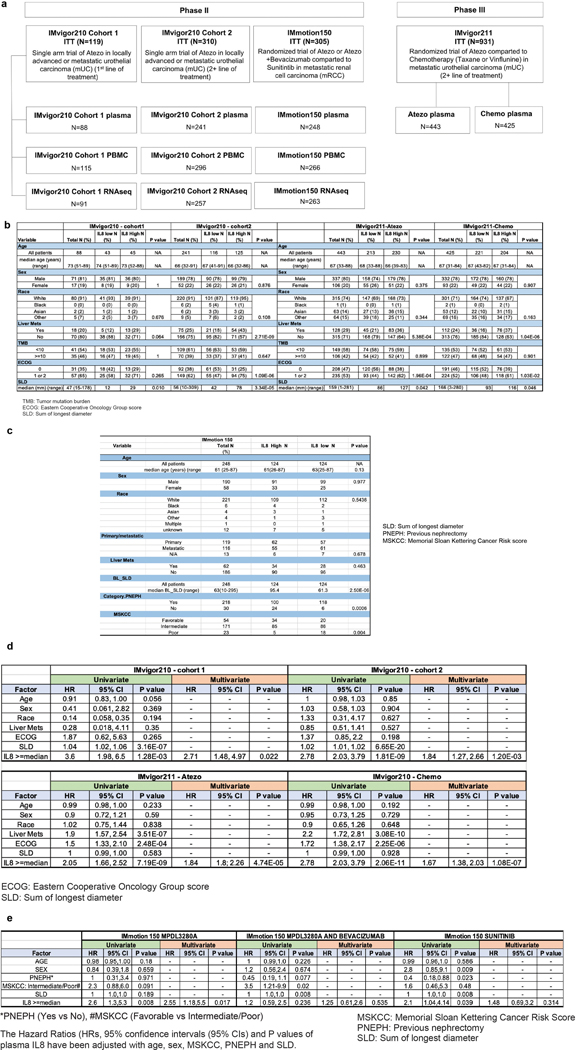
We assessed the association between plasma, PBMC and intratumoral IL8 levels with clinical outcomes in three large atezolizumab trials in mUC and mRCC patients (Extended Data Figure 1a): IMvigor210, a single-arm Phase II study in mUC;12,13 IMvigor211, a randomized Phase III mUC trial in prior platinum-treated patients;14 and IMmotion150, a randomized Phase II trial in patients with untreated mRCC.2 The demographic characteristics of biomarker-evaluable patients with high or low levels of pIL8 are presented in Extended Data Figures 1b and c. We conducted multivariate analyses (co-variates defined in figure legends) to identify associations with clinical outcomes, reported here as adjusted hazard ratios (HR) in mUC and mRCC data sets (Extended Data Figures 1d and e) (Supplementary Tables 1–3).
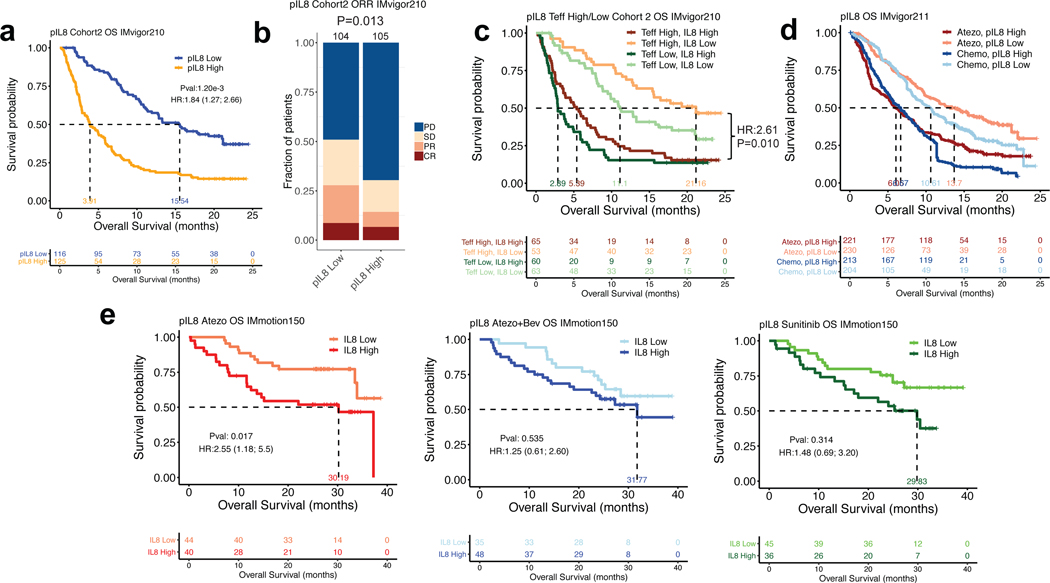
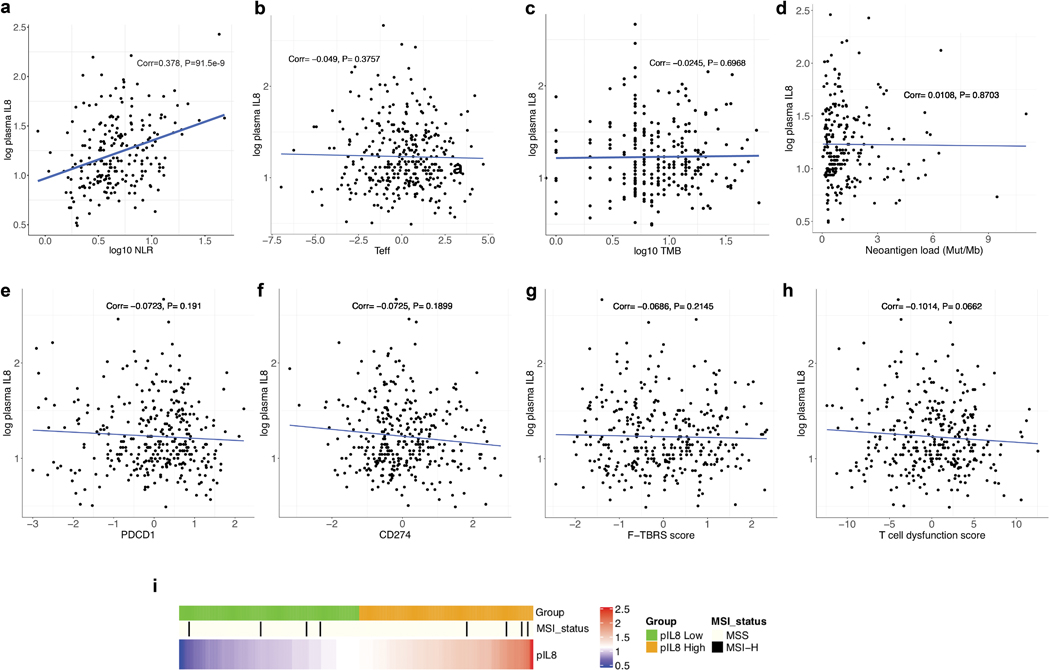
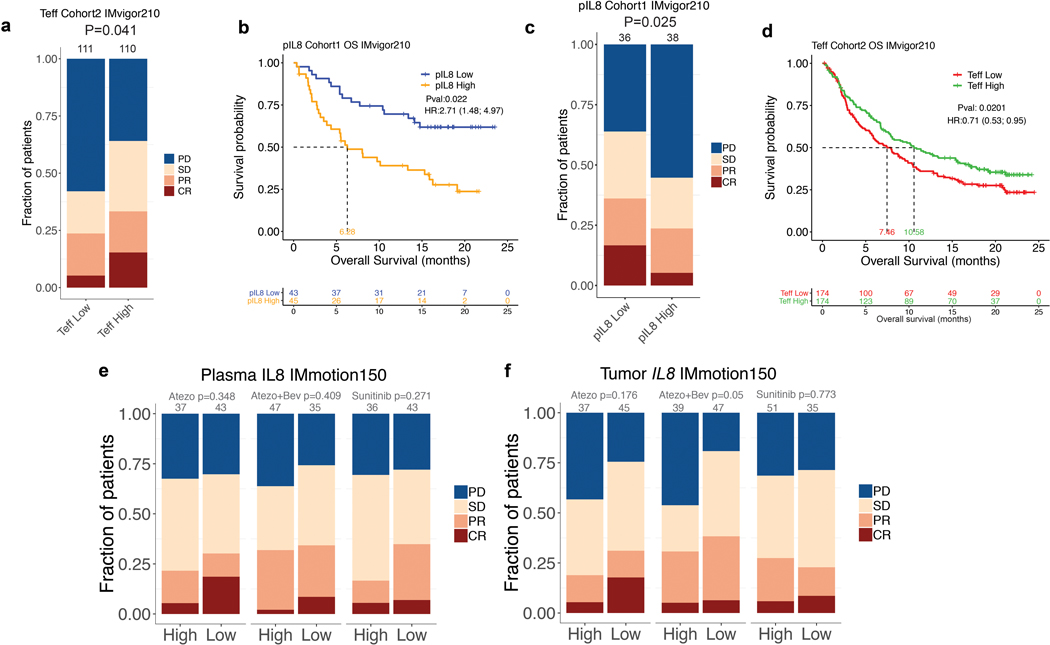
In IMvigor210, pIL8 exhibited moderate correlation with neutrophil-to-lymphocyte ratio (Extended Data Figure 2a). pIL8 also did not correlate with markers of high tumoral immune presence such as T-effector (Teff) signature, tumor mutation burden, tumor PD1 and PD-L1 expression, TGFb-response signature15 or TIDE signature--a genomewide score of T cell dysfunction and exclusion (Extended Data Figure 2b–i).16 In Cohort 2 of the mUC IMvigor210 trial, higher baseline pIL8 (median cut-off) was significantly associated with worse overall survival (OS) (HR=1.84, 95% CI: 1.27, 2.66, P=1.2e-3) (Fig. 1a). High pIL8 remained significantly associated with shorter OS upon multivariate analysis, suggesting that the association of pIL8 with poor OS was additional to prognostic factors (See Methods for details). Elevated pIL8 was significantly associated with a lower objective response rate (ORR) in patients who had progressed after platinum-based therapy. (P=0.013) (Fig. 1b and Extended Data Figure 3a). The association between high pIL8 and worse OS and ORR was validated in IMvigor210 Cohort 1 (Extended Data Figure 3b and c). We have shown that inflamed tumors with high baseline Teff signature are associated with better outcomes17,18 (Extended Data Figure 3d). Here we show that high pIL8 can impede responses to ICB, even in these T-inflamed tumors (Fig. 1c).
Figure 1. Plasma IL8 and clinical outcomes in metastatic urothelial carcinoma (mUC) and metastatic renal cell carcinoma (mRCC).
a, High baseline plasma IL8 (pIL8) levels (median cutoff: 15 pg/mL) were significantly associated with worse overall survival (OS) in cohort 2 of IMvigor210 (HR=1.84, 95% CI: 1.27, 2.66, P=1.2e-3). b, High baseline pIL8 levels were associated with a higher number of nonresponders (SD and PD) (P= 0.013, two-sided Fisher’s exact test) by Response Evaluation Criteria in Solid Tumors (RECIST) 2.1. [CR: complete response; PR, partial response; SD, stable disease; PD, progressive disease]. c, High baseline pIL8 was associated with poor OS in tumors with a T effector infiltrate signature (CD8A, GZMA, GZMB, PRF1) in mUC patients in cohort 2 of IMvigor210 (HR: 1.84; 95% CI: 1.27, 2.66, P=0.010). d, In a randomized mUC Phase 3 trial, IMvigor211, high baseline pIL8 levels were associated with worse OS in both the atezolizumab (HR: 1.84; 95% CI: 1.8, 2.26, P=4.74e-5) and chemotherapy (HR: 1.67; 95% CI: 1.38, 2.03, P=1.08e-7) treatment arms. e, Kaplan–Meier curves depict median overall survival in the atezolizumab (atezo) + bevacizumab (bev), atezolizumab monotherapy, and sunitinib treatment arms. High baseline pIL8 was associated with worse OS in the atezolizumab (HR: 2.55, 95% CI: 1.18, 5.5, P=0.017) arm but not atezolizumab + bevacizumab (HR: 1.25, 95% CI: 0.61, 2.60, P=0.535) and sunitinib arm (HR: 1.48, 95% CI: 0.69, 3.20, P=0.314) in a randomized mRCC Phase 2 trial, IMmotion150. HRs in Figure 1a,c-e were calculated using stratified Cox proportional hazard regression models, and P values were calculated using stratified log-rank test. P values were adjusted for multiple comparisons. Multivariate analyses adjusted HRs for age, sex, race, ECOG performance status, presence of liver metastasis, and tumor burden (sum of longest diameter, SLD) in mUC; age, sex, Memorial Sloan Kettering Cancer Risk (MSKCC) prognostic risk score, previous nephrectomy, and SLD in mRCC data sets.
We further assessed the impact of pIL8 on patient outcomes in randomized trials IMvigor211 in mUC and IMmotion150 in mRCC. In IMvigor211, mUC patients with high pIL8 had significantly worse OS in both atezolizumab and chemotherapy arms (Fig. 1d), indicating that high pIL8 is prognostic in mUC. In the low pIL8 group, atezolizumab showed a trend of improved OS compared to chemotherapy; however, an interaction test for treatment arm effect showed that this difference was not statistically significant. In the IMmotion150 study, high pIL8 level was associated with reduced OS in patients treated with atezolizumab (HR: 2.55, 95% CI: 1.18, 5.5, P=0.017) and showed a trend toward worse OS in atezolizumab+bevacizumab and sunitinib-treated patients. However, the trend did not reach statistical significance (P=0.910) after multivariate analysis (MVA) correction (Fig. 1e). Therefore, the predictive value of baseline pIL-8 was not significant when considering the interaction with the treatment arms. Elevated pIL8 and tumor IL8 expression showed a trend toward lower objective response rate (ORR) but it is not statistically significant (Extended Data Figure 3e and f).
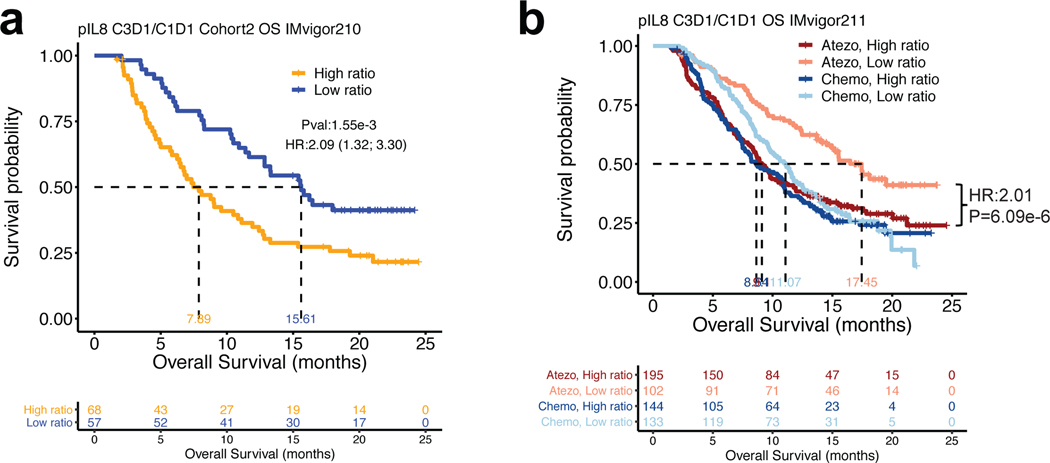
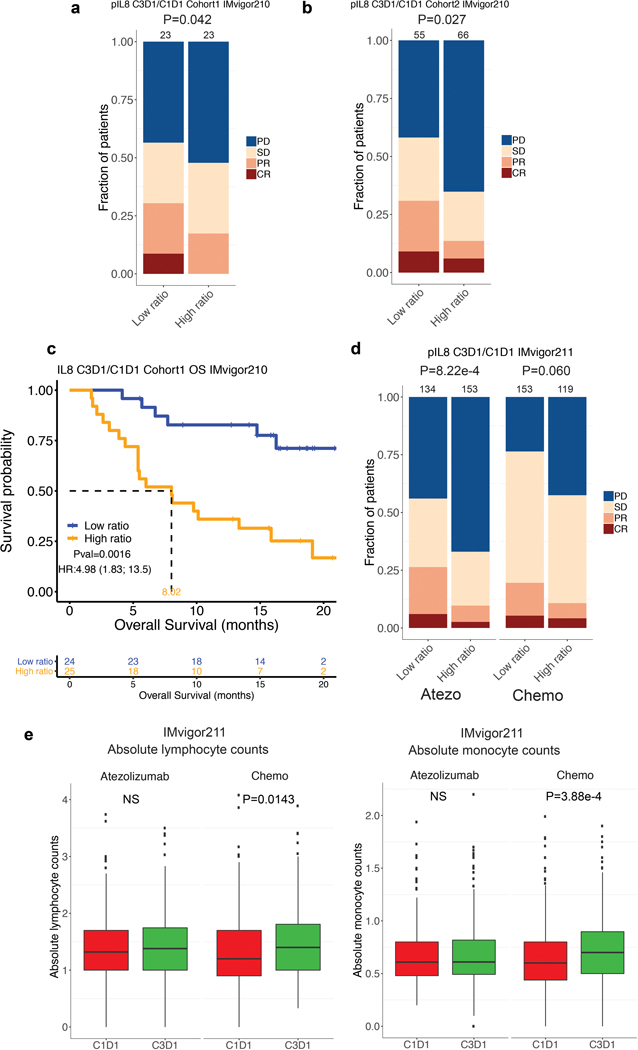
Next, we evaluated on-treatment pIL8 levels (6 weeks post atezolizumab or chemotherapy treatment) compared to baseline in mUC (IMvigor210 and IMvigor211 trials). On-treatment increase in pIL8 was associated with worse OS and ORR in both cohorts from IMvigor210 (Fig. 2a, Extended Data Figure 4a–c). A similar effect was observed in IMvigor211 in patients treated with atezolizumab but not with chemotherapy, suggesting that on-treatment increase in pIL8 predicted worse clinical outcome to atezolizumab (Fig. 2b, Extended Data Figure 4d). Since chemotherapy did not reduce lymphocyte and monocyte counts during therapy, the poor response associated with chemo in low pIL8 is not due to reduction of these immune cells (Extended Data Figure 4e).
Figure 2. On-treatment changes in plasma IL8 and overall survival (OS) in mUC patients treated with atezolizumab or chemotherapy.
a, On-treatment changes in plasma IL8 (pIL8) are expressed as the ratio of pIL8 level on treatment cycle 3 day 1 (C3D1) and baseline (cycle 1 day 1, C1D1). High on-treatment increases in pIL8 (median cutoff: 1.09 pg/mL) were significantly associated with worse OS in cohort 2 of IMvigor210 (HR: 2.09, 95% CI: 1.32, 3.30, P=1.55e-3). b, High on-treatment increase in pIL8 was significantly associated with worse OS in the atezolizumab arm (HR: 2.01, 95% CI: 1.49, 2.71, P=6.09e-6), but not in the chemotherapy arm of IMvigor211 (HR: 1.17, 95% CI: 0.89; 1.55, P=0.27). The HRs were calculated using stratified Cox proportional hazard regression models, and P values were calculated using stratified log-rank test. P values were adjusted for multiple comparisons. Multivariate analyses adjusted HRs for age, sex, race, ECOG performance status, presence of liver metastasis, and tumor burden (SLD).
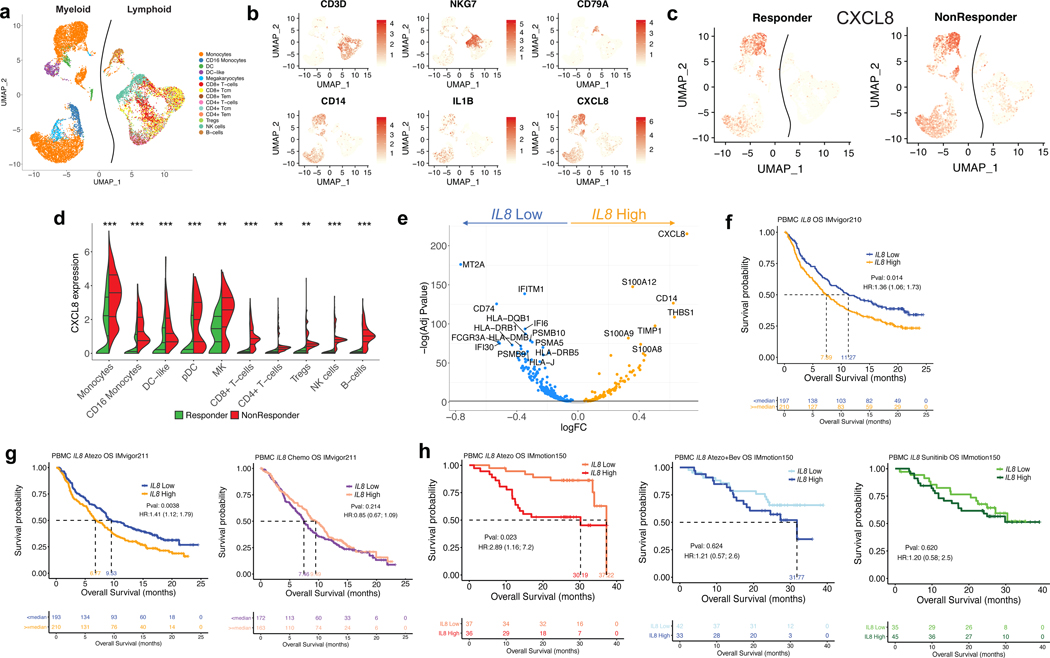
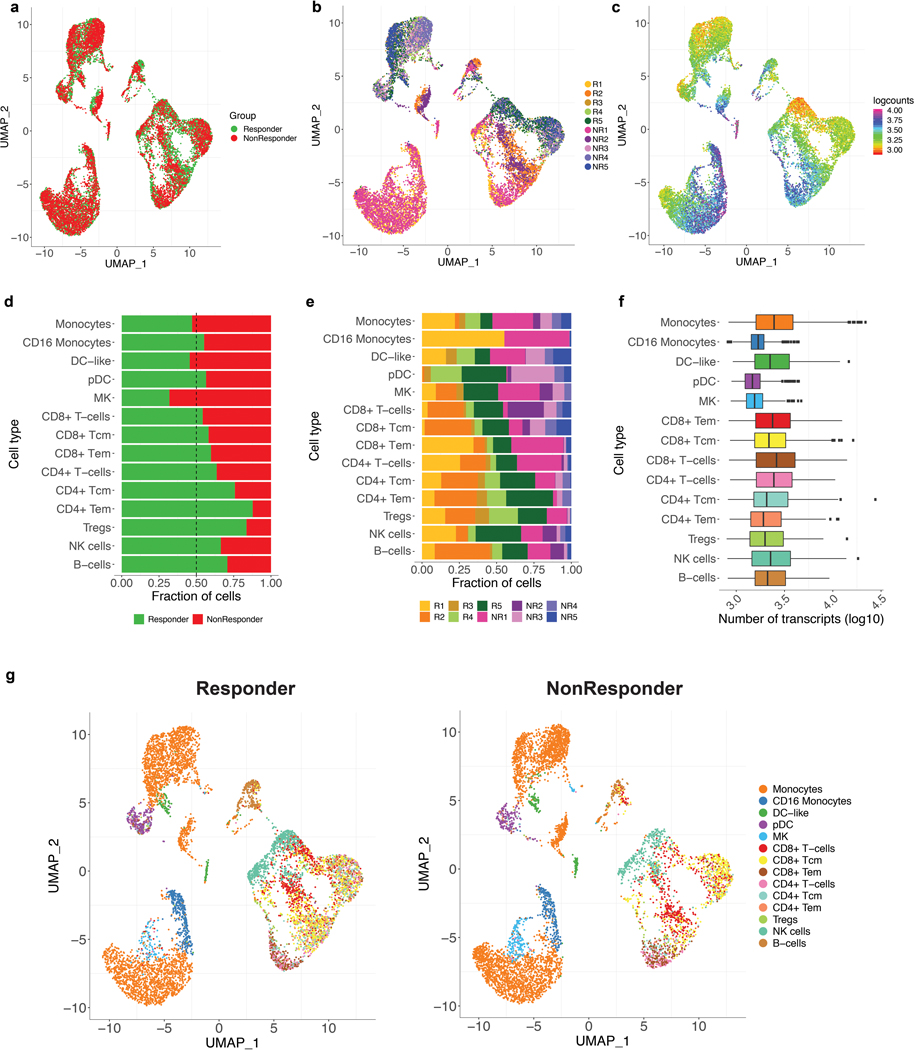
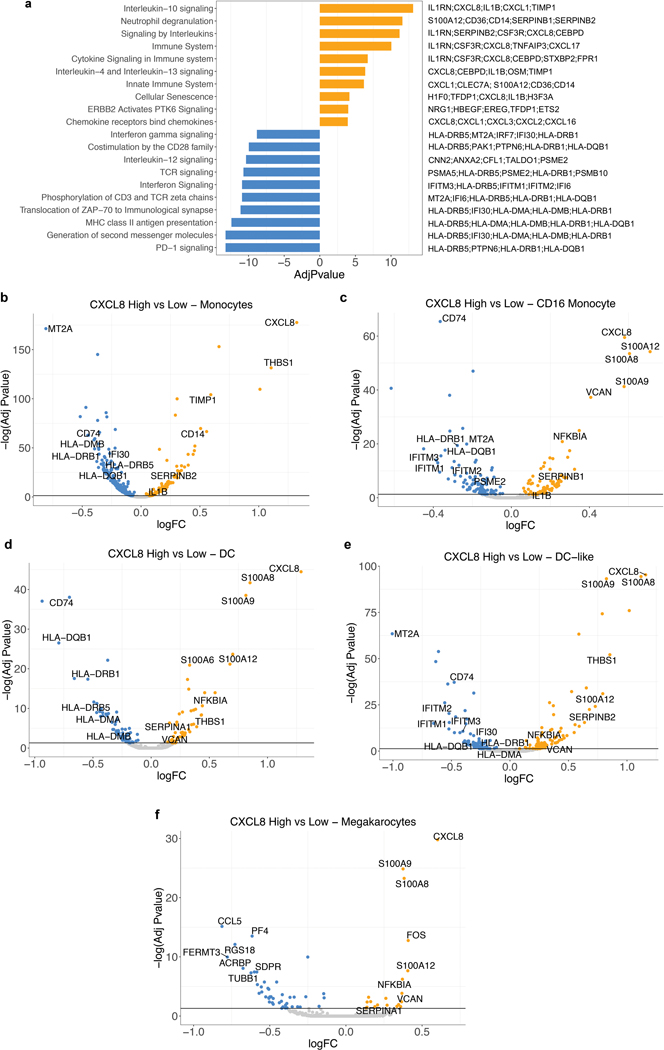
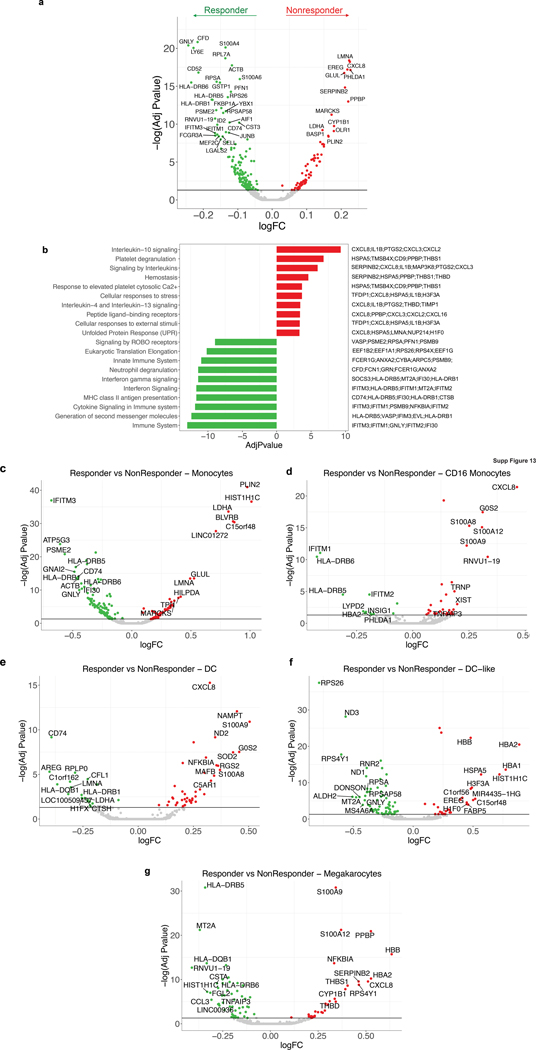
We next assessed whether IL8 expression within a specific subset of PBMCs would associate with clinical outcomes to ICB. Single-cell RNA-sequencing (scRNAseq) of baseline PBMCs from five responders and five nonresponders from the IMvigor210 study (Fig. 3a, Extended Data Figure 5) identified myeloid and lymphoid cells using lineage-specific genes (Fig. 3b). IL8 expression was higher in myeloid clusters than in lymphoid clusters (Fig. 3c). Nonresponders had a larger proportion of IL8-producing myeloid and lymphoid cells, as well as higher expression of IL8 than responders (Fig. 3c, d). Myeloid inflammatory genes were enriched in IL8-high cells (Fig. 3e, Extended Data Figure 6a). Concomitantly, genes associated with antigen presentation machinery, such as human leukocyte antigen (HLA) genes and interferon-gamma induced genes, were downregulated in IL8-high cells (Fig. 3e, Extended Data Figure 6a). Similar trends were observed for individual myeloid subsets, including monocytes, CD16 monocytes, DC and DC-like clusters (Extended Data Figure 6b–f), as well as myeloid populations between responders and nonresponders (Extended Data Figure 7).
Figure 3. Poor clinical outcome and lower expression of antigen presentation genes associated with IL8-high myeloid subsets in PBMCs.
a, Different cell types showing subsets of distinct myeloid and lymphoid clusters, as revealed by single cell RNAseq of baseline peripheral blood mononuclear cells (PBMC) isolated from n=5 responders and n=5 nonresponders in mUC IMvigor210 cohort. Cell types were verified based on expression of the lymphocytic (upper panel) (n=6100) and myeloid (lower panel) (n=8374) cell type-specific markers shown in b. c, UMAP plot showing the expression of IL8 in all cell clusters in responders (n=7903) and non responders (n=5671). d, Split violin plot showing the expression of IL8 and cell numbers of different myeloid and lymphoid cell types between responders and nonresponders. (Two-sided Mann-Whitney U-tests with Benjamini & Hochberg corrections) ***FDR <0.001; **FDR<0.01. e, Differential expression of IL8 high vs low populations (by median of all myeloid cells) in combined myeloid clusters. Monocytes (n=6761), minima: 0, maxima: 7.87, and Percentile 75%: 5.37, 50%: 3.99, 25%: 2.83. CD16 Monocytes (n=623), minima: 0, maxima: 4.09, and Percentile 75%: 2.31, 50%: 1.53, 25%: 0.45. DC-like (n=305), minima: 0, maxima: 5.70, and Percentile 75%: 2.68, 50%: 1.60, 25%: 0.92. DC-like (n=391), minima: 0, maxima: 5.73, and Percentile 75%: 2.23, 50%: 1.75, 25%: 0.98. Megakaryocyte (n=294), minima: 0, maxima: 6.09, and Percentile 75%: 3.67, 50%: 2.86, 25%: 2.12. CD8+ T cells (n=565), minima: 0, maxima: 3.56, and Percentile 75%: 1.31, 50%: 2.73, 25%: 0.87. CD4+ T cells (n=443), minima: 0, maxima: 5.19, and Percentile 75%: 0.76, 50%: 0.63, 25%: 0.48. Tregs (n=238), minima: 0, maxima: 3.72, and Percentile 75%: 1.23, 50%: 1.07, 25%: 0.95. NK cells (n=1099), minima: 0, maxima: 3.80, and Percentile 75%: 1.56, 50%: 1.32, 25%: 1.16. B cells (n=387), minima: 0, maxima: 3.84, and Percentile 75%: 1.84, 50%: 1.36, 25%: 1.27. Differential gene expression analysis between IL8-high (n=4187) and -low (n=4187) myeloid cells showing enriched expression of myeloid inflammatory response genes (orange) in IL8 high myeloid cells versus higher expression of antigen presentation genes (blue) in IL8 low myeloid cells. Differential expression analysis with the generalized linear models (glm)-based statistical methods of the edgeR package with Benjamini & Hochberg corrections. f, Kaplan-Meier curves depict overall survival of IL8 expression in PBMC of IMvigor210 using median cutoff. High IL8 gene expression in PBMCs was significantly associated with worse OS in mUC IMvigor210 (HR: 1.36, 95% CI: 1.06, 1.73, P=0.014). g, Kaplan-Meier curves depict overall survival of IL8 expression in PBMC of IMvigor211 using median cutoff in atezolizumab and chemo arms, respectively. High IL8 gene expression in PBMCs was significantly associated with worse OS (HR: 1.41, 95% CI: 1.12, 1.79, P=0.0038) in atezolizumab arm, but not chemotherapy arm (HR: 0.85, 95% CI: 0.67, 1.09, P=0.214). h, Kaplan-Meier curves depict overall survival of IL8 expression in PBMC of IMmotion using median cutoff in atezolizumab, atezolizumab + bevacizumab and sunitinib arms. High IL8 gene expression in PBMCs was associated with worse OS in the atezolizumab arm (HR 2.89; 95% CI 1.16, 7.2, P=0.023) of mRCC patients in IMmotion150 but not in atezolizumab + bevacizumab (HR 1.21; 95% CI: 0.57, 2.6, P= 0.624) or sunitinib (HR: 1.20; 95% CI: 0.58, 2.5, P= 0.620) arms. HRs in Figure 3f-h were calculated using stratified Cox proportional hazard regression models, and P values were calculated using stratified log-rank test. P values were adjusted for multiple comparisons. Multivariate analyses adjusted HRs for age, sex, race, ECOG performance status, presence of liver metastasis, and tumor burden (sum of longest diameter, SLD) in mUC; age, sex, Memorial Sloan Kettering Cancer Risk (MSKCC) prognostic risk score, previous nephrectomy, and SLD in mRCC data sets.
We extended our analysis of PBMC IL8 gene expression association with clinical responses in IMvigor210, IMvigor211 and IMmotion150 cohorts. High IL8 gene expression in PBMCs was significantly associated with worse OS (HR: 1.36, 95% CI: 1.06, 1.73, P=0.014) (Fig. 3f) in IMvigor210. In IMvigor211, high IL8 gene expression in PBMCs was significantly associated with worse OS (HR: 1.41, 95% CI: 1.12, 1.79, P=0.004) in the atezolizumab arm, but not chemotherapy arm (Fig. 3g). Similarly, high PBMC IL8 gene expression in mRCC patients was also associated with worse OS in the atezolizumab monotherapy arm (HR 2.89; 95% CI: 1.16, 7.2, P=0.023) but not in the atezolizumab+bevacizumab or sunitinib arms (Fig. 3h).
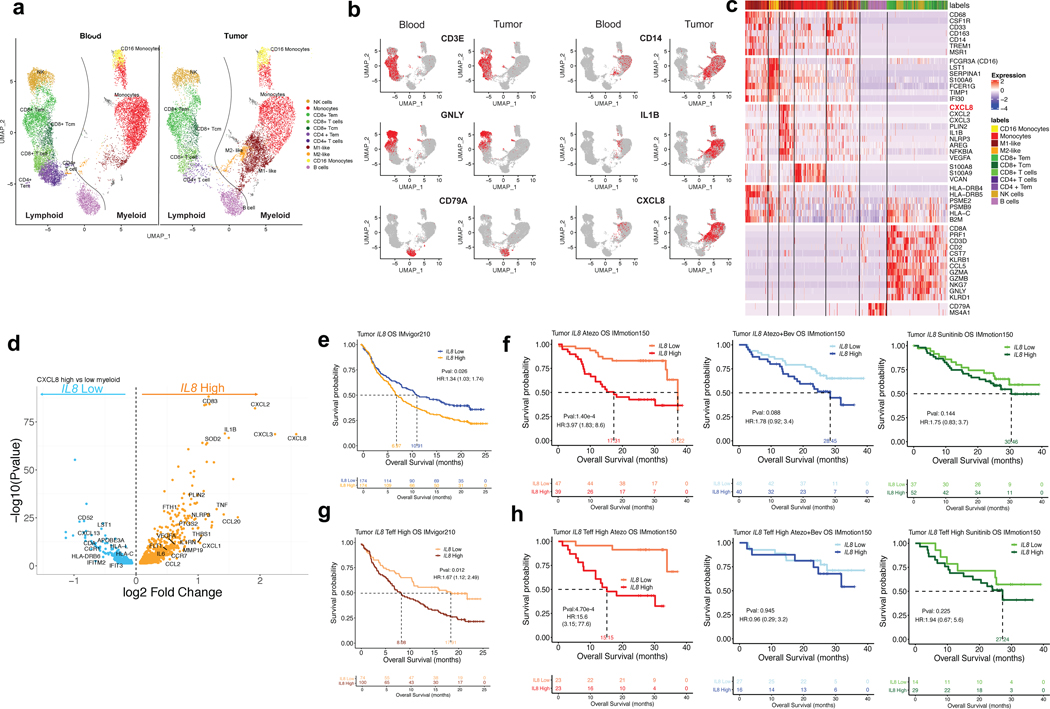
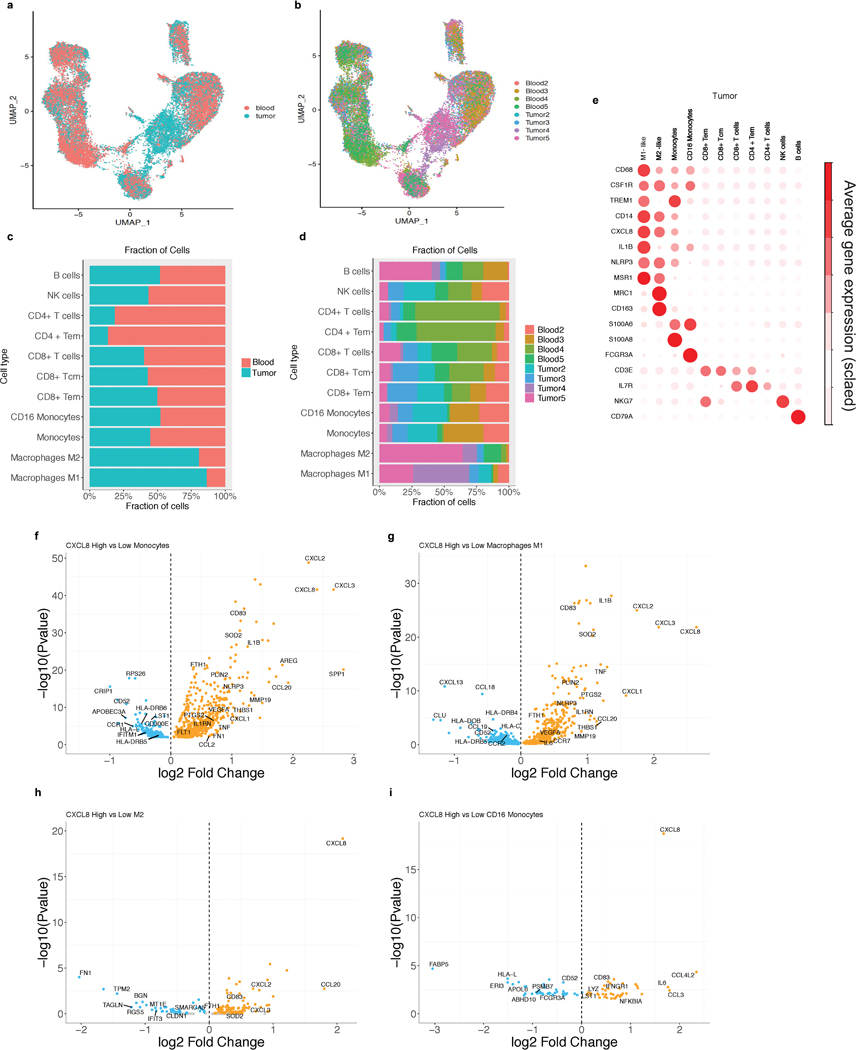
As myeloid cells can acquire different phenotypes within the tumor microenvironment,19–21 we procured fresh tumors and peripheral blood from four mRCC patients and evaluated gene expression profiles by scRNAseq of intratumoral and matched peripheral blood leukocytes. UMAP visualization showed that lymphoid and myeloid cells separated into 11 clusters (Fig. 4a, Extended Data Figure 8a–d). Relative to blood, tumors were enriched in myeloid populations (Fig. 4a). IL8 expression was higher in myeloid cells than lymphoid cells and was more pronounced in tumor-infiltrating macrophages compared to peripheral blood myeloid cells, especially in M1-like macrophages (Fig. 4a,b; Extended Data Figure 8e). Differential gene expression analysis of IL8-high versus IL8-low intratumoral myeloid cells revealed increased expression of pro-inflammatory genes (IL1B, PTGS2, IL1RN, NLRP3) and reduced expression of genes involved in antigen processing and presentation (HLA-DRB6, HLA-C, IFITM2, IFIT3, HLA-L) in IL8-high cells (Fig. 4c,d; Extended Data Figure 8f–i).
Figure 4. Single-cell RNASeq analysis of IL8 gene expression in immune subsets from matched intratumoral and peripheral blood leukocytes from RCC patients and association of tumor IL8 gene expression with clinical outcomes in mUC and mRCC.
a, Single cell RNAseq (scRNAseq) identifies immune cells subsets in leukocytes in four matched blood and tumor from mRCC. UMAP plot of 25,459 immune cells, color-coded by their annotation from four matched blood and tumor (single cell n= 13694 and 11765 cells, respectively). Color-coded expression (grey to red) of the lymphocytic (left two panels) and myeloid (right two panels) cell type-specific markers from four matched blood and tumor shown in b. c, Heat map reporting scaled expression (log expression count values) of selected gene sets. Gene expression color scheme is based on scale log count expression distribution, from –2.0 (blue) to 2.0 (red). Color bars in right margin highlight cell subsets of interest. d, Differential gene expression analysis between IL8-high and -low intratumoral myeloid cells showing enriched expression of myeloid inflammatory response genes (orange) in IL8 high myeloid cells versus higher expression of antigen presentation genes (blue) in IL8 low myeloid cells. Volcano plot representing differentially expressed (FDR-corrected p<0.05) between IL8 high and IL8 low myeloid cells in the four mRCC tumors (n= 6280 cells). Differential expression analysis with the generalized linear models (glm)-based statistical methods of the edgeR package with Benjamini & Hochberg corrections. e. High vs. low intratumoral IL8 gene expression and overall survival (OS) following atezolizumab monotherapy in IMvigor210 (HR: 1.34, 95% CI:1.03, 1.74, P=0.026). f, Kaplan-Meier curves depict overall survival of IL8 expression in the tumors of IMmotion using median cutoff in atezolizumab, atezolizumab + bevacizumab and sunitinib arms. High vs. low intratumoral IL8 gene expression and OS with atezolizumab monotherapy (HR: 3.97, 95% CI:1.83, 8.6, P=1.40e-4), atezolizumab + bevacizumab (HR: 1.78, 95% CI: 0.92, 3.4, P= 0.088), and sunitinib (HR: 1.75, 95% CI: 0.83, 3.7, P= 0.144) in IMmotion 150. g, High versus low intratumoral IL8 gene expression and OS in Teff-high patients who received atezolizumab monotherapy in IMvigor210 (HR: 1.67, 95% CI: 1.12, 2.49, P=0.012). h, Kaplan-Meier curves depict overall survival of IL8 expression in the tumors of IMmotion using median cutoff in atezolizumab, atezolizumab + bevacizumab and sunitinib arms. High versus low intratumoral IL8 gene expression and OS in the T-effector (Teff) high patient subset treated with: atezolizumab monotherapy (HR: 15.6, 95% CI: 3.15, 77.6, P=4.70e-4), atezolizumab + bevacizumab (HR: 0.96, 95% CI: 0.29, 3.2, P=0.945), and sunitinib (HR: 1.94, 95% CI: 0.67, 5.6, P=0.225) in IMmotion150. HRs in Figure 4e-h were calculated using stratified Cox proportional hazard regression models, and P values were calculated using stratified log-rank test. P values were adjusted for multiple comparisons. Multivariate analyses adjusted HRs for age, sex, race, ECOG performance status, presence of liver metastasis, and tumor burden (sum of longest diameter, SLD) in mUC; and age, sex, Memorial Sloan Kettering Cancer Risk (MSKCC) prognostic risk score, previous nephrectomy, and SLD in mRCC data sets.
We further interrogated IL8 gene expression in mUC (IMvigor210) and mRCC (IMmotion150) tumors and found that elevated IL8 gene expression correlated with higher neutrophil presence (Extended Data Figure 9). High tumor IL8 gene expression associated with worse OS in mUC patients (Fig. 4e) and in mRCC (Fig. 4f) treated with atezolizumab. Furthermore, high tumor IL8 expression remained associated with worse OS even in T-cell infiltrated tumors in mUC (Fig. 4g) and in mRCC (Fig. 4h) in patients treated with atezolizumab, but not with atezolizumab+bevacizumab or sunitinib (Fig. 4h).
In this comprehensive evaluation of large randomized studies, we found elevated pIL8 was associated with worse clinical outcome to atezolizumab and chemotherapy in mUC and atezolizumab and sunitinib in mRCC. Chemotherapy and sunitinib (a multitarget kinase inhibitor) are known to exert immunomodulatory effects.22,23 Therefore, some overlapping biological features may be associated with resistance to pIL8 in both ICB and control treatment arms. Adjuvant trials comparing ICB treatment with an observation arm will likely resolve the prognostic vs predictive question.
Notably, in mUC, on-treatment reductions in pIL8 were associated with better outcomes with atezolizumab compared to chemotherapy, suggesting on-treatment change in pIL8 to be a potential marker of early response to ICB.1
Increased pIL8 or high tumor IL8 mRNA expression was detrimental to inflamed tumors harboring pre-existing T-effector immunity, which are known to be responsive to ICB.2,15 Previous reports showed increases in circulating immunosuppressive monocytic and granulocytic myeloid-derived suppressor cells (MDSCs) in patients with high pIL8.3,10 Consistently, we observed that increased presence of intratumoral neutrophils correlated with increased IL8 expression in the tumor1 (Extended Data Figure 9). The source of IL8 is likely to be from both myeloid cells and tumor cells. Moreover, our transcriptomic characterization of circulating and tumor-infiltrating IL8-producing myeloid cells supports their role in the impairment of adaptive immunity through increased expression of myeloid proinflammatory genes and downregulation of antigen presentation genes and interferon-inducible genes. Alternatively, increased interferon-signaling associated with ICB responses15 may also impede IL8 signaling, underscoring the potential crosstalk between these pathways.
In addition to its effects in tumors, elevated pIL8 may also play inhibitory roles in the periphery. In this scenario, the T cell response in the tumor might be driven by peripherally activated T cells that have infiltrated the tumor in response to ICB.24 Notably, scRNAseq of mUC patient PBMC samples revealed that CD8+ T cells in pIL8-low patients had high expression of T cell activation markers such as GZMA, GZMB, GZMH and PRF1 (Extended Data Figure 10). Moreover, bulk NanoString mRNA analysis across the large cohort of mUC patients also showed increased expression of T cell genes such as TCF7, IL7R, CD28, CD3D in low-pIL8 PBMC samples (Extended Data Figure 10). Collectively these data suggest that high pIL8 may result in a suboptimal environment for activation of anti-tumor immunity, raising the possibility that targeting IL8 may sensitize tumors to anti-PD-(L)1 ICB.
The mechanistic basis of IL8 associated resistance to immunotherapy has been difficult to study in preclinical models due to the absence of an IL8 homolog in the mouse genome25. IL8 exerts its functions through CXCR1/2 signaling; thus a combination of anti-CXCR2 and anti-PD1 therapy may be more beneficial than either monotherapy in preclinical models26. Because myeloid inflammatory biology is complex and redundant, inhibiting multiple targets may be necessary to overcome myeloid-mediated immune suppression. In this context, blockade of colony stimulating factor-1 receptor-1 (CSF1R) occupies an important role for evaluating the effect of targeting tumor-associated macrophages (TAMs)27,28. Both VEGFA and IL8 contribute to angiogenesis and myeloid inflammation, and are concomitantly highly expressed in tumor-infiltrating myeloid cells (Fig. 4c). Indeed, we found that the adverse effect of high plasma and tumor IL8 were partially reduced when bevacizumab was combined with atezolizumab in mRCC2. Besides VEGF, we found increased NLRP3 inflammasome and IL1B mRNA expression in IL8-high myeloid cells in PBMCs and tumors. Therapeutic targeting of IL1B has shown a dose-dependent reduction in the incidence of and mortality from NSCLC29. Based on our findings, future clinical evaluation focused on developing IL8 pathway blocking agents in combination with ICBs may improve outcomes in specific tumor types and tumor immunogenic context.
Material and Methods
Clinical tumor sample collection
Samples for this analysis were collected from IMvigor210, a single-arm Phase 2 study investigating atezolizumab in metastatic urothelial carcinoma (mUC) patients (NCT02951767, NCT02108652), Phase 3 mUC trial IMvigor211 (NCT02302807) in which patients were treated with either chemotherapy (taxane or vinflunine) or atezolizumab as a second-line or higher treatment. Tumor tissues were taken from all patients two years prior to study entry. RECIST v1.1 was used to assess response to therapy. RCC samples were collected from IMmotion150 (NCT01984242), a phase II multicenter, randomized, open-label study investigating activity of atezolizumab and atezolizumab+bevacizumab versus sunitinib in metastatic clear cell renal carcinoma. Tumor specimens from patients were acquired <12 months before study treatment (For details, please see Life Sciences Reporting Summary).
PBMC collection and isolation
PBMCs from patients were isolated using 50 mL Leucosep™ tubes (Greiner Bio-One International, Germany) and Ficoll-Paque™ PLUS (GE Healthcare, Sweden). Whole blood drawn into sodium heparin blood collection tubes were diluted 3x with phosphate-buffered saline (PBS) without calcium or magnesium (Lonza, Walkersville, MD). Diluted cell suspensions were carefully layered on Leucosep tubes and centrifuged for 15 minutes at 800 x g at room temperature (RT). Interphase containing PBMCs were harvested and washed with PBS and subsequently centrifuged for 10 minutes at 250 x g at RT before further processing.
RCC procured Tumor Tissue collection and processing
Surgical resections from treatment-naïve patients with tumors classified as RCC were procured (Discovery Life Sciences, iSpecimen Inc, Avaden BioSciences and TriMetis Life Sciences) and shipped overnight to our institution. A total of eight samples (four tumors and four matched whole blood) from four patients diagnosed with clear cell renal carcinoma (ccRCC) were included in single cell RNA analysis. Upon arrival, samples were rinsed with PBS until no traces of blood were visually detected. Subsequently, samples were digested with a combination of Collagenase D (0.5 mg/mL) and DNAse (0.1 mg/mL) for 15 min at 37°C with gentle shaking and processed to single-cell suspensions via GentleMACS. Following enzymatic dissociation of tissues, cells were stained with anti-CD45 (Biolegend, San Diego, CA), and CD45+ cells were purified by fluorescence-activated cell sorting (FACS) on a Becton Dickinson FACSAria cell sorter equipped with four lasers (405 nm, 488 nm, 561 nm, 638 nm). A 70 μm nozzle running at 70 psi and 90 kHz was used as the setup for each sort session. FACS gates were drawn to include only live single cells based on Calcein Blue AM+ and Propidium Iodide- (Thermo Fisher Scientific, Waltham, MA).
Single-cell RNA-sequencing library construction for RCC matched tumors and peripheral blood leukocytes
Viable CD45+ cells isolated from RCC blood and tumor were loaded into wells of a 10x Chromium Single Cell Capture Chip targeting a cell recovery rate of 2000‐4000 cells.
Single-cell RNA-Seq (scRNAseq) libraries were prepared using the Chromium Single Cell 5’ Library & Gel Bead Kit (PN−−1000006, and PN−−220112, 10x Genomics, Pleasanton, CA). Barcoded, full-length cDNA amplification and indexed libraries were prepared using 14 cycles of PCR. Libraries were profiled by Bioanalyzer High Sensitivity DNA kit (Agilent Technologies, Santa Clara, CA) and quantified using Kapa Library Quantification Kit (Kapa Biosystems, Wilmington, MA). Each library was sequenced in one lane of HiSeq4000 (Illumina, San Diego, CA) to achieve ~300 million reads following the manufacturer’s sequencing specification (10x Genomics).
mUC PBMC scRNAseq library preparation
Frozen PBMC samples containing at least 1 million cells were thawed for 1 minute at 37°C and washed twice with RPMI complete media (RPMI containing 10% fetal bovine serum with 2 mM L-glutamine and Pen/Strep). Samples with >50% red blood cells were treated with RBC Lysis buffer for 3 minutes at RT to remove red blood cells and then washed one more time with RPMI complete media. The cell density and viability of the single-cell suspension were then determined by Vi-CELL XR cell counter (Beckman Coulter, Pasadena, CA). All of the samples had >80% viable cells. Sample processing for single-cell RNA-seq was done using Chromium Single Cell 3’ Library and Gel bead kit v2 (PN-120237) following the manufacturer’s user guide (10x Genomics). The total cell density was used to impute the volume of single cell suspension needed in the reverse transcription (RT) master mix, aiming to achieve ~ 6,000 cells per sample. cDNAs and libraries were prepared following the manufacturer’s user guide (10x Genomics). cDNA amplification and indexed libraries were prepared using 12 and 14 cycles of PCR, respectively. Libraries were profiled, quantified, and sequenced as described above.
scRNAseq data analysis of mUC PBMCs and RCC tumors and peripheral blood leukocytes
Seurat (version 3.0) was used to perform basic quality control on the raw 50 GEX matrices output from Cell Ranger 2.2.0. The Cell Ranger Single Cell Software Suite v.2.2.1 was used to perform sample de‐multiplexing, alignment, filtering, and UMI (i.e., universal molecular identifier) counting (https://support.10xgenomics.com/single-cell-geneexpression/software/pipelines/latest/what‐is‐cell‐ranger). The data for each respective subpopulation were aggregated for direct comparison of single cell transcriptomes. Then, gene dispersion analysis implemented in Seurat was used to select highly variable genes, preserving genes with logarithmic mean expression between 0.0 and 3.0 and with logarithmic dispersion less than 0.5. Sctransform function in Seurat version 3 was used for normalization of integrated RCC blood and tumor single cell data30. Sctransform normalization effectively removes technically-driven variation between blood and tumor while preserving cell biological heterogeneity.
Seurat (version 3.0) was used to analyze the PBMC and RCC tumor GEX data in Fig. 3 and Fig. 4. Genes with detected expression in at least five cells, and cells with at least ten genes detected were used. The first 20 principal components were used for clustering (resolution = 0.6) and for UMAP visualization. Clusters were identified based on genes that are enriched in a specific cluster. Immunophenotyping of PBMCs and RCC tumors and peripheral blood leukocytes was inferred from the annotation of cluster-specific genes; CD3 T (CD3D, CD3E), CD8 T (CD3E, CD8A), B cells (CD79A), CD14 Monocytes (CD14) and NK cells (NKG7+ and CD3E negative). For the heatmap (Fig. 4c), 7843 tumor cells were clustered 11 subsets: lymphoid, myeloid and B cells (based on average gene expression from Seurat identified conserve markers across samples). Also, the ordering of the genes was predetermined, based on top 50 differentially expressed genes for each cluster. Scale transformed normalized counts, as described above, are shown. SingleR31 (version 1.0.1) was used to annotate immune cells type in Fig. 3 and Fig. 4. SingleR calculates correlations using the variable genes in the reference dataset to assign cellular identity for single cell transcriptomes by comparison to reference data sets of pure cell types sequenced by RNA-sequencing (RNA-seq). Here, we used SingleR to identify monocytes, macrophages and lymphoid cells for RCC tumor cells. In addition, we applied Seurat clustering approach based on SingleR marker correlations to subcluster M1 and M2 macrophages.
Differential gene expression analysis in scRNAseq data sets
Differential gene expression analysis for IL8-high versus IL8-low cell subsets was with raw counts of the samples and was performed by edgeR in R using the generalized linear model workflow described in the edgeR manual (https://www.bioconductor.org/packages/release/bioc/vignettes/edgeR/inst/doc/edgeRUsersGuide.pdf). First, the sequencing reads for duplicate sequencing libraries were combined to produce a single set of sequencing reads for each sample, and the raw read counts for each gene were used to produce a DGEList object in edgeR. Genes were only included if they were represented by at least one read in all of the samples. The calcNormFactors() function was used to account for differences in the library size for each sample, and an experimental design model consisting of the batch and HS status was established. The functions estimateCommonDisp() and estimateTagwiseDisp() were used to estimate dispersion. Following this, differential expression was tested using the exact test based on qCML methods. The Benjamini-Hochberg correction was used with a false discovery cut-off of 0.05.
PBMC NanoString gene expression analysis
PBMC NanoString gene expression data were processed using the R/Bioconductor package ‘NanoStringQCPro’(http://www.bioconductor.org/packages/release/bioc/html/NanoStringQCPro.html). Raw counts were adjusted by positive control counts before probe- and lane-specific background was calculated based on both negative controls and blank measurements. After background correction, counts were log2 transformed and normalized by housekeeping gene expression (TMEM55B, VPS33B, TBP and TUBB). Patients were divided into IL8 high- vs low-expression categories using median mRNA expression levels as cutoffs, as measured by NanoString immune panel, and with P values determined by t-test.
Pathway analysis
Individual REACOME pathways were assessed for significant enrichment by assessing whether the number (S) of significantly differentially expressed genes within a pathway is more than expected by chance given the total number (N) of genes. The p-value (P) was determined using a hypergeometric test and this was then corrected for tests over multiple pathways using the method of Benjamini and Hochberg to yield an adjusted p-value (P adj.)
Plasma IL8 assay
EDTA-treated plasma samples were collected from patients before treatment (IMvigor210, IMvigor211 and IMmotion150) and on cycle 3 day 1 after treatment (IMvigor210 and IMvigor211) and stored at −80°C. Plasma IL8 were evaluated by previously qualified immunoassays on a novel multi-analyte platform Simple Plex Ella32. The samples were diluted two-fold in sample diluent and loaded onto the cartridge for data acquisition.
RNAseq gene expression profiling
Whole-transcriptome profiles were generated using TruSeq RNA Access technology (Illumina). RNA-seq reads were first aligned to ribosomal RNA sequences to remove ribosomal reads. The remaining reads were aligned to the human reference genome (NCBI Build 38) using GSNAP33,34 version 2013–10-10, allowing a maximum of two mismatches per 75 base sequence (parameters: ‘-M 2 -n 10 -B 2 -i 1 -N 1 -w 200000 -E 1-pairmax-rna = 200000 –clip-overlap). To quantify gene expression levels, the number of reads mapped to the exons of each RefSeq gene was calculated using the functionality provided by the R/Bioconductor package GenomicAlignments35. Teff gene expression signatures were defined in previous publications for mUC36 and mRCC37.
IL8 in situ hybridization
For the detection of IL8 expression, in situ hybridization was performed on 4um thick formalin-fixed, paraffin-embedded tissue sections mounted on glass slides. The process was automated on the Leica BOND Rx platform (Buffalo Grove, IL). A 20 zz pair probe to the target region, 2–1082 of IL8, were used (Advanced Cell Diagnostics, Inc., Newark, CA). Tissue sections were pre-treated with heat and protease before hybridization with oligonucleotide probes. Detection and amplification was performed with the RNAscope 2.5 LSx Reagent Kit in Red (Advanced Cell Diagnostics, Inc., Newark, CA).
Statistical analyses
Time-to-event outcomes were estimated using the Kaplan-Meier method, which was used to estimate the probability of overall survival (OS) and to estimate the median OS for the IMvigor210 and IMvigor211 cohorts or PFS for IMmotion150 cohorts, and Kaplan-Meier curves were calculated. The OS or PFS were compared by the log-rank test. For OS and PFS analysis, data for patients who were alive were censored at the time of the last contact. The hazard ratios and 95% confidence intervals for OS and PFS were estimated by a Cox regression model. Cox proportional hazards and linear regression models were performed to conduct univariate and multivariate analysis. Multivariate Cox proportional hazard models were used to investigate associations of plasma IL8 and overall survival, adjusting for confounders and other prognostic factors. Results were presented as hazard ratios (HRs) with 95% confidence intervals (95% CIs), as well as P values. Age and SLD were used as continuous variables. Sex, race, ECOG, liver mets were used as categorical variables for bladder. Sex, race, ECOG, MSKCC scores and previous nephrectomy were used as categorical variables for RCC.
Software versions
Computational analysis was performed using Cell Ranger software (10x Genomics) version 2.2.1, Seurat version 3.0, SingleR version 1.0.1, Perl version 5.18.4, R version 3.6.0, and the following packages and versions in R for analysis: Seurat, 3.0.0; edgeR, 3.26.0; cluster, 2.0.8; dynamicTreeCut, 1.63–1; UMAP, WGCNA, 1.66; and survival, 2.42–6.
Figures and tables were generated using the following packages and versions in R: RColorBrewer, 1.1–2; ggplot2, 3.1.1; gridExtra, 2.3; ComplexHeatmap, 2.0.0; superheat, 1.0.0; colorspace, 1.3–2; dplyr, 0.7.8; and data for external datasets were obtained using GenomicDataCommons, 1.4.3; GEOquery, 2.48.0.
The above R packages depended secondarily on the following support packages: Matrix, 1.2–17; Biobase, 2.40.0; BiocGenerics, 0.26.0; cowplot, 0.9.3; DDRTree, 0.1.5; edgeR, 2.13.0; irlba, 2.3.2; limma, 3.38.2; magrittr, 1.5; Matrix, 1.2–15; ranger, 0.10.1; and VGAM, 1.0–6.
Data Availability Statement
Qualified researchers may request access to individual patient-level data through the clinical study data request platform (http://www.clinicalstudydatarequest.com). Further details on Roche’s criteria for eligible studies are available here (https://clinicalstudydatarequest.com/Study-Sponsors/Study-Sponsors-Roche.aspx). For further details on Roche’s Global Policy on the Sharing of Clinical Information and how to request access to related clinical study documents, see here (http://www.roche.com/research_and_development/who_we_are_how_we_work/clinical_trials/our_commitment_to_data_sharing.htm). Raw data analyzed in this study has been submitted to the European Genome-Phenome Archive (EGA) with accession numbers EGAS00001004008, EGAS00001004229 and EGAS00001004230. Raw and processed count matrix of single cell RNAseq data has been submitted to Gene Expression Omnibus (GEO) with accession number GSE145281.
Extended Data
Extended Data Fig. 1. Study profile of IMvigor210, IMvigor211 and IMmotion150 trials.
a, Study profile of IMvigor210, IMvigor211 and IMmotion150 trials. Flowchart showing number of intent-to-treat (ITT) patients IMvigor210, IMvigor211 and IMmotion150, as well as the numbers of patients whose plasma, PBMC and RNAseq samples were included for analysis. Tables showing the demographic characteristics of biomarker-evaluable patients in b, IMvigor210 (n=329) and IMvigor211 (n=868) cohorts, and c, IMmotion150 (n=248) cohort. P values are calculated by two-sided Fisher’s exact test. Tables showing univariate and multivariate logistic regression analyses of baseline plasma IL8 with different factors in overall survival in d, IMvigor210 (n=329) and IMvigor211(n=868) cohorts and e, IMmotion150 (n=248) cohort. HR calculated using stratified Cox proportional hazard regression models, and P values calculated using stratified log-rank test (for details, see Methods). P values were adjusted for multiple comparisons. Multivariate analyses adjusted HRs for age, sex, race, ECOG performance status, presence of liver metastasis, and tumor burden (sum of longest diameter, SLD) in mUC; and age, sex, Memorial Sloan Kettering Cancer Risk (MSKCC) prognostic risk score, previous nephrectomy, and SLD in mRCC data sets.
Extended Data Fig. 2. Correlation between pIL8 and other cancer immunotherapy biomarkers.
a, Correlation between pIL8 and neutrophil-to-lymphocyte ratio (NLR) in mUC (IMvigor210) (n=217). NLR (x-axes) were log10 transformed before Pearson correlations (Corr) with pIL8, which were log 2 transformed (y-axes). The corresponding p values (two tailed t-test) are shown. Correlation between pIL8 and b, T-effector (Teff) (n=329), c, Tumor mutation burden (TMB) (n=255), d, Neoantigen load (n=230), e, PD-1 expression (PDCD1), f, PD-L1 (CD274), g, TGFb-response (F-TBRS), h, Tumor immune dysfunction and exclusion (TIDE) T cell dysfunction signature (n=329). Pearson correlations (Corr) between labeled biomarkers (x-axes) with pIL8, which were log 2 transformed (y-axes) and corresponding p values (two tailed t-test) are shown. i, Microsatellite instable (MSI) status. MSS, microsatellite stable; MSI-H, microsatellite instable-high (n=329).
Extended Data Fig. 3. Elevated baseline pIL8 is associated with poor clinical outcome.
a, Kaplan-Meier curves depict overall survival (OS) of median T-effector (Teff) signature in cohort 2 of IMvigor210. Hazard ratios (HRs) and their 95% confidence intervals (CIs) were calculated using stratified Cox proportional hazards regression models, and p values were calculated using stratified log-rank test. HR and p value are adjusted for age, sex, race, ECOG performance status, presence of liver metastasis, and tumor burden (sum of longest diameter, SLD). b, Kaplan-Meier curves depict overall survival (OS) of baseline plasma IL8 (pIL8) levels in cohort 1 of IMvigor210. Censored data are indicated by vertical tick marks in Kaplan-Meier curves. Number of patients per group and time point are indicated below the graphs. Hazard ratios (HRs) and their 95% confidence intervals (CIs) were calculated using stratified Cox proportional hazards regression models, and p values were calculated using stratified log-rank test. HR and p value are adjusted for age, sex, race, ECOG performance status, presence of liver metastasis, and tumor burden (sum of longest diameter, SLD). c, Association between high vs low pIL8 (median cutoff) and Objective Response Rate (ORR) in cohort 1 of IMvigor210. High baseline pIL8 levels were associated with a higher number of nonresponders (SD and PD) (P= 0.025, two-sided Fisher’s exact test) by Response Evaluation Criteria in Solid Tumors (RECIST) 2.1. [CR: complete response; PR, partial response; SD, stable disease; PD, progressive disease]. d, Association between high vs low Teff (median cutoff) and OS in cohort 2 of IMvigor210 (HR: 0.71, 95% CI: 0.53, 0.95, P=0.0201). Hazard ratios (HRs) and their 95% confidence intervals (CIs) were calculated using stratified Cox proportional hazards regression models, and p values were calculated using stratified log-rank test. HR and p value are adjusted for sex, age, race, ECOG performance status, presence of liver metastasis, and tumor burden (sum of longest diameter, SLD). e, Association between high vs low baseline plasma IL8 (median cutoff) and Objective Response Rate (ORR) in IMmotion150A trend in low plasma IL8 in Atezo monotherapy associated with a higher number of responders compared to Atezo+Bev and Sunitinib treatment arms (CR and PR) (P= 0.348, 0.409 and 0.271, respectively two-sided Fisher’s exact test) f, Association of high vs low of baseline tumor IL8 expression and Objective Response Rate (ORR) in IMmotion150. A trend observed in low tumor IL8 in atezo monotherapy associated with higher numbers of responders (CR and PR) compared to Atezo+Bev and Sunitinib treatment arms (P= 0.178, 0.05, and 0.773, respectively).
Extended Data Fig. 4. Elevated on-treatment pIL8 is associated with poor clinical outcome.
Association between high vs low ratio of pIL8 levels on treatment cycle 3 day 1 (C3D1) and baseline (C1D1) and Objective Response Rate (ORR) in a, cohort 1, b, cohort 2 of IMvigor210. High ratios were associated with a higher number of nonresponders (SD and PD) in cohort 1 (P= 0.042, two-sided Fisher’s exact test) and cohort 2 (P= 0.027, two-sided Fisher’s exact test) of IMvigor210. c, Kaplan-Meier curves depict OS of C3D1 and C1D1 ratio of pIL8 levels in cohort 1 of IMvigor210 (HR: 4.98, 95% CI: 1.83, 13.5, P=0.0016). Hazard ratios (HRs) and their 95% confidence intervals (CIs) were calculated using stratified Cox proportional hazards regression models, and p values were calculated using stratified log-rank test. HR and p value are adjusted for sex, age, race, ECOG performance status, presence of liver metastasis, and tumor burden (sum of longest diameter, SLD). d, High ratios were significantly associated with a higher number of nonresponders (SD and PD) in atezolizumb (P=8.22e-4, two-sided Fisher’s exact test) and but not in chemotherapy (P=0.060, two-sided Fisher’s exact test) arms of IMvigor211. e, The absolute lymphoid and myeloid counts in patients in atezolizumb (n=443) and chemotherapy (n=425) arms IMvigor211. Absolute lymphocyte counts: Atezo, C1D1: minima: 0, maxima: 3.74, Percentile 75%: 1.70, 50%: 1.32, 25%: 1.00. Atezo, C3D1: minima: 0, maxima: 3.5, Percentile 75%: 1.75, 50%: 1.38, 25%: 1.00. Chemo, C1D1: minima: 0, maxima: 4.08, Percentile 75%: 1.70, 50%: 1.20, 25%: 0.90. Chemo, C3D1: minima: 0, maxima: 3.89, Percentile 75%: 1.81, 50%: 1.40, 25%: 1.00. Absolute monocyte counts: Atezo, C1D1: minima: 0, maxima: 2.25, Percentile 75%: 0.80, 50%: 0.61, 25%: 0.49. Atezo, C3D1: minima: 0, maxima: 2.2, Percentile 75%: 0.82, 50%: 0.61, 25%: 0.49. Chemo, C1D1: minima: 0, maxima: 2.2, Percentile 75%: 0.82, 50%: 0.61, 25%: 0.49. Chemo, C3D1: minima: 0, maxima: 3.08, Percentile 75%: 0.90, 50%: 0.70, 25%: 0.50. P values are calculated by two-sided Mann-Whitney U-tests.
Extended Data Fig. 5. Single cell RNAseq profiles of PBMC from bladder patients in IMvigor210 trial.
UMAP plot of the mUC PBMCs, with each cell in the entire single cell RNAseq color coded for (left to right): a, responses (Responders (n=7903) and nonresponders (n=6571)); b, the corresponding patient R1 (n=2761), R2 (n=1522), R3 (n=463), R4 (n=1194), R5 (n=1963) and NR1 (n=3189), NR2 (n=849), NR3 (n=1018), NR4 (n=697), NR5 (n=818) and c, the number of transcripts detected in that cell (log 10 scale). d, the fraction of cells originating from responders and nonresponders; e, the fraction of cells originating from each of the 10 patients; f, box plots of the number of transcripts (log10) across all different cell types. Monocytes (n=6761), minima: 2.92, maxima: 4.35, and Percentile 75%: 3.59, 50%: 3.39, 25%: 3.20. CD16 Monocytes (n=623), minima: 2.92, maxima: 3.65, and Percentile 75%: 3.29, 50%: 3.23, 25%: 3.16. DC-like (n=305), minima: 2.96, maxima: 4.17, and Percentile 75%: 3.55, 50%: 3.35, 25%: 3.19. DC (n=391), minima: 2.95, maxima: 3.65, and Percentile 75%: 3.24, 50%: 3.17, 25%: 3.09. Megakaryocyte (n=294), minima: 2.94, maxima: 3.67, and Percentile 75%: 3.67, 50%: 3.19, 25%: 3.11. CD8+ T cells (n=565), minima: 2.93, maxima: 4.15, and Percentile 75%: 3.61, 50%: 3,42, 25%: 3.21. CD8+ Tcm (n=1388), minima: 2.93, maxima: 4.22, and Percentile 75%: 3.51, 50%: 3.34, 25%: 3.19. CD8+ Tem (n=1194), minima: 2.92, maxima: 4.10, and Percentile 75%: 3.56, 50%: 3,38, 25%: 3.20. CD4+ T cells (n=443), minima: 2.94, maxima: 4.02, centre: 0.75 and Percentile 75%: 3.58, 50%: 3.39, 25%: 3.21. CD4+ Tcm (n=451), minima: 2.91, maxima: 4.45, and Percentile 75%: 3.54, 50%: 3.32, 25%: 3.18. CD4+ Tem (n=335), minima: 2.93, maxima: 4.06, and Percentile 75%: 3.47, 50%: 3.28, 25%: 3.15. Tregs (n=238), minima: 2.90, maxima: 4.15, and Percentile 75%: 3.49, 50%: 3.30, 25%: 3.14. NK cells (n=1099), minima: 2.90, maxima: 4.27, and Percentile 75%: 3.56, 50%: 3.36, 25%: 3.16. B cells (n=387), minima: 2.91, maxima: 3.96, and Percentile 75%: 3.51, 50%: 3.32, 25%: 3.19, g, UMAP plot shows the distribution of different cell types between responders and non responders. Responders (n=7903) and nonresponders (n=6571).
Extended Data Fig. 6. Differential expression analysis of IL8 expression in myeloid cells.
a, Gene set enrichment REACTOME pathways analysis between IL8 high vs IL8 low cells (median cutoff) in all myeloid clusters (n=8374). Differential expression analysis with the generalized linear models (glm)-based statistical methods of the edgeR package with Benjamini & Hochberg corrections. Normalized enrichment scores, log FDR corrected, are shown in x axis. Top 10 pathways associated with IL8 high myeloid cells were shown in orange and top 10 pathways associated with IL8 low myeloid cells were shown in blue. b, Differential gene expression of IL8 high vs low populations in different myeloid clusters: a, Monocytes (n=6761), b, CD16 Monocytes (n=623), c, DC (n=391), d, DC-like (n=305) and e, Megakaryocytes (n=294). Differential expression analysis with the generalized linear models (glm)-based statistical methods of the edgeR package with Benjamini & Hochberg corrections. Genes that are enriched in IL8 high are shown in orange and those that are enriched in IL8 low are shown in blue.
Extended Data Fig. 7. Differential expression analysis of response in myeloid cells.
a, Differential gene expression analysis between responders (n=3988) and non responders (n=4386) in all myeloid cells shows a significant enrichment of myeloid inflammatory response genes (red) in non responders whereas a significant enrichment of antigen presentation machinery genes (green) in responders. b, Gene set enrichment REACTOME pathways analysis between responders and non responders in myeloid cells. Differential expression analysis with the generalized linear models (glm)-based statistical methods of the edgeR package with Benjamini & Hochberg corrections. Normalized enrichment scores, log FDR corrected, are shown in x axis. Top 10 pathways associated with responders were shown in green and top 10 pathways associated with non responders were shown in red. Differential gene expression analysis between responders and non responders within c, Monocytes (n=6761), d, CD16 Monocytes (n=623), e, DC (n=391), f, DC-like (n=305) and g, Megakaryocytes (n=294) shows a significant enrichment of myeloid inflammatory response genes (red) in non responders whereas a significant enrichment of antigen presentation machinery and T cell activation genes (green) in responders. Differential expression analysis with the generalized linear models (glm)-based statistical methods of the edgeR package with Benjamini & Hochberg corrections.
Extended Data Fig. 8. Differential expression analysis of IL8 expression in tumor associated myeloid cells from single cell RNAseq of RCC patients.
UMAP plot of the mRCC blood and tumor, with each cell in the entire single cell RNAseq color coded for (left to right): a, Blood (n=13,694) and Tumor (n=11,765); b, the corresponding patient c, the proportion of cells identified in each cell type in blood and tumor d, the proportion of cells identified in each cell type in each patient. e, Scaled average expression of cell type specific markers in scRNA of mRCC tumor. Tcm, central memory T cell; Tem, effector memory; M1-like, M1-like macrophages; M2-like, M2-like Macrophages. Differential gene expression analysis between IL8-high and IL8-low within each myeloid cell type in the tumor. f, monocytes (n=2821). g, M1-like macrophages (n=2452). h, M2-like macrophages (n=553). i, CD16 monocytes (n=454) shows a significant enrichment of myeloid inflammatory response genes (orange) in IL8 high whereas a significant enrichment of antigen presentation machinery genes (blue) in IL8 low. Differential expression analysis with the generalized linear models (glm)-based statistical methods of the edgeR package with Benjamini & Hochberg corrections.
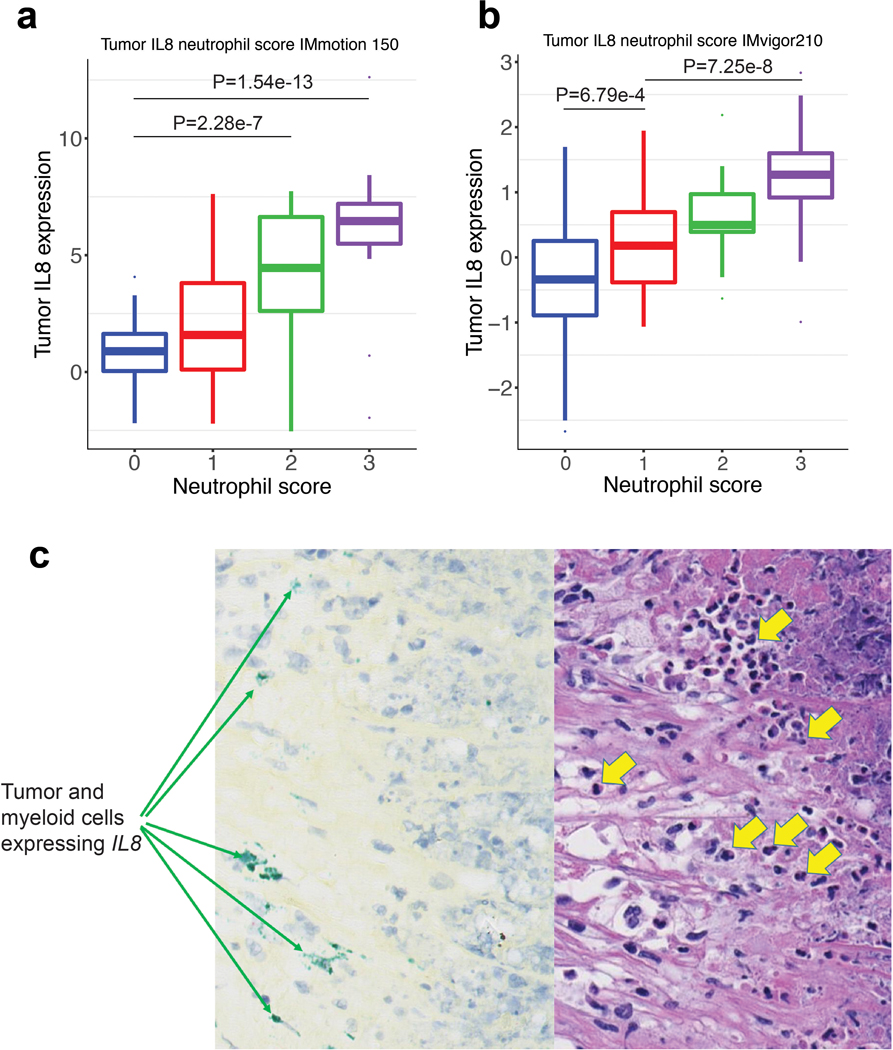
Extended Data Fig. 9. Correlation of IL8 gene expression and neutrophil score in bladder and RCC tumors.
IL8 gene expression and histological assessment of neutrophils by H&E stain in a, mRCC (IMmotion 150) (n=100) tumors. Neutrophil score 0 (n=37): minima: −2.19, maxima: 4.07, and Percentile 75%: 1.63, 50%: 0.89, 25%: 0.04. Neutrophil score 1 (n=24): minima: −2.21, maxima: 7.62, and Percentile 75%: 3.8, 50%: 1.5, 25%: 0.10. Neutrophil score 2 (n=18): minima: −2.54, maxima: 7.72, and Percentile 75%: 6.63, 50%:4.45, 25%:2.6. Neutrophil score 3 (n=21): minima: −1.96, maxima:12.6, and Percentile 75%: 7.20, 50%: 6.46, 25%: 5.49. P values are calculated by two-sided Mann-Whitney U-tests with Benjamini & Hochberg corrections. b, mUC (IMVigor 210) (n=339) tumors. Neutrophil score 0 (n=227): minima: −2.67, maxima: 2.58, and Percentile 75%: 0.25, 50%: −0.34, 25%: −0.89. Neutrophil score 1 (n=39): minima: −1.06, maxima: 1.95, and Percentile 75%: 0.70, 50%: 0.18, 25%: −0.38. Neutrophil score 2 (n=33): minima: −0.63, maxima: 2.19, and Percentile 75%: 0.97, 50%: 0.50, 25%: 0.39. Neutrophil score 3 (n=40): minima: −0.99, maxima: 2.83, and Percentile 75%: 1.60, 50%: 1.27, 25%: 0.92. P values are calculated by two-sided Mann-Whitney U-tests with Benjamini & Hochberg corrections. Neutrophils were identified by trained pathologists based on their unique morphological features. Prevalence of neutrophils was graded on a scale from 0 to 3 as follows: 0 – absence of neutrophils, 1 – rare neutrophils, 2 – moderate number of neutrophils, 3 – numerous neutrophils in the form of large aggregates or sheets. c, Representative images of 22 out of a total of 59 samples examined (37%) showing positive signals of IL8 in situ hybridization (ISH; green signal, left panel) and H&E-stain (right panel) of sections from the same area of the specimen. ISH shows IL8 expression in tumor and myeloid cells; H&E shows neutrophils (yellow arrows) in the vicinity of IL8 expressing cells.
Extended Data Fig. 10. Differential gene expression in high and low pIL8 in CD8 T cell clusters and in PBMC from the entire IMvigor210 cohort.
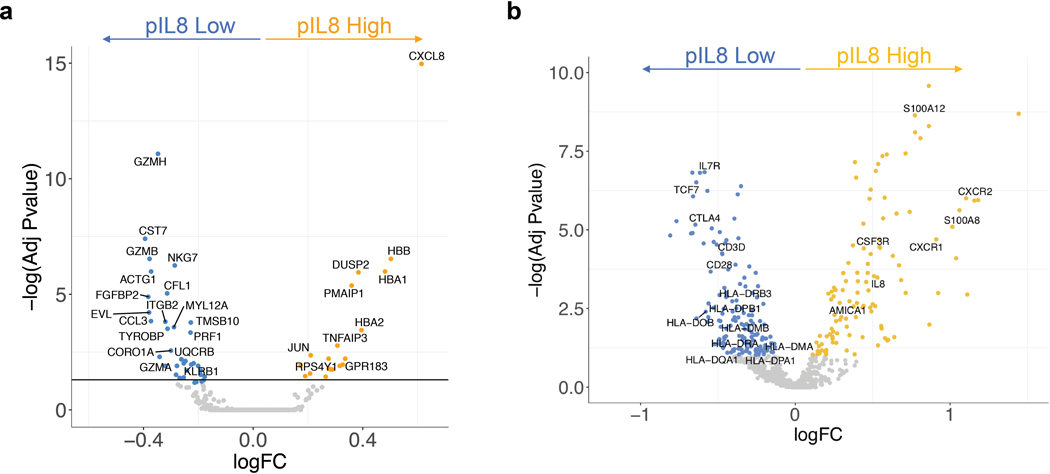
a, Differential single cell RNAseq gene expression of CD8 T cell clusters from plasma IL8 high (n=5) vs low patients (n=5). Differential expression analysis with the generalized linear models (glm)-based statistical methods of the edgeR package with Benjamini & Hochberg corrections. b, Differential NanoString gene expression of plasma IL8 high vs low patients in IMvigor210 (n=407). Differential expression analysis with the generalized linear models (glm)-based statistical methods of the edgeR package with Benjamini & Hochberg corrections.
Supplementary Material
Acknowledgments
We are thankful for the technical assistance for scRNASeq analysis provided by Leonard Goldstein and Thomas Wu. We thank Linda Rangell for the assistance in IL8 ISH experiments. Editorial assistance provided by Anshin Biosolutions (Santa Clara, CA). D.F.M. was supported by DFHCC KCP SPORE grant (5P50CA101942).
Competing interest
K.C.Y., L.L., V.G., C.L., D.P., P.W., E.E.K., H.K., S.M., S.K., Y.-J.C, Z.M., J.L.G., R.B., N.L., A.C.T., X.S., D.T., P.H., M.A.H., and S.M. are employees of Genentech, Inc. KH is an employee of Roche Products Ltd. D.F.M. reports a consulting/advisory role for Bristol-Myers Squibb, Merck, Roche/Genentech, Pfizer, Exelixis, Novartis, Eisai, X4 Pharmaceuticals, and Array BioPharma; and reports that his home institution receives research funding from Prometheus Laboratories. T.P. reports honoraria and consulting/advisory roles with Roche/Genentech, Bristol-Myers Squibb, and Merck; consulting/advisory role with AstraZeneca and Novartis; research funding from AstraZeneca/MedImmune and Roche/Genentech; and other relationships with Ipsen and Bristol-Myers Squibb. J.E.R. has received trial funding and consulting fees from Roche Genentech, Bayer, Seattle Genetics, AstraZeneca, Astellas and QED Therapeutics. M.S.v.d.H. has advisory board agreements with Roche Genentech, Astellas, and AstraZeneca, and has received grants from Astellas.
References
- 1.Sanmamed MF, et al. Changes in serum interleukin-8 (IL-8) levels reflect and predict response to anti-PD-1 treatment in melanoma and non-small-cell lung cancer patients. Ann Oncol 28, 1988–1995 (2017). [DOI] [PMC free article] [PubMed] [Google Scholar]
- 2.McDermott DF, et al. Clinical activity and molecular correlates of response to atezolizumab alone or in combination with bevacizumab versus sunitinib in renal cell carcinoma. Nat Med 24, 749–757 (2018). [DOI] [PMC free article] [PubMed] [Google Scholar]
- 3.Najjar YG, et al. Myeloid-Derived Suppressor Cell Subset Accumulation in Renal Cell Carcinoma Parenchyma Is Associated with Intratumoral Expression of IL1beta, IL8, CXCL5, and Mip-1alpha. Clin Cancer Res 23, 2346–2355 (2017). [DOI] [PMC free article] [PubMed] [Google Scholar]
- 4.Ugel S, De Sanctis F, Mandruzzato S & Bronte V. Tumor-induced myeloid deviation: when myeloid-derived suppressor cells meet tumor-associated macrophages. J Clin Invest 125, 3365–3376 (2015). [DOI] [PMC free article] [PubMed] [Google Scholar]
- 5.Sharma P, Hu-Lieskovan S, Wargo JA & Ribas A. Primary, Adaptive, and Acquired Resistance to Cancer Immunotherapy. Cell 168, 707–723 (2017). [DOI] [PMC free article] [PubMed] [Google Scholar]
- 6.Blank CU, Haanen JB, Ribas A & Schumacher TN CANCER IMMUNOLOGY. The “cancer immunogram”. Science 352, 658–660 (2016). [DOI] [PubMed] [Google Scholar]
- 7.Baggiolini M, Walz A & Kunkel SL Neutrophil-activating peptide-1/interleukin 8, a novel cytokine that activates neutrophils. J Clin Invest 84, 1045–1049 (1989). [DOI] [PMC free article] [PubMed] [Google Scholar]
- 8.Fernando RI, Castillo MD, Litzinger M, Hamilton DH & Palena C. IL-8 signaling plays a critical role in the epithelial-mesenchymal transition of human carcinoma cells. Cancer Res 71, 5296–5306 (2011). [DOI] [PMC free article] [PubMed] [Google Scholar]
- 9.David JM, Dominguez C, Hamilton DH & Palena C. The IL-8/IL-8R Axis: A Double Agent in Tumor Immune Resistance. Vaccines (Basel) 4(2016). [DOI] [PMC free article] [PubMed] [Google Scholar]
- 10.Alfaro C, et al. Tumor-Produced Interleukin-8 Attracts Human Myeloid-Derived Suppressor Cells and Elicits Extrusion of Neutrophil Extracellular Traps (NETs). Clin Cancer Res 22, 3924–3936 (2016). [DOI] [PubMed] [Google Scholar]
- 11.Sanmamed MF, et al. Serum interleukin-8 reflects tumor burden and treatment response across malignancies of multiple tissue origins. Clin Cancer Res 20, 5697–5707 (2014). [DOI] [PubMed] [Google Scholar]
- 12.Rosenberg JE, et al. Atezolizumab in patients with locally advanced and metastatic urothelial carcinoma who have progressed following treatment with platinum-based chemotherapy: a single-arm, multicentre, phase 2 trial. Lancet 387, 1909–1920 (2016). [DOI] [PMC free article] [PubMed] [Google Scholar]
- 13.Balar AV, et al. Atezolizumab as first-line treatment in cisplatin-ineligible patients with locally advanced and metastatic urothelial carcinoma: a single-arm, multicentre, phase 2 trial. Lancet 389, 67–76 (2017). [DOI] [PMC free article] [PubMed] [Google Scholar]
- 14.Powles T, et al. Atezolizumab versus chemotherapy in patients with platinum-treated locally advanced or metastatic urothelial carcinoma (IMvigor211): a multicentre, open-label, phase 3 randomised controlled trial. Lancet 391, 748–757 (2018). [DOI] [PubMed] [Google Scholar]
- 15.Mariathasan S, et al. TGFbeta attenuates tumour response to PD-L1 blockade by contributing to exclusion of T cells. Nature 554, 544–548 (2018). [DOI] [PMC free article] [PubMed] [Google Scholar]
- 16.Jiang P, et al. Signatures of T cell dysfunction and exclusion predict cancer immunotherapy response. Nat Med 24, 1550–1558 (2018). [DOI] [PMC free article] [PubMed] [Google Scholar]
- 17.Cristescu R, et al. Pan-tumor genomic biomarkers for PD-1 checkpoint blockade-based immunotherapy. Science 362(2018). [DOI] [PMC free article] [PubMed] [Google Scholar]
- 18.Powles T, et al. MPDL3280A (anti-PD-L1) treatment leads to clinical activity in metastatic bladder cancer. Nature 515, 558–562 (2014). [DOI] [PubMed] [Google Scholar]
- 19.Jakubzick CV, Randolph GJ & Henson PM Monocyte differentiation and antigen-presenting functions. Nat Rev Immunol 17, 349–362 (2017). [DOI] [PubMed] [Google Scholar]
- 20.Gabrilovich DI, Ostrand-Rosenberg S & Bronte V. Coordinated regulation of myeloid cells by tumours. Nat Rev Immunol 12, 253–268 (2012). [DOI] [PMC free article] [PubMed] [Google Scholar]
- 21.Mantovani A, et al. The chemokine system in diverse forms of macrophage activation and polarization. Trends Immunol 25, 677–686 (2004). [DOI] [PubMed] [Google Scholar]
- 22.Bruchard M, et al. Chemotherapy-triggered cathepsin B release in myeloid-derived suppressor cells activates the Nlrp3 inflammasome and promotes tumor growth. Nat Med 19, 57–64 (2013). [DOI] [PubMed] [Google Scholar]
- 23.Rini BI, et al. IMA901, a multipeptide cancer vaccine, plus sunitinib versus sunitinib alone, as first-line therapy for advanced or metastatic renal cell carcinoma (IMPRINT): a multicentre, open-label, randomised, controlled, phase 3 trial. Lancet Oncol 17, 1599–1611 (2016). [DOI] [PubMed] [Google Scholar]
- 24.Yost KE, et al. Clonal replacement of tumor-specific T cells following PD-1 blockade. Nat Med 25, 1251–1259 (2019). [DOI] [PMC free article] [PubMed] [Google Scholar]
- 25.Lee YS, et al. Interleukin-8 and its receptor CXCR2 in the tumour microenvironment promote colon cancer growth, progression and metastasis. Br J Cancer 106, 1833–1841 (2012). [DOI] [PMC free article] [PubMed] [Google Scholar]
- 26.Steele CW, et al. CXCR2 Inhibition Profoundly Suppresses Metastases and Augments Immunotherapy in Pancreatic Ductal Adenocarcinoma. Cancer Cell 29, 832–845 (2016). [DOI] [PMC free article] [PubMed] [Google Scholar]
- 27.Ruffell B, Affara NI & Coussens LM Differential macrophage programming in the tumor microenvironment. Trends Immunol 33, 119–126 (2012). [DOI] [PMC free article] [PubMed] [Google Scholar]
- 28.Ruffell B & Coussens LM Macrophages and therapeutic resistance in cancer. Cancer Cell 27, 462–472 (2015). [DOI] [PMC free article] [PubMed] [Google Scholar]
- 29.Ridker PM, et al. Effect of interleukin-1beta inhibition with canakinumab on incident lung cancer in patients with atherosclerosis: exploratory results from a randomised, double-blind, placebo-controlled trial. Lancet 390, 1833–1842 (2017). [DOI] [PubMed] [Google Scholar]
- 30.Stuart T, et al. Comprehensive Integration of Single-Cell Data. Cell 177, 1888–1902 e1821 (2019). [DOI] [PMC free article] [PubMed] [Google Scholar]
- 31.Aran D, et al. Reference-based analysis of lung single-cell sequencing reveals a transitional profibrotic macrophage. Nat Immunol 20, 163–172 (2019). [DOI] [PMC free article] [PubMed] [Google Scholar]
- 32.Gupta V, et al. Bioanalytical qualification of clinical biomarker assays in plasma using a novel multi-analyte Simple Plex() platform. Bioanalysis 8, 2415–2428 (2016). [DOI] [PubMed] [Google Scholar]
- 33.Wu TD, Reeder J, Lawrence M, Becker G & Brauer MJ GMAP and GSNAP for Genomic Sequence Alignment: Enhancements to Speed, Accuracy, and Functionality. Methods Mol Biol 1418, 283–334 (2016). [DOI] [PubMed] [Google Scholar]
- 34.Wu TD & Nacu S. Fast and SNP-tolerant detection of complex variants and splicing in short reads. Bioinformatics 26, 873–881 (2010). [DOI] [PMC free article] [PubMed] [Google Scholar]
- 35.Lawrence M, et al. Software for computing and annotating genomic ranges. PloS Comput Biol 9, e1003118 (2013). [DOI] [PMC free article] [PubMed] [Google Scholar]
- 36.Mariathasan S, et al. TGFbeta attenuates tumour response to PD-L1 blockade by contributing to exclusion of T cells. Nature 554, 544–548 (2018). [DOI] [PMC free article] [PubMed] [Google Scholar]
- 37.McDermott DF, et al. Clinical activity and molecular correlates of response to atezolizumab alone or in combination with bevacizumab versus sunitinib in renal cell carcinoma. Nat Med 24, 749–757 (2018). [DOI] [PMC free article] [PubMed] [Google Scholar]
Associated Data
This section collects any data citations, data availability statements, or supplementary materials included in this article.
Supplementary Materials
Data Availability Statement
Qualified researchers may request access to individual patient-level data through the clinical study data request platform (http://www.clinicalstudydatarequest.com). Further details on Roche’s criteria for eligible studies are available here (https://clinicalstudydatarequest.com/Study-Sponsors/Study-Sponsors-Roche.aspx). For further details on Roche’s Global Policy on the Sharing of Clinical Information and how to request access to related clinical study documents, see here (http://www.roche.com/research_and_development/who_we_are_how_we_work/clinical_trials/our_commitment_to_data_sharing.htm). Raw data analyzed in this study has been submitted to the European Genome-Phenome Archive (EGA) with accession numbers EGAS00001004008, EGAS00001004229 and EGAS00001004230. Raw and processed count matrix of single cell RNAseq data has been submitted to Gene Expression Omnibus (GEO) with accession number GSE145281.


