Abstract
Purpose
To evaluate changes in the retinal microvascular network after posterior chamber phakic implantable collamer lens (ICL) surgery using optical coherence tomography angiography (OCTA) in patients with high myopia.
Methods
Patients with high myopia who underwent ICL surgery were enrolled in this study. All patients underwent comprehensive ophthalmologic exams preoperatively and 1 week, 1 month, and 3 months postoperatively. The vascular densities (VDs) in the retina and the superficial and deep capillary plexuses of different annular and quadrantal areas were evaluated from OCTA images (Zeiss Cirrus 5000). Correlations between the variations in microvascular density and possible factors were further analyzed.
Results
The study comprised 32 eyes of 32 patients. The mean age of the patients was 26.91±7.610 years (15 men and 17 women). A statistically significant reduction in microvascular density in the retina and the superficial plexus was found 1 week and 1 month postoperatively (p<0.05, repeated-measures ANOVA). Further fractal analysis found that the VD of the outer ring declined statistically significantly (p<0.05). A statistically significant decrease was also found in the inferior nasal sector 1 week postoperatively, with an overall decrease in all four quadrants 1 month postoperatively. The microvascular density recovered toward the baseline level 3 months postoperatively. No correlations were observed between the variation in microvascular density and the spherical equivalent (SE), axial length (AL), intraocular pressure (IOP), amplitude of accommodation (AA), or contrast sensitivity.
Conclusions
Retinal microvascular density was decreased postoperatively and then recovered toward the baseline level after 3 months. ICL surgery may have a transient influence on the retinal microvascular network without affecting visual function.
Introduction
It is estimated that 50% of the world’s population will be affected by myopia by 2050 as prevalence is increasing globally, especially in East Asia [1]. High myopia is becoming the leading cause of vision impairment, resulting in a higher risk for cataracts, glaucoma, and vitreoretinal complications [2]. Changes in the macular and optic disc, such as posterior staphyloma, chorioretinal atrophy, lacquer cracks, and peripapillary atrophy, are frequently found in eyes with high myopia and may lead to irreversible visual loss [3,4].
Implantable posterior chamber phakic intraocular lens (ICL) surgery has been introduced for ametropic correction, especially for patients with high myopia [5]. A 3-year prospective clinical trial conducted by the U.S. Food and Drug Administration (FDA) supported the safety, efficacy, and predictability of ICL surgery for moderate and high myopia [6]. Ninety-three percent of the study eyes were within ±1.0 diopters (D) after a 4-year observation period [7]. Although the safety and predictability of ICL surgery have been confirmed [8,9], it has been reported that complications, such as anterior capsular opacification [5,10,11], endothelial cell loss [12], and pigmentary glaucoma [13,14], might still occur after ICL implantation. Although ICL surgery is an intraocular procedure that might further affect the stability of the whole eye, little is known about the effect of ICL implantation surgery on the posterior segment.
Optical coherence tomography angiography (OCTA) is a noninvasive technique used for imaging microvasculature in different layers of the retina and the choroid, with advantages such as a short acquisition time and no need for an injectable dye such as fluorescein. OCTA has been widely used for screening and diagnosing various ocular diseases, such as diabetic retinopathy, macular degeneration, vascular occlusions, central serous chorioretinopathy, and glaucoma [15]. OCTA can also produce a highly sensitive and specific characterization of myopia-related changes in the retina [16]. In previous studies, use of fractal analysis of OCTA images revealed that the density of the superficial and deep microvascular plexuses was statistically significantly lower in the high myopia group than in the control group [17,18], indicating the possible application of OCTA for assessing changes in the microvasculature and predicting the possibility of retinal complications induced by ICL surgery. In the present study, the OCTA technique was used to investigate changes in the microvasculature induced by ICL implantation surgery.
Methods
Patient recruitment
A total of 32 patients (15 male, 17 female) who underwent ICL surgery in the Department of Ophthalmology at the Shanghai General Hospital from December 2016 to December 2018 were enrolled in this study. The mean age of the patients was 26.91±7.61 years. Patients who underwent ICL surgery in the Department of Ophthalmology at the Shanghai General Hospital from December 2016 to December 2018 were enrolled in this study. This prospective study was approved by the Institutional Review Board of Shanghai General Hospital, Shanghai Jiaotong University. The study adhered to the tenets of the Declaration of Helsinki and the ARVO statement on human subjects. Informed consent was obtained from all patients before enrollment.
The inclusion criteria of this study were as follows: patients with nonpathologic high myopia (spherical equivalent ≤ −5.0 D) who were willing to undergo ICL surgery for refractive correction and were older than 18 years old. Patients with intraocular pressure (IOP) higher than 21 mmHg, anterior chamber depth (the distance from the endothelium to the anterior surface of the crystalline lens) of less than 2.8 mm, any vitreoretinal disease, presence of media opacity, presence of staphyloma, history of intraocular surgery, and any systemic disease or any other condition that was ineligible for ICL surgery were excluded from this study.
Preoperative examination and follow-up visits
Clinical information, including age, sex, spherical equivalent (SE), corrected distance visual acuity (CDVA), axial length (AL), IOP, and amplitude of accommodation (AA), was collected before surgery and at each follow-up visit. Patients also underwent comprehensive ophthalmologic examinations and funduscopic examinations to exclude possible vitreoretinal diseases. Refraction was measured with an autorefractometer and described as the SE (spherical dioptric power plus half of the cylindrical dioptric power). CDVA (logMAR) was measured manually by an experienced optometrist. The axial length was measured with an intraocular lens master (IOL Master; Master 500, Carl Zeiss, Jena, Germany). IOP was obtained with a noncontact tonometer (Full Auto Tonometer TX-F, Canon, Utsunomiyashi, Japan). AA was measured with the push-up test. The contrast threshold (CT) was measured with a CGT-1000 Contrast Glare Tester (Takagi, Nakano, Japan). The CT was automatically determined with six sizes of annular stimuli ranging from 6.3° to 0.7° of the visual angle, with and without glare conditions. Postoperative follow-up visits were conducted 1 week, 1 month, and 3 months postoperatively. All ophthalmic parameters were independently measured three times by an experienced doctor and an experienced optometrist.
Surgical technique
The STAAR sizing formula was applied to determine the size of ICLs used for patients, according to the horizontal corneal diameter (HCD) and the anterior chamber depth (ACD). Standard ICL implantation surgery was performed on all patients by the same doctor (BL Ke). Briefly, on the day of surgery, patients were administered 0.5% tropicamide to fully dilate the pupils, and then topical anesthesia was applied with 0.4% dibucaine hydrochloride half an hour preoperatively. After the placement of hyaluronic acid, the surgeon slowly inserted the ICL into the anterior chamber through a 3 mm corneal incision. After gently removing the remaining viscoelastic substances, the surgeon then irrigated and aspirated the eyes with normal saline solution. Topical corticosteroids and antibiotics were administered postoperatively to prevent infection and inflammation.
OCTA imaging and processing
Optical coherence tomography angiography (OCTA) was obtained using a Zeiss Cirrus 5000 with an Angioplex OCTA device (Carl Zeiss Meditec, Dublin, CA). (Figure 1) The technique was described previously [17]. Briefly, 6 × 6 mm scans were acquired for the right eye of each patient at a scan rate of 68,000 Hz. Images of the retinal vascular network (RVN), superficial vascular plexus (SVP), and deep vascular plexus (DVP) were exported for further processing and fractal analysis. The SVP indicated the vessel network between the internal limiting membrane (ILM) and the inner plexiform layer (IPL), while the DVP was defined as the vascular network located on the surface of the outer nuclear layer (ONL) between the inner nuclear layer (INL) and the outer plexiform layer (OPL) [19].
Figure 1.
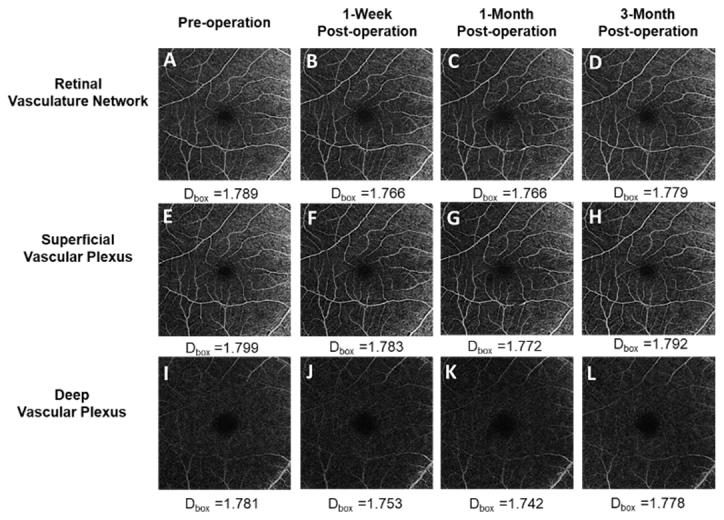
Pre- and postoperative 6 × 6 mm2 OCTA scan images. A–D: The images show the retinal vascular network (RVN) preoperatively and at the three follow-up visits (1 week, 1 month, and 3 months postoperatively). E–H: The images show the superficial vascular plexus (SVP). I–L: The images show the deep vascular plexus (DVP) at the three time points described above.
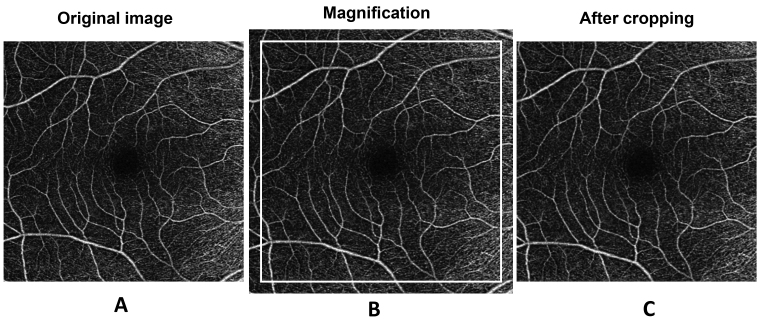
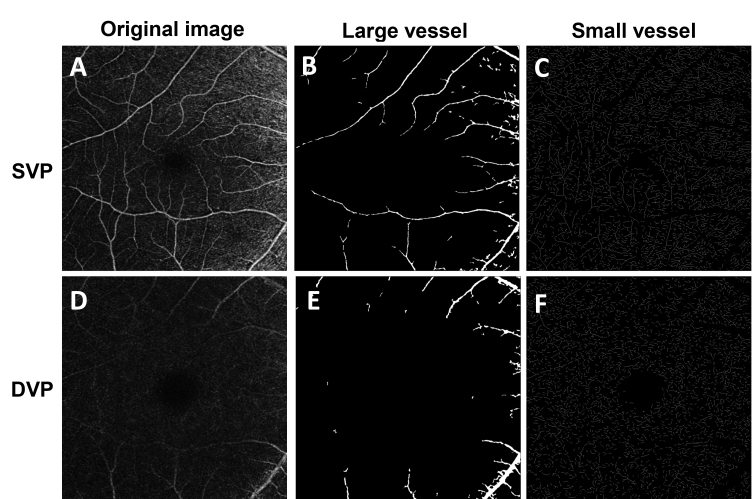
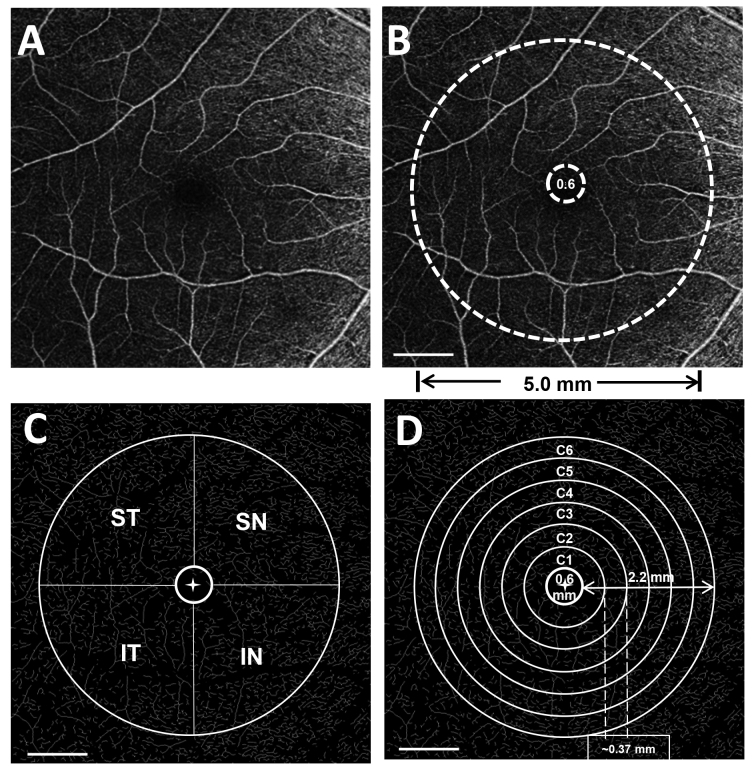
Magnification effects produced by variations in the axial length might affect the ocular biometric results measured with OCT as well as OCT angiograms; thus, we used Bennett’s formula (scaling factor = 0.013062 × [AL – 1.82]) to resize the images according to the patients’ axial length [20] [21]. The details of the image processing were described previously [17]. The OCTA image acquired was adjusted according to the axial length and then cropped to 1024 × 1024 pixels (Figure 2). The processed image was used for further analysis, which met the image requirements of the software program used for vessel segmentation. The segmentation software was developed and run in the MATLAB environment (MathWorks, Inc., Natick, MA) and processed the images by inverting, equalizing, and removing background noise and nonvessel structures, and then creating a binary image (Figure 3). Vessels with diameters larger than 25 µm were considered large vessels and were separated from the images. The remaining vessels were small, which were used for analysis of microvascular density. The removal of large vessels helped to eliminate projection artifacts from the superficial vascular plexus in the deep vascular plexus. The microvascular network was then skeletonized and partitioned. The center of the foveal avascular zone (FAZ) was detected and delineated by the software. The FAZ (diameter = 0.6 mm) centered on the fovea was removed. The annulus from 0.6 mm to 5.0 mm was defined as the annular zone. The annulus was further subdivided into four quadrants as follows: superior nasal (SN), inferior nasal (IN), superior temporal (ST), and inferior temporal (IT). Moreover, the annulus was subdivided into six thin annuli with a bandwidth of 0.37 mm (Figure 4). ImageJ software (v1.48; National Institutes of Health, Bethesda, MD) was used to outline the FAZ of the superficial microvascular plexus and draw a contour of the area. The fractal analysis toolbox (TruSoft BENOIT Pro 2.0; TruSoft International Inc., St. Peterburg, FL) was used to perform fractal analysis in each partition with the box-counting method. The fractal dimension (Dbox) was used to represent the vascular density in each zone.
Figure 2.
Magnification correction of OCTA images of patients with high myopia. A: The original image was magnified according to the axial length to create the magnified image (B), which was further cropped to 1024 × 1024 pixels (C).
Figure 3.
The image processing procedure for large and small vessels. The raw optical coherence tomography angiography (OCTA) image of the superficial vascular plexus (SVP) (A) with a field of view 6 × 6 mm2 was processed to extract the large vasculature with a diameter of about >25 µm (B), and the small vessels (C) were skeletonized for fractal analysis. For the deep vascular plexus (DVP) (D), the large vessels (E) were removed, and the remaining small vessels were skeletonized (F) for analysis.
Figure 4.
Fractal analysis of OCTA images. A: The raw OCTA image used for analysis. B: Annular zone (0.6–5.0 mm) for fractal analysis of vascular density in 6 x 6 mm2 OCTA images. C: Image processing after four quadrant zones were generated after removing the FAZ (diameter = 0.6 mm). ST, superior temporal; SN, superior nasal; IT, inferior temporal; IN, inferior nasal. D:The annular zone was divided into six annuli (C1–C6, centered on the fovea), with a bandwidth of 0.37 mm after removing the FAZ. Scale bar: 1 mm.
Data analysis
The data analysis was performed with SPSS Statistics 22 (SPSS Inc., Chicago, IL). Data characteristics were recorded as the mean ± standard deviation (SD). The Shapiro-Wilk test was used to assess the normal distribution of the data. Repeated-measures ANOVA (Re-ANOVA) tests with post hoc Bonferroni corrections were performed to compare the data from the preoperative and postoperative visits. The Pearson coefficient was calculated to determine the relationships between the magnitude of the change in the vascular density and risk factors. A p value of less than 0.05 was considered statistically significant.
Results
Demographic details of patients
A total of 32 eyes of 32 patients (15 men, 17 women) were included in this study. The patients’ age was 26.91±7.610 years. The preoperative SE was −10.58±3.310 D, ranging from −5.000 D to −16.75 D. The preoperative clinical information is listed in Table 1. All ICL implantations were successful, and no adverse events or complications occurred during the surgery or postoperative follow-up visits.
Table 1. Demographic and clinical information of patients recruited in our study.
| Sample size | 32 eyes of 32 subjects |
|---|---|
| Sex |
Male 15 Female 17 |
| Age(years) |
26.91±7.61 (ranging from 18 to 45) |
| Spherical equivalent (D) |
−10.58±3.31(ranging from −5.0D to −16.75D) |
| Axial length (mm) |
27.59±1.12 |
| Intraocular pressure (mmHg) |
15.37±2.08 |
| Amplitude of accommodation (D) | 9.58±2.48 |
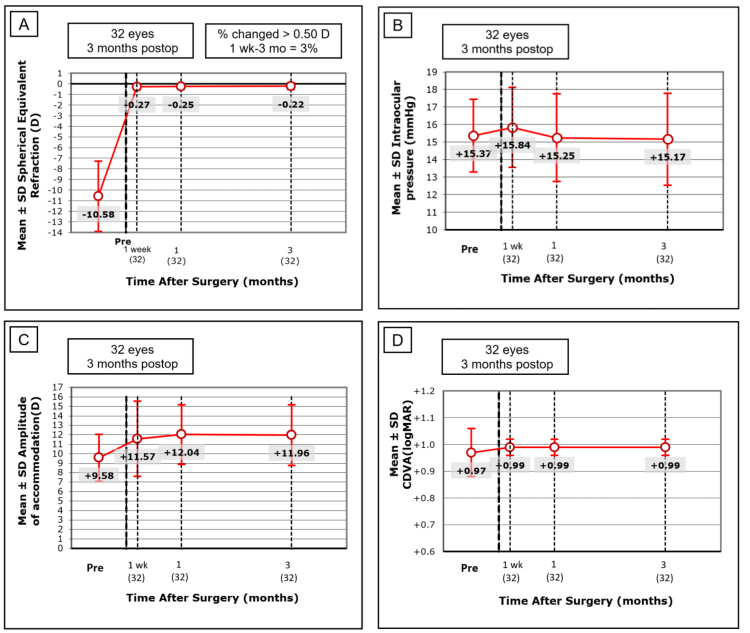
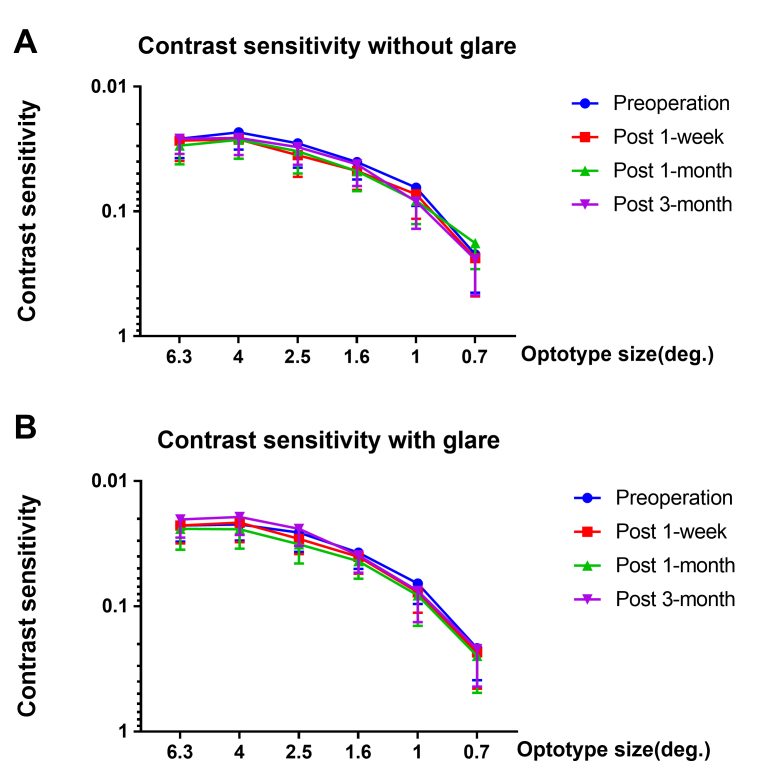
The refraction of all patients was corrected and statistically significantly improved after surgery, with a mean standard error of the mean (SEM) of −0.26±0.29 D after 1 month (p<0.05), and the refraction remained stable 3 months after surgery. An improving trend of CDVA (logMAR) was observed, but it did not reach statistical significance over the course of the preoperative visit and three follow-up visits (Re-ANOVA, p=0.1033). The pre- and postoperative IOPs were also not statistically significantly different during the observation period, and all IOPs were within a normal range (Re-ANOVA, p=0.3211). Moreover, a statistically significant postoperative increase in the amplitude of accommodation was found (Re-ANOVA, p<0.001; Figure 5). The pre- and postoperative CT data of six different degrees of visual angle are shown in Figure 6. No statistically significant difference was found during the course of the preoperative visit and three follow-up visits in CT with or without glare (p>0.05).
Figure 5.
Preoperative and postoperative clinical information of 32 patients. A: Refraction (Spherical Equivalent) was significantly improved after 1 month (p<0.05), and remained stable 3 months after surgery. B: No statistical significance was found in intraocular pressure (IOP) pre- and postoperatively (Re-ANOVA, p=0.3211). C: A statistically significant postoperative increase in the amplitude of accommodation (AA) was found (Re-ANOVA, p<0.001). D: An improving trend of corrected logMAR distance visual acuity (CDVA) was found postoperatively, but it did not reach statistical significance ((Re-ANOVA, p=0.1033). The figure data was expressed as mean±SD.
Figure 6.
Preoperative and postoperative contrast sensitivity (CT) of 32 patients. A: No statistically significant difference was found in contrast sensitivity without glare at six different visual angles (p>0.05). B: No statistically significant difference was found in contrast sensitivity with glare at six different visual angles (p>0.05). The data was expressed as mean±SD.
Changes in the VDs of the macrovascular and microvascular networks
The microvascular density of the annular zone was found to be statistically significantly changed preoperatively and at the three follow-up visits in the retinal vascular network (RVN) and the SVP (Re-ANOVA, p=0.017* for the RVN, p=0.03* for SVP, respectively). However, the macrovascular density did not change statistically significantly (p>0.05 for the RVN, SVP, and DVP) (Table 2, Figure 7). Compared with the preoperative VD, the microvascular density was first decreased after 1 week in the SVP (p=0.046*). A statistically significant decrease in microvascular density was then observed after 1 month in the RVN (p=0.001) and the SVP (p=0.002). The decreased percentage of microvascular density (Dbox) was 0.701% and 0.698% in the RVN and the SVP, respectively. The average density also declined postoperatively in the DVP, but the change did not reach statistical significance in this study (Re-ANOVA, p=0.065). The microvascular density had recovered toward the baseline with no statistically significant difference 3 months postoperatively (p>0.05).
Table 2. Macrovascular density and microvascular density (Dbox) at baseline and 1 week, 1 month, and 3 months postoperatively (* denotes statistical significance).
| Time point | Retina | Superficial | Deep | Retina | Superficial | Deep |
|---|---|---|---|---|---|---|
| Preoperation |
1.012±0.035 |
1.021±0.034 |
0.798±0.098 |
1.798±0.026 |
1.799±0.023 |
1.793±0.040 |
| Post-1 week |
1.010±0.032 |
1.018±0.034 |
0.809±0.087 |
1.793±0.026 |
1.794±0.024 |
1.790±0.043 |
| Post-1 month |
1.012±0.038 |
1.020±0.040 |
0.801±0.131 |
1.786±0.03 |
1.787±0.029 |
1.783±0.046 |
| Post-3 month |
1.004±0.036 |
1.008±0.055 |
0.803±0.119 |
1.79±0.023 |
1.795±0.021 |
1.792±0.038 |
| Re-ANOVA |
p=0.767 |
p=0.545 |
p=0.981 |
p=0.018* |
p=0.03* |
p=0.065 |
| Pre/1-week |
p=0.999 |
p=0.978 |
p=0.957 |
p=0.057 |
p=0.046* |
p=0.423 |
| Pre/1-month |
p>0.999 |
p=0.999 |
p=0.999 |
p=0.0011* |
p=0.001* |
p=0.017 |
| Pre/3-month | p=0.972 | p=0.421 | p=0.996 | p=0.085 | p=0.292 | p=0.932 |
Figure 7.
Retinal vascular densities (Dbox) of three layers pre- and post-ICL surgery. A: The microvascular density in the total annular zone (0.6–5.0 mm) 1 month postoperatively was statistically significantly lower than that preoperatively for the total retina and the superficial layer in all 32 patients. B: No statistically significant difference in macrovascular density was found preoperatively or at 1 week, 1 month, and 3 months postoperatively in any of the 32 patients who underwent implantable collamer lens (ICL) surgery (all p>0.05). *p<0.05, **p<0.01.
Partitioning analysis of the microvascular network
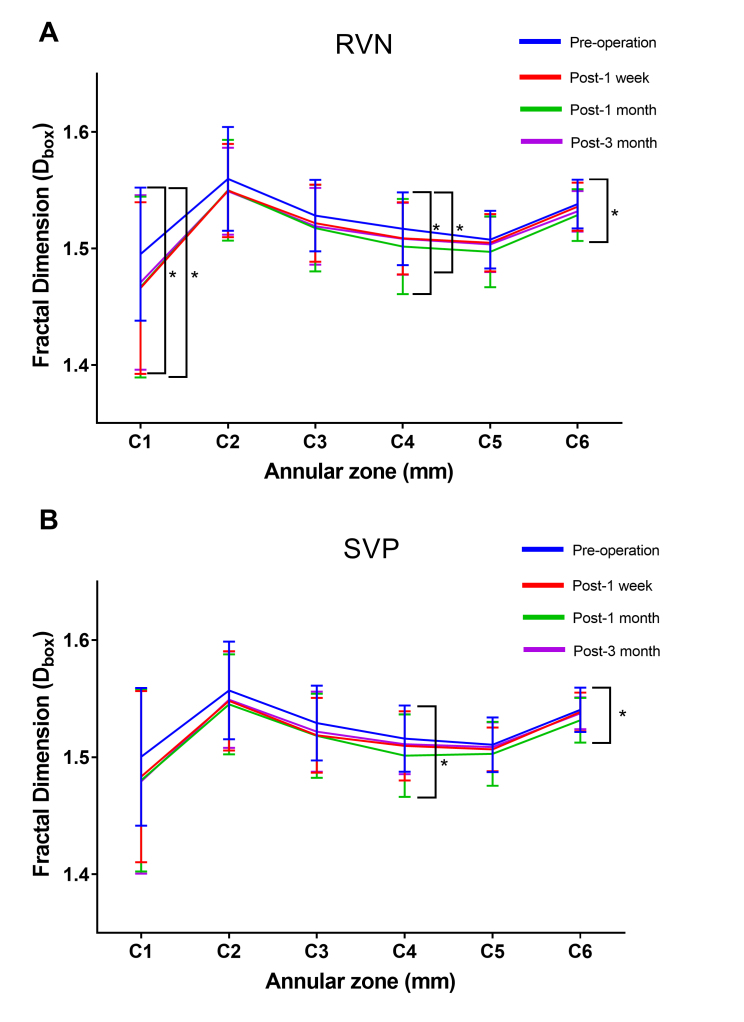
We then further investigated the microvascular density in six thin annuli from the center to the periphery (C1–C6; Figure 8). C1, C4, and C6 were found to be statistically significantly lower postoperatively in the RVN (C1: p=0.037*, C4: p=0.026*, C6: p=0.024*)(Table 3). Moreover, the density of C1, C4, and C6 statistically significantly decreased 1 month postoperatively and then recovered to the preoperative level (p>0.05). Similar changes were observed in the SVP, with C4 and C6 statistically significantly decreasing after 1 month and recovering to preoperative levels 3 months postoperatively (Table 4).
Figure 8.
Comparison of the microvascular density (Dbox) in the six annular zones of the RVN and the SVP of all 32 patients. A: C1, C4, and C6 were found to be statistically significantly lower postoperatively in the RVN (C1: p=0.037*, C4: p=0.026*, C6: p=0.024*) and recovered to preoperative level 3 months postoperatively. B: C4 and C6 significantly decreased after 1 month (C4: p=0.031*, C6: p=0.021*) and recovered to preoperative level 3 months postoperatively. The data was expressed as mean±SD . * denotes p<0.05, ** denotes p<0.01.
Table 3. Microvascular density (Dbox) at baseline, 1 week, 1 month, and 3 months postoperatively in 6 annular zones of RVN.
| Superficial | C1 | C2 | C3 | C4 | C5 | C6 |
|---|---|---|---|---|---|---|
| Preoperation |
1.500±0.059 |
1.557±0.042 |
1.529±0.032 |
1.516±0.028 |
1.511±0.023 |
1.540±0.019 |
| Post-1 week |
1.483±0.073 |
1.548±0.042 |
1.519±0.032 |
1.510±0.03 |
1.507±0.019 |
1.539±0.017 |
| Post-1 month |
1.480±0.078 |
1.545±0.043 |
1.518±0.036 |
1.501±0.035 |
1.503±0.027 |
1.532±0.019 |
| Post-3 month |
1.479±0.079 |
1.549±0.041 |
1.522±0.034 |
1.511±0.026 |
1.509±0.021 |
1.538±0.014 |
| Re-ANOVA |
p=0.247 |
p=0.978 |
p=0.202 |
p=0.017* |
p=0.173 |
p=0.025* |
| Pre/1-week |
p=0.087 |
p=0.177 |
p=0.016 |
p=0.112 |
p=0.202 |
p=0.431 |
| Pre/1-month |
p=0.054 |
p=0.033 |
p=0.026 |
p=0.001* |
p=0.020 |
p=0.009* |
| Pre/3-month | p=0.138 | p=0.381 | p=0.287 | p=0.259 | p=0.624 | p=0.405 |
Table 4. Microvascular density (Dbox) at baseline and 1 week, 1 month, and 3 months postoperatively in 6 annular zones of SVP.
| Retina | C1 | C2 | C3 | C4 | C5 | C6 |
|---|---|---|---|---|---|---|
| Preoperation |
1.495±0.057 |
1.560±0.045 |
1.528±0.031 |
1.517±0.031 |
1.508±0.025 |
1.538±0.021 |
| Post-1 week |
1.466±0.074 |
1.550±0.04 |
1.522±0.033 |
1.509±0.031 |
1.505±0.025 |
1.536±0.021 |
| Post-1 month |
1.467±0.078 |
1.550±0.043 |
1.517±0.037 |
1.502±0.041 |
1.497±0.03 |
1.529±0.022 |
| Post-3 month |
1.471±0.075 |
1.549±0.037 |
1.519±0.033 |
1.508±0.031 |
1.503±0.024 |
1.532±0.017 |
| Re-ANOVA |
p=0.039* |
p=0.393 |
p=0.174 |
p=0.031* |
p=0.079 |
p=0.021* |
| Pre/1-week |
p=0.001* |
p=0.179 |
p=0.100 |
p=0.031* |
p=0.398 |
p=0.365 |
| Pre/1-month |
p=0.012* |
p=0.136 |
p=0.029 |
p=0.002* |
p=0.017* |
p=0.037* |
| Pre/3-month | p=0.075 | p=0.209 | p=0.130 | p=0.110 | p=0.335 | p=0.265 |
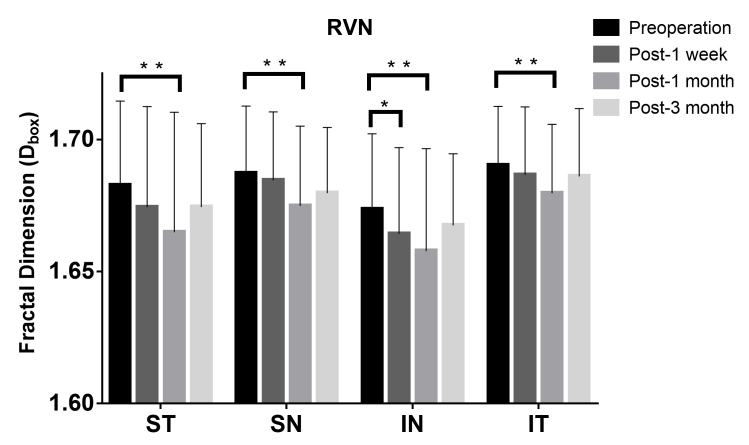
Quadrantal partitioning was also performed to demonstrate different distributions in the four quadrants of the OCTA images (Figure 9, Table 5). A reduction in VD was first observed in the inferior nasal sector 1 week postoperatively. Then, all four quadrants showed a statistically significant decrease in microvascular density 1 month after surgery, which recovered toward the baseline with no statistically significant difference 3 months postoperatively.
Figure 9.
Comparison of the microvascular density (Dbox) in the quadrantal partition of the RVN of all 32 patients. The Dbox was significantly decreased in the inferior nasal sector 1 week postoperatively (p=0.014*), and further decreased in all four quadrants 1 month postoperatively (p<0.05*). The data was expressed as mean±SD. * denotes p<0.05, ** denotes p<0.01.
Table 5. Microvascular density (Dbox) pre- and 1-week, 1-month, and 3 months postoperatively of RVN in quadrants.
| Retina | SN | ST | IT | IN |
|---|---|---|---|---|
| Preoperation |
1.683±0.032 |
1.687±0.025 |
1.674±0.028 |
1.691±0.022 |
| Post-1 week |
1.675±0.037 |
1.685±0.026 |
1.665±0.031 |
1.687±0.026 |
| Post-1 month |
1.665±0.044 |
1.675±0.03 |
1.658±0.038 |
1.68±0.026 |
| Post-3 month |
1.675±0.031 |
1.68±0.025 |
1.668±0.026 |
1.686±0.025 |
| Re-ANOVA |
p=0.042* |
p=0.037* |
p=0.034* |
p=0.018* |
| Pre/1-week |
p=0.084 |
p=0.480 |
p=0.026* |
p=0.319 |
| Pre/1-month |
p=0.007* |
p=0.014* |
p=0.003* |
p=0.001* |
| Pre/3-month | p=0.198 | p=0.128 | p=0.22 | p=0.052 |
Correlations of VD with clinical parameters
No statistically significant correlation was found between the variation in the microvascular density of the RVN or the SVP and the refractive errors or the axial length. No statistically significant correlation between VD and IOP, AA, or CT was found (Table 6). Taken together, the evidence presented here indicates that ICL implantation surgery does not have a long-lasting impact or an adverse effect on the retinal microvasculature.
Table 6. The correlation of retinal microvascular density variation (△Dbox) against possible influencing factors from baseline to 1 month postoperatively in RVN and SVP.
| Factors | ΔRVN(△Dbox) |
ΔSVP(△Dbox) |
||
|---|---|---|---|---|
| R2 | P value | R2 | P value | |
| Age (y) |
−0.186 |
0.309 |
−0.265 |
0.16 |
| SEM (D) |
−0.016 |
0.929 |
0.235 |
0.196 |
| AL (mm) |
−0.221 |
0.224 |
0.004 |
0.983 |
| ΔBCVA (logMAR) |
−0.191 |
0.294 |
0.16 |
0.383 |
| ΔIOP (mmHg) |
−0.178 |
0.33 |
−0.245 |
0.177 |
| ΔAA (D) |
−0.186 |
0.309 |
0.08 |
0.664 |
| ΔCT(deg) |
|
|
|
|
| 6.3 |
0.205 |
0.295 |
−0.096 |
0.627 |
| 4 |
0.182 |
0.353 |
−0.186 |
0.343 |
| 2.5 |
0.089 |
0.651 |
−0.17 |
0.386 |
| 1.6 |
0.311 |
0.108 |
−0.052 |
0.793 |
| 1 |
0.122 |
0.536 |
−0.065 |
0.741 |
| 0.7 | −0.158 | 0.421 | −0.168 | 0.392 |
Discussion
In this study, we demonstrated that retinal microvascular network densities transiently decreased following ICL surgery. Changes in the retinal microvasculature might be related to visual function, and patients with eyes with high myopia are typically at higher risk for retinal vascular dysfunctions, which might further affect visual acuity (VA) [22]. Recent studies have found that the retinal vasculature might change in patients with diabetes, glaucoma, and high myopia [23-26]. Clinical evidence also suggests that surgery might cause changes in the retinal vasculature [27] [28,29]. Therefore, it is crucial to evaluate changes in the retina following ICL surgery in a population with high myopia. To the best of our knowledge, this was the first study to perform a quantitative assessment of retinal vascular density with partitioning analysis using OCTA in patients who underwent ICL implantation.
We found that the microvascular density was decreased following ICL surgery, with 0.701% and 0.698% reductions in the RVN and the SVP, respectively, 1 month postoperatively. Comparatively, the macrovascular density was not affected by the surgery, indicating that the changes were limited to the microvascular network, which has not been previously reported. Moreover, the superficial retina showed a reduction in vascular density, while the deep retina showed suggestive changes that did not reach statistical significance. The underlying reason for the changes observed in the retinal microvasculature remains unclear. Several factors might have contributed to these changes. First, previous studies have demonstrated that the microvascular density of highly myopic eyes is significantly lower than that of healthy eyes [17,18]. ICL surgery is considered a minimally invasive surgery, but a fluctuation of intraocular pressure might still occur, which would further destabilize the intraocular microenvironment [30,31,32]. It was reported that the IOP decreased 3 h following ICL surgery and gradually recovered to the preoperative level 24 h postoperatively [33]. In the present study, the postoperative IOP levels were all within the normal range and showed no statistically significant difference postoperatively. The pulsatile ocular blood flow also increased after cataract surgery [34], which might also induce changes in macular thickness as well as vascular density [35]. Second, Chen et al. found that the diameter of retinal vessels and the oxygen saturation of retinal venules underwent a transient decrease and returned to preoperative levels after ICL implantation [36], which followed the pattern of the change in microvascular density in the present study. Therefore, it was speculated that the changes in the microvasculature occurred without other changes in vascular diameter as a result of a higher rate of oxygen metabolism in the human retina following ICL surgery. Third, the superficial capillary plexuses were found to be more readily affected by surgery. Lorenzo et al. reported that in eyes with idiopathic vitreomacular traction, the perfusion density in the superficial capillary plexus was reduced 1 month after injection compared to that of the deep capillary plexus and choriocapillaris [37]. It was also reported that the reduction in the microvascular density of the superficial peripapillary retina was associated with axial elongation in patients with myopia, whereas the deep retina showed no association [38,39]. However, the underlying causes of the progressive decline in microvascular density in the SVP until 1 month postoperatively might be multifactorial, which warrants additional investigation. Compared with the deep retina, the superficial retina might be more vulnerable and sensitive to external stimulation, particularly in patients with high myopia. Thus, we suggest that VD changes in the SVP should be emphasized clinically in ICL follow-up visits, especially for patients with high myopia.
An uneven decrease in VD was observed through the further analysis of the annular and quadrantal compartments. The outer ring (C4 and C6) of the RVN and the SVP showed a lower microvascular density than the inner ring in the annular analysis. The retinal vascular system in different parts of the fundus presents various responses to external stimulation [40]. Excessive axial elongation results in mechanical stretching and thinning of the retina. Myopic retinas have thinner perifoveal fields than nonmyopic retinas [41]. Moreover, the average retinal thickness of the outer ring is less than that of the inner ring in highly myopic eyes [42]. Thus, the variation in retinal thickness in highly myopic eyes results in different topographic patterns at the macula [43]; in particular, the outer ring of the retina is more likely to be affected. Another reason might be autoregulation of the retinal blood supply. Autoregulation of the retinal blood supply maintains a relatively constant blood flow if the perfusion pressure changes [44]. Autoregulation of retinal vessels also varies within different regions of the fundus. Zong et al. found that the parafoveal region had a greater response to the Valsalva maneuver than the peripapillary region [45]. Because ICL surgery might disturb the retinal microcirculation and blood perfusion [36], we speculated that the retina has a lower capability to regulate blood perfusion in the outer ring, resulting in a significant decrease in VD in the outer retinal zone. The inferior nasal sector was found to decline first, 1 week postoperatively, in the quadrantal analysis in the present study. It was reported that VD changes in the inferior nasal sector were largest in patients with high myopia, which might be related to the loss of the nerve fiber layer [17]. Thus, the inferior nasal sector might be more sensitive and show an earlier response than the other three quadrants.
However, in the present study, the microvascular density variation was not correlated with age, SE, AL, changes in IOP, AA, or contrast sensitivity. The postoperative fluctuation of the retinal microvascular density did not affect the patients’ visual function. All recruited patients in this study presented a trend of improving CDVA and remained stable 3 months postoperatively. The contrast sensitivity did not show a statistically significant change, suggesting that the VD reduction found in this study was transient, and ICL surgery is considered a safe surgical technique for refractive correction.
This study has several limitations. First, the participants enrolled were mostly young, and the response to surgical stimulation might differ in older patients. Thus, we could not evaluate the effect of age on the retinal vascular network. Second, most patients preferred postoperative follow-up visits within 3 months. Moreover, patients recruited showed improved and stable refraction after surgery, and the changes in the retinal microvasculature soon recovered back to the baseline level. Nevertheless, these limitations do not affect the conclusions of this study.
In conclusion, we found that the microvascular density was transiently decreased in macular areas 1 month after ICL surgery and then recovered toward the baseline without adverse effects on visual function. Moreover, the pre- and postoperative application of OCTA can help ophthalmologists to better understand microvascular responses to ICL surgery and prevent fundus complications following ICL surgery in patients with high myopia.
Acknowledgments
The authors acknowledge Dr. Jianhua Wang for kindly supplying us with customized software for the assessment of vascular density from OCTA images. Funding details: This work was supported by Grant 2020YFC2003904 from National Key Research & Development Program,Grant 81770953 from National Natural Science Foundation, Grant 2018ZHYL0222 from intelligent medical project of Shanghai, Grant 17411950204 from the Science and Technology Commission of Shanghai Municipality, Grant CTCCR-2018B01 from Clinical Research Innovation Plan of Shanghai General Hospital, Grant 82070992 from National Natural Science Foundation,Grant YG2021ZD18 from Shanghai Jiaotong University Medical Engineering Cross Research.
References
- 1.Holden BA, Fricke TR, Wilson DA, Jong M, Naidoo KS, Sankaridurg P, Wong TY, Naduvilath TJ, Resnikoff S. Global Prevalence of Myopia and High Myopia and Temporal Trends from 2000 through 2050. Ophthalmology. 2016;123:1036–42. doi: 10.1016/j.ophtha.2016.01.006. [DOI] [PubMed] [Google Scholar]
- 2.Flitcroft DI, He M, Jonas JB, Jong M, Naidoo K, Ohno-Matsui K, Rahi J, Resnikoff S, Vitale S, Yannuzzi L. IMI – Defining and Classifying Myopia: A Proposed Set of Standards for Clinical and Epidemiologic StudiesIMI – Defining and Classifying Myopia. Invest Ophthalmol Vis Sci. 2019;60:M20–30. doi: 10.1167/iovs.18-25957. [DOI] [PMC free article] [PubMed] [Google Scholar]
- 3.Chang L, Pan CW, Ohno-Matsui K, Lin X, Cheung GC, Gazzard G, Koh V, Hamzah H, Tai ES, Lim SC, Mitchell P, Young TL, Aung T, Wong TY, Saw SM. Myopia-related fundus changes in Singapore adults with high myopia. Am J Ophthalmol. 2013;155:991–9.e1. doi: 10.1016/j.ajo.2013.01.016. [DOI] [PubMed] [Google Scholar]
- 4.Ohno-Matsui K, Lai TY, Lai CC, Cheung CM. Updates of pathologic myopia. Prog Retin Eye Res. 2016;52:156–87. doi: 10.1016/j.preteyeres.2015.12.001. [DOI] [PubMed] [Google Scholar]
- 5.Pineda-Fernandez A, Jaramillo J, Vargas J, Jaramillo M, Jaramillo J, Galindez A. Phakic posterior chamber intraocular lens for high myopia. J Cataract Refract Surg. 2004;30:2277–83. doi: 10.1016/j.jcrs.2004.03.035. [DOI] [PubMed] [Google Scholar]
- 6.Sanders DR, Doney K, Poco M, Vukich JA, Barnett R, Dulaney D, Perkins S, Rowen SL, Steel D, Berkeley R, Caplan M, Mann P, Bylsma S, Martin RG, Brown DC, Grabow H, Williamson CH, Shepherd JR, Fine IH, Kraff M, Fabricant R, Berg A, Lamielle H, Smith D, Edelhauser H, Grp ICLTMS. United States Food and Drug Administration clinical trial of the Implantable Collamer Lens (ICL) for moderate to high myopia - Three-year follow-up. Ophthalmology. 2004;111:1683–92. doi: 10.1016/j.ophtha.2004.03.026. [DOI] [PubMed] [Google Scholar]
- 7.Kamiya K, Shimizu K, Igarashi A, Hikita F, Komatsu M. Four-Year Follow-up of Posterior Chamber Phakic Intraocular Lens Implantation for Moderate to High Myopia. Arch Ophthalmol. 2009;127:845–50. doi: 10.1001/archophthalmol.2009.67. [DOI] [PubMed] [Google Scholar]
- 8.Lee J, Kim Y, Park S, Bae J, Lee S, Park Y, Lee J, Lee JE. Long-term clinical results of posterior chamber phakic intraocular lens implantation to correct myopia. Clin Experiment Ophthalmol. 2016;44:481–7. doi: 10.1111/ceo.12691. [DOI] [PubMed] [Google Scholar]
- 9.Sanders DR. Postoperative inflammation after implantation of the implantable contact lens. Ophthalmology. 2003;110:2335–41. doi: 10.1016/s0161-6420(03)00826-1. [DOI] [PubMed] [Google Scholar]
- 10.Sanders DR, Vukich JA. Incidence of lens opacities and clinically significant cataracts with the implantable contact lens: comparison of two lens designs. J Refract Surg. 2002;18:673–82. doi: 10.3928/1081-597X-20021101-03. [DOI] [PubMed] [Google Scholar]
- 11.Sachdev G, Ramamurthy D. Long-term safety of posterior chamber implantable phakic contact lens for the correction of myopia. Clin Ophthalmol. 2019;13:137–42. doi: 10.2147/OPTH.S185304. [DOI] [PMC free article] [PubMed] [Google Scholar]
- 12.Edelhauser HF, Sanders DR, Azar R, Lamielle H. Corneal endothelial assessment after ICL implantation. J Cataract Refract Surg. 2004;30:576–83. doi: 10.1016/j.jcrs.2003.09.047. [DOI] [PubMed] [Google Scholar]
- 13.Mohindra VK, Pereira S. An interesting case of implantable contact lens. Med J Armed Forces India. 2015;71(Suppl 1):S69–72. doi: 10.1016/j.mjafi.2013.02.018. [DOI] [PMC free article] [PubMed] [Google Scholar]
- 14.Ye C, Patel CK, Momont AC, Liu Y. Advanced pigment dispersion glaucoma secondary to phakic intraocular collamer lens implant. Am J Ophthalmol Case Rep. 2018;10:65–7. doi: 10.1016/j.ajoc.2018.01.046. [DOI] [PMC free article] [PubMed] [Google Scholar]
- 15.de Carlo TE, Rosenblatt A, Goldstein M, Baumal CR, Loewenstein A, Duker JS. Vascularization of Irregular Retinal Pigment Epithelial Detachments in Chronic Central Serous Chorioretinopathy Evaluated With OCT Angiography. Ophthalmic Surg Lasers Imaging Retina. 2016;47:128–33. doi: 10.3928/23258160-20160126-05. [DOI] [PubMed] [Google Scholar]
- 16.Querques L, Giuffre C, Corvi F, Zucchiatti I, Carnevali A, De Vitis LA, Querques G, Bandello F. Optical coherence tomography angiography of myopic choroidal neovascularisation. Br J Ophthalmol. 2017;101:609–15. doi: 10.1136/bjophthalmol-2016-309162. [DOI] [PubMed] [Google Scholar]
- 17.Li M, Yang Y, Jiang H, Gregori G, Roisman L, Zheng F, Ke B, Qu D, Wang J. Retinal Microvascular Network and Microcirculation Assessments in High Myopia. Am J Ophthalmol. 2017;174:56–67. doi: 10.1016/j.ajo.2016.10.018. [DOI] [PMC free article] [PubMed] [Google Scholar]
- 18.Yang Y, Wang J, Jiang H, Yang X, Feng L, Hu L, Wang L, Lu F, Shen M. Retinal Microvasculature Alteration in High Myopia. Invest Ophthalmol Vis Sci. 2016;57:6020–30. doi: 10.1167/iovs.16-19542. [DOI] [PubMed] [Google Scholar]
- 19.Wei Y, Jiang H, Shi Y, Qu D, Gregori G, Zheng F, Rundek T, Wang J. Age-Related Alterations in the Retinal Microvasculature, Microcirculation, and Microstructure. Invest Ophthalmol Vis Sci. 2017;58:3804–17. doi: 10.1167/iovs.17-21460. [DOI] [PMC free article] [PubMed] [Google Scholar]
- 20.Higashide T, Ohkubo S, Hangai M, Ito Y, Shimada N, Ohno-Matsui K, Terasaki H, Sugiyama K, Chew P, Li KK, Yoshimura N. Influence of Clinical Factors and Magnification Correction on Normal Thickness Profiles of Macular Retinal Layers Using Optical Coherence Tomography. PLoS One. 2016;11:e0147782. doi: 10.1371/journal.pone.0147782. [DOI] [PMC free article] [PubMed] [Google Scholar]
- 21.Sampson DM, Gong P, An D, Menghini M, Hansen A, Mackey DA, Sampson DD, Chen FK. Axial Length Variation Impacts on Superficial Retinal Vessel Density and Foveal Avascular Zone Area Measurements Using Optical Coherence Tomography Angiography. Invest Ophthalmol Vis Sci. 2017;58:3065–72. doi: 10.1167/iovs.17-21551. [DOI] [PubMed] [Google Scholar]
- 22.Li Z, Zhang J, Lin T, Peng W, Lu L, Hu J. Macular vascular circulation and retinal oxygen saturation changes for idiopathic macular epiretinal membrane after vitrectomy. Acta ophthalmologica. 2019;97:296–302. doi: 10.1111/aos.14066. [DOI] [PubMed] [Google Scholar]
- 23.Venkatesh R, Sinha S, Gangadharaiah D, Gadde SGK, Mohan A, Shetty R, Yadav NK. Retinal structural-vascular-functional relationship using optical coherence tomography and optical coherence tomography - angiography in myopia. Eye and vision (London, England) 2019; 6:8. [DOI] [PMC free article] [PubMed] [Google Scholar]
- 24.Sung MS, Lee TH, Heo H, Park SW. Association Between Optic Nerve Head Deformation and Retinal Microvasculature in High Myopia. Am J Ophthalmol. 2018;188:81–90. doi: 10.1016/j.ajo.2018.01.033. [DOI] [PubMed] [Google Scholar]
- 25.He J, Chen Q, Yin Y, Zhou H, Fan Y, Zhu J, Zou H, Xu X. Association between retinal microvasculature and optic disc alterations in high myopia. Eye (Lond) 2019;33:1494–1503. doi: 10.1038/s41433-019-0438-7. [DOI] [PMC free article] [PubMed] [Google Scholar]
- 26.Triolo G, Rabiolo A, Shemonski ND, Fard A, Di Matteo F, Sacconi R, Bettin P, Magazzeni S, Querques G, Vazquez LE, Barboni P, Bandello F. Optical Coherence Tomography Angiography Macular and Peripapillary Vessel Perfusion Density in Healthy Subjects, Glaucoma Suspects, and Glaucoma Patients. Invest Ophthalmol Vis Sci. 2017;58:5713–22. doi: 10.1167/iovs.17-22865. [DOI] [PubMed] [Google Scholar]
- 27.Wang H, Xu X, Sun X, Ma Y, Sun T. Macular perfusion changes assessed with optical coherence tomography angiography after vitrectomy for rhegmatogenous retinal detachment. Graefe’s archive for clinical and experimental ophthalmology = Albrecht Von Graefes Arch Klin Exp Ophthalmol. 2019;257:733–40. doi: 10.1007/s00417-019-04273-7. [DOI] [PubMed] [Google Scholar]
- 28.Karabulut M, Karabulut S, Sül S, Karalezli A. Optic nerve head microvascular changes after phacoemulsification surgery. Graefes Arch Clin Exp Ophthalmol. 2019; 257:2729–33.. doi: 10.1007/s00417-019-04473-1. [DOI] [PubMed] [Google Scholar]
- 29.Chen H, Chi W, Cai X, Deng Y, Jiang X, Wei Y, Zhang S. Macular microvasculature features before and after vitrectomy in idiopathic macular epiretinal membrane: an OCT angiography analysis. Eye (Lond) 2019;33:619–28. doi: 10.1038/s41433-018-0272-3. [DOI] [PMC free article] [PubMed] [Google Scholar]
- 30.Senthil S, Choudhari NS, Vaddavalli PK, Murthy S, Reddy JC, Garudadri CS. Etiology and Management of Raised Intraocular Pressure following Posterior Chamber Phakic Intraocular Lens Implantation in Myopic Eyes. PLoS One. 2016;11:e0165469. doi: 10.1371/journal.pone.0165469. [DOI] [PMC free article] [PubMed] [Google Scholar]
- 31.Ganesh S, Brar S. Comparison of surgical time and IOP spikes with two ophthalmic viscosurgical devices following Visian STAAR (ICL, V4c model) insertion in the immediate postoperative period. Clin Ophthalmol. 2016;10:207–11. doi: 10.2147/OPTH.S89487. [DOI] [PMC free article] [PubMed] [Google Scholar]
- 32.Almalki S, Abubaker A, Alsabaani NA, Edward DP. Causes of elevated intraocular pressure following implantation of phakic intraocular lenses for myopia. Int Ophthalmol. 2016;36:259–65. doi: 10.1007/s10792-015-0112-4. [DOI] [PubMed] [Google Scholar]
- 33.Chen D, Cui G, Wang X, Li Y, Luo Y. Safety of the Minimum Ophthalmic Viscosurgical Device Technique in Phakic Implantable Collamer Lens Implantation. J Refract Surg. 2020;36:42–8. doi: 10.3928/1081597X-20191119-02. [DOI] [PubMed] [Google Scholar]
- 34.Hilton EJ, Hosking SL, Gherghel D, Embleton S, Cunliffe IA. Beneficial effects of small-incision cataract surgery in patients demonstrating reduced ocular blood flow characteristics. Eye (Lond) 2005;19:670–5. doi: 10.1038/sj.eye.6701620. [DOI] [PubMed] [Google Scholar]
- 35.Zhao Z, Wen W, Jiang C, Lu Y. Changes in macular vasculature after uncomplicated phacoemulsification surgery: Optical coherence tomography angiography study. J Cataract Refract Surg. 2018;44:453–8. doi: 10.1016/j.jcrs.2018.02.014. [DOI] [PubMed] [Google Scholar]
- 36.Chen P, Cai X, Xu L, Zhang J, Yang Y, Gao Q, Ge J, Yu K, Zhuang J. Assessing oxygen saturation in retinal vessels in high myopia patients pre- and post-implantable collamer lens implantation surgery. Acta ophthalmologica. 2017;95:576–82. doi: 10.1111/aos.13368. [DOI] [PubMed] [Google Scholar]
- 37.Iuliano L, Fogliato G, Colombo R, Sacconi R, Querques G, Bandello F, Codenotti M. Reduced perfusion density of superficial retinal capillary plexus after intravitreal ocriplasmin injection for idiopathic vitreomacular traction. BMC Ophthalmol. 2019;19:108. doi: 10.1186/s12886-019-1119-9. [DOI] [PMC free article] [PubMed] [Google Scholar]
- 38.Sung MS, Lee TH, Heo H, Park SW. Clinical features of superficial and deep peripapillary microvascular density in healthy myopic eyes. PLoS One. 2017;12:e0187160. doi: 10.1371/journal.pone.0187160. [DOI] [PMC free article] [PubMed] [Google Scholar]
- 39.Leng Y, Tam EK, Falavarjani KG, Tsui I. Effect of Age and Myopia on Retinal Microvasculature. Ophthalmic Surg Lasers Imaging Retina. 2018;49:925–31. doi: 10.3928/23258160-20181203-03. [DOI] [PubMed] [Google Scholar]
- 40.Xu H, Deng G, Jiang C, Kong X, Yu J, Sun X. Microcirculatory Responses to Hyperoxia in Macular and Peripapillary Regions. Invest Ophthalmol Vis Sci. 2016;57:4464–8. doi: 10.1167/iovs.16-19603. [DOI] [PubMed] [Google Scholar]
- 41.Jin P, Zou H, Zhu J, Xu X, Jin J, Chang TC, Lu L, Yuan H, Sun S, Yan B, He J, Wang M, He X. Choroidal and Retinal Thickness in Children With Different Refractive Status Measured by Swept-Source Optical Coherence Tomography. Am J Ophthalmol. 2016;168:164–76. doi: 10.1016/j.ajo.2016.05.008. [DOI] [PubMed] [Google Scholar]
- 42.Song AP, Wu XY, Wang JR, Liu W, Sun Y, Yu T. Measurement of retinal thickness in macular region of high myopic eyes using spectral domain OCT. Int J Ophthalmol. 2014;7:122–7. doi: 10.3980/j.issn.2222-3959.2014.01.23. [DOI] [PMC free article] [PubMed] [Google Scholar]
- 43.Tan CS, Cheong KX, Lim LW, Li KZ. Topographic variation of choroidal and retinal thicknesses at the macula in healthy adults. Br J Ophthalmol. 2014;98:339–44. doi: 10.1136/bjophthalmol-2013-304000. [DOI] [PubMed] [Google Scholar]
- 44.Rassam SM, Patel V, Chen HC, Kohner EM. Regional retinal blood flow and vascular autoregulation. Eye (Lond) 1996;10:331–7. doi: 10.1038/eye.1996.69. [DOI] [PubMed] [Google Scholar]
- 45.Zong Y, Xu H, Yu J, Jiang C, Kong X, He Y, Sun X. Retinal Vascular Autoregulation during Phase IV of the Valsalva Maneuver: An Optical Coherence Tomography Angiography Study in Healthy Chinese Adults. Front Physiol. 2017;8:553. doi: 10.3389/fphys.2017.00553. [DOI] [PMC free article] [PubMed] [Google Scholar]


