

Abstract
Three-dimensional (3D) bioprinting has significant potential for addressing the global problem of organ shortages. Extrusion printing is a versatile 3D bioprinting technique, but its low accuracy currently limits the solution. This lack of precision is attributed largely to the complex thermal and dynamic properties of bioinks and makes it difficult to provide accurate estimations of the printed results. It is necessary to understand the relationship between printing temperature and materials’ printability to address this issue. This paper proposes a quantitative thermal model incorporating a system’s printing temperatures (syringe, ambient, and bioink) to facilitate accurate estimations of the printing outcomes. A physical model was established to reveal the relationship between temperature, pressure, and velocity in guiding the printing of sodium alginate–gelatin composite hydrogel (a popular bioink) to optimize its extrusion-based printability. The model considered the phenomenon of bioink die swells after extrusion. A series of extrusion experiments confirmed that the proposed model offers enhanced printing outcome estimations compared with conventional models. Two types of nozzles (32- and 23-gauge) were used to print several sets of lines with a linewidth step of 50 mm by regulating the extrudate’s temperature, pressure, and velocity separately. The study confirmed the potential for establishing a reasonable, accurate open-loop linewidth control based on the proposed optimization method to expand the application of extrusion-based bioprinting further.
Keywords: 3D bioprinting, Pneumatic extrusion, Thermal effects, Temperature control, Printability
1. Introduction
The three-dimensional (3D) bioprinting technique has the potential for creating functional tissues and organs in vitro, which could address the global shortage of human tissue/organ donation in the context of rising transplantation demands[1,2]. Over recent years, 3D bioprinting has become the focus of increasing attention due to its high efficiency, accuracy[3], and ability to fabricate scaffolds that provide 3D microenvironments, thereby avoiding the drawbacks associated with traditional two-dimensional monolayer cell culture[4]. In extrusion-based printing[5-10], syringes and pistons are used to extrude bioinks with viscosities of 30 – 107 mPa·s from nozzles to form complex 3D architectures that offer various benefits in cell culture[11]. The technique allows the low-cost and high-precision fabrication of cell-laden scaffolds with high cell viability[12]. Advancements based on this technology have been demonstrated, including mandible bones[7], liver tissue[13], cardiac patches[14], brain microenvironment[15], and multi-layered skin[16].
The differing properties of bioinks are a primary consideration in 3D bioprinting for fabricating different tissues/organs[17,18]. Extrusion-based bioprinting requires the use of biocompatible materials that must be fluid in the nozzle and solid after printing[19]. Increasingly, temperature-sensitive materials, such as gelatin, gelatin methacryloyl, collagen, and agarose, which are tunable in a sol–gel state through the alternation of temperatures, are becoming the focus of research attention[1,20]. Among these materials, a sodium alginate–gelatin composite hydrogel can be crosslinked just with divalent ions[21]. It is widely used because of its mild gelation, good printability, and high biocompatibility[3,22-28].
Bioink printability is critical to the in vitro reproduction of the complex micro-architectures of native tissues[29,30]. It is regarded as the ability to form complex 3D structures with high accuracy, integrity, and cell viability[27]. The intrinsic properties and printing parameters of bioinks affect their printability. Researchers have created several physical models to enhance this property that considers such variables, including pressure, the inner diameter (ID) of the nozzle, and the nozzle’s moving velocity. However, as all these models ignore temperature, the experimental results in the original research could not be fitted accurately[31-33].
Many studies have found that temperature is a critical variable that affects printability[3,27,34]. When alginate–gelatin composite hydrogel is kept at 37°C, even low pressure and a fast printing velocity cause the width of the printed lines to increase, resulting in variations in width from those lines printed near the sol-gel transition temperature[3]. Ouyang et al. demonstrated that temperature affects the printing region in which the printability of a bioink is excellent[27]. Chen et al. found that the thermal parameters of a bioink obtained from a rheometer differed from those measured experimentally through a printing test. This disparity was attributed to the temperature difference between the two systems[34].
In addition, both the holding time and holding temperature have been proven to affect the viability of cells[25]. Although significant progress has been made in studying the printability of bioinks, a quantitative and comprehensive law is required to guide the printing process. Consequently, the printing capability of the 3D bioprinting technique remains compromised[22,23]. Furthermore, a lack of research regarding the thermal effects makes it challenging to construct large-scale tissue scaffolds using temperature-sensitive materials[7,9,34].
This study presents an optimization of the printability of extrusion-based bioprinting with a consideration of the thermal effects. A quantitative thermal model was established that considered the printing system’s temperatures (nozzle, ambient, and bioink) to demonstrate the extrudate’s thermal effects. The model can be applied for the precise regulation of extrudate temperature. A mathematical model revealing the relationship between the extrudate’s temperature, pressure, velocity, and linewidth was established to optimize the printing process. The experimental results agreed reasonably well with the physical model, which outperformed conventional models. Nozzles with gauges (G) of 32 and 23 were used, and the temperature, pressure, and velocity of the extrudates were varied, respectively. Several sets of lines were fabricated using the established physical model with a linewidth step of 50 mm. The precise linewidth step control demonstrated by the proposed optimization model suggests it could guide soft biomaterials’ fabrication with precise shape control and high cell viability.
2. Materials and methods
2.1. Bioprinting system design
As shown in Figure 1A, a customized bioprinter was produced comprising a temperature control module, a nozzle motion control module, and a bioink dispensing system.
Figure 1.

Schematic showing of the bioprinting system. (A) Diagram of the 3D bioprinter is composed of a temperature control module, a motion control module, and a dispensing module. (B) Schematic of the printing process. The rheological properties of the bioink are input into the mathematical model to realize the controllable deposition.
Two nozzles with precise temperature control were installed on the x–y–z stage. The low-temperature (LT) module was tunable from 0°C to 70°C with individual temperature control for the nozzle tip. The high-temperature (HT) module was tunable from ambient temperature (AT) to 250°C. The temperature tuning range of the printing platform ranged between −5°C and 45°C. Since the AT has a significant impact on the printing process, this parameter was controlled using a temperature-adjustable (between 10°C and 40°C) chamber. The modules were designed to allow the precise temperature control of the bioink’s flow path to produce a bioink with predictable thermal properties, a suitable viscoelastic modulus, and high cell activity[24,25,35]. The output pressure regulated by the pneumatic circuit was tunable from 1 kPa to 1 MPa with a resolution of 1 kPa.
Bioink properties must be controlled precisely to achieve excellent printability. A low-viscosity material will deform and collapse after printing, while a high-viscosity material will become clogged and excessively swollen. This study tested the rheological properties of the prepared bioink (Figure 1B). The obtained thermal parameters were entered into the established physical model. To achieve controllable deposition and to predict the printed linewidth, the model considered the pipe flow, the die swell, and the deposition stages.
2.2. Sodium alginate–gelatin composite hydrogel preparation
The composite hydrogel comprised sodium alginate (Sigma-Aldrich, Shanghai, China), gelatin (from porcine skin, Sigma-Aldrich, Shanghai, China), and phosphate buffer saline (PBS) (GENOM, Hangzhou, China). The sodium alginate powder (2% w/v) and gelatin powder (10% w/v) were combined thoroughly in PBS by stirring at 60°C for 40 min at 400 r/min. The mixture was maintained at a temperature of 37°C to remove any bubbles before being transferred into a 30-cc syringe.
2.3. Rheological measurements
A rheological properties test was conducted using a rotational rheometer with a parallel plate measuring system (MCR302, Anton Paar, Austria). A 1 mm thick specimen was loaded onto the test plate and heated to 40°C before measurement. Then, it was cooled from 40°C to 10°C at increments of −2°C/min. The strain was set at 1% at a frequency of 1 Hz for the dynamic moduli measurements. As the power-law equation’s coefficients remain almost constant in the shear rate range until the material is broken, the shear rate was set to 20 and 35 s−1 in the rotation measurement, respectively[31].
2.4. Composite hydrogel thermal analysis
The composite hydrogel’s specific heat and isotropic thermal conductivities were measured using a thermal conductivity analyzer (TPS 2500S, Hot Disk, Sweden). The stainless steel and the polypropylene manufacturer kindly provided the properties of the materials, and the experimental temperature was measured using a k-type thermocouple (GM1312, Biaozhi, China). As the film coefficient varies according to environmental conditions, this study fitted the coefficient to 50 W/m2°C, which was experimentally derived.
The temperature gradient of the model was simulated using Ansys 15.0 (ANSYS, USA) software, and Table 1 summarizes the critical parameters used in the simulation. Two models were built using the SolidWorks (Dassault System, France) program using identical cylinder lengths of 13 mm and cylindrical nozzle IDs of 0.34 and 0.11 mm. The length of the nozzle exposed to the air was 5 mm, and a meshing size of 1 × 10⁻⁴ mm was used. The thermal effect analysis considered the effect of both heat conduction and convection, and thermal radiation was disregarded due to its negligible influence[36].
The study conducted four sets of simulations, as follows: (a) The transient temperature of the central material during heating/cooling, (b) the influence of syringe temperature, (c) the AT on the steady extrudate temperature, and (d) the transient temperature change of the extrudate during heating/cooling.
The simulation parameters were established as follows:
The temperature of the outer surface of the syringe was set to 19°C (lower than the AT of 20°C) and 31°C (higher than the AT), respectively. The initial temperature of the material was set to 21°C. Then, the central material’s transient temperature change was simulated, and experiments with identical parameters were performed to verify the simulation results.
The outer surface temperature of the syringe was set to 19°C, 21°C, 23°C, 25°C, 27°C, 29°C, and 31°C, respectively. A steady extrudate temperature was simulated. The results were verified, and the film coefficient was fitted by experiments conducted under identical conditions.
The outer surface temperature of the syringe was set to a constant temperature of 27°C, while the AT was set to 20°C, 25°C, 30°C, 35°C, and 40°C, respectively. Then, a steady extrudate temperature was simulated.
The outer surface temperature of the syringe was set to a constant temperature of 27°C, which was identical to the initial temperature of the material. The AT was set to 20°C (lower than the nozzle temperature), 27°C (equal to the nozzle temperature), and 32°C (higher than the nozzle temperature), respectively. Then, the transient temperature change of the extrudate at the tip was simulated.
2.5. Printing parameters
This study’s main focus was the linewidth as a printed outcome, which was measured using fluorescence microscopy (DM IL LED, Leica, Germany) and industrial microscopy (JC-2001G, Jingtuo, China). Two different types of nozzles were used; the 23-G nozzle was cylindrical with a 13-mm cylinder length and an ID of 0.34 mm, and the 32-G nozzle was cylindrical with a 13-mm cylinder length and an ID of 0.11 mm. The distance between the tip of the nozzle and the platform was set as the nozzle diameter’s value to exclude its effect and produce continuous fibers[3].
The study conducted two sets of orthogonal experiments to determine the most suitable zone for well-defined printing lines. In these tests, the extrudate temperature, pressure, and velocity were varied separately.
To validate the physical model and to determine the coefficients, additional fiber extrusion experiments were conducted to investigate the effects of temperature, extrusion pressure, and nozzle velocity on the linewidth. Identical conditions were used except for the primary variable under investigation.
The observed results were used to determine the parameters for guiding the printing with a fixed linewidth step. The values at which the extrudate temperature, pressure, and velocity were set were calculated from the established physical model to acquire lines with a 50-mm linewidth step, respectively.
2.6. Cell culture and bioink preparation
According to the authors’ previous research, sodium alginate–gelatin composite hydrogels are suitable for the in vitro fabrication of corneal substitutes[37-39]; this finding has received increasing attention over recent years. To test the effect of the printing process on cell viability, the cell-laden scaffold printing experiment used human keratocyte (HK) (ScienCell, CA, USA) cells. Cells were cultured in T25 flasks with Dulbecco’s modified Eagle’s medium/F12 (Life Technologies, USA) supplemented with 10% fetal bovine serum (Fisher Scientific, USA) and 1% penicillin-streptomycin (Life Technologies, USA) under a 5% CO2 concentration. The culture media were replaced daily. The HKs were detached using Trypsin-EDTA (0.25%, Life Technologies, USA) and were centrifuged at 1,000 r/min for collection at a cell density of ca. 1.5 × 10⁷ cells/mL.
The cells were suspended in growth media (ca. 1.5 × 10⁷ cells/mL), centrifuged, and gently mixed into the sodium alginate–gelatin composite hydrogel at 37°C before being drawn into a sterilized commercial 30-cc syringe. The typical final concentrations of each component were as follows: 2% sodium alginate, 10% gelatin, and ca. 3 × 10⁶ cells/mL.
2.7. Cell-laden scaffolds printing
For higher cell viability, the 23-G nozzle was used in the printing of cell-laden scaffolds[23]. The pressure and velocity were set to 130 kPa and 7 mm/s, respectively. To investigate the effect of temperature on cell viability, the extrudate temperature was regulated to 24°C, 27°C, and 30°C, respectively.
2.8. Cell viability assay
A Live/Dead cell viability/cytotoxicity assay kit (Thermo, USA) was used to determine cells’ viability before and after printing. The assay solution was prepared by mixing 1-mL/mL Cal-AM and 2-mL/mL propidium iodide in PBS. Then, the mixture was added to the samples and was incubated (Thermo, USA) at 37°C for 20 min. After three 3-min washes with PBS, the samples were evaluated using fluorescence microscopy (Leica, Germany). For each sample, three fluorescent images were obtained from different areas. Live cells were shown in green, while dead cells were shown in red. The number of live and dead cells was counted using ImageJ (NIH, USA) software under the same thresholds. Cell viability was calculated as the number of living cells divided by the total number of cells.
2.9. Statistical analysis
The linewidth data were expressed as mean ± standard deviation. The inter-group variations were analyzed via a one-way ANOVA test in conjunction with Tukey’s test using SPSS (IBM, USA) software.
3. Results and discussion
3.1. Rheological measurements
The rheological properties of the sodium alginate–gelatin composite hydrogel (Figure 2) were measured in a temperature sweep test, in which the temperature was reduced from 40°C to 10°C. As the temperature decreased, the viscosity of the hydrogel increased, and the material’s state was transformed from a liquid to a gel. A sol–gel transition was observed, during which the loss modulus of the hydrogel approached the storage modulus (Figure 2A)[24]. At temperatures between 20°C and 30°C, there was a noticeable change in viscosity (Figure 2B).
Figure 2.

Rheological properties of the hydrogel. (A) Dynamic properties of 2% sodium alginate and 10% gelatin composite hydrogel. (B) Viscosity versus temperature characteristic of the hydrogel. (C) k, n value of the hydrogel.
Achieving excellent printability with a bioink is possible only within a specific range of viscosity. The temperature range for a hydrogel with good printability lies in the phase transition zone, in which the viscosity of the bioink is sensitive to changes in temperature[24,27]. Usually, composite hydrogels are regarded as non-Newtonian fluids with viscoelastic properties and are often modeled using the power-law equation. The relationship between viscosity, shear stress, and shear rate can be described as follows:

where μ is the apparent viscosity, τ is the shear stress, k is the flow consistency index, n is the flow behavior index, and γ is the shear rate. The parameters k and n are temperature sensitive and are determined from the experimental data shown in Figure 2B using the interpolation method. The results after interpolation are presented in Figure 2C. There is a sudden change in the values of k and n between 20°C and 30°C, which is in the sol–gel transition region. Following the transition, the values of k and n exhibit a smooth change. The curve’s fluctuation could be attributed to the unsteady sol–gel transition state and experimental error.
3.2. Thermal analysis
As illustrated in Figure 2, the material’s viscosity is affected significantly by the material’s temperature, which is a factor that is closely related to the printing process. Figure 3A presents a schematic of a flowing hydrogel within a nozzle exposed to air, in which TC is the controlled nozzle temperature, TA is the AT, and TE is the extrudate temperature. The temperature at the nozzle inlet and the AT are assumed to be both constant and controllable. For a specific extrusion rate, the temperature of the bioink inside the nozzle can be considered an isothermal system. Assuming there is no temperature gradient in the direction of the nozzle radius, the temperature differential (∆T) along the nozzle length (∆L) can be described, as follows:
Figure 3.

Schematic of nozzle exposed in the air with flowing hydrogel. (A) The temperature distribution. (B) The stress on the microelement. (C) Printing process.

where ϕ is the heat flux, Di is the ID of the nozzle, Do is the outer diameter of the nozzle, λs is the heat conductivity of the stainless steel, λh is the heat conductivity of the composite hydrogel, ∆L is the length differential of the nozzle exposed to the air, and h is the film coefficient. After integrating Eq. (6) along the length of the nozzle, the temperature difference between the controlled nozzle temperature (TC) and the extrudate temperature (TE) can be calculated. The steady temperature of the extruded material can be calculated using Eq. (6) irrespective of whether the AT is higher or lower than the syringe temperature. When the situation changes, only the direction of the heat flow will change. The steady-state means that the extrudate temperature, TE, will always be between the temperatures of the syringe and the AT, that is, when the AT is lower than the syringe temperature, then Tc≥ TE≥ TA, while when the AT is higher than the syringe temperature, then TA≥ TN≥ TE.
Four sets of analyses were conducted using ANSYS software to explore the temperature change during printing using the thermal parameters given in Table 1. Figure 4 presents the simulation results.
Figure 4.

Results of the simulation. (A) The temperature distribution at 20 s in analysis for 32-G nozzle. (B) Transient change of the central material (n=9, P<0.0001, error=S.D.) (C) Steady change of the extrudate temperature versus the syringe temperature (n=9, P<0.0001, error=S.D.) (D) Steady change of the extrudate temperature versus the ambient temperature (E) Transient change of the extrudate temperature. established based on the proposed physical model.
The temperature of the composite hydrogel in the nozzle center increased from 21°C to 31°C and decreased from 21°C to 19°C gradually (Figure 4B). After more than 40 min of heating/cooling, the temperature reached a constant value; this phenomenon could be used as a criterion to determine whether a bioink is well heated or cooled. Because of the slight heat loss caused by the exposed nozzle, the hydrogel’s steady stage in the syringe was not affected significantly by the nozzle’s scaling. The results of one nozzle were plotted, and several sets of experiments verified the simulation results. There was a good agreement between the hydrogel’s measured temperature in the center of the syringe and the heating and cooling processes’ predicted temperature. This confirms that the thermal simulation is reasonably accurate.
The controlled syringe temperature was increased from 19°C to 31°C at a constant AT of 20°C (Figure 4C), and the temperature of the extrudate at the tip of the nozzle was measured. The film coefficient was determined (5 – 200 W/m2°C in the native flow) using the experimental temperatures of the extrudate. After fitting, the film coefficient was set to 50 W/m2°C. There was a good fit between the experimental and predicted temperatures, and it was found that the extrudate temperature rose as the controlled nozzle temperature increased. Because the large ID nozzle contained more materials that carried the syringe’s thermal energy, the temperature was less susceptible to the AT; consequently, the 23-G nozzle produced a steeper slope.
The model was used to explore the influence of the AT on the steady temperature of the hydrogel extrudate (Figure 4D), and the simulation results confirmed that the AT had a significant effect on the extrudate’s temperature. The influence of the AT on the extrudate’s temperature was opposite to that of the syringe temperature. It was confirmed that the smaller (32-G) nozzle containing fewer materials was more vulnerable to the AT.
During the printing process, the flow of materials inside the nozzle was affected by the AT. To explore the transient change of the material’s temperature, the AT was set to 19°C, 27°C, and 32°C, respectively (Figure 4E). The simulation revealed that the extrudate’s temperature responses were relatively fast for both nozzles, reaching a steady-state within 10 s. A smaller ID corresponded to faster response in the simulation; furthermore, it demonstrated that a smaller nozzle was more vulnerable to the AT.
The experimental results are briefly summarized as follows: (a) The central material’s temperature inside the syringe changed slowly and reached a constant temperature after more than 40 min of heating/cooling, (b) Nozzles with larger IDs were less susceptible to the AT and more vulnerable to the controlled syringe temperature, and (c) there was a rapid change in extrudate temperature of under 10 s, which must be considered in the printing process.
3.3. Influence of multiple factors on printability
Often, a primary indicator of printability is the linewidth[31,40], which affects the porosity[41], cell viability, and uniformity of the printed outcome[40,42,43]. This section explores the influence of temperature, pressure, and velocity on printability (as represented by linewidth). Both the power-law model and the die-swell phenomenon were considered before establishing a physical model for the a priori prediction of the linewidth.
Figure 3C shows there are three stages in the printing process. In the first, the bioink flows inside the nozzle with a viscoelastic fluid behavior. In the second, the bioink is extruded from the nozzle and swells due to shear stress’s disappearance[44-48]. Here, the die-swell phenomenon causes a faster volume flow rate than in the first stage. In stage three, the extruded bioink accumulates on the receiving plate. The difference between the moving velocity of the nozzle and the extrusion velocity contributes to a secondary swell[31,43,49].
Figure 3B presents the first stage, in which the nozzle radius is R, and the length is L. The pressure drop across the nozzle is ∆P and the volume flow rate through the nozzle is Q. To simplify the calculation, the following assumptions are made based on past literature[31,33,43,47]: (a) The flow is isothermal and incompressible, (b) the length of the nozzle is adequate, (c) inertial effects in the flow are ignored, and (d) gravity, surface tension, and other body forces are also ignored.
The force equilibrium can be expressed as follows:

where P is the pressure, r is the radius, and τ is the shear stress. The left-hand side of Eq. (7) represents the pressure difference along the y axis, and the right-hand side shows the distribution of the shear stress along the r axis. After the integration concerning r and scale dP/dy with ∆P/L, Eq. (9) is derived:

where τw is the wall shear stress, which is defined as τw=R∆P/2L[49]. The shear rate, γ, can be defined as γ=du/dr, where u(r) is the velocity. After substituting Eq. (9) into Eq. (2), the power-law formula can be rewritten as follows:

After integrating Eq. (10) with respect to r, the function concerning the velocity and volume flow rate can be described in Eqs. (11) and (12):

In the previous literature, Eq. (12) was regarded as the usual model for predicting the printability of bioinks[31-33]. During the second stage of the printing process, the extrudate’s diameter emerging from the nozzle swells due to the release of the shear stress. The relationship between the diameter before and after extrusion can be expressed as Eq. (13)[44,46,49,50], below:

where DE is the extrudate diameter, d is the ID, and c is the fitted shear coefficient. The radius of the extrudate, RE, can be expressed as:

After substituting Eq. (14) into Eq. (12), the volume flow rate of the bioink during the third stage can be written as:
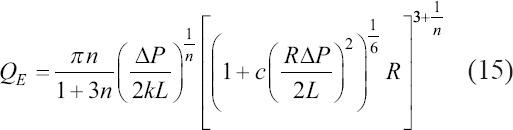
During the third stage, the bioink is deposited on the substrate. Considering the moving velocity of the nozzle, v, and assuming that the cross section of the printed line is a part of a circle, which is determined by the contact angle, the linewidth can be expressed as Eq. (16):

where b is the fitted shape coefficient influenced by the distance between the nozzle tip and the substrate and by the contact angle between the material and the slide (θ). Thus, the relationship between the printed hydrogel linewidth (Dp), pressure (∆P), moving velocity of the nozzle (v), and extrudate temperature (TE), which affects the flow consistency index (k) and the flow behavior index (n), can be described by Eq. (16).
Experimental verification was conducted on the proposed physical model (Figure 5), and Table 2 lists the printing conditions. The minimum change step is shown in brackets, for example, there is a change in nozzle temperature from 25°C to 29°C in increments of 1°C.
Figure 5.

(A) Overall phase diagram of the printed filament using 32-G nozzle. (B) A typical two-dimensional phase diagram showing the influence of the velocity and the temperature on the linewidth. (C) Overall phase diagram of the printed filament using 23-G nozzle. (D) A typical two-dimensional phase diagram showing the influence of the pressure and the temperature on the linewidth (n=9, P<0.0001, error=S.D.).
Table 2.
Printing condition of each experiment
| Group | Ambient temperature (TA) (°C) | nozzle temperature (TC) (°C) | Pressure (kPa) | Velocity (mm/s) |
|---|---|---|---|---|
| 32-G 0.11 mm I.D. | 20 (constant) | 25 – 29 (1) | 100 – 800 (100) | 1 – 16 (3) |
| 23-G 0.34 mm I.D. | 20 (constant) | 25 – 29 (1) | 70 – 170 (20) | 1 – 16 (3) |
The plots of the overall phase diagrams of the printed filaments using the 32-G (ID=0.11 mm) and the 23-G (ID=0.34 mm) nozzles are shown in Figures 5A–D. The filaments were divided into four types. The first was a well-defined swollen filament with a linewidth greater than the nozzle diameter (denoted by the red dots), the second was an equivalent-diameter filament with a linewidth approximately similar to that of the nozzle diameter (green dots), and the third was a stretched filament with a linewidth narrower than the nozzle diameter (pink dots). The fourth type was an irregular filament with a standard deviation too large to be adapted (blue dots). For both nozzles, filaments’ formation was shown to be a synergistic consequence of various factors, including pressure, velocity, and extrudate temperature. Forming stretched filaments with the small-diameter nozzle are challenging, although swollen or irregular filaments can be produced easily; this could be due to the high shear stress and long duration on the rheological properties of the material[51]. Conversely, the low shear stress and rapid flow time during extrusion make it easier for the larger diameter nozzle to form filaments of equivalent diameter.
Figures 5B and C summarize two representative sub-phase diagrams. In Figure 5B, the pressure was set to 600 kPa. Lower velocity and higher temperature result in irregular filaments; therefore, filaments of equivalent diameters can be printed at a relatively high velocity and at an appropriate temperature. The velocity in Figure 5C was set to 12 mm/s. Under low pressure and low temperature, discontinuous filaments can be produced easily. Therefore, the selection of appropriate temperature and pressure ranges results in producing the desired equivalent-diameter filaments.
To verify the proposed model, several experiments were conducted to determine the coefficient in Eq. (16). The relationships between temperature, pressure, and linewidth are shown in Figure S1 (173.7KB, pdf) (Supplementary File). Figures 6A-D present the fitted shear and shape coefficients. For each printing result, well-defined filaments were formed, and nine samples were measured. In terms of the inaccuracies in the diameters’ measurement, the systematic errors in deriving the values of k and n and the error in regulating extrudate temperature could be the main reasons for the disparity between the experimental and predicted linewidths.
Figure 6.

Shape coefficients and shear coefficients. (A) Shear coefficient c for 32-G nozzle. (B) Shear coefficient c for 23-G nozzle. (C) Shape coefficient b for 32-G nozzle. (D) Shape coefficient b for 23-G nozzle.
Figure S1A (173.7KB, pdf) -E (173.7KB, pdf) shows the lines printed with the 32-G nozzle at the controlled syringe temperatures of 25°C, 26°C, 27°C, 28°C, and 29°C, in which the predicted values of the proposed and conventional models are plotted. To predict the linewidth with consideration of the temperature change during extrusion, the predicted temperature of the extrudate was substituted into Eq. (16). The fitted shear coefficient, c, is shown in Figure 6A. The value of c was found to be almost linear with the temperature (R2 = 0.91). As shown in Figure 6C, the shape coefficient, b, which can be influenced by the nozzle tip–substrate distance and the contact angle of the material, was found to be linear with the temperature (R2 = 0.97).
The filaments printed at 25°C were discontinuous, which invalidated the results. Therefore, the linewidths of the fibers printed at the controlled syringe temperatures of 26°C, 27°C, 28°C, and 29°C using the 23-G nozzle are plotted in Figures S1F (173.7KB, pdf) -I (173.7KB, pdf) . An almost linear relationship was also found between the value of c and the temperature, which is presented in Figure 6(B) (R2 = 0.96). This was also the case for the relationship between the shape coefficient, b, and the temperature (R2 = 0.96), as shown in Figure 6D.
The differences in coefficients c and b for different nozzles could be attributed to the nozzle diameter. The contact angle could be affected when the experimental linewidth was widened by the collapse of more materials extruded by the larger nozzle. A negative correlation was found between the shear coefficient, c, and the temperature. This could be attributed to the high temperature decreasing the viscosity of the material, thereby weakening the die-swell phenomenon. The increase in temperature decreased the material-slide contact angle, which increased the shape coefficient, b.
In Figure S1 (173.7KB, pdf) , the linewidths, predicted using the conventional model (Eq. [12]) at the extrudate temperature, do not match the experimental results (R2 = 0); Chen et al. reported a similar conclusion[34]. However, when using k and n’s values at the predicted extrudate temperature and the proposed physical model, good agreement is found between the predicted and experimental linewidths (R2 > 0.8 for each experimental set). Those results reveal that the extrudate temperature predicted by the syringe temperature and the AT, rather than by the syringe temperature alone, was similar to the actual printing temperature. And the physical model considering the die-swell phenomenon could describe the extrusion process more exactly. This could explain the difference between the predicted and experimental results reported in Chen et al.’s study[34].
When comparing the linewidths predicted by the proposed and conventional models, a deviation between two lines is evident for the 32-G nozzle but not for the 23-G nozzle. This could be attributed to differences in shear stress and flow duration. A greater pressure is required to force materials through the smaller diameter nozzle, which increases the wall shear stress and causes the extrudate to swell. For the larger nozzle (23-G), the deviation is decreased by the fast flow rate and the low shear stress.
The influence of the AT between 15°C and 40°C (data not shown) was also investigated. The significant difference between the predicted and printed linewidths suggests that the AT could result in different contact angles and collapse of the printed line, and it was demonstrated that the contact angle influences the measured linewidth[32,52].
During the third stage of the extrusion process, the mismatch between the nozzle’s moving velocity and the extrusion velocity contributes to a secondary swell. For example, the printing condition was set to a pressure of 600 kPa for the 32-G nozzle and 130 kPa for the 23-G nozzle at a temperature of 27°C. The effect of nozzle velocity on linewidth is presented in Figures S1J (173.7KB, pdf) -K (173.7KB, pdf) . The faster the velocity, the thinner the linewidth. There was a gradual decline in the rate of change, as shown by Eq. (16). The derived shear coefficient, c, and the shape efficient, b, were substituted into the equation, and an approximation was found between the theoretical and experimental linewidths (R2 = 0.9807 and 0.9421, respectively, for the 32-G and 23-G nozzles).
The above discussion results can be summarized as follows: (a) The formation of filaments is a synergistic consequence of various factors, including pressure, velocity, and extrudate temperature. (b) The predicted extrudate temperature (TE), which was derived from the syringe temperature (TC) and the AT (TA), was close to the real extrudate temperature. (c) The modified model with consideration of the die-swell phenomenon was used to predict the printed linewidth. The results were superior to those of the ordinary model. (d) A reasonably accurate open-loop control could be established based on the proposed physical model.
3.4. Linewidth printing steps
The first step to printing 3D scaffolds is to use an appropriate linewidth, which can be achieved using the established physical model (Eq. [16]). The model describes the relationship between the extrudate’s temperature, pressure, moving velocity, and linewidth. A series of lines with a stepped linewidth were printed using this model. The shape coefficient (b) and shear coefficient (c) were derived from Figure 6, and the AT was set to 25°C.
A series of experiments was conducted to modify the physical model’s different parameters. Lines were printed using the 32-G and 23-G nozzles separately with a 50-mm linewidth step. Figures 7A and B show the fabricated lines, and a comparison between the printed and predicted linewidths is given in Figures 7C-H. The white dotted line denotes the outline of the printed lines.
Figure 7.

Linewidth gradient printing. (A) Lines printed using 32-G nozzle. (B) Lines printed using 23-G nozzle. (C-F) Comparison between the experimental linewidth and the predicted linewidth. (C) 32-G nozzle with variable extrudate temperature. (D) 32-G nozzle with variable pressure. (E) 32-G nozzle with variable velocity. (F) 23-G nozzle with variable temperature. (G) 23-G nozzle with variable pressure. (H) 23-G nozzle with variable velocity (n>9, P<0.0001, error=S.D.)
With the 32-G nozzle, the initial linewidth was set to be equal to its nozzle diameter of 110 mm. The printed lines were expected to have linewidths of 110, 160, 210, 260, and 310 mm. In the first set of experiments, the printing pressure and velocity were maintained at 200 kPa and 8 mm/s, respectively. The extrudate temperature was controlled to 26.1°C, 27.3°C, 28.1°C, 28.7°C, and 29.3°C separately by changing the nozzle temperature, the values of which were determined by the thermal model and the simulation (Section 3.2). Then, the AT of 25°C and the thermal parameters (as given in Table 1) were substituted. In the second set of experiments, the extrudate’s temperature and velocity were set to 28.1°C and 8 mm/s, respectively. The printing pressure was set to 100, 155, 200, 250, and 290 kPa. The moving velocity was changed in the third set of experiments to 64, 30, 17.4, 11.4, and 8 mm/s, while the temperature and pressure of the extrudate were set separately to 29.3°C and 200 kPa. A comparison between the printed and predicted linewidths is given in Figures 7C-E. The R2 values of these figures are 0.9744, 0.9757, and 0.9833, respectively (P<0.001).
In addition, the 23-G nozzle was used to verify the physical model and to print lines with a linewidth step. With a nozzle diameter of 340 μm, the linewidth gradient of the 23-G nozzle was 340, 390, 440, 490, and 540 μm. In the first set of experiments, the pressure and velocity were set at constants of 90 kPa and 8 mm/s, respectively. The extrudate’s theoretical temperature was calculated according to Eq. (16) and was realized by regulating the nozzle temperature based on both Eq. (6) and the thermal simulation. The extrudate temperature was regulated separately at 25°C, 25.5°C, 25.9°C, 26.3°C, and 26.7°C. Then, in the second set of experiments, the pressure was set sequentially at 68, 78, 90, 98, and 105 kPa. The temperature and velocity of the extrudate were maintained at 25.9°C and 8 mm/s. In addition, in the third set of experiments, the velocity (as a controlled variable) was set to 13.2, 10, 8, 6.4, and 5.2 mm/s, respectively. The temperature and pressure of the extrudate were maintained as constants at 25.9°C and 90 kPa. Figures 7F-H plot the results of the three sets of experiments, and the separate R-square values of these results are 0.9724, 0.9661, and 0.9693, (P<0.001).
Lines with controllable linewidths were printed during six sets of experiments with a linewidth step of about 50 mm. The remarkably high R2 values show that the applied parameters effectively fabricated lines with the expected linewidth. Compared with the lines printed by the 32-G nozzle, the lines printed by the 23-G nozzle (with a wider ID) were more difficult to control, which can be explained by Eq. (16). A larger diameter nozzle requires both lower pressure and velocity to print lines, thereby exacerbating the inherent error of the 3D bioprinter and increasing the difficulty in controlling the linewidth.
3.5. Cell-laden scaffold fabrication
In this study, printability was represented by the shape integrity and cell viability after printing. The rheological properties of the bioinks (in Section 3.1) and the physical models (in Section 3.3) provided the foundation for cell-laden bioprinting. The effect of pressure and nozzle type had been explored previously and had confirmed that higher shear stresses result in lower cell viability[23,27]. Therefore, the 23-G nozzle was adapted to investigate the influence of temperature on cell viability. Cell-laden scaffolds were fabricated at different temperatures using a bioink comprising sodium alginate–gelatin hydrogel and HKs with a cell density of 3 × 10⁶/mL.
Three grid patterns were printed using the cell-laden bioink; to optimize printability, the study used the 23-G nozzle, 130 kPa of pressure, and a velocity of 7 mm/s. The extrudate temperature was regulated separately at 24°C (Figures 8A-E), 27°C (Figures 8B-F), and 30°C (Figures 8C-G). The LIVE/DEAD cell viability assay revealed the cells’ viability after printing to be 89.21±4.09%, 91.83±2.05%, and 93.94±3.92%, as shown in Figure 8D.
Figure 8.

Cell-laden scaffolds: (A) Scaffolds printed in 24°C; (B) Scaffolds printed in 27°C; (C) Scaffolds printed in 30°C; (D) The viability of the cells printed in different temperature; (E) Live/dead staining images of scaffolds printed in 24°C; (F) LIVE/DEAD staining images of scaffolds printed in 27°C; (G) LIVE/DEAD staining images of scaffolds printed in 30°C (n=3, P>0.05, error=S.D.).
The printing results revealed that the cell viability was almost identical in each experimental setup, although the shape fidelity changed significantly according to temperature. Shape fidelity was compromised when printing with bioink at a temperature higher than the gelation point of the ink. The minor change in cell viability could be due to the different lengths of time the cells remained in the syringe[25].
The criterion for selecting appropriate printing parameters using soft materials was described in Eq. (16). It was confirmed by the result of the fluorescent live/dead staining that the optimized printing process had no significant negative impact on cell viability. Ouyang et al. reported a similar conclusion[27].
4. Conclusions
This study established a quantitative approach to evaluate a sodium alginate’s printability–gelatin composite hydrogel using linewidth as a criterion. A quantitative thermal model was presented to facilitate precise temperature control with consideration of the syringe temperature, AT, and dispensing material temperature. A physical model was established that described the relationship between the temperature-sensitive indices, dispensing pressure, velocity, and linewidth. Subsequently, it was used to guide the accurate printing of lines with a 50-mm linewidth step. The cell-laden printing test results verified that cell viability in the gelatin–alginate temperature zone was not violated significantly by the printing process. Based on the proposed physical model, an open-loop control can be established to improve printability and expand the potential application of extrusion-based bioprinting.
Acknowledgments
We would like to thank the support by National Key Research and Development Program of China (2018YFA0703000), Key Research and Development Projects of Zhejiang Province (Grant No. 2017C01054), National Natural Science Foundation of China (Grant No. 51875518, No.51821093), and the Fundamental Research Funds for the Central Universities (Grant No. 2019XZZX003-02, 2020QNA4001).
Conflict of interest
There are no conflicts of interest to declare.
Author contributions
L.Q.: Experimental conception and design, acquisition of data, analysis and interpretation of data, paper drafting and revising; Z.B.: Experimental conception and design, paper drafting, and revising; X.Q: Experimental conception and design; Z.C.X.: Experimental conception and design; L.Y.C.: Experimental conception and design; Z.H.Z.: Supervise the work, paper drafting and revising, and final approval of paper; M.L.: Supervise the work, financial support, paper drafting and revising, and final approval of paper; Y.H.Y.: Financial support, administrative support, and final approval of paper; B.D.P.: Experimental conception and design.
References
- 1.Donderwinkel I, Hest JC, Cameron NR. Bio-inks for 3D Bioprinting:Recent Advances and Future Prospects. Polym Chem. 2017;8:4451–71. https://doi.org/10.1039/c7py00826k. [Google Scholar]
- 2.Zhang B, Gao L, Ma L, et al. 3D Bioprinting:A Novel Avenue for Manufacturing Tissues and Organs. Engineering. 2019;5:777–94. https://doi.org/10.1016/j.eng.2019.03.009. [Google Scholar]
- 3.He Y, Yang F, Zhao H, et al. Research on the Printability of Hydrogels in 3D Bioprinting. Sci Rep. 2016;6:29977. doi: 10.1038/srep29977. [DOI] [PMC free article] [PubMed] [Google Scholar]
- 4.Michal S, Smadar C. Cardiac Tissue Engineering, Ex Vivo:Design Principles in Biomaterials and Bioreactors. Heart Fail Rev. 2003;8:271–6. doi: 10.1023/a:1024729919743. [DOI] [PubMed] [Google Scholar]
- 5.Campbell J, McGuinness I, Wirz H, et al. Multimaterial and Multiscale Three-Dimensional Bioprinter. J Nanotechnol Eng Med. 2015;6:021005. [Google Scholar]
- 6.Holländer J, Hakala R, Suominen J, et al. 3D Printed UV Light Cured Polydimethylsiloxane Devices for Drug Delivery. Int J Pharm. 2018;544:433–42. doi: 10.1016/j.ijpharm.2017.11.016. https://doi.org/10.1016/j.ijpharm.2017.11.016. [DOI] [PubMed] [Google Scholar]
- 7.Kang HW, Lee SJ, Ko IK, et al. A 3D Bioprinting System to Produce Human-Scale Tissue Constructs with Structural Integrity. Nat Biotechnol. 2016;34:312–9. doi: 10.1038/nbt.3413. https://doi.org/10.1038/nbt.3413. [DOI] [PubMed] [Google Scholar]
- 8.Liu W, Zhang YS, Heinrich MA, et al. Rapid Continuous Multimaterial Extrusion Bioprinting. Adv Mater. 2017;29:1604630. doi: 10.1002/adma.201604630. [DOI] [PMC free article] [PubMed] [Google Scholar]
- 9.McElheny C, Hayes D, Devireddy R. Design and Fabrication of a Low-Cost Three-Dimensional Bioprinter. J Med Device. 2017;11:041001. doi: 10.1115/1.4037259. https://doi.org/10.1115/1.4037259. [DOI] [PMC free article] [PubMed] [Google Scholar]
- 10.Wang L, Xu ME, Luo L, et al. Iterative Feedback Bio-Printing-Derived Cell-Laden Hydrogel Scaffolds with Optimal Geometrical Fidelity and Cellular Controllability. Sci Rep. 2018;8:2802. doi: 10.1038/s41598-018-21274-4. https://doi.org/10.1038/s41598-018-21274-4. [DOI] [PMC free article] [PubMed] [Google Scholar]
- 11.Ahn G, Park JH, Kang T, et al. Effect of Pore Architecture on Oxygen Diffusion in 3D Scaffolds for Tissue Engineering. J Biomech Eng. 2010;132:104506. doi: 10.1115/1.4002429. [DOI] [PubMed] [Google Scholar]
- 12.Ng WL, Chua CK, Shen YF. Print Me An Organ!Why We Are Not There Yet. Prog Polym Sci. 2019;97:101145. https://doi.org/10.1016/j.progpolymsci.2019.101145. [Google Scholar]
- 13.Nguyen DG, Funk J, Robbins JB, et al. Bioprinted 3D Primary Liver Tissues Allow Assessment of Organ-Level Response to Clinical Drug Induced Toxicity In Vitro. PLoS One. 2016;11:e0158674. doi: 10.1371/journal.pone.0158674. https://doi.org/10.1371/journal.pone.0158674. [DOI] [PMC free article] [PubMed] [Google Scholar]
- 14.Park SJ, Kim RY, Park BW, et al. Dual Stem Cell Therapy Synergistically Improves Cardiac Function And Vascular Regeneration Following Myocardial Infarction. Nat Commun. 2019;10:3123. doi: 10.1038/s41467-019-11091-2. https://doi.org/10.1038/s41467-019-11091-2. [DOI] [PMC free article] [PubMed] [Google Scholar]
- 15.Ma L, Li Y, Wu Y, et al. 3D Bioprinted Hyaluronic Acid-Based Cell-Laden Scaffold for Brain Microenvironment Simulation. Biodes Manuf. 2020;3:164–74. https://doi.org/10.1007/s42242-020-00076-6. [Google Scholar]
- 16.Lee V, Singh G, Trasattijohn P, et al. Design and Fabrication of Human Skin by Three-Dimensional Bioprinting. Tissue Eng Part C Methods. 2014;20:473–84. doi: 10.1089/ten.tec.2013.0335. [DOI] [PMC free article] [PubMed] [Google Scholar]
- 17.Peng W, Unutmaz D, Ozbolat IT. Bioprinting Towards Physiologically Relevant Tissue Models for Pharmaceutics. Trends Biotechnol. 2016;34:722–32. doi: 10.1016/j.tibtech.2016.05.013. https://doi.org/10.1016/j.tibtech.2016.05.013. [DOI] [PubMed] [Google Scholar]
- 18.Zhang B, Luo Y, Ma L, et al. 3D Bioprinting:An Emerging Technology Full of Opportunities and Challenges. Biodes Manuf. 2018;1:2–13. [Google Scholar]
- 19.Gudapati H, Dey M, Ozbolat I. A Comprehensive Review on Droplet-Based Bioprinting:Past, Present and Future. Biomaterials. 2016;102:20–42. doi: 10.1016/j.biomaterials.2016.06.012. https://doi.org/10.1016/j.biomaterials.2016.06.012. [DOI] [PubMed] [Google Scholar]
- 20.Ying G, Jiang N, Yu C, et al. Three-Dimensional Bioprinting of Gelatin Methacryloyl (GelMA) Biodes Manuf. 2018;1:215–24. https://doi.org/10.1007/s42242-018-0028-8. [Google Scholar]
- 21.Ma L, Li Y, Wu Y, et al. The Construction of In Vitro Tumor Models Based on 3D Bioprinting. Biodes Manuf. 2020;3:227–36. [Google Scholar]
- 22.Alruwaili M, Lopez JA, McCarthy K, et al. Liquid-phase 3D Bioprinting of Gelatin Alginate Hydrogels:Influence of Printing Parameters on Hydrogel Line Width and Layer Height. Biodes Manuf. 2019;2:172–80. https://doi.org/10.1007/s42242-019-00043-w. [Google Scholar]
- 23.Chang R, Nam J, Sun W. Effects of Dispensing Pressure and Nozzle Diameter on Cell Survival from Solid Freeform Fabrication-Based Direct Cell Writing. Tissue Eng Part A. 2008;14:41–8. doi: 10.1089/ten.a.2007.0004. https://doi.org/10.1089/ten.2007.0004. [DOI] [PubMed] [Google Scholar]
- 24.Gao T, Gillispie GJ, Copus JS, et al. Optimization of Gelatin-Alginate Composite Bioink Printability Using Rheological Parameters:A Systematic Approach. Biofabrication. 2018;10:034106. doi: 10.1088/1758-5090/aacdc7. https://doi.org/10.1088/1758-5090/aacdc7. [DOI] [PMC free article] [PubMed] [Google Scholar]
- 25.Zhao Y, Li Y, Mao S, et al. The Influence of Printing Parameters on Cell Survival Rate and Printability in Microextrusion-Based 3D Cell Printing Technology. Biofabrication. 2015;7:045002. doi: 10.1088/1758-5090/7/4/045002. https://doi.org/10.1088/1758-5090/7/4/045002. [DOI] [PubMed] [Google Scholar]
- 26.Gong Y, Bi Z, Bian X, et al. Study on Linear Bio-Structure Print Process Based on Alginate Bio-Ink in 3D Bio-Fabrication. Biodes Manuf. 2020;3:109–21. https://doi.org/10.1007/s42242-020-00065-9. [Google Scholar]
- 27.Ouyang L, Yao R, Zhao Y, et al. Effect of Bioink Properties on Printability and Cell Viability for 3D Bioplotting of Embryonic Stem Cells. Biofabrication. 2016;8:035020. doi: 10.1088/1758-5090/8/3/035020. https://doi.org/10.1088/1758-5090/8/3/035020. [DOI] [PubMed] [Google Scholar]
- 28.Kolan KC, Semon JA, Bromet B, et al. Bioprinting with Human Stem Cell-Laden Alginate-Gelatin Bioink and Bioactive Glass for Tissue Engineering. Int J Bioprint. 2019;5:204. doi: 10.18063/ijb.v5i2.2.204. https://doi.org/10.18063/ijb.v5i2.2.204. [DOI] [PMC free article] [PubMed] [Google Scholar]
- 29.Zhang Z, Jin Y, Yin J, et al. Evaluation of Bioink Printability for Bioprinting Applications. Appl Phys Rev. 2018;5:041304. [Google Scholar]
- 30.Yin J, Zhao D, Liu J. Trends on Physical Understanding of Bioink Printability. Biodes Manuf. 2019;2:50–4. [Google Scholar]
- 31.Suntornnond R, Tan EY, An J, et al. A Mathematical Model on the Resolution of Extrusion Bioprinting for the Development of New Bioinks. Materials (Basel) 2016;9:756. doi: 10.3390/ma9090756. https://doi.org/10.3390/ma9090756. [DOI] [PMC free article] [PubMed] [Google Scholar]
- 32.Lee JM, Yeong WY. A Preliminary Model of Time-Pressure Dispensing System for Bioprinting Based on Printing and Material Parameters. Virtual Phys Prototyp. 2014;10:3–8. https://doi.org/10.1080/17452759.2014.979557. [Google Scholar]
- 33.Paxton N, Smolan W, Bock T, et al. Proposal to Assess Printability of Bioinks for Extrusion-Based Bioprinting and Evaluation of Rheological Properties Governing Bioprintability. Biofabrication. 2017;9:044107. doi: 10.1088/1758-5090/aa8dd8. https://doi.org/10.1088/1758-5090/aa8dd8. [DOI] [PubMed] [Google Scholar]
- 34.Chen X, Li M, Ke H. Modeling of the Flow Rate in the Dispensing-Based Process for Fabricating Tissue Scaffolds. J Manuf Sci Eng. 2008;130:021003. https://doi.org/10.1115/1.2789725. [Google Scholar]
- 35.Billiet T, Gevaert E, de Schryver T, et al. The 3D Printing of Gelatin Methacrylamide Cell-Laden Tissue-Engineered Constructs with High Cell Viability. Biomaterials. 2014;35:49–62. doi: 10.1016/j.biomaterials.2013.09.078. https://doi.org/10.1016/j.biomaterials.2013.09.078. [DOI] [PubMed] [Google Scholar]
- 36.Mahmoudi Y. Effect of Thermal Radiation on Temperature Differential in a Porous Medium Under Local Thermal Non-Equilibrium Condition. Int J Heat Mass Transf. 2014;76:105–21. https://doi.org/10.1016/j.ijheatmasstransfer.2014.04.024. [Google Scholar]
- 37.Zhang B, Xue Q, Hu HY, et al. Integrated 3D Bioprinting-Based Geometry-Control Strategy for Fabricating Corneal Substitutes. J Zhejiang Univ Sci B. 2019;20:945–59. doi: 10.1631/jzus.B1900190. https://doi.org/10.1631/jzus.b1900190. [DOI] [PMC free article] [PubMed] [Google Scholar]
- 38.Isaacson A, Swioklo S, Connon CJ. 3D Bioprinting of a Corneal Stroma Equivalent. Exp Eye Res. 2018;173:188–93. doi: 10.1016/j.exer.2018.05.010. https://doi.org/10.1016/j.exer.2018.05.010. [DOI] [PMC free article] [PubMed] [Google Scholar]
- 39.Kong B, Chen Y, Liu R, et al. Fiber Reinforced GelMA Hydrogel to Induce the Regeneration of Corneal Stroma. Nat Commun. 2020;11:1435. doi: 10.1038/s41467-020-14887-9. [DOI] [PMC free article] [PubMed] [Google Scholar]
- 40.Zhang B, Gao L, Gu L, et al. High-resolution 3D Bioprinting System for Fabricating Cell-laden Hydrogel Scaffolds with High Cellular Activities. Proc CIRP. 2017;65:219–24. https://doi.org/10.1016/j.procir.2017.04.017. [Google Scholar]
- 41.Shao L, Gao Q, Xie C, et al. Sacrificial Microgel-Laden Bioink-Enabled 3D Bioprinting of Mesoscale Pore Networks. Biodes Manuf. 2020;3:30–9. https://doi.org/10.1007/s42242-020-00062-y. [Google Scholar]
- 42.Gong Y, Wang F, Al-Furjan MS, et al. Experimental Investigation and Optimal 3D Bioprinting Parameters of SA-Gel Porous Cartilage Scaffold. Appl Sci. 2020;10:768. https://doi.org/10.3390/app10030768. [Google Scholar]
- 43.Khalil S, Sun W. Biopolymer Deposition for Freeform Fabrication of Hydrogel Tissue Constructs. Mater Sci Eng C. 2007;27:469–78. https://doi.org/10.1016/j.msec.2006.05.023. [Google Scholar]
- 44.Tanner RI. A Theory of Die-Swell Revisited. J Nonnewton Fluid Mech. 2005;129:85–7. [Google Scholar]
- 45.Tanner RI. A Theory of Die-Swell. J Polym Sci Part A-2 Polym Phys. 1970;8:2067–78. [Google Scholar]
- 46.Carreau PJ, Choplin L, Clermont JR. Exit Pressure Effects in Capillary Die Data. Polym Eng Sci. 1985;25:669–76. https://doi.org/10.1002/pen.760251105. [Google Scholar]
- 47.Iwami K, Noda T, Ishida K, et al. Bio Rapid Prototyping by Extruding/Aspirating/Refilling Thermoreversible Hydrogel. Biofabrication. 2010;2:014108. doi: 10.1088/1758-5082/2/1/014108. https://doi.org/10.1088/1758-5082/2/1/014108. [DOI] [PubMed] [Google Scholar]
- 48.Liang JZ. Effects of Extrusion Conditions on Die-Swell Behavior of Polypropylene/Diatomite Composite Melts. Polym Test. 2008;27:936–40. https://doi.org/10.1016/j.polymertesting.2008.08.001. [Google Scholar]
- 49.Chin WC. Strategy and Planning. Waltham: Gulf Professional Publishing; 2012. Managed Pressure Drilling:Modeling; pp. 315–85. [Google Scholar]
- 50.Allain C, Cloitre M, Perrot P. Experimental Investigation and Scaling Law Analysis of Die Swell in Semi-Dilute Polymer Solutions. J Nonnewton Fluid Mech. 1997;73:51–66. https://doi.org/10.1016/s0377-0257(97)00051-7. [Google Scholar]
- 51.Cooke ME, Rosenzweig DH. The Rheology of Direct and Suspended Extrusion Bioprinting. APL Bioeng. 2021;5:011502. doi: 10.1063/5.0031475. https://doi.org/10.1063/5.0031475. [DOI] [PMC free article] [PubMed] [Google Scholar]
- 52.Quéré D, Azzopardi MJ, Delattre L. Drops at Rest on a Tilted Plane. Langmuir. 1998;14:2213–6. [Google Scholar]